Partha
Kumbhakar‡§
a,
Indrani
Das Jana‡
b,
Subhadip
Basu‡
c,
Sandip
Mandal
c,
Saptarshi
Banerjee
b,
Subhanita
Roy
b,
Chinmayee Chowde
Gowda
d,
Anyesha
Chakraborty
d,
Ashim
Pramanik
ae,
Pooja
Lahiri
f,
Basudev
Lahiri
g,
Amreesh
Chandra
h,
Pathik
Kumbhakar
e,
Arindam
Mondal
*b,
Prabal K
Maiti
*c and
Chandra Sekhar
Tiwary
*a
aDepartment of Metallurgical and Materials Engineering, Indian Institute of Technology Kharagpur, Kharagpur 721302, India. E-mail: chandra.tiwary@metal.iitkgp.ac.in
bSchool of Bioscience, Indian Institute of Technology Kharagpur, Kharagpur 721302, India. E-mail: arin.cal@gmail.com
cCentre for Condensed Matter Theory, Department of Physics, Indian Institute of Science, Bangalore 560012, India. E-mail: maiti@iisc.ac.in
dSchool of Nano Science and Technology, Indian Institute of Technology Kharagpur, Kharagpur 721302, India
eNanoscience Laboratory, Department of Physics, National Institute of Technology Durgapur, 713209, India
fSchool of Medical Science and Technology, Indian Institute of Technology Kharagpur, Kharagpur 721302, India
gDepartment of Electronics and Electrical Communication Engineering, Indian Institute of Technology Kharagpur, Kharagpur 721302, India
hDepartment of Physics, Indian Institute of Technology Kharagpur, Kharagpur 721302, India
First published on 26th May 2023
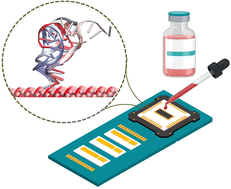
The efficient monitoring and early detection of viruses may provide essential information about diseases. In this work, we have highlighted the interaction between DNA and a two-dimensional (2D) metal oxide for developing biosensors for further detection of viral infections. Spectroscopic measurements have been used to probe the efficient interactions between single-stranded DNA (ssDNA) and the 2D metal oxide and make them ideal candidates for detecting viral infections. We have also used fully atomistic molecular dynamics (MD) simulation to give a microscopic understanding of the experimentally observed ssDNA-metal oxide interaction. The adsorption of ssDNA on the inorganic surface was found to be driven by favourable enthalpy change, and 5′-guanine was identified as the interacting nucleotide base. Additionally, the in silico assessment of the conformational changes of the ssDNA chain during the adsorption process was also performed in a quantitative manner. Finally, we comment on the practical implications of these developments for sensing that could help design advanced systems for preventing virus-related pandemics.
A number of nucleic acid-based biosensors have been reported to-date with wide scalability of detecting pathogen-associated nucleic acids for rapid, point-of-care (POC) diagnosis of infectious diseases.5–8 These nucleic acid-based biosensors provide a highly sensitive and selective platform for detecting target nucleic acids (RNA/DNA) at material surfaces. The material surfaces are functionalized with complementary single-stranded oligonucleotides. A variety of DNA-decorated metal-based biosensors have been reported so far with a wide range of applications, including lateral-flow biosensors for POC nucleic acid tests, DNA microarrays, and silicon nanowire (Si NW)-based sensors for the detection of dengue virus serotype 2 (DENV 2) as well as influenza A virus (IAV) RNA. Similarly, a functionalized poly-crystalline Si NW field-effect transistor (FET)-based sensor for the detection of the highly pathogenic IAV virus (H5 and H7) strain has also been reported. Peptide nucleic acid (PNA)–DNA probes have been used for the detection of virus- and other pathogenic bacteria-mediated infections, further highlighting the applications of these DNA-based metal biosensors.6,9–13 ssDNA immobilized on capacitive field effect sensors modified with a polyelectrolyte layer (PAH) can be effectively used to capture target cDNA molecules.14 Cherstvy et al. calculated the electrostatic interactions possibly taking place upon DNA hybridization in dense DNA arrays immobilized on a layer of Au nanoparticles deposited on the surface of a field effect-based DNA capacitive biosensor.15 Recently, a 2D Au nanoisland functionalised with cDNA, in combination with the plasmonic photothermal effect and localized surface plasmon resonance (LSPR) sensing technique, was used for detecting SARS CoV-2 in clinical COVID-19 samples with a limit of up to 0.22 pM concentration.16
While covalent modification of DNA has been a popular method to achieve highly stable and directional linkage in most DNA-based biosensors, physio-sorption is also considered a cost-effective and straightforward alternative. In recent times, DNA-based biosensors have been improvised extensively to expand their range of applications in molecular diagnostics. In this regard, interfacing two-dimensional (2D) metal oxides with DNA has yielded numerous new hybrids with enhanced efficiency for biosensing.17–21 2D oxides like graphene oxide (GO), MXenes, MoS2 and WS2 exhibit interesting surface properties like high surface charge, good conductivity and excellent ease of functionalization. They can easily adsorb any charged molecules or metal ions and are usually coated with inorganic materials such as nitrogen, sulphur, oxygen, etc., which enhances the charge or electron transfer between nanomaterials and biomolecules.22–26 Together, these properties make 2D materials excellent candidates for various biosensing devices. Furthermore, these materials are eligible to passively adsorb biomolecules and participate in active chemical interaction with the same. The functionalized graphene can easily detect several biomolecules like DNA, enzymes, proteins, antigens, and antibodies owing to its own oxide components like the epoxide, hydroxyl, and carboxyl groups formed on its edge on the surface.27 It has been reported earlier that GO mainly adsorbs DNA molecules by π–π stacking and hydrogen bonding with the same.28 On the contrary, MoS2 and WS2 mostly rely on van der Waals interactions to initiate their DNA attachment.29–32 Recently, amino-modified DNA attached to polyacrylic acid-modified Ti3C2 MXene has rendered a biosensor that is utilized to detect cancer biomarkers.33 Among other 2D metal-oxides, Mn3O4 exhibiting catalytic properties has been reported recently.34
Encouraged by the extraordinary properties of random physiosorption of DNA by various 2D materials, we intended to design an ssDNA bound-2D Mn3O4 as an optical biosensor. However, the DNA binding properties of 2D materials and the fundamental mechanism behind the same are yet to be investigated. Here we study the surface chemistry of Mn3O4 and the DNA adsorption properties of 2D Mn3O4 to explore the possibilities of its functionalization as a biosensor (Fig. 1). In this context, we systematically studied the adsorption of DNA oligonucleotides on 2D Mn3O4 by UV visible absorption and photoluminescence (PL) spectroscopic measurements. The functionalized Mn3O4 supports the immobilization of DNA probes in a biocompatible manner. The PL emission and FTIR data revealed the unique role of Mn2+/Mn3+ and highlights its interaction with DNA adsorption. The atomistic calculations confirm the experimental observations. Finally, we utilized the ssDNA-immobilized 2D Mn3O4 for specific capturing of complementary RNA and fused it with reverse transcription loop-mediated isothermal amplification (RT-LAMP) for colorimetric endpoint detection, presenting the proof of concept for a novel, 2D Mn3O4-based biosensor for specific detection of nucleic acids. This technology could pave the way for the development of a rapid, cost effective and highly sensitive diagnostic biosensor that can be utilized in future to detect not only Covid 19 but also a plethora of infections caused by a wide variety of pathogens.
ID | DNA oligonucleotides | 5′–3′ Sequences |
---|---|---|
01 | ss DNA | GCAGCCGCTCCACCAAGCCAAAGTAGAACGCAGT |
02 | ss DNA-FAM_2 | FAM-GATTAGTTCCTGGTCCCCAAAATTTCC |
Hausmannite nanoparticles were synthesized by a co-precipitation method. 0.22 M of manganese chloride tetrahydrate (MnCl2·4H2O) and 1.37 mM hexadecyl trimethyl-ammonium bromide (CTAB) were added under constant stirring. 0.44 M of sodium hydroxide (NaOH) solution was prepared separately, added dropwise to the first solution, and constantly stirred for 24 h. The final product was filtered and washed with DI water and then ethanol 3–4 times. The material was then dried in an oven at 80 °C overnight. The large-scale synthesis of 2D Mn3O4 was obtained by the liquid phase exfoliation (LPE) technique using a probe sonication method. To break the covalent bonds between layers, the surface energy of the solvent becomes crucial during exfoliation. With iso-propanol as a solvent, powdered hausmannite obtained by co-precipitation was exfoliated in this medium. The concentration of the sample to solvent ratio was of the order 1:500 mg mL−1. The probe-sonicator frequency was at 30 KHz and exfoliation was done in pulses of 10 s each, for 2 hours. The sample suspension was extracted and dried at 40 °C to obtain the powdered sample.
The optical absorbance properties of pristine hausmannitene was characterized using a UV-vis spectrometer (HITACHI, U3010) from 200–800 nm. We then used transmission electron microscopy (TEM) to analyze the sample further. A TEM FEI-TECHNAI G220S-Twin was utilized to obtain high-resolution TEM micrographs. Atomic force microscopy (AFM) was performed using an Agilent Technologies Model No. 5500. The drop deposition technique was used for the sample deposition on a monocrystalline silicon substrate.
2D Mn3O4 particles stabilized by ssDNA were prepared by adding 500 nM of ssDNA (Table 1) to 200 μL of an aqueous Mn3O4 solution (0.3 mg mL−1). The sample was incubated at room temperature (RT) with continuous stirring for 30 min, and centrifuged to remove any excess of unbound ssDNA from the supernatant. The pellet was then re-suspended in a similar volume of Milli-Q water. The absorbance spectra of the ssDNA bound to the 2D Mn3O4 nanoparticles were acquired by using a spectrophotometer (HITACHI, U3010). For the DNA adsorption capacity study, 2D Mn3O4 particles (0.3 mg mL−1) were dispersed in water by sonication for 30 s followed by adding different concentrations of ssDNA ranging from 10 nM to 2 μM. The DNA adsorption capacity was measured by acquiring the spectral reading at 30 min by using a spectrophotometer (Epoch 2 microplate reader) within the 200–500 nm wavelength. Time kinetics for the DNA adsorption study was further performed wherein kinetic and spectral analyses were carried out at RT for different time intervals. The ssDNA (0.5 μM) adsorbed on aqueous 2D Mn3O4 (0.3 mg mL−1) solution was drop cast on a UV sterilized glass slide and allowed to vacuum dry completely in a desiccator. The samples were then preceded for FTIR analysis. Furthermore, the sample was used for AFM analysis wherein a droplet of the same was spotted onto a silica substrate and vacuum dried completely. The image of the ssDNA fragment adsorbed on the 2D Mn3O4 particle was taken in the air using an Agilent Technologies Model No. 5500. For optical imaging, the 2D Mn3O4 were sonicated for 30 s in a bath sonicator at RT, and vortexed for 30 s prior to use. 10 μM of FAM-ssDNA (Table 1) was added to 200 μL of an aqueous solution of Mn3O4. The resulting mixture was then stirred at RT for 30 min and the sample was drop cast on a clean UV sterilized glass slide and proceeded for optical imaging using a fluorescence microscope (Leica Microsystems). The images were taken under 10× and 45× resolution.
A Mn3O4 slab with dimensions of 4.76 × 5.13 × 1.6 nm3 was built and placed inside a simulation box of 4.76 × 5.13 × 6.0 nm3. In harmony with the experimental findings, the ssDNA segment was placed on the (001) facet of the slab in such a manner that the initial distance between the center of mass (COM) of the ssDNA and the surface was 1.3 nm. The combined system of the ssDNA and Mn3O4 slab was solvated with the TIP3P water model. Counter ions were added to neutralize the system. A total of 3829 water molecules with 11 Na+ ions were added and the system contains a total of 15311 atoms. Periodic boundary conditions were applied in all three dimensions. The system was first energy minimized for 100000 steps using the steepest descent algorithm to remove close contacts between atoms. The minimized system was equilibrated at 300 K for 1 ns, using a modified Berendsen thermostat42 with a coupling constant of 0.1 ps. A second phase of equilibration was carried out for 2 ns at a 1 bar pressure, using the Berendsen barostat43 with a coupling constant of 20.0 ps. The equilibrated system was then subjected to a production NPT run for 300 ns.
A Parrinello–Rahman barostat with a coupling constant of 20.0 ps was employed for pressure coupling, during the production run.44 The integration time step was 1 fs during both equilibration and production runs, and the trajectory was recorded every 2.5 ps interval for subsequent analysis. The Mn3O4 slab was kept restrained throughout the simulation. Position restraints were applied on the ssDNA during the equilibration phase only. The average cross-sectional area of the simulation box remained stable during the production run (26.71 ± 0.02 nm2; also see Fig. S9 of ESI†). The LINCS algorithm was used to constraint all bonds involving hydrogen atoms.45 The particle mesh Ewald (PME) summation technique was used to calculate the long-range coulombic interaction.46 A cut-off distance of 1.0 nm was used for computing the short-range L-J interactions and short range part of the coulomb interactions. To understand the effect of the substrate, the ssDNA segment was also simulated in the absence of the Mn3O4 slab, following the same protocols as described above. All the simulations were performed using the GROMACS 5.1.5 package and VMD 1.9.3 software was used for visualization.47,48 All analysis was performed using GROMACS modules or in-house TCL scripts. Calculation of binding energy was carried out using the MM-GBSA method,49 incorporated in gmx_MMPBSA,50 a tool based on the MMPBSA.py module of AMBER20.51 The trajectory of the last 100 ns simulation was used for MM-GBSA calculation. Change in entropy due to DNA binding was calculated using a two-phase thermodynamic (2PT) model.52,53 2PT entropy is calculated by decomposing the density of states (DoS) of the system into a solid like and a gas like component. Anharmonicity is treated using the gas like component. The DoS function can be calculated from the Fourier transform of the velocity autocorrelation function, which provides information on the normal mode distribution of the system, with the zero frequency intensity in DoS corresponding to the diffusivity of the system.52,53 The 2PT method has been successfully used to compute the entropy changes of DNA, while binding to the dendrimer, CNT and graphene.54–57
The absorption intensity at ∼360 nm is found to decrease continuously with time. The change of peak intensity as a function of interaction time is displayed in Fig. 2f. The well-known interaction modes are intercalation, minor/major groove binding, and electrostatic interaction with the phosphate backbone.30,59,60 Thus, the UV-vis spectra indicate that the adsorption of DNA onto the Mn3O4 surface enhances with the increase in time. Photoluminescence (PL) emission spectroscopy is a non-destructive technique to identify the surface properties of the materials. Here, we have measured the PL emission spectra of Mn3O4, DNA and the mixture of Mn3O4 and DNA at different time intervals (Fig. 2g). Previous studies have shown the binding of FAM labelled DNA with various materials.52 However, in our case, we have used non-fluorescent DNA and carefully intended to investigate the changes in PL emission properties of Mn3O4 after binding/interaction with DNA. From Fig. 2g it can be observed that there is a prominent luminescence for 2D Mn3O4. The emission peak at ∼320 nm is attributed to 6A1g → 4T1g transition of Mn ions.61–63 After the addition of DNA, the PL emission intensity is found to be quenched with prominent peak shifting (Fig. 2g), further confirming the adsorption of the DNA on the 2D Mn3O4. To get more information, we have fitted the PL emission spectra using the Gaussian multiple peak fitting method and the fitted spectra are shown in Fig. 2h. It shows the de-convoluted PL emission spectra of the sample with a prominent peak originating from 6A1g → 4T1g transition. In Fig. 2i we present the change of peak position (6A1g → 4T1g transition) with interaction time. It is observed that with increasing interaction time, the peak position is red-shifted and after 120 min it is saturated. Thus, it clearly indicates the binding and adsorption of 34 nt long ssDNA on the 2D Mn3O4 nanosheets.
It could be inferred that the adsorption of DNA to Mn3O4 sheets leads to the local confinement of the DNA, thereby providing a concentrated green fluorescent signal of the FAM labelled DNA. This is a unique method of visually confirming the adsorption of ssDNA on the Mn3O4 surface and paves a platform for the development of an ssDNA immobilized Mn3O4 surface-based biosensor chip for the capture and identification of the nucleic acids with complementary nucleotide sequences. Finally, we present an illustrative proposition for detecting viral nucleic acids using the ssDNA immobilized Mn3O4-based biosensing surface (Fig. 3e). For this purpose, we designed an experiment where the DNA-functionalized 2D nanomaterial surface was employed to capture contrived SARS-CoV-2 genomic RNA fragments. Single-stranded DNA oligonucleotides either complementary to the SARS-CoV-2 genome or to the influenza A virus genome were complexed with the Mn3O4 sheets before immobilizing them on the glass surface with the help of a PVDF coating agent. The functionalized surfaces where then subjected to incubation with an in vitro synthesized small RNA fragment (283 nucleotide) mimicking a specific region of the RNA-dependent RNA polymerase (RdRp) gene of SARS-CoV-2 followed by subsequent washing to remove the unbound RNA sample. Specific capturing of the SARS-CoV-2 RNA by the complementary DNA oligonucleotide was visualized by eluting the RNA from the surface and subsequently performing a colorimetric RT-LAMP reaction with specific sets of primers (Table S1, ESI†). As shown in Fig. 3f, surface-functionalized with complementary oligonucleotides resulted in specific retention of the SARS-CoV-2 RNA, hence giving a positive colorimetric readout in the RT-LAMP reaction (violet to blue). Surface-functionalization with either Mn3O4 alone or with non-specific oligonucleotides (complementary to the influenza A virus genome) resulted in no such colour change confirming the specificity of the biosensing surface. Together these experiments provide a proof of concept for the development of a novel single-stranded DNA-immobilized Mn3O4 as a biosensor for specific capturing of pathogen-associated nucleic acids.
To understand the nature of this interaction, we have computed the minimum distance between the 5′ end of ssDNA and Mn3O4, and the temporal evolution has been presented in Fig. 4c. It is noteworthy that the minimum distance is defined as the minimum of the all-atomic pair distances between the 5′guanine of ssDNA and Mn3O4 slab. From Fig. 4c, it can be easily seen that the minimum distance between 5′-guanine and the material surfaces initially decreased from 0.80 nm (0.27 ns) to an average value of ∼0.25 nm at ∼3.7 ns and remained steady at this average value for the rest of the simulation window. This indicates a steady adsorbed state of ssDNA on the Mn3O4 surface from 3.7 ns onward. Another essential aspect in the context of adsorption is the number of contacts formed between the adsorbate and adsorbent. In the present case, a contact is defined when one atom from ssDNA is within a distance of 0.4 nm from an atom of Mn3O4. The number of contacts was first found to be increasing from a starting value of ∼50 to ∼128 in 2.5 ns (Fig. 4d, inset). It then decreased to an average value of ∼70 around 7 ns (Fig. 4d, inset). Fluctuations in the number of contacts were observed at ∼150 ns and ∼200 ns (Fig. 4d). The average number of contacts was recorded to be nearly constant at ∼70 throughout the rest of the simulation time (Fig. 4d). In corroboration with the constant minimum distance, this also represents a steady adsorbed state. Note that the ssDNA undergoes conformational changes while having its 5′guanine mostly adsorbed on the surface. Earlier studies have shown that many small molecules exhibit several adsorbed conformations on flat attractive surfaces.64
Another important mode of interaction that can tailor the adsorption kinetics is the formation of hydrogen bonds between DNA and the inorganic surface. The O atoms in the surface act as acceptors and the hydrogen atoms attached to the nitrogen atoms in the guanine base can act as donors. In the present study, the acceptor–donor cut-off distance to calculate the H-bonds was taken as 0.35 nm. The number of hydrogen bonds formed between the ssDNA and 2D Mn3O4 (001) surface has been depicted in Fig. 4f and it can be clearly seen that, although the adsorption kinetics is not regulated by hydrogen bond formation, it has a contribution towards the adsorption dynamics. Like before, the process of hydrogen bond formation also entirely took place between 5′ guanine and the surface (Fig. S4 in ESI†). In agreement with the number of contacts data, a decrease in the number of H-bonds formed between ssDNA and the 2D Mn3O4(001) surface can be seen ∼150 ns (Fig. 4f).
In order to justify the spontaneity of the ssDNA adsorption on the Mn3O4(001) surface, the binding affinity/free energy of adsorption has been estimated using the MM-GBSA method, from the last 100 ns of the trajectory and the variation has been shown in Fig. 4g (neglecting the entropy contribution). The average binding energy was estimated to be −8.57 ± 5.03 kcal mol−1 (excluding entropy), which, consistent with the experimental findings, indicates the spontaneous binding of ssDNA segments on the Mn3O4 surface. On the other hand, the change in the rotational (TΔSrot) and translational entropy (TΔStrans) values was found to be −2.46 kcal mol−1 and −16.05 kcal mol−1, respectively. The negative entropy change indicates the loss of rotational and translational degrees of freedom of ssDNA upon binding with the Mn3O4 surface.
To understand the structural fluctuation of ssDNA in the presence of the substrate, we have calculated the RMSD of the ssDNA as a function of time both in the presence and absence of the substrate. The time evolution of the RMSD is shown in Fig. 5a. The ssDNA segment underwent significant structural deviations, irrespective of the presence of the inorganic surface (Fig. 5a). The adsorbed ssDNA remained mostly stable from 40 ns onward (Fig. 5a), whereas the fluctuation in RMSD was more prominent in the absence of the surface. This observation implies that the adsorption of ssDNA on the material slabs imposes a structural stabilization on the former. The stability of ssDNA on the 2D Mn3O4 surface is also consistent with the negative change in translational and rotational entropy values stated in the previous section.
To get a better comprehension of the size and compactness of the ssDNA segment, the radius of gyration (Rg) of the adsorbed ssDNA was calculated and compared to Rg of the same ssDNA segment in the absence of surface (Fig. 5b). It is evident from the figure that the presence of an inorganic slab caused the ssDNA segment to become more compact for the first 150 ns and the compactness was achieved within the first 7 ns of the simulation (Fig. 5b). The ssDNA strand only in water became more compact between 200 and 250 ns, but again began to unfold (Fig. 5b). Together with the RMSD data, the trend of the radius of gyration also indicates that the adsorption phenomena stabilize the ssDNA structure on the surface. One striking feature is the sudden rise and fall of Rg between 30 ns and 40 ns, and again between 110 and 120 ns (Fig. 5b). The RMSD also exhibited similar behavior in these time windows (Fig. 5a). In the time window between 30 and 40 ns, the ssDNA unfolded itself to some extent and then folded back again (Fig. 5c), which caused the jump in Rg, and RMSD. Similar unfolding and folding of ssDNA took place between 110 and 120 ns, as well (figure not shown). It is well known that the DNA structure stabilizes through intra-molecular hydrogen formation. Therefore, the number of intra-molecular hydrogen bonds was calculated and is presented in Fig. 5d. Because of its compact structure, the adsorbed ssDNA formed significantly more intramolecular hydrogen bonds; except between 200 ns and 250 ns, when the ssDNA in the absence of the surface became more compact (Fig. 5d).
In harmony with the previous arguments, the higher number of intramolecular H-bonds in the adsorbed ssDNA (for most of the simulation window) is another piece of evidence of the greater structural stability. Another notable observation is that the number of H-bonds in ssDNA simulated in the water only showed a slight increment between 40 and 60 ns (Fig. 5d). The DNA became slightly folded in this time window, as seen from the lower Rg values (Fig. 5b), which resulted in the formation of more intramolecular H-bonds. With an aim to acquire a better understanding of the experimentally obtained FTIR spectra, the power spectrum of the phosphate groups has been calculated by taking the Fourier transform of the velocity autocorrelation function of the phosphate groups. The computed spectrum as shown in Fig. 5f is in the range from 1200 cm−1 to 1300 cm−1. The calculated peak position (∼1250 cm−1) was quite close to the experimental observation (1275 cm−1) (Fig. 5e). Moreover, in agreement with the experimental results, the intensity of the PO43− vibrational peaks changed in the presence of the surface. This can be attributed to the more stable structure of the adsorbed ssDNA (Fig. 5b). It is well known that, the spectral intensity and vibrational frequency of a particular functional group changes in the presence of hydrogen bonds.59,65 Because the structure of ssDNA remained stable in the presence of the surface, the adsorbed ssDNA formed more intramolecular hydrogen bonds on average (7.29 ± 1.35) than its counterpart in water only (3.75 ± 3.39), which affected the spectral density.
Footnotes |
† Electronic supplementary information (ESI) available. See DOI: https://doi.org/10.1039/d3cp01402a |
‡ Equal contribution. |
§ Current address: Department of Physics and Electronics, CHRIST (Deemed to be University), Bangalore 560029, India. |
This journal is © the Owner Societies 2023 |