Physico-geometrical kinetic insight into multistep thermal dehydration of calcium hydrogen phosphate dihydrate†
Received
23rd March 2023
, Accepted 16th April 2023
First published on 17th April 2023
Abstract
The origin of the multistep thermal dehydration of calcium hydrogen phosphate dihydrate (dibasic calcium phosphate dihydrate (DCPD)) to form γ-calcium diphosphate (γ-calcium pyrophosphate (γ-CPP)) via calcium hydrogen phosphate anhydride (dibasic calcium phosphate anhydride (DCPA)) was investigated from a specific viewpoint of physico-geometrical constraints generated during the reaction. The overall thermal dehydration was separated into five partially overlapping steps through systematic kinetic analysis. The first three steps and the residual two steps were attributed to the thermal dehydration of DCPD to form DCPA and of DCPA to form γ-CPP, respectively. The first to third steps were kinetically characterized by the surface reaction of plate-like particles controlled by nucleation and growth, the movement of the reaction interface inward to the plate by releasing water vapor through voids formed in the surface product layer, and the rapid escape of water vapor accompanied by the cleavage of plate-like particles into slices, respectively. The contributions of each component step varied with the heating conditions and atmospheric water vapor pressure. The subsequent dehydration of DCPA proceeded in two steps by the release of trapped water molecules in amorphous DCPA induced by its gradual crystallization and the dehydration of DCPA to form poorly crystalline γ-CPP, which continued to grow during the fifth mass loss step and exhibited a detectable exothermic phenomenon after the mass loss was completed. The possible causes of the variation in the multistep reaction features with reaction conditions were discussed by correlating the kinetic analysis results with the crystallographic and morphological findings.
1. Introduction
Calcium hydrogen phosphate dihydrate (CaHPO4·2H2O, dibasic calcium phosphate dihydrate (DCPD)) is extensively used as the diluent and bulking agent for preparing pharmaceutical tablets. The thermal stability and thermally induced physical and chemical changes in the preparation components directly affect the preparation conditions and the physico-chemical properties of the pharmaceutical preparation,1 as well as pharmaceutical benefits. In addition, considering both the preparation and storage of pharmaceuticals, the effect of atmospheric water vapor is another important factor to determine the preparation and conservation conditions of pharmaceuticals. Therefore, significant efforts have been made to reveal physico-chemical characteristics related to the thermal stability and thermally induced transformations of DCPD under various heating and atmospheric conditions.2–16 Thermal dehydration is a typical physico-chemical phenomenon used to assess the thermal stability and thermally induced transformation properties of DCPD. Thermal dehydration occurs at temperatures slightly higher than the boiling point of water via multistep mass loss steps to form crystalline or amorphous anhydride (CaHPO4; dibasic calcium phosphate anhydride (DCPA)).2–16| | | CaHPO4·2H2O → CaHPO4 + 2H2O | (1) |
Changes in multistep mass loss behavior depending on sample particle morphology,5,10 heating conditions,12 and atmospheric water vapor pressure2,3,13 have been a major subject to reveal the thermal dehydration behavior of DCPD. Changes in the multistep dehydration behavior with sample particle morphology and heating conditions may be explained by considering the physico-geometrical features of the reaction and formation of amorphous DCPA. The acceleration effects of atmospheric water vapor on the reaction have been reported by different research groups,2,3,13 for which the enhancement of the crystallization of the amorphous portion of the dehydration product by the atmospheric water vapor was considered a possible cause. On further heating, the produced DCPA dehydrates to form calcium diphosphate (Ca2P2O7; calcium pyrophosphate (CPP)).17–22| | | CaHPO4 → 1/2Ca2P2O7 + 1/2H2O | (2) |
Some studies have reported a single-step process of the thermal dehydration of DCPA,17,21 whereas some others have reported a two-step mass loss process.18–20,22 Hazzat et al. explained the cause of the two-step mass loss process and attributed it to the different sizes and morphologies of sample particles in commercially available DCPA.22 Irrespective of different reaction behaviors, the solid product was identified as γ-CPP. Therefore, the quantitative evaluation of changes in multistep reaction behavior occurring during the thermal dehydration of DCPD and subsequent dehydration of DCPA using an advanced kinetic approach could provide more insight into the complex reaction behaviors of the thermally induced transformations of DCPD.
Despite the formations of crystalline and amorphous DCPA as the stable intermediate during the overall thermal dehydration of DCPD to form γ-CPP, the reaction stoichiometries of the two chemical reaction steps are expressed by eqn (1) and (2). Therefore, the multistep thermal dehydration behavior observed during the thermal dehydration of DCPD to form DCPA could have originated from the heterogeneous features of the solid-state reaction. The thermal dehydration of solids is generally initiated on the surface of reactant particles, followed by the advancement of the reaction interface inward toward the center of the reactant particle.23–25 For such a reaction, multistep reaction behaviors are occasionally observed by the physico-geometrical constraints of the reaction. The surface product layer, produced by the surface reaction, can act as a barrier for the diffusional removal of water vapor produced at the internal reaction interface. When the blocking action of the surface product layer was significant, the dehydration is decelerated and occasionally stopped.26–32 The recovery of the reaction requires the formation of a diffusion path in the surface product layer, which may be induced by the crystal growth of the solid product and the crack formation in the product layer.26–32 As a result, the reaction exhibits multistep behavior.33–35 However, such physico-geometrical kinetic features have not fully been considered for the thermal dehydration of DCPD. Before that, only a few kinetic approaches to the target reaction have been reported.3,7,17,21,22 Here, the multistep thermal dehydration of DCPD was systematically traced using thermal analysis techniques under various heating and atmospheric conditions to characterize the kinetics of each component reaction step using an advanced kinetic approach. The multistep reaction under each reaction condition was kinetically separated into individual component steps, and the physico-geometrical kinetic features of each component reaction step are revealed by correlating the kinetic results with the morphological and crystallographic findings. Aiming to provide a physico-geometrical kinetic insight into the reaction, the phenomenology of the multistep thermal dehydration of DCPD and its changes with reaction conditions are explained on the basis of the revealed kinetic features of the individual component reaction steps.
2. Experimental
2.1 Sample characterization
A commercially available reagent of DCPD (special grade, >98.0%, FUJIFILM Wako) was used as the sample without further purification. The sample particles exhibited thin plate-like morphology irrespective of the particle size fraction (Fig. S1, ESI†). The sample was subjected to powder X-ray diffractometry (XRD) and Fourier transform infrared spectroscopy (FTIR). The sample powders were press-fitted to a plate sample holder, and the XRD pattern was recorded using a diffractometer (RINT-2200V, Rigaku) by scanning 2θ values from 5° to 60° in steps of 0.02° at a scan speed of 4° min−1 while irradiating Cu-Kα (40 kV, 20 mA). The recorded XRD pattern (Fig. S2, ESI†) agreed with that reported for DCPD (Monoclinic, S.G. = Ia(9), a = 5.8120, b = 15.1800, c = 6.2390, α = 90.000, β = 116.430, γ = 90.000, ICDD PDF 01-072-0713).36 The sample was diluted with KBr by mixing using an agate mortar and pestle, and FTIR spectrum was recorded using a spectrometer (FT-IR 8400S, Shimadzu) by a diffuse reflectance method. The FTIR spectrum (Fig. S3, ESI†) corresponded to that reported for DCPD.37–39 The assignment of individual infrared absorption peaks is listed in Table S1 (ESI†). The sample powders were sieved to different particle size fractions (20–45, 45–53, 53–63, 63–75, 75–90, and 90–150 μm) using stainless sieves by shaking for 1 h using an electronic shaker (MVS-1, AS ONE). The sample powders were coated with a thin Pt layer by sputtering (JFC-1600, JEOL, 30 mA, 30 s) and observed by scanning electron microscopy (SEM, JSM-6510, JEOL).
2.2 Thermal behavior
Three different series of thermogravimetry (TG)–differential thermal analysis (DTA) measurements were performed using a TG–DTA instrument (TG-8121, Thermoplus Evo2 system, Rigaku) by systematically varying the sample particle size, sample mass (m0), or flow rate (qv) of dry N2. The sample of a selected size fraction was weighed on a Pt pan (diameter: 5 mm; depth: 2.5 mm), and TG–DTA curves were recorded by heating the sample from 300 K to 973 K at a heating rate (β) of 5 K min−1. In the first series, TG–DTA curves with different sample particle sizes (m0 = 5.00 ± 0.03 mg) were recorded in a stream of dry N2 (qv = 300 cm3 min−1). The second series of TG–DTA curves were recorded for the sample of 63–75 μm by systematically varying the sample mass (1.0 ≤ m0 mg ≤ 10) in a stream of dry N2 (qv = 300 cm3 min−1). In the third series, the flow rate of dry N2 was systematically varied from 50 to 500 cm3 min−1 for the TG–DTA measurements of the sample (63–75 μm; m0 = 5.00 ± 0.03 mg).
Changes in the XRD pattern of the sample (63–75 μm; press-fitted to a Pt sample holder) during heating were traced by high-temperature XRD (HTXRD) measurements using a RINT-2200V diffractometer equipped with a programmable heating chamber in a stream of dry N2 (qv = 100 cm3 min−1). The sample was heated according to a stepwise isothermal heating program composed of linear increasing temperature (β = 2 K min−1) sections and isothermal holding sections for each 15 min, where XRD patterns were recorded in each isothermal holding section. Three series of HTXRD measurements covering different temperature ranges were performed: (1) 373–973 K with isothermal holding sections in steps of 50 K; (2) 373–523 K with isothermal holding sections in steps of 10 K; (3) 723–913 K with isothermal holding sections in steps of 10 K.
2.3 Kinetic measurement
Comparing the TG–DTG curves recorded under the conditions of different sample particle sizes, sample masses, and flow rates of dry N2, the sample of 63–75 μm was selected for the kinetic study of thermally induced transformation processes. The sample mass and flow rate of dry N2 were fixed to 5.0 mg and 300 cm3 min−1, respectively. TG–DTA curves were recorded under linear nonisothermal conditions at different β values and controlled rate thermal analysis (CRTA)40,41 conditions at different controlled values (C). The sample was heated from 300 K to 973 K at different β values ranging from 0.5 to 20 K min−1 for the measurements under linear nonisothermal conditions. Meanwhile, the sample was heated from 300 K to 973 K at β = 2 K min−1, whereas during the mass loss process the mass loss rate was controlled to be at different C ranging from 5 to 15 μg min−1.
Differential scanning calorimetry (DSC; DSC 8270, Rigaku) measurements were performed for the sample (63–75 μm; m0 = 10.0 ± 0.02 mg) weighed on a Pt pan (diameter: 5 mm, depth: 2.5 mm), for which the top surface of the sample was covered with a Pt drop lid. DSC curves were recorded during the linear heating of the sample from 300 K to 973 K at different β values (2 ≤ β/K min−1 ≤ 20) in a stream of dry N2 (qv = 100 cm3 min−1).
The effect of atmospheric water vapor on the kinetic behavior of the thermally induced transformations of DCPD was investigated using a humidity-controlled TG system composed of a TG–DTA instrument (TG-8122, Thermoplus Evo2 system, Rigaku) and a humidity controller (me-40DP-2PHW, Micro equipment Co.). In this system, N2–H2O mixed gas with a specific dew point was generated in the humidity controller by bubbling N2 in a temperature and pressure-controlled saturation cistern and transferred to the reaction tube of the TG–DTA instrument via a temperature-controlled transfer tube and an anterior chamber of the reaction tube. The temperature and relative humidity of the N2–H2O mixed gas were continuously monitored in the anterior chamber to calculate the water vapor pressure (p(H2O)). Notably, the reaction tube and its anterior chamber were preliminary warmed at a temperature higher by 10 K than the dew point of the N2–H2O mixed gas by circulating temperature-controlled water to avoid the condensation of water vapor in the TG–DTA instrument. Under the conditions otherwise identical to those for the TG–DTA measurements in a stream of dry N2, the sample (63–75 μm, m0 = 5.00 ± 0.03 mg) was linearly heated to 973 K at a β of 5 K min−1 in a stream of N2–H2O mixed gas (qv = 200 cm3 min−1) with different p(H2O) values in a range of 0.4–19.8 kPa. By selecting seven different p(H2O) values, i.e., 1.2, 2.9, 6.3, 8.1, 10.2, 12.6, and 15.8 kPa, the TG–DTA measurements were performed under linear nonisothermal conditions at different β values (0.5 ≤ β/K min−1 ≤ 10).
2.4 Morphological change
The sample was heated to different temperatures at β = 5 K min−1 under the same sample and measurement conditions as the aforementioned TG–DTA measurements in a stream of dry N2 or N2–H2O mixed gas (p(H2O) = 12.6 kPa). The heat-treated samples were recovered after cooling to room temperature in the TG–DTA instruments in a stream of dry N2. The recovered samples were subjected to the FTIR measurements and SEM observations as in the procedures for the sample characterization.
3. Results and discussion
3.1 Overview of thermal behavior
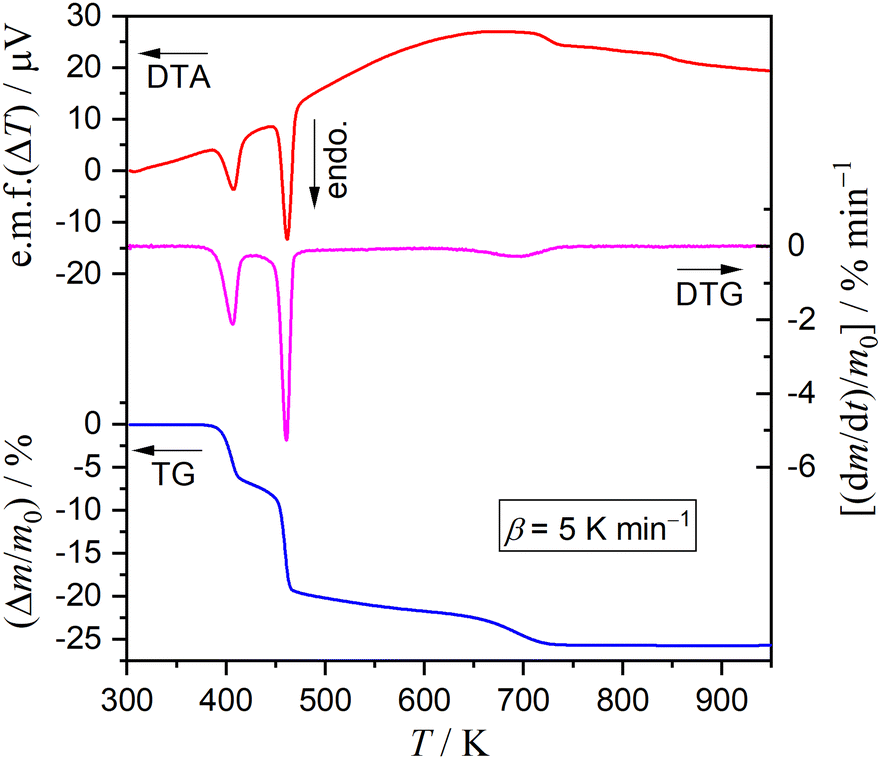
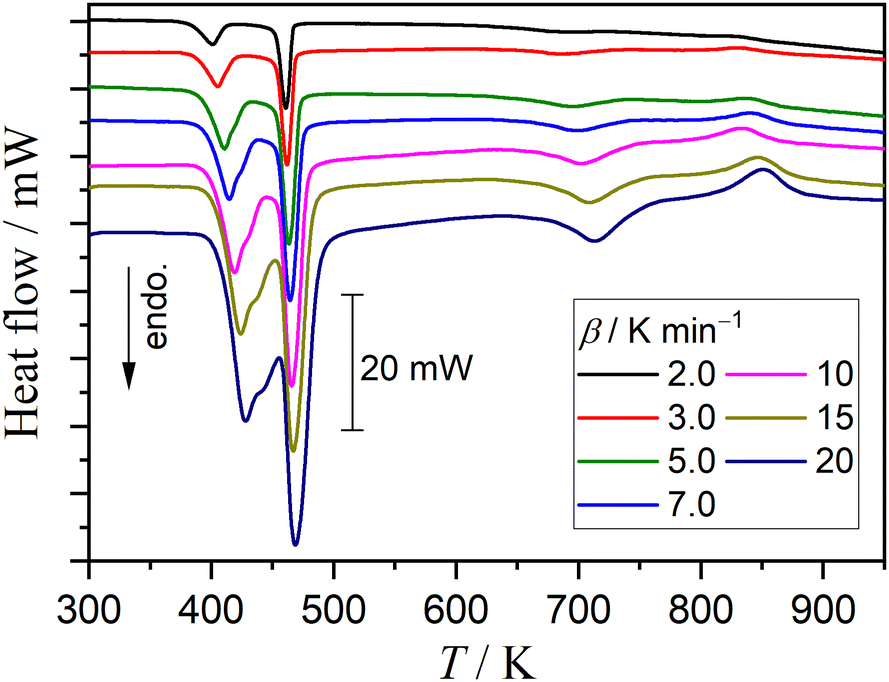
Fig. 1 shows typical TG–derivative TG (DTG)–DTA curves for DCPD (63–75 μm; m0 = 4.99 mg) recorded during heating from 300 K to 973 K at a β of 5 K min−1 in a stream of dry N2 (qv = 300 cm3 min−1). Three distinguishable mass loss steps were observed accompanied by individual endothermic DTA peaks. The mass loss value until 515 K, including two mass loss steps, was 20.5%, corresponding to the calculated value (20.9%) for the thermal dehydration of DCPD to form DCPA (eqn (1)). The subsequent mass loss step occurring at temperatures higher than 515 K exhibited a mass loss of 5.2%, in accordance with the thermal dehydration of DCPA to form CPP (eqn (2); 5.2%).
 |
| | Fig. 1 TG–DTG–DTA curves recorded during the heating of DCPD sample (63–75 μm; m0 = 4.99 mg) from 300 K to 973 K at a β of 5 K min−1 in a stream of dry N2 (qv = 300 cm3 min−1). | |
Fig. 2 shows the changes in the XRD pattern during stepwise isothermal heating from 373 to 973 K in steps of 50 K. Three different XRD patterns were observed, including that for the original DCPD (Fig. 2(a)). The XRD peaks of DCPD gradually attenuated in the temperature range of 423–523 K; conversely, those of DCPA (Fig. 2(b); Triclinic, S.G. = P1(1), a = 6.9000, b = 6.6500, c = 7.0000, α = 96.400, β = 103.900, γ = 88.700, ICDD PDF 01-089-5969)42 gradually grew in the same temperature range. On further heating, the XRD pattern was changed from that of DCPA to γ-CPP (Fig. 2(c); ICDD PDF 00-017-0499)8 in the temperature range of 673–723 K. The temperature range of the transformation from DCPD to DCPA agreed with that of the first and second mass loss steps observed by TG–DTG–DTA curves (Fig. 1), whereas that from DCPA to γ-CPP corresponded to the third mass loss step. The formation of γ-CPP by the thermal dehydration of DCPA has also been reported in previous studies.2,8,43 Fig. S4(a) (ESI†) shows the FTIR spectra for the samples preliminary heated to different temperatures. In the temperature ranges corresponding to the thermal dehydration of DCPD to form DCPA and of DCPA to form γ-CPP, the absorption peaks attributed to crystalline water (Fig. S4(b), ESI†) and the –OH group (Fig. S4(c), ESI†) disappear, respectively. Tables S2 and S3 (ESI†) list the assignments of each absorption peak of DCPA and γ-CPP, respectively.37,39,44,45 The changes in the FTIR spectra by heating the sample to different temperatures support the reactions of eqn (1) and (2).
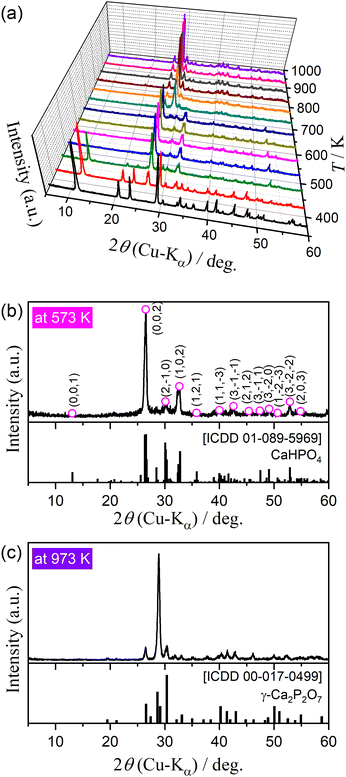 |
| | Fig. 2 Change in the XRD pattern of DCPD sample (63–75 μm) during stepwise isothermal heating in a stream of dry N2: (a) XRD patterns at different temperatures, (b) XRD pattern at 573 K, and (c) XRD pattern at 973 K. | |
3.2 Multistep thermal dehydration of DCPD in a stream of dry N2
Preliminary to the detailed investigation of thermal dehydration behavior in a stream of dry N2, the effects of the particle size, sample mass, and flow rate of dry N2 on TG–DTG–DTA curves were investigated under linear nonisothermal conditions at a fixed β of 5 K min−1, as shown in Fig. S5–S7 (ESI†). The sample particle size affects the first mass loss step of thermal dehydration, where the thermoanalytical curves systematically shifted to higher temperatures, and the mass loss value increased with increasing particle size (Fig. S5, ESI†). The same trend has been reported by Landin et al. with an explanation of the catalytic action of the self-generated water vapor, which is expected to be larger for samples with larger particle sizes.6 However, no detectable changes in the thermoanalytical curves were observed for the second and third mass loss steps between the samples of different sample particle sizes. Only systematic growth of the DTA endothermic peaks attributed to three mass loss steps was observed with increasing initial sample mass without any changes in the position along with the temperature coordinate (Fig. S6, ESI†). The TG and DTG curves did not show any changes, overlapping nearly perfectly between different sample masses. This observation indicates that the overall mass loss behavior is not influenced by the depth of the sample bed, but it reflects the average behavior of the individual sample particles subjected to TG–DTG–DTA measurements. No detectable changes in the TG–DTG–DTA curves were observed among the thermoanalytical measurements under different flow rate of dry N2 (Fig. S7, ESI†). Therefore, it is expected that the effect of the self-generated water vapor during individual mass loss steps may be negligible. Based on these findings, the DCPD sample of 63–75 μm fraction was selected for the detailed investigation of the kinetic and mechanisms of the individual mass loss steps. The initial sample mass and flow rate of dry N2 were fixed to be 5.00 ± 0.05 mg and 300 cm3 min−1, respectively, for all measurements in a stream of dry N2.
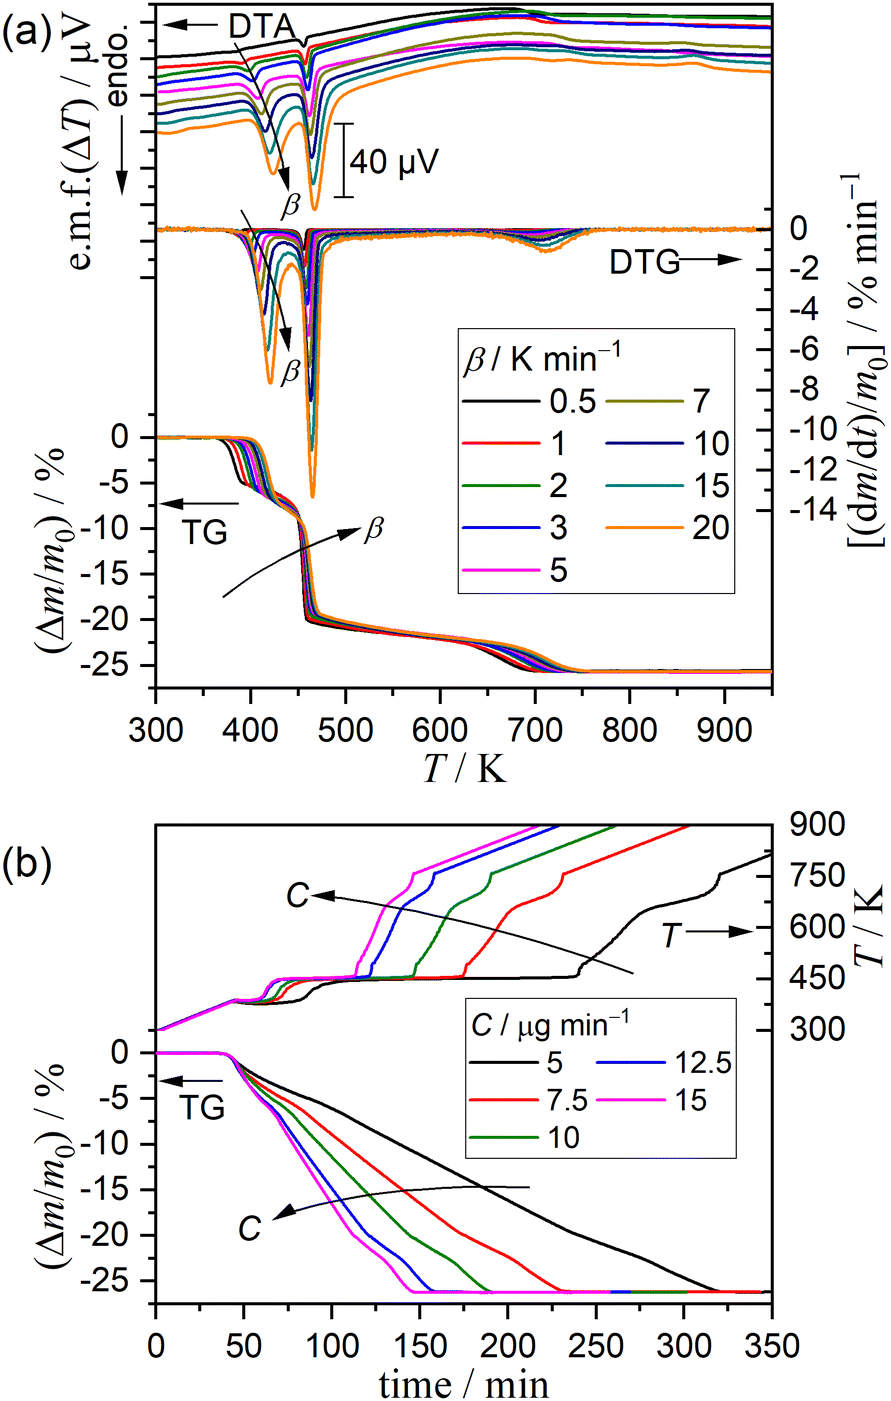
Fig. 3 shows the TG–DTG–DTA curves under linear nonisothermal conditions at different β values and TG–temperature profile curves under CRTA conditions at different C values for the DCPD sample in a stream of dry N2. Under linear nonisothermal conditions, the thermoanalytical curves for each reaction step systematically shifted to higher temperatures with increasing β (Fig. 3(a)). Notably, the mass loss value of the first step increased with increasing β value, which is a behavior similar to that observed for samples of different particle sizes exhibiting a systematic shift to higher temperature and increase in the mass loss value with increasing the particle size. Three mass loss steps were distinguished in the temperature profile curves under CRTA conditions (Fig. 3(b)), where the linear temperature rise was suppressed during individual mass loss steps to control the mass loss rate to be a constant value. The temperature profile in each mass loss step systematically shifted to higher temperatures with increasing C values. The TG–DTG curves recorded under linear nonisothermal and CRTA conditions were converted to kinetic data by calculating the degree of reaction (α, 〈0, 1〉) based on TG with reference to the total mass loss value for the overall reaction including three mass loss steps, and a series of data points (time (t), temperature (T), α, dα/dt) were obtained from each TG curve.
 |
| | Fig. 3 TG–DTG–DTA or TG–temperature profile curves recorded during heating of DCPD sample (63–75 μm) in a stream of dry N2 with different temperature program modes: (a) linear nonisothermal mode at different β values (m0 = 5.00 ± 0.03 mg) and (b) CRTA mode at different C values (m0 = 5.00 ± 0.04 mg). | |
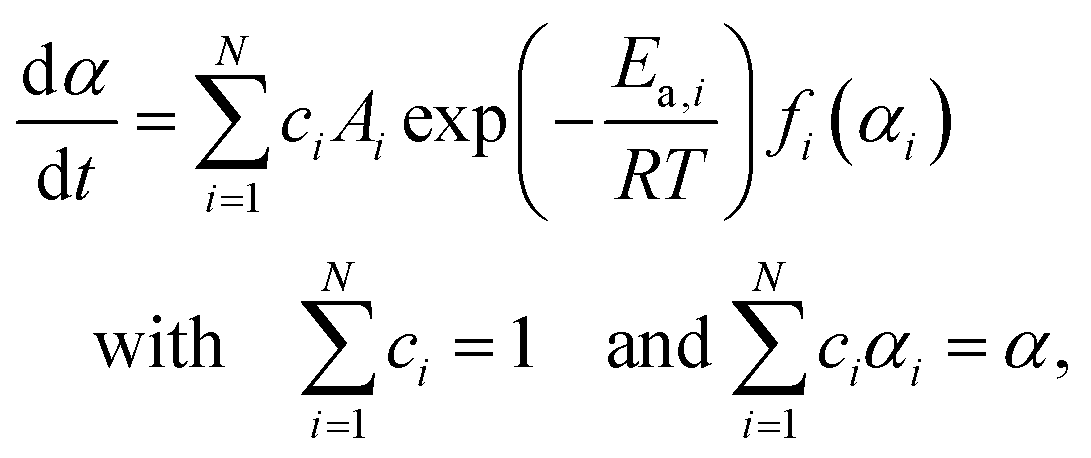
The kinetic behavior of single-step thermal dehydration is typically described using the following equation:33,35,46–48
| |  | (3) |
where
A,
Ea,
R, and
f(
α) denote the Arrhenius preexponential factor, apparent activation energy, gas constant, and kinetic model function, respectively. Taking logarithms,
eqn (4) is obtained as follows:
| |  | (4) |
One finding of
eqn (4) is the isoconversional kinetic relationship,
i.e., data points at a fixed
α extracted from kinetic data recorded under different heating conditions represent a linear relationship for ln(d
α/d
t)
versus T−1 plot with a slope of −
Ea/
R and an intercept of ln[
Af(
α)] (Friedman plot
49). The isoconversional kinetic relationship was applied to the overall thermal dehydration of DCPD to monitor the variation in the kinetic behavior as the reaction step progressed with the partially overlapping multistep reaction scheme.
Fig. 4 shows the results of the isoconversional kinetic analysis. A statically significant linear relation of the Friedman plot was observed in specific
α regions corresponding to three mass loss steps (
Fig. 4(a)),
i.e., 0.01 ≤
α ≤ 0.15, 0.40 ≤
α ≤ 0.70, and 0.90 ≤
α ≤ 0.99. The
Ea value calculated from the slope of the Friedman plot exhibited approximately constant values in these
α regions (regions (1), (2), and (3) indicated in
Fig. 4(b)). The average
Ea values in the individual mass loss steps were 141 ± 7, 724 ± 80, and 269 ± 18 kJ mol
−1, respectively. Although the mass loss also progressed in the
α regions between the major mass loss steps, the isoconversional kinetic relation was not established in the intermediate
α region, leading to superficial
Ea even exhibiting negative values. One probable reason for the superficial kinetic results is the overlapping of two mass loss steps in the
α regions between the major mass loss steps. Furthermore, the change in the
α regions of the first and second mass loss steps depending on the heating conditions was evident by comparing the d
α/d
t versus α plots of different kinetic data (
Fig. 4(b)), which is the direct cause of the superficial negative
Ea value obtained in the
α region between the first and second mass loss steps.
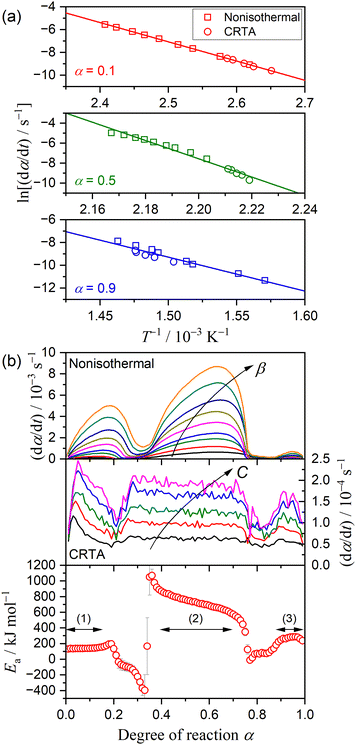 |
| | Fig. 4 Results of isoconversional kinetic analysis for the overall thermal dehydration of DCPD (63–75 μm) in a stream of dry N2: (a) Friedman plot at different α values, and (b) changes in (dα/dt) as the reaction advances under linear nonisothermal and CRTA conditions, and Ea values at different α. | |
Based on the preliminary isoconversional approach, five distinguishable steps of thermal dehydration were identified including the three major mass loss steps and two intermediate steps between them. When an independent parallel process was assumed, the overall process is described using a cumulative kinetic equation:33–35,50,51
| | 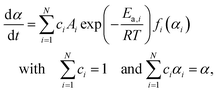 | (5) |
where
c represents the contribution of each step, and the subscript
i identifies the component reaction step.
N represents the total number of reaction steps,
i.e.,
N = 5. Therefore, the major mass loss steps are described by
i = 1, 3, and 5, whereas the intermediate steps are described by
i = 2 and 4. In this expression, each step is described by constant
Ai and
Ea,i values, and any deviation of the kinetic behavior from the ideal kinetic equation is accommodated by
fi(
αi). Therefore, an empirical kinetic model function with high flexibility is preferable for
fi(
αi) to accurately extract the kinetic behavior of each reaction step. One such kinetic model function is the Šesták–Berggren model with three kinetic exponents,
i.e., SB(
m,
n,
p):
52–54| | | f(α) = αm(1 − α)n[−ln(1 − α)]p | (6) |
In this kinetic approach called kinetic deconvolution analysis (KDA),
33–35,50,51 30 kinetic parameters should be simultaneously optimized by nonlinear least squares analysis, which is a highly mathematical procedure associated with the risk of obtaining apparent kinetic parameters only satisfying empirical curve fitting.
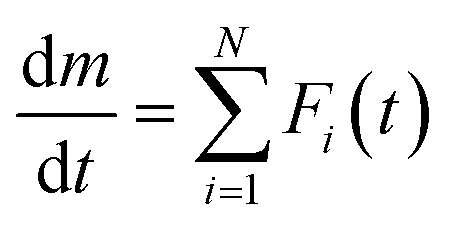
A possible way to avoid the risk is to have suitable initial values for each kinetic parameter. A mathematical peak separation of DTG curves using a statistical function Fi(t) and subsequent formal kinetic analysis of the separated curves as a single-step process is one of the possible ways to evaluate the reliable initial values for KDA. The procedure called mathematical deconvolution analysis (MDA) is based on the following equation:33,34,51,55,56
| |  | (7) |
After examining MDA using various
Fi(
t) functions, the log-normal 4-parameter function (eqn (S1) in ESI
†) was adopted as a possible
Fi(
t) function to satisfactorily fit the DTG curves. The
ci value of each reaction step was determined by the area ratio of the separated DTG peaks, and the series of separated DTG peaks of the selected reaction step at different
β values were analyzed using the Friedman plot and master plot method
57–62 based on Ozawa's generalized time concept.
63,64 The details of MDA and subsequent formal kinetic analysis are presented in ESI
† (Fig. S8–S12 and Table S4). After the initial values of all kinetic parameters (Table S4, ESI
†) were introduced into
eqn (5) accompanied by
eqn (6), all kinetic parameters were simultaneously optimized
via KDA. Notably, systematic variations in
ci values with
β were observed while evaluating the initial values; therefore, each kinetic curve at a particular
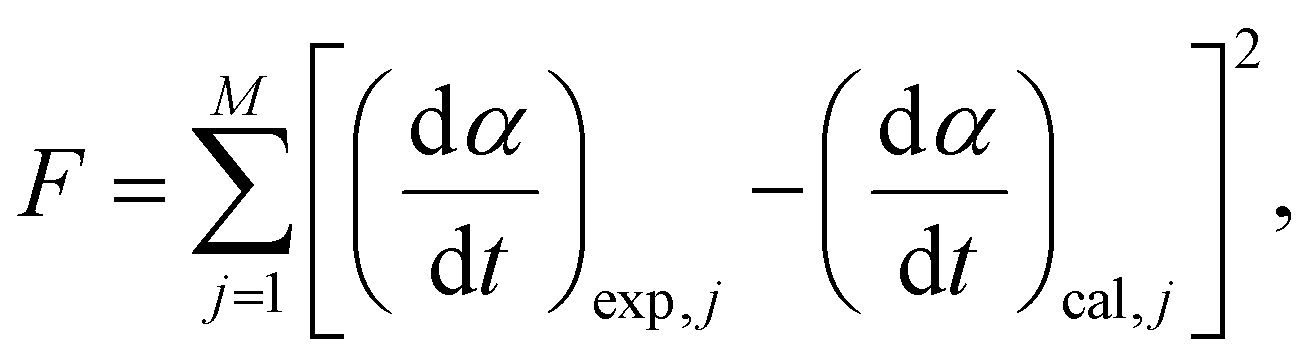
β was analyzed to minimize the squares sum of the residue according to the generalized reduced gradient method.
| |  | (8) |
where
M represents the total number of data points in each kinetic curve.
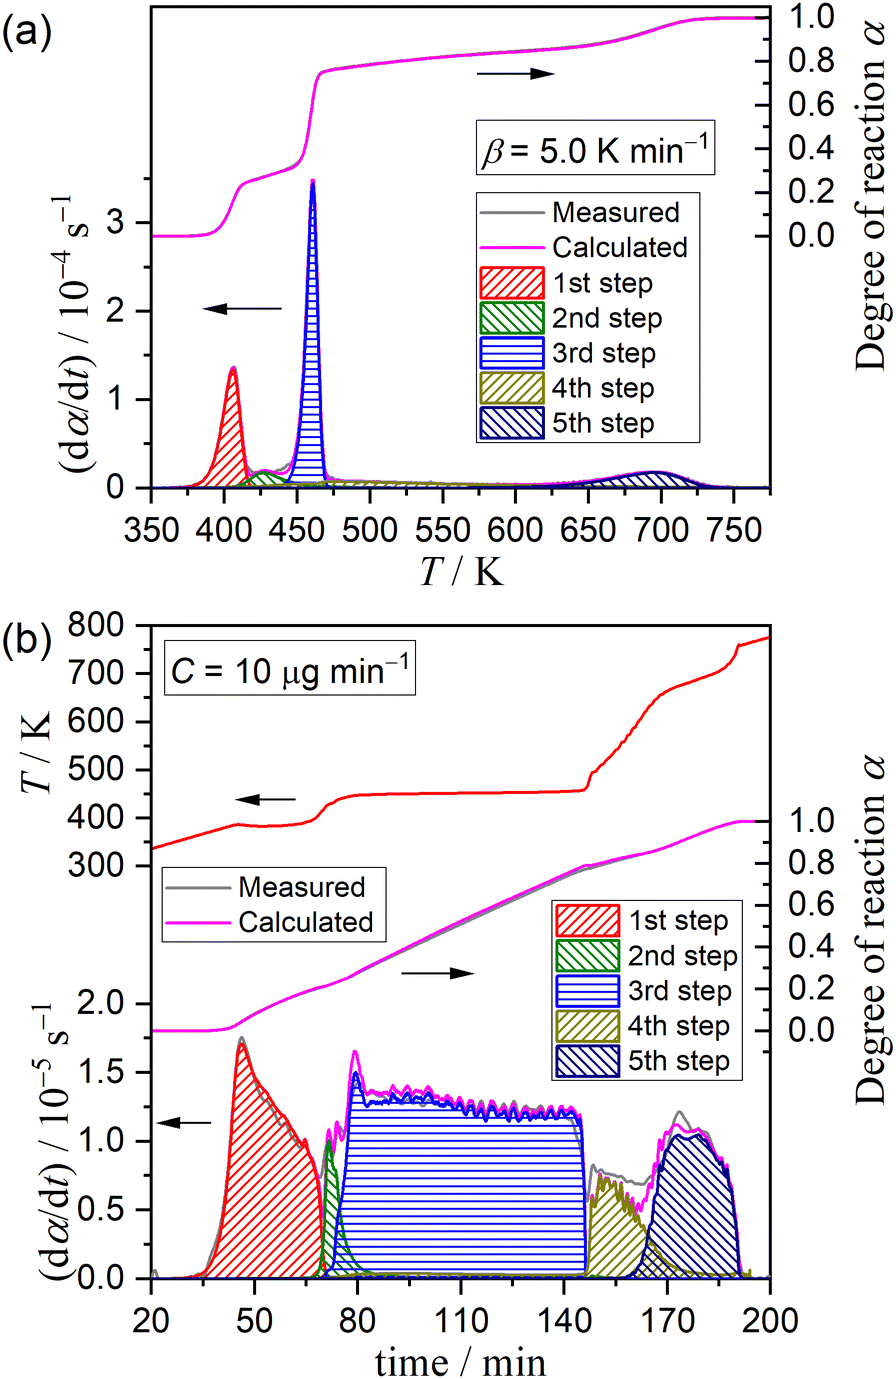
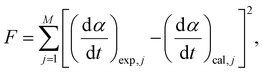
Fig. 5 shows typical results of KDA for thermal dehydration in a stream of dry N2. All kinetic curves for the overall process were nearly perfectly fitted by optimizing the kinetic parameters of individual reaction steps with the determination coefficient (R2) greater than 0.99, irrespective of the β value (Fig. 5(a)). Note that ci values varied with β values, as shown in Fig. 6. The mass loss ratio of thermal dehydration of DCPD to form DCPA (eqn (1)) and of DCPA to form γ-CPP (eqn (2)) is ideally characterized by 4![[thin space (1/6-em)]](https://www.rsc.org/images/entities/char_2009.gif) :1. The 80% conversion corresponding to the end of the thermal dehydration of DCPD to form DCPA was positioned midway through the fourth reaction step, indicating that the total contributions of these two reactions were invariant irrespective of β. The variation in ci values was specifically observed for the reaction steps of the thermal dehydration of DCPD to form DCPA, i.e., the first to third reaction steps, in which the compensative increase and decrease with increasing β value were observed in ci values for the first and third steps, respectively. In addition, a slight but detectable increase in the ci value for the second step was observed and was accompanied by variations in the first and third steps with increasing β. Regardless of the variations in ci values with β, the other kinetic parameters were invariant irrespective of β. Table 1 summarizes the optimized kinetic parameters averaged over different β values. When the optimized kinetic parameters for the reaction under linear nonisothermal conditions are used as the initial values, the overall process under CRTA conditions was also subjected to KDA (Fig. 5(b)). Notably, the variation in ci was not observed for the reactions under CRTA conditions because the temperature change during the individual steps was reduced to keep the mass loss rate constant. The optimized kinetic parameters for the reactions under CRTA conditions were practically identical to those under linear nonisothermal conditions (Table 1).
:1. The 80% conversion corresponding to the end of the thermal dehydration of DCPD to form DCPA was positioned midway through the fourth reaction step, indicating that the total contributions of these two reactions were invariant irrespective of β. The variation in ci values was specifically observed for the reaction steps of the thermal dehydration of DCPD to form DCPA, i.e., the first to third reaction steps, in which the compensative increase and decrease with increasing β value were observed in ci values for the first and third steps, respectively. In addition, a slight but detectable increase in the ci value for the second step was observed and was accompanied by variations in the first and third steps with increasing β. Regardless of the variations in ci values with β, the other kinetic parameters were invariant irrespective of β. Table 1 summarizes the optimized kinetic parameters averaged over different β values. When the optimized kinetic parameters for the reaction under linear nonisothermal conditions are used as the initial values, the overall process under CRTA conditions was also subjected to KDA (Fig. 5(b)). Notably, the variation in ci was not observed for the reactions under CRTA conditions because the temperature change during the individual steps was reduced to keep the mass loss rate constant. The optimized kinetic parameters for the reactions under CRTA conditions were practically identical to those under linear nonisothermal conditions (Table 1).
 |
| | Fig. 5 Typical fitting results of KDA for the partially overlapping five-step mass loss process of the thermal dehydration of DCPD (63–75 μm) in a stream of dry N2 under different heating program modes: (a) linear nonisothermal at β = 5 K min−1 and (b) CRTA at C = 10 μg min−1. | |
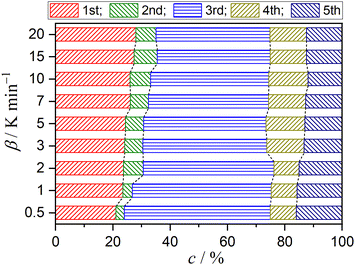 |
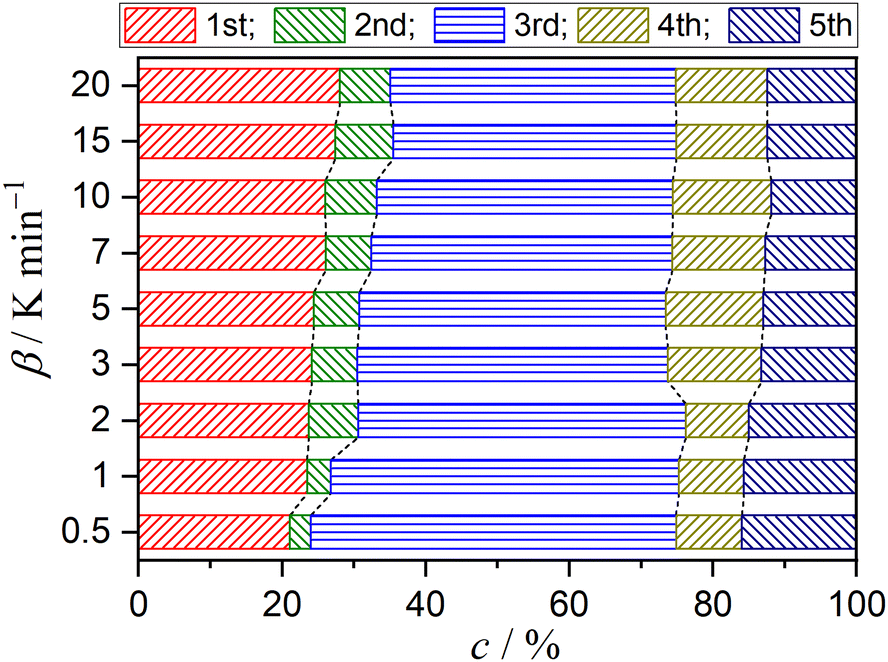
| | Fig. 6 Variation in the contributions of component mass loss steps with β for the thermal dehydration of DCPD (63–75 μm) in a stream of dry N2. | |
Table 1 Optimized kinetic parameters for each reaction step of the partially overlapping five-step mass loss process of the thermal dehydration of DCPD (63–75 μm) under different heating program modes in a stream of dry N2, averaged over different heating parameters for each mode
| Condition |
i
|
c
i
|
E
a,i/kJ mol−1 |
A
i
/s−1 |
SB(mi, ni, pi) |
R
2a |
|
m
i
|
n
i
|
p
i
|
|
Determination coefficient of the nonlinear least-squares analysis of the KDA.
c
1 + c2 + c3.
|
| Linear nonisothermal |
1 |
0.75 ± 0.01b |
121.3 ± 0.2 |
(5.15 ± 0.06) × 1013 |
−1.16 ± 0.01 |
1.43 ± 0.02 |
1.59 ± 0.03 |
0.9982 ± 0.0013 |
| 2 |
|
153.1 ± 4.3 |
(5.29 ± 0.02) × 1016 |
2.36 ± 0.08 |
1.89 ± 0.14 |
−1.87 ± 0.07 |
| 3 |
|
582.2 ± 0.9 |
(1.43 ± 0.15) × 1064 |
−4.75 ± 0.26 |
2.68 ± 0.13 |
4.51 ± 0.34 |
| 4 |
0.12 ± 0.03 |
157.3 ± 3.0 |
(2.27 ± 0.03) × 1014 |
21.1 ± 0.46 |
−3.40 ± 0.08 |
−22.0 ± 0.25 |
| 5 |
0.14 ± 0.02 |
260.6 ± 0.6 |
(1.04 ± 0.01) × 1017 |
−0.92 ± 0.02 |
1.16 ± 0.02 |
0.18 ± 0.01 |
|
|
| CRTA |
1 |
0.20 ± 0.02 |
121.2 ± 0.1 |
(5.14 ± 0.01) × 1013 |
−1.13 ± 0.01 |
1.53 ± 0.01 |
1.59 ± 0.01 |
0.9874 ± 0.0027 |
| 2 |
0.03 ± 0.01 |
153.1 ± 1.7 |
(5.28 ± 0.01) × 1016 |
2.35 ± 0.01 |
1.89 ± 0.01 |
−1.87 ± 0.01 |
| 3 |
0.52 ± 0.02 |
587.4 ± 0.9 |
(1.32 ± 0.01) × 1064 |
−2.04 ± 0.03 |
0.80 ± 0.01 |
1.24 ± 0.02 |
| 4 |
0.09 ± 0.01 |
159.0 ± 0.5 |
(2.27 ± 0.01) × 1014 |
21.7 ± 0.05 |
−3.39 ± 0.01 |
−21.5 ± 0.07 |
| 5 |
0.15 ± 0.01 |
262.4 ± 0.3 |
(1.04 ± 0.01) × 1017 |
−0.92 ± 0.01 |
1.17 ± 0.01 |
0.18 ± 0.01 |
3.3 Multistep thermal dehydration of DCPD in a stream of N2–H2O mixed gas
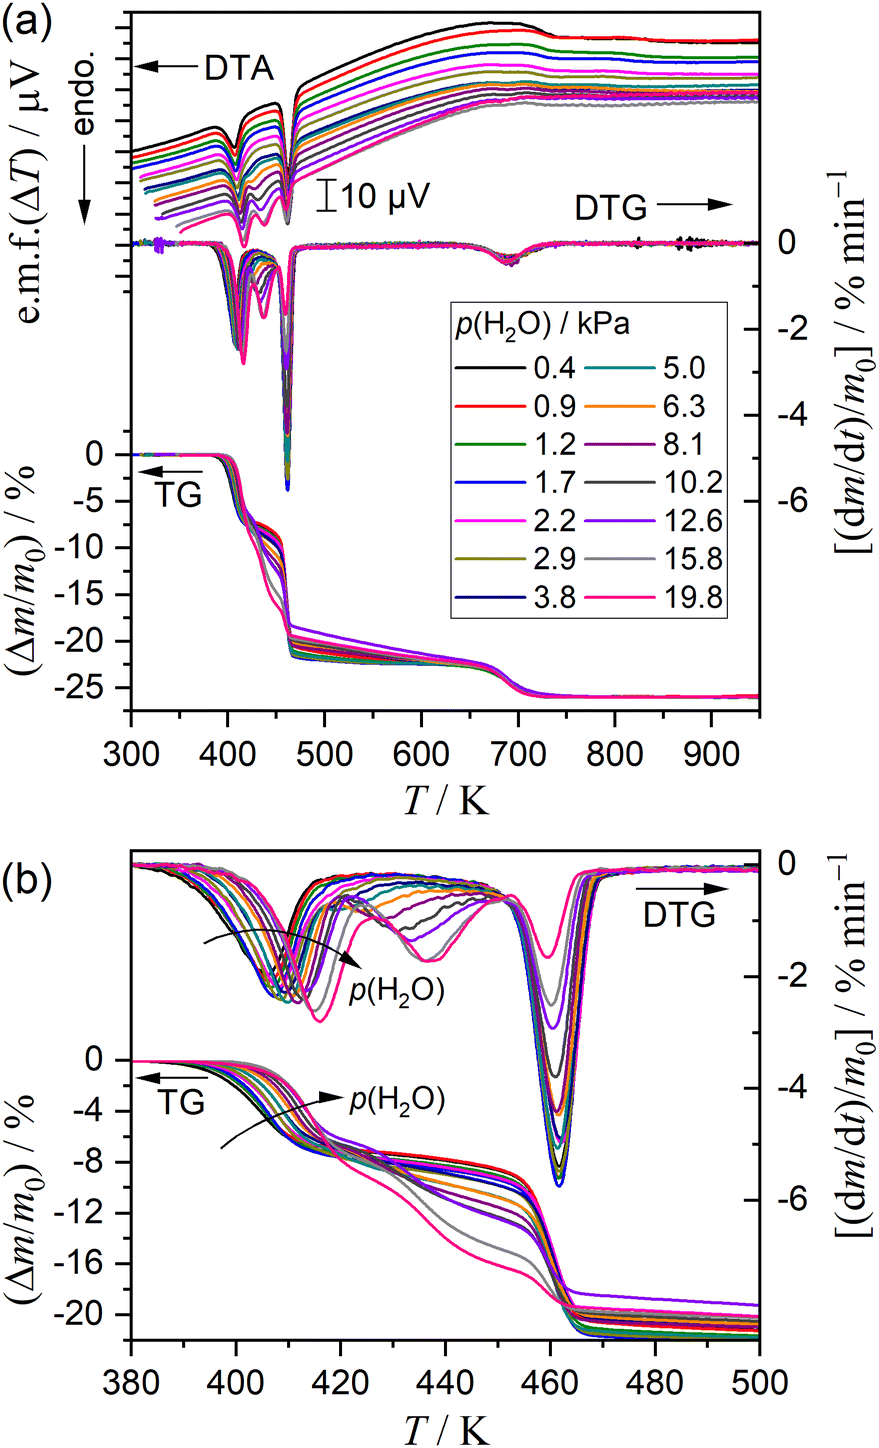
Fig. 7 shows the TG–DTG–DTA curves for the thermal dehydration of DCPD recorded at a fixed β of 5 K min−1 in a stream of N2–H2O mixed gas characterized by different p(H2O) values. The overall mass loss value was practically identical irrespective of the p(H2O) value (Fig. 7(a)). Systematic variations with increasing p(H2O) value were observed for the thermal dehydration of DCPD to form DCPA (Fig. 7(b)), which was characterized by (1) a systematic shift of the first mass loss step to the higher temperatures, (2) a systematic increase in the mass loss value of the second mass loss step, and (3) a systematic decrease in the mass loss value of the third mass loss step. Conversely, no distinguishable variations were observed for the fifth mass loss step attributed to the thermal dehydration of DCPA to form γ-CPP (Fig. 7(a)).
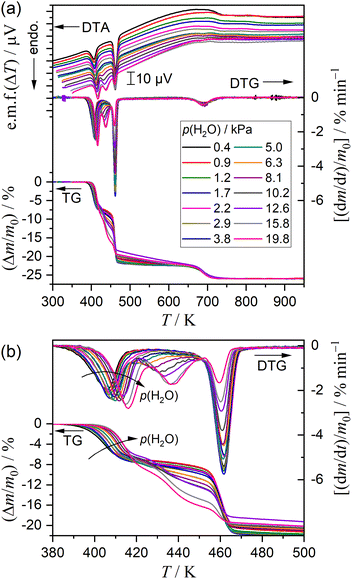 |
| | Fig. 7 (a) TG–DTG–DTA curves for the thermal dehydration of DCPD (63–75 μm; m0 = 5.00 ± 0.03 mg) at a β of 5 K min−1 and (b) a view focused on the thermal dehydration of DCPD to form DCPA. | |
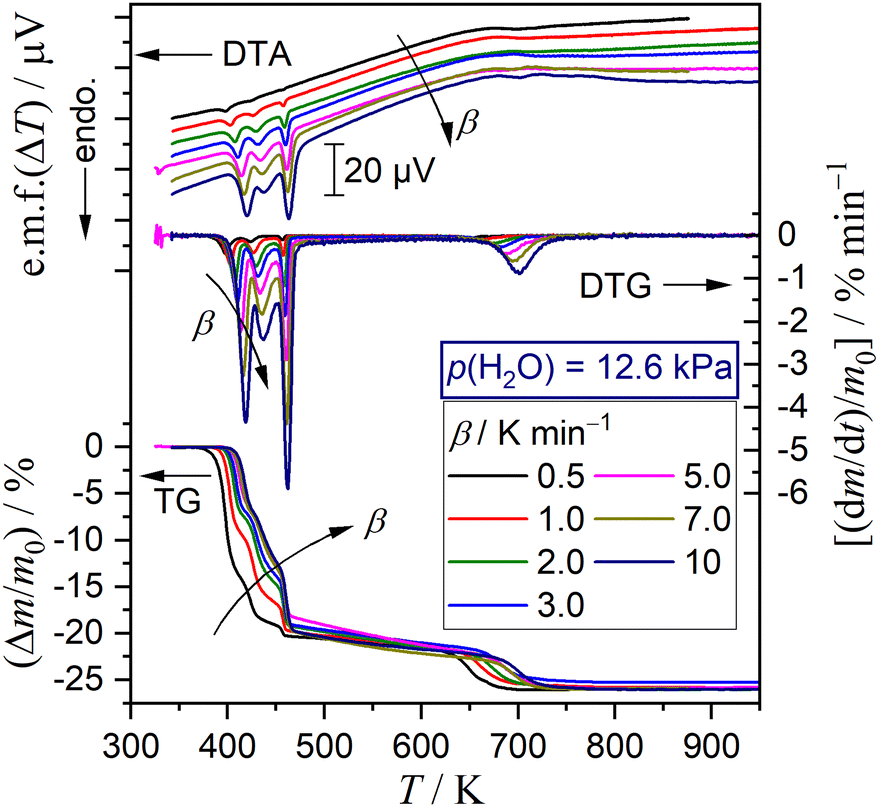
Selecting seven different p(H2O) values, TG–DTG–DTA curves were recorded at different β values, as typically shown as a series at p(H2O) = 12.6 kPa in Fig. 8. The other series of TG–DTG–DTA curves at different β values at p(H2O) = 1.2, 2.9, 6.3, 8.1, 10.2, and 15.8 kPa are depicted in Fig. S13 (ESI†). An ideal shift of thermoanalytical curves to higher temperatures with increasing β was observed for the first and fifth mass loss steps irrespective of the p(H2O) value. A systematic increase in the mass loss value of the first step accompanied by the compensative decrease in that of the third step by increasing β was observed at lower p(H2O) values of 1.2 and 2.9 kPa (Fig. S13(a) and (b), ESI†), as observed for the reaction in a stream of dry N2 (Fig. 3(a)). Notably, this trend was reversed at the higher p(H2O) values, i.e., 6.3, 8.1, 10.2, 12.6, and 15.8 kPa (Fig. 8 and Fig. S13(c)–(f), ESI†), accompanied by the increase in the mass loss value of the second mass loss step with increasing p(H2O) value. All series of TG–DTG curves at different β values under individual atmospheric p(H2O) conditions were subjected to kinetic analysis through MDA and KDA, as is the case for the reaction in a stream of dry N2. The kinetic calculations of MDA are detailed in ESI† (Section S4: Fig. S14–S48 and Tables S5–S11).
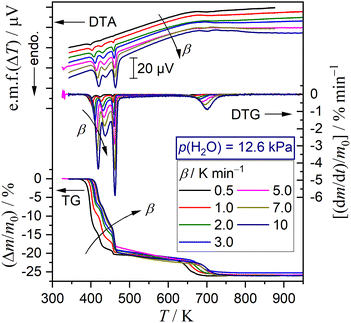 |
| | Fig. 8 TG–DTG–DTA curves for the thermal dehydration of DCPD (63–75 μm; m0 = 5.03 ± 0.07 mg) at different β values in a stream of N2–H2O mixed gas (qv = 200 cm3 min−1) with p(H2O) = 12.6 kPa. | |
Fig. 9 shows the results of KDA for the reaction at p(H2O) = 12.6 kPa, whereas those for the reactions at the other p(H2O) values are shown in Fig. S49–S54 (ESI†). Irrespective of p(H2O) and β values, the multistep dehydration process was nearly perfectly fitted with the cumulative kinetic equation (eqn (5)) as five-step process with R2 being greater than 0.99 (Fig. 9(a) and Fig. S49(a)–S54(a), ESI†). Table 2 lists the optimized kinetic parameters for the reactions at p(H2O) = 12.6 kPa, whereas those for the reactions at the other p(H2O) values are summarized in Tables S12–S17 (ESI†). The variations in the optimized ci values with β are illustrated in Fig. 9(b) and Fig. S49(b)–S54(b) (ESI†). The border between the thermal dehydration of DCPD to form DCPA and of DCPA to form γ-CPP was positioned midway through the fourth step at all p(H2O) and β values, as was the case of the reaction in a stream of dry N2. The variation in ci values with β was observed for the reaction steps attributed to the thermal dehydration of DCPD to form DCPA. The increase in the c1 value with increasing β and the compensative decrease in the c3 value observed for the reactions in a stream of dry N2 were maintained for the reactions at p(H2O) = 1.2 kPa (Fig. S49(b), ESI†). However, at p(H2O) = 2.9 kPa, no significant changes in all ci values with β were observed (Fig. S50(b), ESI†). Meanwhile, at p(H2O) values greater than 2.9 kPa, the reverse phenomena of decreasing c1 and increasing c3 values with increasing β were evident (Fig. 9(b) and Fig. S51(b)–S54(b), ESI†). Despite the variations in ci values depending on β, the Arrhenius parameters, i.e., Ai and Ea,i, and kinetic exponents in SB(mi, ni, pi) were practically invariant as expected from the standard deviation of the individual kinetic parameters averaged over different β values.
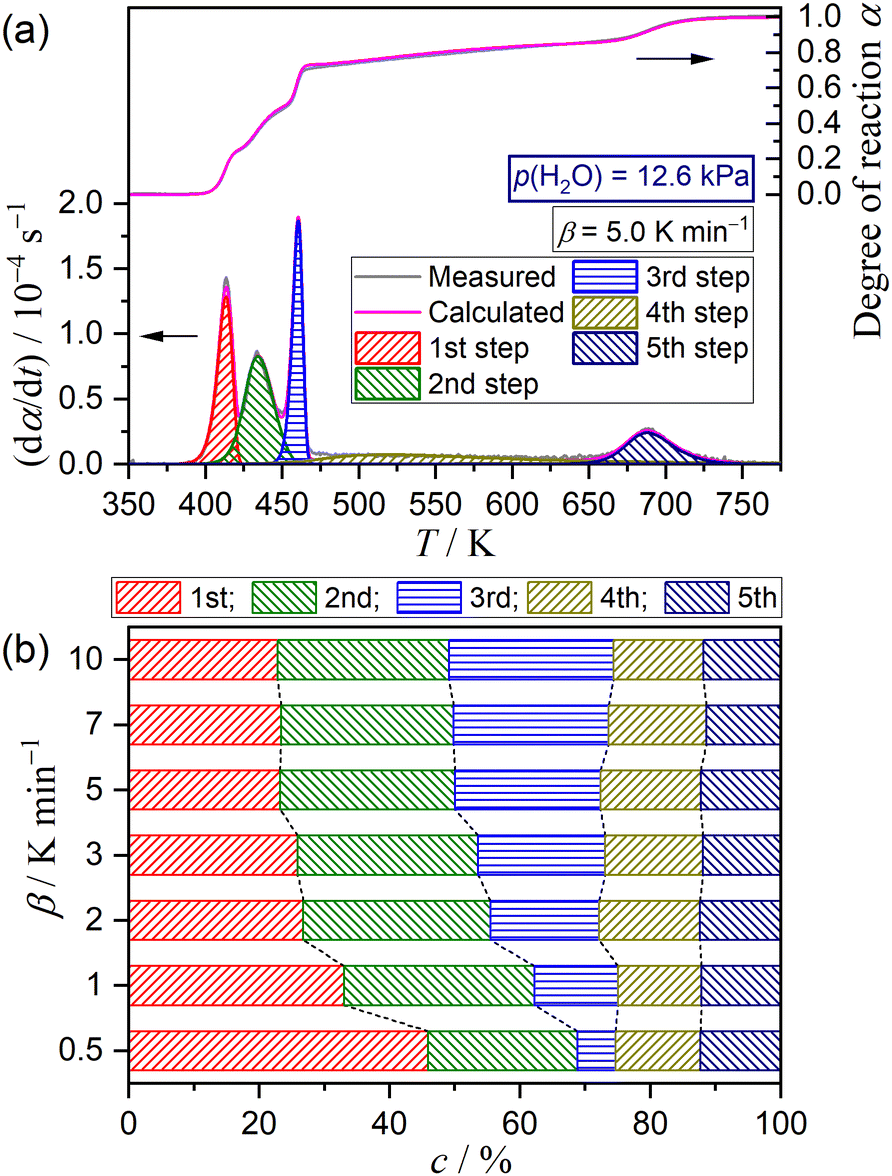
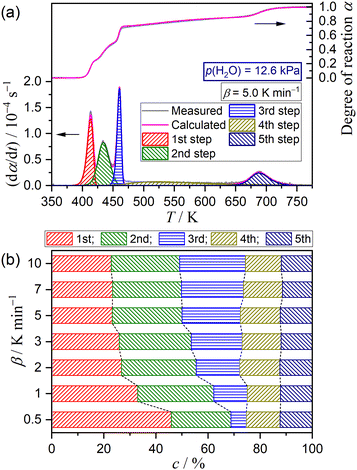 |
| | Fig. 9 Results of KDA for the multistep thermal dehydration of DCPD (63–75 μm) in a stream of N2–H2O mixed gas with p(H2O) = 12.6 kPa: (a) typical fitting results for the overall reaction under linear nonisothermal conditions at a β of 5 K min−1 and (b) contributions of individual steps at various β values. | |
Table 2 Optimized kinetic parameters for each reaction step of the partially overlapping five-step mass loss process of the thermal dehydration of DCPD (63–75 μm) in a stream of N2–H2O mixed gas with p(H2O) = 12.6 kPa, averaged over different β values
|
i
|
c
i
|
E
a,i/kJ mol−1 |
A
i
/s−1 |
SB(mi, ni, pi) |
R
2a |
|
m
i
|
n
i
|
p
i
|
|
Determination coefficient of the nonlinear least-squares analysis of the KDA.
c
1 + c2 + c3.
|
| 1 |
0.74 ± 0.02b |
191.3 ± 0.3 |
(2.16 ± 0.07) × 1022 |
−0.43 ± 0.02 |
1.16 ± 0.10 |
0.83 ± 0.04 |
0.9940 ± 0.0057 |
| 2 |
|
250.3 ± 0.3 |
(1.80 ± 0.01) × 1028 |
3.70 ± 0.13 |
0.39 ± 0.01 |
−3.57 ± 0.08 |
| 3 |
|
886.4 ± 0.6 |
(8.25 ± 0.28) × 1098 |
−2.24 ± 0.14 |
1.90 ± 0.07 |
1.92 ± 0.17 |
| 4 |
0.14 ± 0.02 |
172.7 ± 10.4 |
(4.27 ± 0.02) × 1014 |
21.4 ± 0.80 |
−3.14 ± 0.38 |
−22.6 ± 0.59 |
| 5 |
0.12 ± 0.01 |
238.3 ± 1.0 |
(1.23 ± 0.01) × 1016 |
2.98 ± 0.16 |
0.66 ± 0.06 |
−2.51 ± 0.15 |
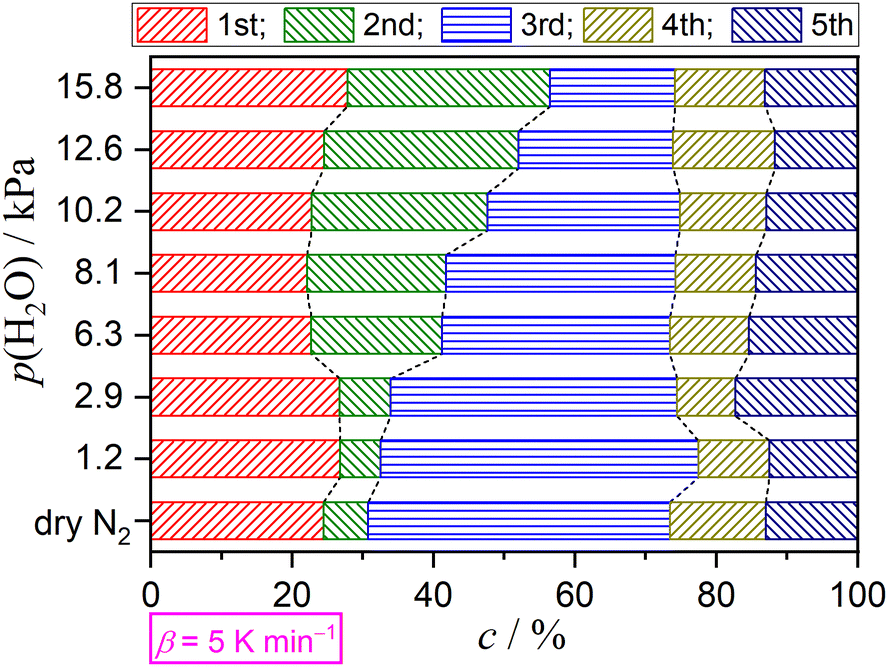
Variations in the contributions of individual steps, obtained from KDA, were rearranged as a function of p(H2O) at a fixed β value, as depicted in Fig. 10 for the reactions at a β value of 5 K min−1. The same comparison at different β values is presented in Fig. S55–S60 (ESI†). At all β values, a systematic increase in the contribution of the second step accompanied by a systematic decrease in the contribution of the third step was observed with increasing p(H2O) value. The systematicity of the variations in the initial three steps, corresponding to the thermal dehydration of DCPD to form DCPA, was more clearly observed by focusing on the increase in the sum of the contributions of the first and second steps versus the decrease in the contribution of the third step. Notably, the contributions of the fourth and fifth steps were practically invariant irrespective of the p(H2O) value.
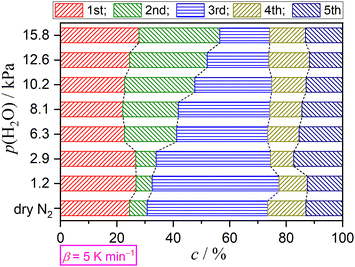 |
| | Fig. 10 Variations in the contributions of component steps with p(H2O) value at a β value of 5 K min−1. | |
3.4 Multistep kinetics of the thermal dehydration of DCPD to form DCPA
Based on the results of formal kinetic analysis for the overall multistep process of the thermal dehydration of DCPD to form γ-CPP, the thermal dehydration of DCPD to form DCPA comprises three reaction steps. The kinetic behavior is characterized by the variations in the contributions of each reaction step depending on β and p(H2O) values. The kinetic and mechanistic interpretations of the process require additional information about different physico-chemical and morphological views.
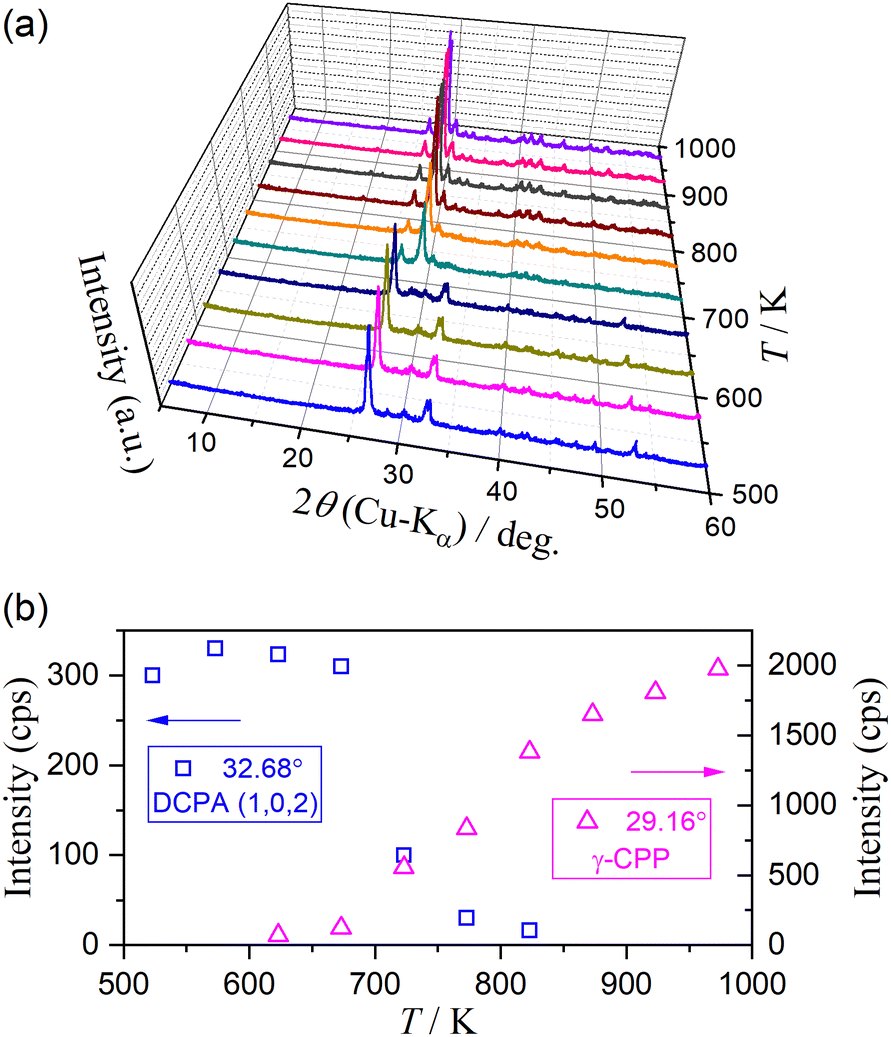
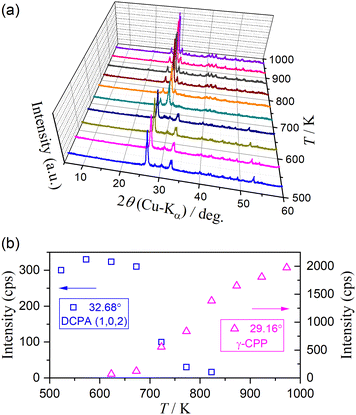
Fig. 11 shows the HTXRD results of the DCPD sample during stepwise isothermal heating in the temperature range for the thermal dehydration of DCPD to form DCPA (373–523 K) in a stream of dry N2. The intensity of diffraction peaks attributed to DCPD gradually decreased as the temperature increased and completely disappeared in the temperature range of 473–483 K (Fig. 11(a)). Conversely, the diffraction peaks attributed to DCPA gradually grew, and the XRD pattern changed to that of the single DCPA phase at 483 K. However, the variations in the intensity of the diffraction peaks attributed to DCPD and DCPA with temperature did not exhibit smooth traces (Fig. 11(b)). In the initial stage of the reaction between 383 K and 413 K, a decrease in the peak intensity of DCPD and an increase in that of DCPA were observed, corresponding to the first mass loss step. Afterward, the intensity of DCPD linearly decreased with increasing temperature between 413 K and 453 K, whereas the peak intensity of DCPA remained almost constant. Therefore, during the second mass loss step with a limited contribution in a stream of dry N2, the destruction of the DCPD crystal structure continues, but the formation of the crystalline DCPA phase is restricted, indicating the possible formation of an amorphous phase. The formation of an amorphous phase during the thermal dehydration of DCPD to form DCPA has been reported by Dosen and Giese based on detailed XRD pattern analysis.12 On further heating, the diffraction peaks of DCPD disappeared between 453 K and 483 K, which is compensated by the increase in the diffraction peaks of DCPA. Thus, the rapid mass loss observed at the third mass loss step is accompanied by the rapid crystallographic change from DCPD to DCPA. Notably, it was reported that an amorphous DCPA phase also forms at the third mass loss step, which contains free water molecules trapped in the highly disordered DCPA structure.12
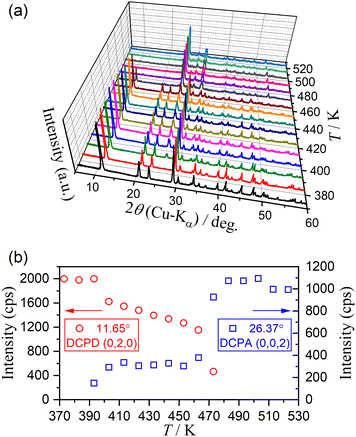 |
| | Fig. 11 Change in the XRD pattern of DCPD (63–75 μm) during the stepwise isothermal heating in a stream of dry N2: (a) XRD patterns at different temperatures, and (b) variation in the intensity of selected diffraction peaks of DCPD at (0, 2, 0) and DCPA at (0, 0, 2). | |
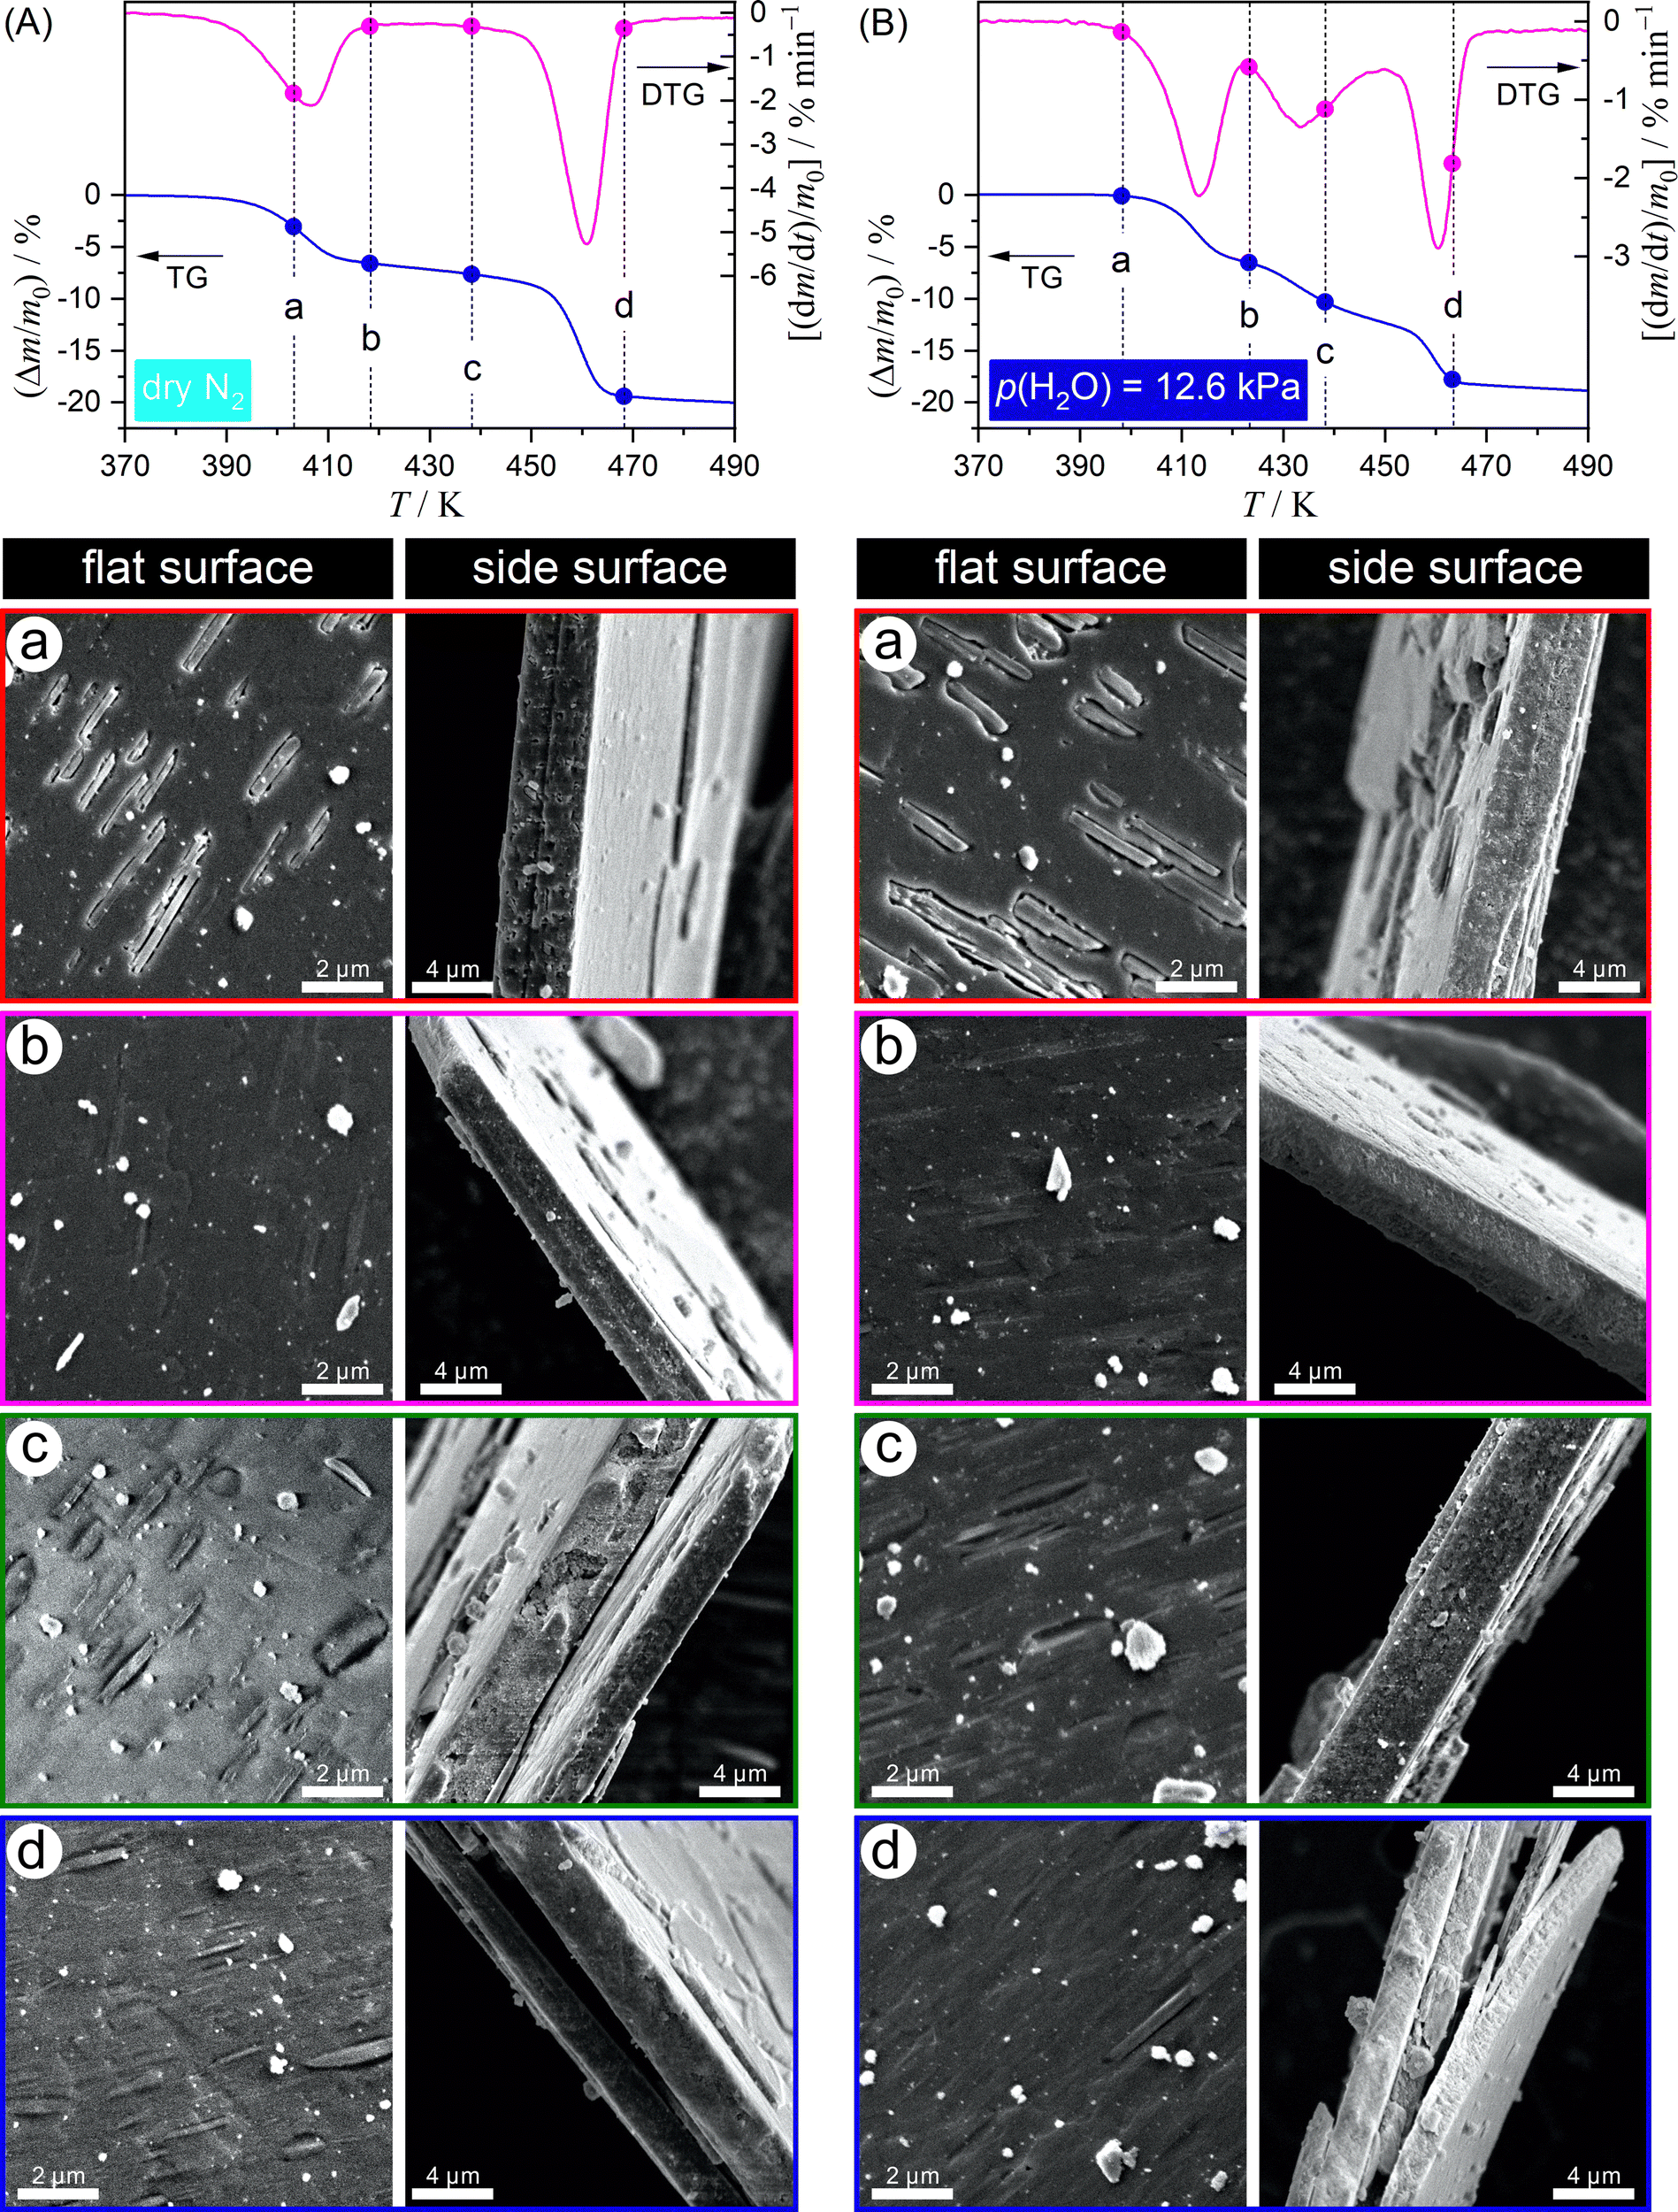
Fig. 12 shows the surface morphology of sample particles treated by heating to different temperatures within the temperature range of the thermal dehydration of DCPD to form DCPA at a β of 5 K min−1 in a stream of dry N2 (Fig. 12(A)) and N2–H2O mixed gas with p(H2O) = 12.6 kPa (Fig. 12(B)). In a stream of dry N2, many voids appeared on the flat surface of the plate-like particles during the first mass loss step, which align to the particular direction (Fig. 12(A)-a). Besides, no detectable changes were detected on the edge surface. Therefore, the thermal dehydration of DCPD was initiated on the flat surface, and the voids were formed by the volume shrinkage of the surface product layer. At the end of the first mass loss step (Fig. 12(A)-b), the flat surface was reconstructed by repairing the voids. At this stage, all flat surfaces were expected to be covered with the surface product layer, which disturbs the diffusional removal of water vapor produced by the reaction inside the particles and retardates the mass loss rate. During the second mass loss step (Fig. 12(A)-c), voids were reproduced on the flat surfaces. Thus, the thermal dehydration during the second mass loss step seems to occur slowly accompanied by water vapor diffusion via the voids as the diffusion channel. The third mass loss step characterized by a rapid mass loss was accompanied by the cleavage of plate-like particles into slices (Fig. 12(A)-d). This phenomenon could have resulted from the increase in the internal pressure of the particles due to water vapor generated by thermal dehydration. Thus, the third mass loss stage is characterized by the rapid release of water vapor trapped in the particles by the cleavage and subsequent thermal dehydration of the slices.
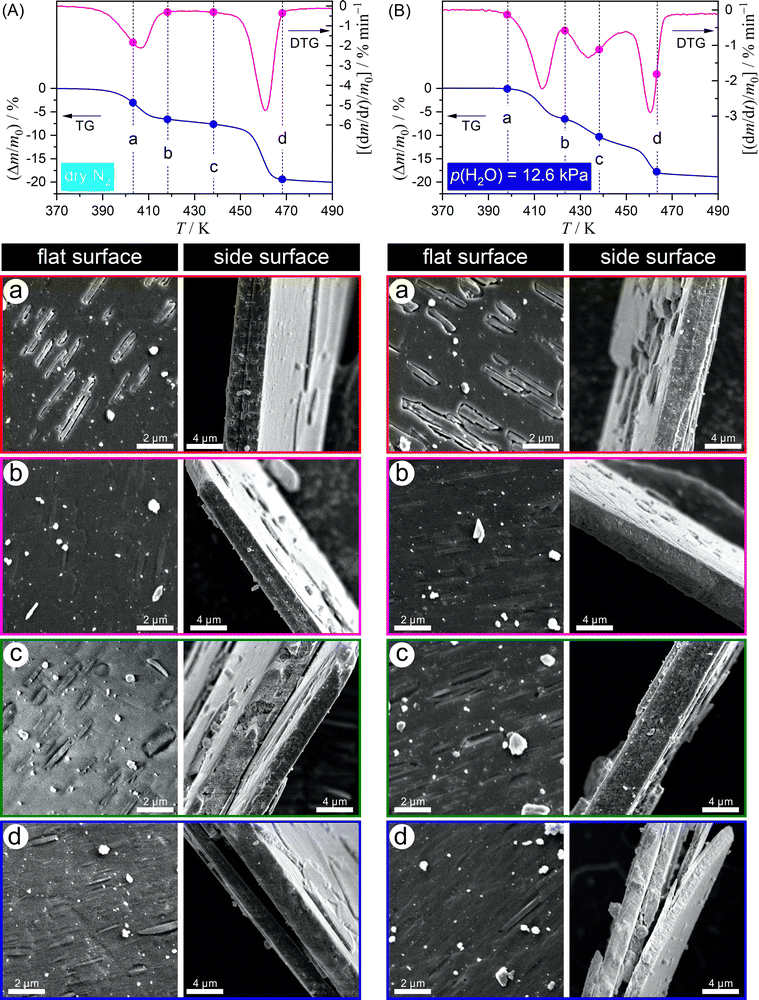 |
| | Fig. 12 Changes in the surface morphology of sample particles during the thermal dehydration of DCPD (63–75 μm) to form DCPA in a stream of dry N2 (A) and N2–H2O mixed gas with p(H2O) = 12.6 kPa (B): (A)-a: 403 K; (A)-b: 418 K; (A)-c: 438 K; (A)-d: 468 K; (B)-a: 398 K; (B)-b: 423 K; (B)-c: 438 K; (B)-d: 463 K. | |
The pattern of the morphological changes during the thermal dehydration of DCPD to form DCPA in a stream of N2–H2O mixed gas (Fig. 12(B)) was practically the same as that in a stream of dry N2: (1) the reaction of flat surfaces in the first mass loss step (Fig. 12(B)-a); (2) the reconstruction of the plate surface by the formation of the surface product layer at the end of first mass loss step (Fig. 12(B)-b); (3) the diffusional removal of water vapor produced inside the particles via the voids reproduced in the surface product layer during the second mass loss step (Fig. 12(B)-c); (4) the cleavage of the plate-like particles into slices accompanied by the escape of water vapor trapped in the particles (Fig. 12(B)-d). The increase in the contribution of the second mass loss step with increasing p(H2O) shows that the reproduction of voids in the surface product layer is enhanced by atmospheric water vapor. The surface product layer may be a construction comprising crystalline and amorphous DCPA. The enhancement of the crystallization of amorphous DCPA by atmospheric water vapor can be one possible cause of the reproduction.
It is evident from the present findings that the multistep thermal dehydration of DCPD to form DCPA is constrained by the physico-geometrical factors of the solid-state reaction. In addition, the variations in the kinetic behavior and contributions of individual mass loss steps should be interpreted by considering the formation of amorphous DCPA during thermal dehydration and its changes by the effects of β and p(H2O). The formation ratio of amorphous DCPA against crystalline DCPA increases with decreasing β.12 The increase in the contribution of the second mass loss step with increasing p(H2O) indicates the enhancement of the crystallization of amorphous DCPA.
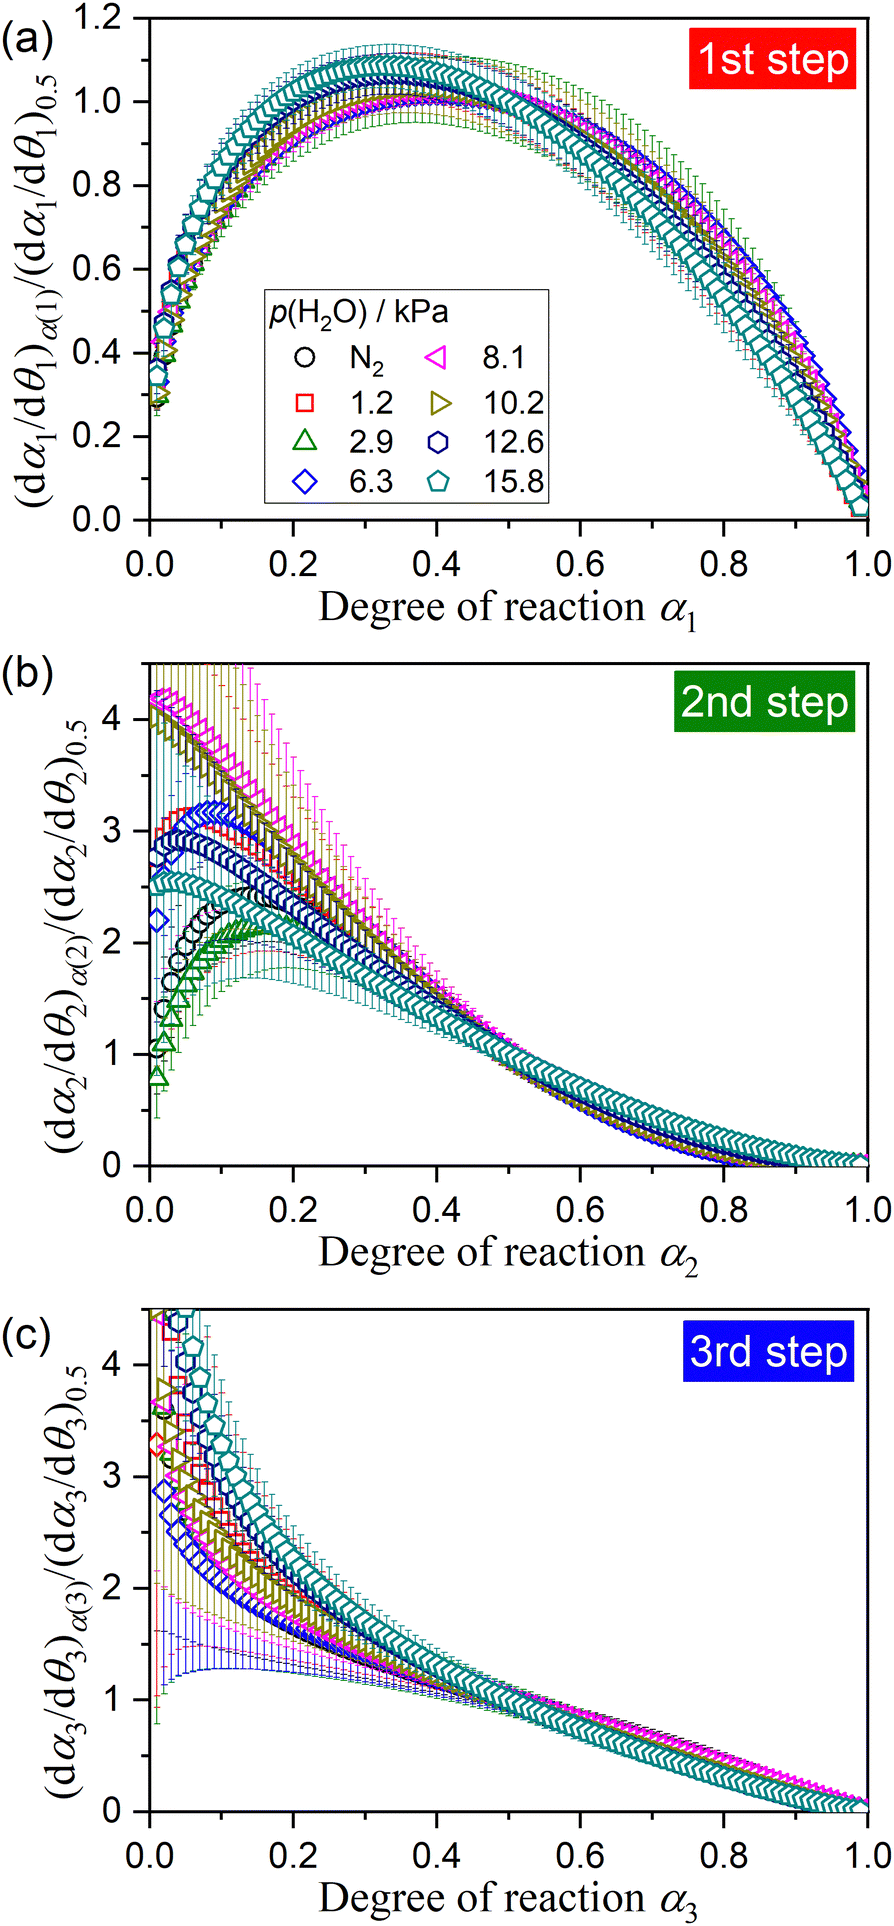
For interpreting the kinetic behavior of individual mass loss steps of the thermal dehydration of DCPD to form DCPA, an experimental master plot of (dαi/dθi)α(i)/(dαi/dθi)0.5versus αi57–62 was drawn for each mass loss step under individual atmospheric p(H2O) values by calculating dα/dθ value according to eqn (S2) in ESI,† using the optimized kinetic exponents in SB(m, n, p) (Tables 1, 2, and S12–S17, ESI†), as depicted in Fig. 13. Irrespective of the atmospheric p(H2O) value, the experimental master plot for the first mass loss step, i.e., (dα1/dθ1)α(1)/(dα1/dθ1)0.5versus α1, exhibited a maximum rate midway through the first mass loss step (Fig. 13(a)). The process is explained by the reaction in the flat surface of the plate-like sample particles to form the surface product layer. Such a process can be described by a nucleation and growth-type model known as Johnson–Mehl–Avrami–Erofeev–Kolmogorov (JMA(m)) equation:65–68
| | | f(α) = m(1 − α)[−ln(1 − α)]1−1/m, | (9) |
where
m is called the Avrami parameter. The nonlinear least-squares analysis for fitting the experimental master plot for the first mass loss step using the JMA(
m) equation provided a statistically significant correlation with the determination coefficient (
R2) greater than 0.99 irrespective of the
p(H
2O) value, from which the average kinetic exponent of
m = 1.8 ± 0.2 was optimized. The model fitting indicates the instant nucleation and two-dimensional growth of nuclei as the possible mechanism of the surface reaction process (the first mass loss step). The apparent
Ea,1 and
A1 values optimized for the first mass loss step
via KDA (
Tables 1, 2, and S12–S17, ESI
†) were systematically increased with increasing
p(H
2O) value: (
Ea,1/kJ mol
−1,
A1/s
−1) = (121.3 ± 0.2, (5.15 ± 0.06) × 10
13) in a stream of dry N
2 and (190.3 ± 0.4, (1.47 ± 0.12) × 10
22) at
p(H
2O) = 15.8 kPa. The variations in the apparent Arrhenius parameters with
p(H
2O) value and the systematic shift of the thermoanalytical curves to higher temperature with increasing
p(H
2O) observed for the first reaction step indicate the kinetic features controlled by bimodal of temperature and
p(H
2O) values. The second mass loss step is characterized by the reproduction of a possible diffusion path on the flat surface covered by the product layer. The experimental master plot for the second mass loss process (
Fig. 13(b)) exhibited a maximum rate at the early stage of the reaction and subsequent deceleration with a concave shape irrespective of atmospheric
p(H
2O). Therefore, the second mass loss step is controlled by the diffusion of water vapor generated inside the particles through the regenerated diffusion channels in the surface product layer on the flat surface. The diffusion path in the surface product layer is inactivated by increasing the thickness of the layer as the reaction proceeds. The apparent
Ea,2 and
A2 values (
Tables 1, 2, and S12–S17, ESI
†) also systematically increased with increasing
p(H
2O) value: (
Ea,2/kJ mol
−1,
A2/s
−1) = (153.1 ± 4.3, (5.29 ± 0.02) × 10
16) in a stream of dry N
2 and (250.8 ± 0.4, (1.49 ± 0.05) × 10
28) at
p(H
2O) = 15.8 kPa. The third mass loss step is triggered by the cleavage of the flat particles, and the subsequent mass loss process is controlled by diffusion, as expected from the deceleration behavior with a concave shape in the experimental master plots (
Fig. 13(c)). Unrealistic large
Ea,3 and
A3 values should be interpreted as superficial values because the third mass loss step can not be described as an ideal chemical process.
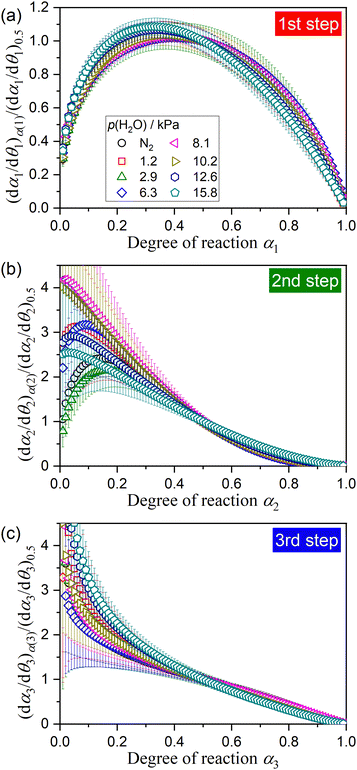 |
| | Fig. 13 Normalized experimental master plots for the individual mass loss steps of the thermal dehydration of DCPD (63–75 μm) to form DCPA at various atmospheric p(H2O) values: (a) first, (b) second, and (c) third mass loss steps. | |
3.5 Multistep kinetics of the thermal dehydration of DCPA to form γ-CPP
The subsequent reaction of the thermal dehydration of DCPA to form γ-CPP is composed of two mass loss steps assigned as the fourth and fifth steps. Notably, the contributions of c4 and c5 were practically invariant irrespective of β and p(H2O) values. Fig. 14 depicts the change in the XRD pattern while heating the sample in the temperature range of the fourth and fifth mass loss steps. The variation in the XRD pattern from DCPA to γ-CPP was observed in the temperature range of 573–873 K (Fig. 14(a)). The intensity of the XRD peak attributed to DCPA initially increased in the temperature range of the fourth mass loss step, indicating the crystallization of the amorphous portion of DCPA. Therefore, the fourth mass loss step includes the removal of water molecules, trapped in the amorphous DCPA during its crystallization, which is consistent with the previous observations (Fig. 6, 9(b) and S49(b)–S54(b), S57–S60, ESI†) of the positioning of the calculated mass loss value to form DCPA midway through the fourth mass loss step. The intensity of the XRD peak attributed to DCPA systematically decreased in the temperature range of the fifth mass loss step (Fig. 14(b)), which was accompanied by the increase in the intensity of the XRD peaks attributed to γ-CPP. The mass loss process was terminated at the temperature at which the XRD peaks of DCPA disappeared. However, the increase in the peak intensity of γ-CPP was continuously observed at higher temperatures after the mass loss process was completed, indicating the formation of a poorly crystalline CPP phase during the fifth mass loss step. Fig. S61 (ESI†) shows the experimental master plots for the fifth mass loss step at different p(H2O) values. At lower p(H2O) values (≤2.9 kPa), the experimental master plots exhibited a deceleration process with a concave shape, which is described by a diffusion-controlled kinetic behavior. At higher p(H2O) values (≥6.3 kPa), the initial acceleration stage appeared, and the maximum reaction rate was observed midway through the reaction at approximately α5 = 0.1. This indicates that the contribution of the surface reaction process to the overall dehydration in the fifth step becomes significant at higher p(H2O) values.
 |
| | Fig. 14 Changes in XRD pattern while heating the sample in the temperature range of fourth and fifth mass loss steps: (a) XRD patterns at different temperatures and (b) changes in the peak intensity of DCPA and γ-CPP. | |
Fig. S62 (ESI†) shows the changes in the XRD pattern while heating the sample in the higher temperature range after the fifth mass loss step was completed. The intensity of XRD peaks attributed to γ-CPP continuously increased until the sample temperature reached 853 K, and this intensity was maintained at the higher temperatures. Fig. 15 shows the DSC curves of DCPD sample recorded at different β values in a stream of dry N2. After the disappearance of the endothermic peak corresponding to the fifth mass loss step, a distinguishable exothermic peak attributed to the crystal growth of poorly crystalline γ-CPP produced by the fifth mass loss step was observed in the temperature range of 750–850 K, as reported by a previous study.2 The enthalpy change during the crystal growth was invariant of β and determined to be 20 ± 1 kJ (mol γ-CPP)−1.
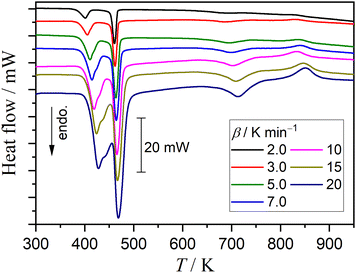 |
| | Fig. 15 DSC curves of DCPD sample (63–75 μm; m0 = 10.01 ± 0.02 mg) recorded at different β values in a stream of dry N2. | |
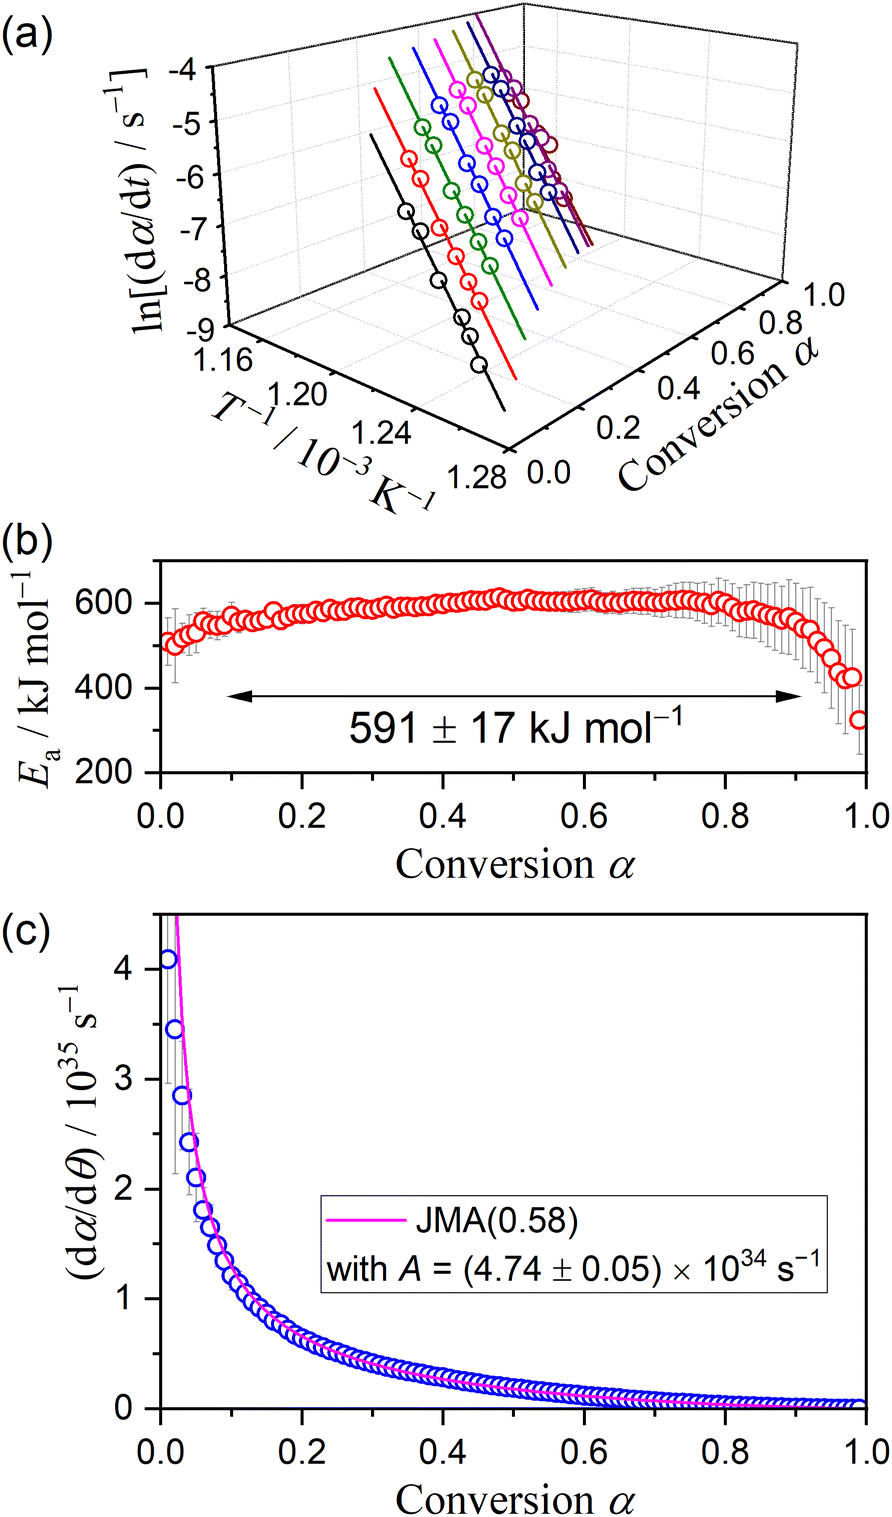
Fig. 16 shows the results of the formal kinetic analysis for the crystal growth of γ-CPP. The Friedman plot exhibited a statistically significant linear correlation irrespective of α (Fig. 16(a)). The slope was approximately constant during the major part (0.1 ≤ α ≤ 0.9), yielding an average Ea value of 591 ± 17 kJ mol−1 (Fig. 16(b)). The experimental master plot based on the single-step assumption exhibited a deceleration behavior with a significant concave shape as the crystal growth advanced (Fig. 16(c)). The experimental master plot was satisfactorily fitted using the JMA(m) equation with m = 0.58 ± 0.01 and A = (4.74 ± 0.05) × 1034 s−1, indicating one-dimensional growth of pre-existing nuclei controlled by diffusion.65–68
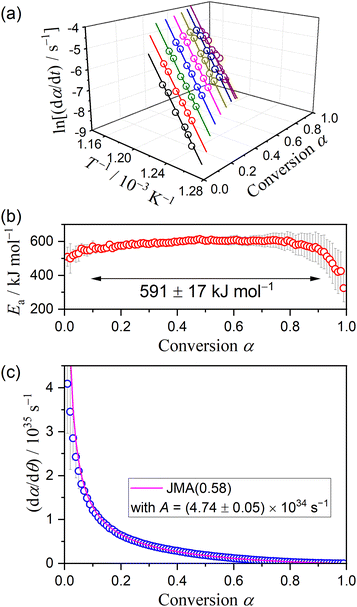 |
| | Fig. 16 Results of the formal kinetic analysis for the crystal growth of γ-CPP: (a) Friedman plot at various α, (b) Ea values at different α, and (c) experimental master plot and fit curve using JMA(0.58). | |
4. Conclusions
The thermal dehydration of DCPD with plate-like particle shape occurred in five mass loss steps to form γ-CPP via DCPA including two intermediate steps (i = 2 and 4) positioned between three major steps (i = 1, 3, and 5). The first three mass loss steps were attributed to the thermal dehydration of crystalline water to form the anhydride (DCPA), whereas the fourth and fifth mass loss steps were mainly due to the dehydration of DCPA to form poorly crystalline γ-CPP. The respective contributions of the first three mass loss steps varied with β and atmospheric p(H2O), whereas the sum of the contributions of the first three mass loss steps remained nearly constant. The contribution of the first mass loss step increased with increasing β at lower p(H2O) values (<2.9 kPa), but the opposite trend was observed at higher p(H2O) (>2.9 kPa). Meanwhile, a systematic increase in the contribution of the second mass loss step was obvious with increasing atmospheric p(H2O). Despite the variations in the contributions of the first three mass loss steps with β, the kinetics of the individual mass loss steps were practically invariant. The first mass loss step occurred on the flat surface of DCPD particles by nucleation and growth, where the Ea,1 value systematically increased from approximately 121 to 190 kJ mol−1 with increasing atmospheric p(H2O) from a dry N2 stream to a mixed N2–H2O gas stream with p(H2O) = 15.8 kPa. The second mass loss step was controlled by the diffusional removal of the evolved water vapor via voids produced on the flat surfaces of the sample particles, where the void production was promoted by atmospheric p(H2O). The second mass loss step was characterized by Ea,2 value increasing from 153 to 251 kJ mol−1 with increasing the atmospheric p(H2O) from in a dry N2 stream to a mixed N2–H2O gas stream with p(H2O) = 15.8 kPa. The enhancement of the second mass loss step by atmospheric p(H2O) was interpreted as being caused by the enhancement of the crystallization of the amorphous DCPA portion in the surface product layer. The third mass loss step characterized by the rapid process was accompanied by the cleavage of plate-like particles into slices. Therefore, the mass loss occurred by the rapid escape of water vapor trapped in the particles and the dehydration of the newly formed surfaces, which could not be described as an ideal chemical process and exhibited an unrealistic large Ea,3 value. The fourth and fifth mass loss steps were attributed to the thermal dehydration of DCPA to form γ-CPP, which was not sensitively influenced by atmospheric p(H2O). Because the calculated mass loss value for the thermal dehydration of DCPD to form DCPA was observed midway through the fourth mass loss step, the dehydration of the trapped water vapor in the amorphous portion of DCPA was expected to partially contribute to the fourth mass loss step. The subsequent thermal dehydration of DCPA to form γ-CPP was observed as the fifth mass loss step. The thermal dehydration of DCPA was defined as a diffusion-controlled process. With increasing atmospheric p(H2O), the contribution of the surface reaction process in the initial stage of the fifth mass loss step became obvious, and the Ea,5 value tended to decrease slightly. On further heating, the crystal growth of the poorly crystalline γ-CPP occurred with a unique exothermic effect, and the crystal growth process was described by the one-dimensional growth of pre-existing nuclei controlled by diffusion with an Ea value of approximately 590 kJ mol−1. In conclusion, the multistep thermal dehydration of DCPD to form γ-CPP via DCPA is significantly controlled by the physico-geometrical constraints of the reaction, where the formation of amorphous DCPA intermediate and poorly crystalline γ-CPP and these crystallizations during the thermal dehydration process play an important role in regulating the physico-geometrical constraints.
Conflicts of interest
There are no conflicts of interest to declare.
Acknowledgements
The present work was supported by JSPS KAKENHI Grant Numbers 19K02708, 22H01011, and 22K02946.
References
- M. Takahashi and H. Uekusa, J. Pharm. Sci., 2022, 111, 618–627 CrossRef CAS PubMed.
- J. G. Rabatin, R. H. Gale and A. E. Newkirk, J. Phys. Chem., 1960, 64, 491–493 CrossRef CAS.
- M. C. Ball and M. J. Casson, J. Chem. Soc., Dalton Trans., 1973, 34–37 RSC.
- G. Berend and A. J. Hegedüs, Thermochim. Acta, 1975, 11, 367–379 CrossRef CAS.
- M. Landín, R. C. Rowe and P. York, Eur. J. Pharm. Sci., 1994, 2, 245–252 CrossRef.
- M. Landín, R. C. Rowe and P. York, Int. J. Pharm., 1994, 104, 271–275 CrossRef.
- L.-K. Lin, J.-S. Lee, C.-K. Hsu, P.-F. Huang and H.-T. Lin, Anal. Sci., 1997, 13, 413–418 CrossRef CAS.
- A. O. McIntosh and W. L. Jablonski, Anal. Chem., 1956, 28, 1424–1427 CrossRef CAS.
- D.-G. Dumitraş, Ş. Marincea and A. M. Fransolet, N. Jb. Miner. Abh., 2004, 180, 45–64 CrossRef.
- T. Miyazaki, K. Sivaprakasam, J. Tantry and R. Suryanarayanan, J. Pharm. Sci., 2009, 98, 905–916 CrossRef CAS PubMed.
- R. L. Frost and S. J. Palmer, Thermochim. Acta, 2011, 521, 14–17 CrossRef CAS.
- A. Dosen and R. F. Giese, Am. Mineral., 2011, 96, 368–373 CrossRef CAS.
- A. M. Kaushal, V. R. Vangala and R. Suryanarayanan, J. Pharm. Sci., 2011, 100, 1456–1466 CrossRef CAS PubMed.
- A. D. Anastasiou, C. L. Thomson, S. A. Hussain, T. J. Edwards, S. Strafford, M. Malinowski, R. Mathieson, C. T. A. Brown, A. P. Brown, M. S. Duggal and A. Jha, Mater. Des., 2016, 101, 346–354 CrossRef CAS.
- A. D. Anastasiou, M. Nerantzaki, A. P. Brown, A. Jha and D. N. Bikiaris, Mater. Des., 2019, 168, 107661 CrossRef CAS.
- M. El Hazzat, A. El Hamidi, M. Halim and S. Arsalane, Materialia, 2021, 16, 101055 CrossRef CAS.
- R. Mulongo-Masamba, T. El Kassri, M. Khachani, S. Arsalane, M. Halim and A. El Hamidi, J. Therm. Anal. Calorim., 2015, 124, 171–180 CrossRef.
- T. V. Safronova, I. S. Sadilov, K. V. Chaikun, T. B. Shatalova and Y. Y. Filippov, Russ. J. Inorg. Chem., 2019, 64, 1088–1094 CrossRef CAS.
- M. S. Djošić, V. B. Mišković-Stanković, Z. M. Kačarević-Popović, B. M. Jokić, N. Bibić, M. Mitrić, S. K. Milonjić, R. Jančić-Heinemann and J. Stojanović, Colloids Surf., A, 2009, 341, 110–117 CrossRef.
- R. A. Vargas and M. Mosquera, Rev. Mex. Fis., 1993, 39, 450–455 CAS.
- N. W. Wikholm, R. A. Beebe and J. S. Kittelberger, J. Phys. Chem., 1975, 79, 853–856 CrossRef CAS.
- M. El Hazzat, A. Sifou and S. Arsalane, J. Therm. Anal. Calorim., 2022, 147, 9747–9761 CrossRef CAS.
-
A. K. Galwey and M. E. Brown, Thermal Decomposition of Ionic Solids, Elsevier, Amsterdam, 1999 Search PubMed.
- A. K. Galwey, Thermochim. Acta, 2000, 355, 181–238 CrossRef CAS.
- N. Koga and H. Tanaka, Thermochim. Acta, 2002, 388, 41–61 CrossRef CAS.
- H. Tanaka and N. Koga, J. Phys. Chem., 1988, 92, 7023–7029 CrossRef CAS.
- N. Koga and H. Tanaka, J. Phys. Chem., 1994, 98, 10521–10528 CrossRef CAS.
- N. Koga and T. Kimizu, J. Am. Ceram. Soc., 2008, 91, 4052–4058 CrossRef CAS.
- N. Koga, S. Yamada and T. Kimura, J. Phys. Chem. C, 2013, 117, 326–336 CrossRef CAS.
- M. Yoshikawa, S. Yamada and N. Koga, J. Phys. Chem. C, 2014, 118, 8059–8070 CrossRef CAS.
- Y. Aoki, Y. Yamamoto and N. Koga, Phys. Chem. Chem. Phys., 2021, 23, 15107–15118 RSC.
- Y. Aoki and N. Koga, Phys. Chem. Chem. Phys., 2022, 24, 11039–11053 RSC.
-
N. Koga, in Handbook of Thermal Analysis and Calorimetry, ed. S. Vyazovkin, N. Koga and C. Schick, Elsevier, Amsterdam, 2nd edn, 2018, vol. 6, ch. 6, pp. 213–251 Search PubMed.
- S. Vyazovkin, A. K. Burnham, L. Favergeon, N. Koga, E. Moukhina, L. A. Perez-Maqueda and N. Sbirrazzuoli, Thermochim. Acta, 2020, 689, 178597 CrossRef CAS.
- N. Koga, S. Vyazovkin, A. K. Burnham, L. Favergeon, N. V. Muravyev, L. A. Pérez-Maqueda, C. Saggese and P. E. Sánchez-Jiménez, Thermochim. Acta, 2023, 719, 179384 CrossRef CAS.
- N. A. Curry and D. W. Jones, J. Chem. Soc. A, 1971, 3725–3729 RSC.
- J. Xu, I. S. Butler and D. F. R. Gilson, Spectrochim. Acta, Part A, 1999, 55, 2801–2809 CrossRef.
- F. Casciani and R. A. Condrate, Spectrosc. Lett., 2006, 12, 699–713 CrossRef.
- I. Petrov, B. Šoptrajanov, N. Fuson and J. R. Lawson, Spectrochim. Acta, Part A, 1967, 23, 2637–2646 CrossRef CAS.
-
O. T. Toft Sorensen and J. Rouquerol, Sample Controlled Thermal Analysis, Kluwer, Dordrecht, 2003 Search PubMed.
-
J. M. Criado, L. A. Perez-Maqueda and N. Koga, in Thermal Physics and Thermal Analysis, ed. J. Šesták, P. Hubík and J. J. Mareš, Springer Nature, Switzerland, 2017, ch. 2, pp. 11–43 DOI:10.1007/978-3-319-45899-1_2.
- W. A. Denne and D. W. Jones, J. Cryst. Mol. Struct., 1971, 1, 347–354 CrossRef CAS.
- N. C. Webb, Acta Crystallogr., 1966, 21, 942–948 CrossRef CAS.
- H. Eshtiagh-Hosseini, M. R. Houssaindokht, M. Chahkandhi and A. Youssefi, J. Non-Cryst. Solids, 2008, 354, 3854–3857 CrossRef CAS.
- B. C. Cornilsen and R. A. Condrate, J. Inorg. Nucl. Chem., 1979, 41, 602–605 CrossRef CAS.
- S. Vyazovkin, A. K. Burnham, J. M. Criado, L. A. Pérez-Maqueda, C. Popescu and N. Sbirrazzuoli, Thermochim. Acta, 2011, 520, 1–19 CrossRef CAS.
- N. Koga, J. Therm. Anal. Calorim., 2013, 113, 1527–1541 CrossRef CAS.
-
N. Koga, J. Šesták and P. Simon, in Thermal Analysis of Micro, Nano- and Non-Crystalline Materials, ed. J. Šesták and P. Simon, Springer, Dordrecht, 2013, ch. 1, pp. 1–28 Search PubMed.
- H. L. Friedman, J. Polym. Sci., Part C, 1964, 6, 183–195 CrossRef.
- P. E. Sánchez-Jiménez, A. Perejón, J. M. Criado, M. J. Diánez and L. A. Pérez-Maqueda, Polymer, 2010, 51, 3998–4007 CrossRef.
- N. Koga, Y. Goshi, S. Yamada and L. A. Pérez-Maqueda, J. Therm. Anal. Calorim., 2013, 111, 1463–1474 CrossRef CAS.
- J. Šesták and G. Berggren, Thermochim. Acta, 1971, 3, 1–12 CrossRef.
- J. Šesták, J. Therm. Anal., 1990, 36, 1997–2007 CrossRef.
- J. Šesták, J. Therm. Anal. Calorim., 2011, 110, 5–16 CrossRef.
- A. Perejón, P. E. Sánchez-Jiménez, J. M. Criado and L. A. Pérez-Maqueda, J. Phys. Chem. B, 2011, 115, 1780–1791 CrossRef PubMed.
- R. Svoboda and J. Málek, J. Therm. Anal. Calorim., 2013, 111, 1045–1056 CrossRef CAS.
- T. Ozawa, J. Therm. Anal., 1970, 2, 301–324 CrossRef CAS.
- T. Ozawa, J. Therm. Anal., 1986, 31, 547–551 CrossRef CAS.
- J. Málek, Thermochim. Acta, 1992, 200, 257–269 CrossRef.
- N. Koga, Thermochim. Acta, 1995, 258, 145–159 CrossRef CAS.
- F. J. Gotor, J. M. Criado, J. Málek and N. Koga, J. Phys. Chem. A, 2000, 104, 10777–10782 CrossRef CAS.
- J. M. Criado, L. A. Perez-Maqueda, F. J. Gotor, J. Málek and N. Koga, J. Therm. Anal. Calorim., 2003, 72, 901–906 CrossRef CAS.
- T. Ozawa, Bull. Chem. Soc. Jpn., 1965, 38, 1881–1886 CrossRef CAS.
- T. Ozawa, Thermochim. Acta, 1986, 100, 109–118 CrossRef CAS.
- W. A. Johnson and K. F. Mehl, Trans. Am. Inst. Min. Metall. Eng., 1939, 135, 416–458 Search PubMed.
- M. Avrami, J. Chem. Phys., 1939, 7, 1103–1112 CrossRef CAS.
- M. Avrami, J. Chem. Phys., 1940, 8, 212–223 CrossRef CAS.
- M. Avrami, J. Chem. Phys., 1941, 9, 177–184 CrossRef CAS.
Footnote |
| † Electronic supplementary information (ESI) available: S1. Sample characterization (Fig. S1–S4 and Tables S1–S3); S2. Multistep thermal dehydration of DCPD in a stream of dry N2 (Fig. S5–S7); S3. Mathematical deconvolution analysis for the thermal dehydration in a stream of dry N2 (Fig. S8–S12 and Table S4); S4. Kinetic analysis for the thermal dehydration in a stream of N2–H2O mixed gas (Fig. S13–S60 and Tables S5–S17); S5. Multistep kinetics of the thermal dehydration of DCPA to form γ-CPP (Fig. S61 and S62). See DOI: https://doi.org/10.1039/d3cp01323e |
|
| This journal is © the Owner Societies 2023 |
Click here to see how this site uses Cookies. View our privacy policy here. 
 Open Access Article
 This Open Access Article is licensed under a Creative Commons Attribution-Non Commercial 3.0 Unported Licence
 *
*