
 Open Access Article
 This Open Access Article is licensed under a
 Creative Commons Attribution 3.0 Unported Licence
On the use of Monkhorst–Pack scheme to evaluate superconductivity and the issue of umklapp electron–phonon interactions
X. H.
Zheng
 *a and
J. X.
Zheng
b
*a and
J. X.
Zheng
b
aDepartment of Physics, Queen's University of Belfast, BT7 1NN, Northern Ireland, UK. E-mail: xhz@qub.ac.uk
bDepartment of Electrical and Electronic Engineering, Imperial College London, SW7 2AZ, England, UK
First published on 21st April 2023
Abstract
The Monkhorst–Pack scheme is a method to save time in the days of slow computers. It excludes umklapp phonons with significant consequences. Its widespread application to evaluate superconductivity arises from the desire to reduce phonon contributions to solve a historical difficulty of the BCS theory. An alternative method turns out to be more accurate in Pb and Pd.
I. Introduction
In 1957, Bardeen, Cooper and Schrieffer published the famed BCS theory. It leads to a formula to relate TD (Debye temperature) and Tc (transition temperature of superconductors).1 In 1968, Ashcroft predicted metallic hydrogen (TD ∼ 3500 K by estimation) might be a high-temperature superconductor.2 In 2004, Ashcroft recommended hydrogen-dominated metallic alloys as a better alternative because the attainment of metallic states should be well within the current capabilities of diamond anvil cells but at pressures considerably lower than may be necessary for hydrogen.3In 1970, Satterthwaite and Toepke found 8.05 ≤ Tc ≤ 8.35 K in thorium–hydrogen and thorium–deuterium, surprisingly high in the 1970s. It was in a Pyrex enclosure in ambient pressure, with no detectable isotope effect.4 In 1972, Stritzker and Buckel found Tc up to 9 and 11 K in palladium-hydrogen and palladium–deuterium, isotope effect reversed.5 In 2015, Drozdov and colleagues found Tc = 203 K in the sulfur hydride system in a diamond anvil cell under pressure.6 In 2020, Dias and colleagues found Tc ≃ 287 K in a carbonaceous sulfur hydride under pressure,7 retracted by the journal investigating if its style affected the result.
In 1972 and 1978, Ganguly and Papaconstanstopoulos investigated the reversed isotope effect in palladium hydrides theoretically.8,9 In 2020, Semenoka and colleagues reported a rule to predict the maximum Tc for metal hydrides.10 Meanwhile, Flores–Livas and colleagues offered an up-to-date perspective on conventional superconductivity in hydrides at high pressures.11 Very recently, Peng,12 Chen,13 Dou,14 Duan,15 Li16 and colleagues published further results of theoretical studies of superconductivity in compressed hydrides.
In light of the fascinating progress outlined above, we need to consider if the Monkhorst–Pack (MP) scheme is applicable to evaluate the BCS theory. It is a method to save time in the days of slow computers17–19 readily available from popular computer packages such as QUANTUM ESPRESSO.20 It resembles Fourier expansion, but in terms of the so-called “stars”, representing groups of plane waves propagating in the symmetric directions of the lattice. It serves the purpose of “integrating periodic functions of a Bloch wave vector over either the entire Brillouin zone (BZ) or over specified portions”.19 Therefore, by design, it excludes umklapp phonons.
We do not know if anyone has ever extended the MP scheme to include umklapp phonons. On the other hand, in 1994, Savrasov, Savrasov and Andersen stated without ambiguity that, when they calculated electron–phonon coupling strengths and transport properties in Al, Nb and Mo, the phonon integration is over BZ.21 When applied to a semiconductor, their “tetrahedron” method is identical to the MP method.22 They treated Ta, Pb, Mo, V, Cu and Pd similarly.23 Camargo–Martínez and colleagues used the MP scheme to study superconductivity in H3S,24 stating they had knowingly excluded umklapp contributions.25,26 Du and colleagues used the MP scheme to study transition metallic hydrides27 and made a similar statement.28
We believe the practice in21–28 amounts to an answer to the call for reducing phonon contributions to superconductivity to solve a historical difficulty. In the BCS theory, superconductivity arises from the interactions between electrons and phonons.1 In the Drude theory, electrical resistivity arises from the same interactions.29 In both cases, the e–p interactions do not depend on temperature, leaving other considerations to induce temperature dependence of the phenomena. Many tried but failed to find such e–p interactions: whenever the interactions were reasonable in the normal state, they always were too strong in the superconducting state, and vice versa.30–42 In 1977, Peter, Ashkenazi and Dacorogna suggested multiplying the electron–phonon coupling constants by 0.7 in superconductors,36 calling for a reduction of phonon contributions.
But why do we exclude the umklapp phonons? On account of the availability of the MP scheme? On account of the popularity of the practice? We need an adequate reason. In a superconductor, two electron states in a pair have identical occupation probability by symmetry. But they may also have different occupation probabilities when they accommodate electrons driven by normal and umklapp phonons. We devise an alternative scheme to pair superconducting electrons to avoid conflict.43,44 We show it can solve the historical difficulty with high accuracy in Pb and Pd.
We arrange the article as follows. In Sections II to IV, we detail the issue of umklapp phonons and the MP scheme. We explain why the scheme excludes umklapp phonons. We describe the method of Carbotte and Dynes to include umklapp contributions. We also describe the pioneering procedure by Savrasov and Savrasov (S & S) to implement the MP scheme to evaluate superconductivity, together with its recent advances. In Sections VI to VIII, we discuss the historical and theoretical difficulties that oblige us to reduce phonon contributions to superconductivity. In Sections IX to XIII, we discuss the alternative pairing scheme to reduce phonon contributions. We demonstrate its high accuracy in Pb and Pd via detailed calculations. We place brief discussions and conclusions in Sections XIV to XVII.
II. Umklapp phonons: MP scheme
The MP scheme is an alternative to Fourier expansion to present the states of electrons or phonons in BZ in terms of the ‘stars’. In an article in 1973, titled “Mean value point in the Brillouin zone”,17 Baldereschi proposed the formulation | (1) |
 | (2) |
Shortly afterwards, also in 1973, Chadi and Cohen18 proved the following relation:
 | (3) |
In 1976 Monkhorst and Pack19 found the expression
 | (4) |
 | (5) |
The MP scheme is for “integrating periodic functions of a Bloch wave vector over either the entire Brillouin zone (BZ) or over specified portions”.19 Extending the MP scheme to include umklapp phonons will be challenging because we do not know the lattice vector involved in the umklapp process. In Fig. 1, we use the filled squares to mark the MP sample points and the dashed lines to mark the borders of BZ. We show the phonons are periodic only when their momentum is in the direction of the lattice vector. It will not be easy to determine the umklapp phonons under other circumstances.
 | ||
| Fig. 1 Normal and umklapp lead phonons, shaded triangle envelops Debye frequencies and momenta, vertical dashed lines mark borders of BZ. Top: In the (0.77, 0.25, 0.59) direction. Bottom: In the (0, 1, 1) direction, filled squares represent Monkhorst–Pack sample points. | ||
III. Umklapp phonons: CD sphere
To illustrate the difficulty to extend the MP scheme, we present electron–phonon interactions schematically in Fig. 2, where the shaded circles are for spherical Fermi surfaces in the extended zone scheme, Γ the initial state of an electron. We also use A, B, C, D, E and F to present the end states of the electron when scattered by a phonon of momentum q ≤ qD, qD being the Debye momentum. Since Γ, A, and B are in the first BZ, we refer to the events as normal scatterings, others umklapp scatterings. | ||
| Fig. 2 Top: Fermi spheres (shaded circles, radius = kF, first BZ in the S–W corner) and phonons on a spherical surface. An electron is scattered from Γ to A, B (normal scattering) and C, D, E, F (umklapp scattering, folded back to CC, DD, EE, FF in the first BZ). Bottom: Carbotte–Dynes phonon sphere (centre = Γ, radius = 2kF). | ||
We use CC, DD, EE, FF to mark images (replicas) of C, D, E, F, respectively, in the first BZ. A state and its image, say C and CC, have identical coordinates against the centres of the Fermi surfaces they are on. In the previous paragraph, we say a normal phonon drives an electron from Γ to C. Alternatively, we can say an umklapp phonon drives the electron from Γ to CC. Either way, the result is the same in terms of the strength and enumeration of the electron–phonon interactions.
It is apparent that, as long as we have normal phonons to scatter an electron from Γ to C, D, E and F, we can think we have umklapp phonons to scatter the electron from Γ to CC, DD, EE and FF. It is wrong to believe the destination states of the electron are restricted to A and B and the arc in between and conclude that just a portion of the Fermi surface is subject to bombardment by the scattered electrons.
To evaluate the strength of the electron–phonon interactions, we have to count the number of phonons. We have two options. We may choose to follow the open circle in the top part of Fig. 2 to trace the electron states, exemplified by A, B, C, D, E and F, and integrate the phonons. The radius of the circle must vary between 0 and qD. We must keep identifying the electron states from several BZs. It will be a cumbersome and impractical task. Alternatively, we can choose to follow Carbotte and Dynes to integrate A, B, CC, DD, EE and FF, …, in a large sphere enveloping the entire Fermi surface,45 shown in the bottom part of Fig. 2, referred to as the Carbotte–Dynes sphere, or CD sphere for short.
IV. Umklapp phonons: S & S procedure
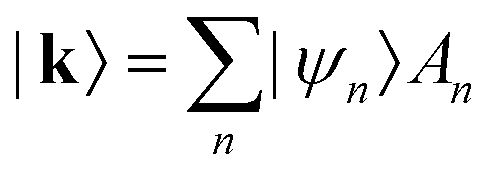
The procedure of Savrasov and Savrasov (S & S) is an early attempt to implement the MP scheme to evaluate superconductivity and electrical resistivity. It starts from the well-established framework of density functional theory (DFT) to find phonons by solving the following matrix eigenvalue equation: | (6) |
where |k〉 is a wave function of the system (marked as |kj〉 originally). It evaluates ε and Veff numerically.22
In 1996, S & S investigated eight metals in ambient.23 Nowadays, DFT calculations can predict a significant portion of the properties of a given material. Given a modest set of elements, it is already possible to predict the thermodynamically stable crystal structures, not only in ambient but also spanning a vast pressure range to terapascals and beyond.46
With the next step, S & S enters untested waters because it is about a “new, generally applicable method for ab initio calculation of the wave-vector dependent electron–phonon coupling”.21 It evaluates
g![[small script l]](https://www.rsc.org/images/entities/i_char_e146.gif) (q) = 〈k + q|δV|k〉 + … (q) = 〈k + q|δV|k〉 + … | (7) |
identifies phonon polarization, k and q stand for electron and phonon momenta. To the best of our knowledge, the authors of ref. 21 were the first to let V in eqn (7) be identical to Veff in eqn (6). It is a significant advance because a pseudopotential is a phenomenological and task-specific entity, not universally applicable. For example, the empty-core model of Slater47 and the muffin-tin model of Ashcroft48 are entirely different and not supposed to be interchangeable.
The final step of the S & S procedure is to integrate the matrix element in eqn (7). They found
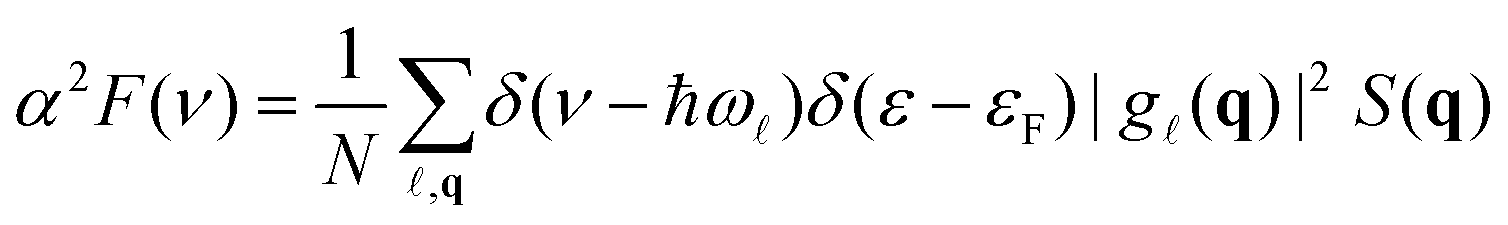 | (8) |
phonon frequency. If we let S(q) = 1 or 0 depending on if q is in the first phonon BZ, then eqn (8) becomes eqn (1) in ref. 21 in every detail. It amounts to a numerical scheme to exclude all the umklapp phonons. We will discuss the physics of α2F(ν) and phonon contributions to it in some detail in Section IX, with S(q) from a different scheme.
S. Y. Savrasov declared that, when applied to a semiconductor, his “tetrahedron method” is identical to the special-point scheme of Monkhorst and Pack.22 It is not clear whether or not S & S had adopted the MP scheme in ref. 23 but Fig. 1 there tells us they probably had employed a 4 × 4 × 4 MP grid to sample the phonons from within BZ for integration.
In Fig. 3 we use the curves to present the S & S α2F(ν) in Pd and Pb sampled from Fig. 1 in ref. 23. We also use the shaded silhouettes to present more accurate examples for comparison. The S & S evaluations are overly strong in both metals. We will further the comparison in the following sections.
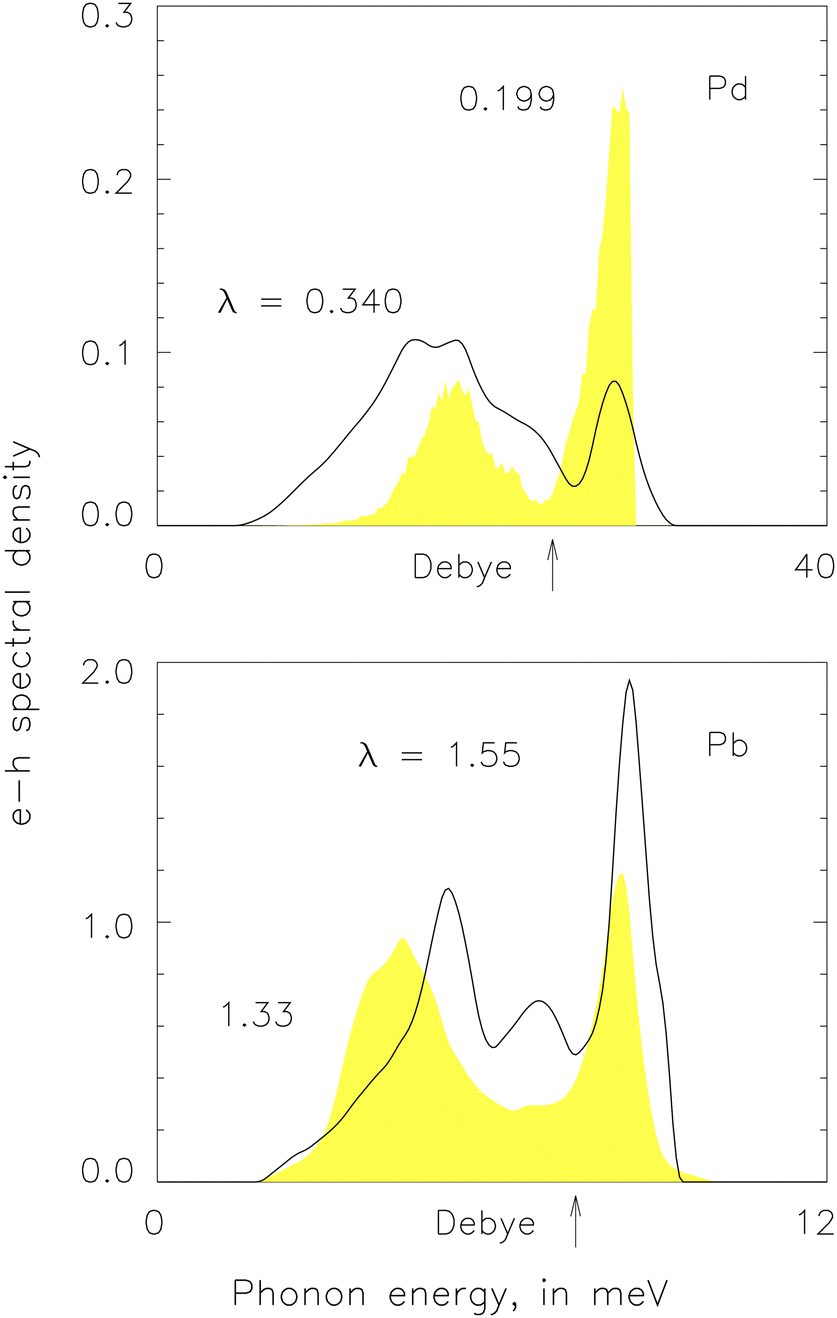 | ||
| Fig. 3 Electron–phonon spectral densities, α2F(ν), in Pd and Pb. Top: From S & S calculation (curve, λ = 0.340) and the alternative scheme (silhouette, λ = 0.199). Bottom: From S & S calculation (curve, λ = 1.55) and McMillan experiment (silhouette, λ = 1.33).49 The S & S evaluations are overly high in both metals. | ||
V. Umklapp phonons: recent advances
In 2019, Camargo-Martínez, González-Pedreros and Baquero studied the pressure effect on high-Tc superconductivity in H3S.24 In response to our enquiry in ref. 50, they confirmed that “the electron–phonon umklapp process has a vital relevance in explaining the behaviour of electrical resistance” but claimed “in the total absence of electrical resistance, …, perhaps an electron that undergoes the umklapp-process will contribute to electrical resistance rather than the superconducting phase”.25 In short, they believe the umklapp process does not contribute much to superconductivity.In a following publication,26 González-Pedreros, Camargo-Martínez and Mesa continued to apply the MP scheme to evaluate superconductivity in D3H. They cited,25,50 claiming that “the presence of umklapp process is mainly associated with the electrical resistivity, which is measured in the normal state and not in the superconductor one”. They announced “Our calculations were considered in the superconducting state, and Umklapp processes have not been included”.
In 2021, Du and colleagues studied high-temperature superconductivity in transition metallic hydrides under pressure.27 They stated that the umklapp phonons “play a key role in explaining the DC conductivity of normal metals”.28 In response to our enquiry,51 they claimed: “the pairing of electrons with opposite momenta, caused by an exchange by virtual optical phonons depends on umklapp phonons if kF ≪ qD.” They also claimed: “if these quantities are of the same order of magnitude, or kF ≫ qD, then pairing occurs without a noticeable contribution of the umklapp phonons”.28 Interestingly, we have kF ≥ 1.145qD when valence ≥3, true in virtually all metallic superconductors, proving the MP scheme is inapplicable.
VI. Pairing difficulty: history
In theory, there is no difference in the interactions between electrons and phonons in the superconducting and non-superconducting states. In history, however, whenever reasonably accurate superconductivity arisen from the first-principles calculation, electrical resistivity always turned out to be too weak and vice versa.In an early example, Tomlinson and Carbotte in 1976 evaluated α2F(ν) for lead with the pseudopotential of Appappillai and Williams, which is a specification of the Heine–Abarenkov potential.30 The agreement with tunnelling measurements was considered to be “very good”52 although the longitudinal numerical peak of α2F(ν) at 9 meV is more than 2 times stronger than the observed tunnelling peak. It is not clear if correct Tc would arise from the first-principles α2F(ν).
Soon after, in 1977, Tomlinson and Carbotte evaluated the electrical resistivity, ρ(T), for lead with the same potential.31 Between T = 4 and 295 K, their ρ(T) is about 75% of the observed values, as is shown clearly in the graphic portrayal of the result in 1981 by Eiling and Schiling.32 A similar discrepancy occurred in aluminium (Heine–Abarenkov potential tabulated by Harrison, discrepancy in electrical resistivity obscured by logarithmic scaling).33–35
Also in 1977, Peter, Ashkenazi and Dacorogna studied the effects of anisotropy on the Tc of niobium.36 Intriguingly they found that the electron–phonon coupling constants determined are probably too large and have to be multiplied by a factor of 0.7 (0.49 in coupling strength) to obtain the observed Tc.
Again in 1977, Harmon and Sinha evaluated α2F(ν) for niobium.37 They borrowed the muffin-tin potential used in the calculation of the band structure. They found λ = 1.58, which is considerably larger than the commonly accepted values (∼1.0).
In 1979, Glötzel, Rainer and Schober evaluated α2F(ν) for vanadium, niobium, tantalum, molybdenum, tungsten, palladium, platinum and lead.38 They carefully avoided any uncontrolled approximations. To find phonon dispersion, they used published Born-von Kármán fits to the force constants. To estimate the strength of the electron–phonon interaction, they adopted muffin-tin potentials developed for band structure calculations. The value of Tc turned out to be 2 to 3 times too high. They show Tc is sensitive to the Coulomb pseudopotential, μ*, but stick to a reasonable choice μ* = 0.13. They conclude their careful approach was incapable of reproducing the observed values of Tc.
In 1987, Al-Lehaibi, Swihart, Butler and Pinski evaluated both ρ(T) and α2F(ν) for tantalum with a muffin-tin potential from band calculation.39 While ρ(T) was found to be slightly lower than experimentally observed, α2F(ν) exceeded the tunnelling values significantly, giving Tc = 7.01 K (4.5 K experimentally). This was considered a puzzle. A similar puzzle occurred when niobium was investigated.40–42
VII. Pairing difficulty: inconsistent occupancy
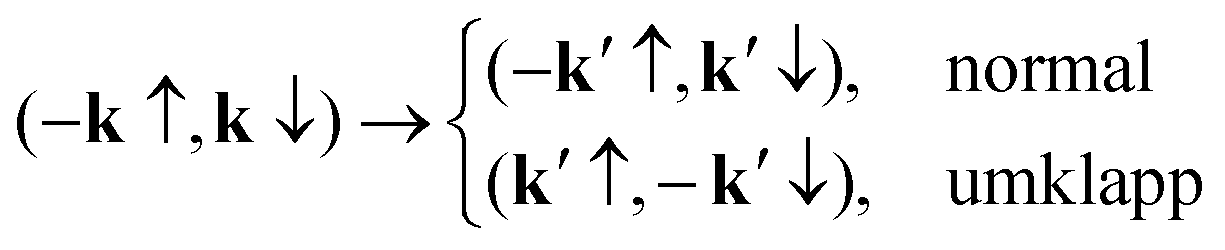
There is a paradox disallowing contributions to superconductivity by some phonons. The topic was discussed before.43,44 We revisit it here, with additional explanations, for the convenience of the reader. In Fig. 4 we show the Fermi surface in the first BZ in Fig. 2, and a pair of electron states on the surface, A = (k′, ↑) and FF = (−k′, ↓). Initially we have an electron in the state Γ = (k, ↑). Since an electron has two spins, we may also have Γ = (k, ↓).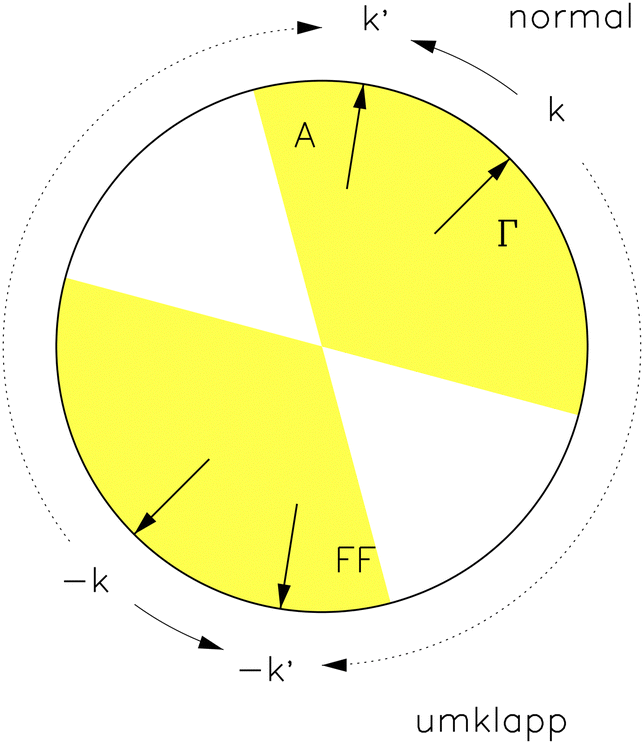 | ||
| Fig. 4 Schematic of a spherical Fermi surface and a pair of electrons with initial momenta k and −k, and destination momenta k′ and −k′. In normal and umklapp scattering the pair follows the paths indicated by the solid and dashed arrows respectively. The range of normal scattering is marked by the shaded wedges (half angle = 60°, valency = 2). | ||
Letting Γ = (k, ↑), we have a normal phonon to drive the electron into A = (k′, ↑). Note the spin remains unchanged before and after scattering. By symmetry we also have a normal phonon to drive another electron from (−k, ↓) to (−k′, ↓). In Fig. 4 we show the paths of the two electrons as the two curved solid arrows, which are in association with a certain occupation probability of the destination pair state, say h(q) = 0.3, q = k − k′ being the momentum of the normal phonon.
Letting Γ = (k, ↓), we have an umklapp phonon to drive the electron into FF = (−k′, ↓). By symmetry we also have an umklapp phonon to drive another electron from (−k, ↑) to (k′, ↑). In Fig. 4 we show the paths of the two electrons as the two curved dashed arrows, which are in association with another occupation probability, say h(q) = 0.5, q = k + k′ being the momentum of the umklapp phonon, in contrast to the previous probability 0.3 in association with q = k − k′.
We should notice we have followed Mott and Jones to assume we always have a phonon to scatter an electron between any two states in a shell surrounding the Fermi surface.29 For example, in Fig. 4, the states Γ, A and FF are all at the Fermi level. Another example is eqn (8), where we always have εF as the electron energy due to the delta function δ(ε − εF), assuming we have phonons to let δ(ν − ħω) = 1 at any values of q requested by the events.
VIII. Pairing difficulty: double occupancy
To supplement our discussion in the previous section, we follow BCS to construct the ground state made from paired valence electrons.1 We have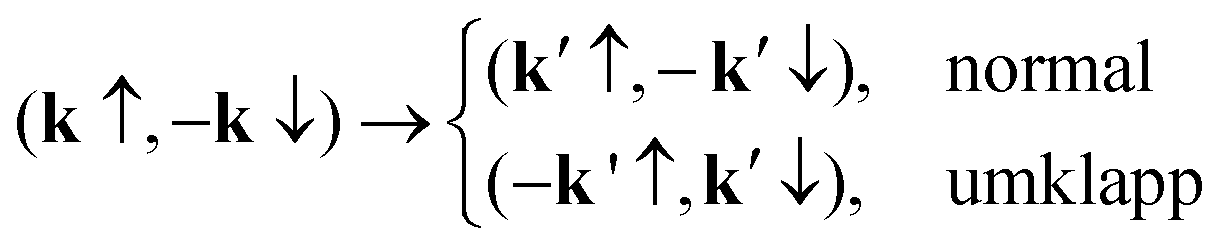 | (9) |
 | (10) |
 | (11) |
 | (12) |
 | (13) |
 | (14) |
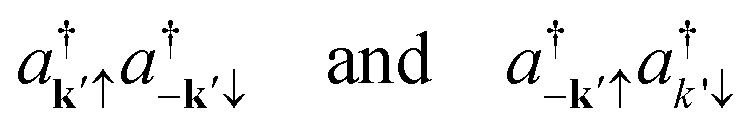
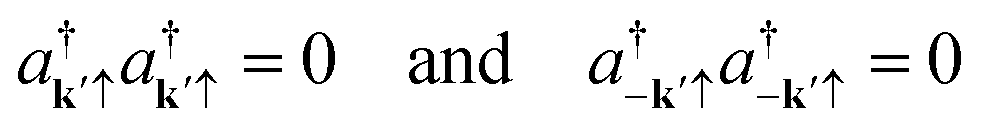
In eqn (13),  generates two electrons scattered by normal and umklapp phonons respectively. We assume equal energy for the two electrons, assuring double occupancy of the electron state. We have no other choice because, by the algebra of the BCS theory, the electron states are always at the Fermi level due to the delta function δ(ε − εF) in eqn (8). The problem is usually latent but outstands in the pairing events. Many opted to exclude umklapp phonons to deal with it.21–28 We show it enlightens us to find an alternative option in the next section.
IX. Alternative pairing: scheme
We let | (15) |
![[thin space (1/6-em)]](https://www.rsc.org/images/entities/char_2009.gif) sin−1(qD/2kF), where kF is the Fermi momentum, qD/2kF = (4Z)−1/3 and Z valency, giving θN = 78.1°, 69.0°, 51.8° for Z = 1, 2, 3 and so forth, assumed to equal the number of conducting per atom for simplicity. Experimentally, Z from measurement may be fractional, and θN depends on the direction of q because the phonon BZ is a polyhedron.
sin−1(qD/2kF), where kF is the Fermi momentum, qD/2kF = (4Z)−1/3 and Z valency, giving θN = 78.1°, 69.0°, 51.8° for Z = 1, 2, 3 and so forth, assumed to equal the number of conducting per atom for simplicity. Experimentally, Z from measurement may be fractional, and θN depends on the direction of q because the phonon BZ is a polyhedron.
Eqn (8) and (15) exclude all the normal phonons, avoiding the paradox discussed in Sections VII and VIII from taking place. In addition, they exclude the umklapp phonons capable of driving the electron into the other hemisphere of the Fermi surface, avoiding a similar paradox. We understand eqn (8) and (15) as a reasonable proposition to be tested numerically.
In the BCS theory, most Cooper pairs are in a thin layer across the Fermi surface. It is out of the exclusion principle because the internal states are all occupied, leaving no place to accommodate scattered electrons for pairing. Now eqn (15) draws a map over that thin layer, telling us graphically where the scattered electrons can land without violating the exclusion principle.
X. Alternative pairing: phonons
In Fig. 5, we use the open circles to represent vibration frequencies of the Pd (top) and Pb (bottom) atoms excited by neutrons along the symmetric directions of the (fcc) lattice.53,54 Theoretically, in simple metals, the Born-von Kármán theory manifests itself as a series of 3 × 3 matrices, with elements | (16) |
 and
and  , all in joules or eV, arising from the Coulomb force in the radial and transverse directions respectively.55
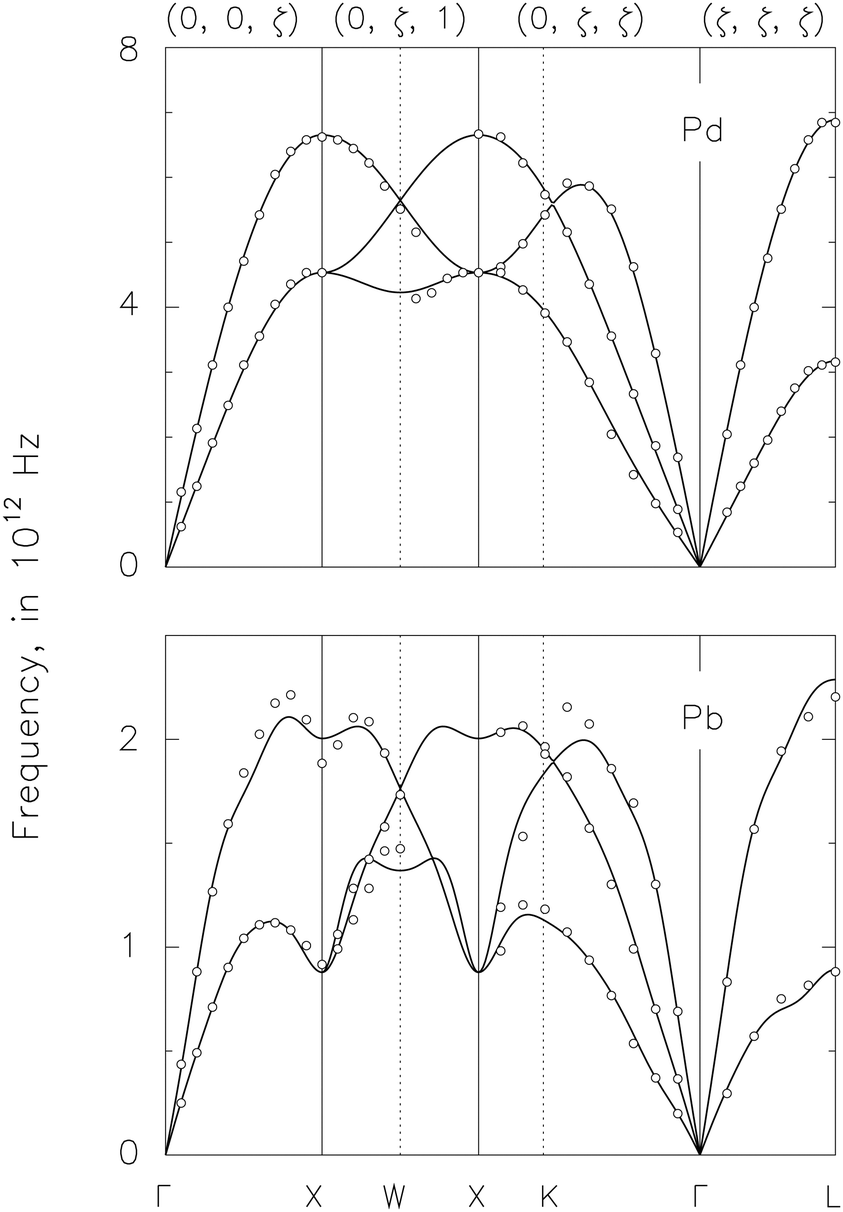 | ||
| Fig. 5 Experimental and theoretical phonon dispersion for palladium (top) and lead (bottom), open circles from neutron scattering measurement, curves from Born–von Kármán theory, usual (fcc) reciprocal site conventions. | ||
We find  and
and  with the help of the popular method of optimization from Hooke and Jeeves.56 In the pattern-search stage of the method, we perturb the values of
  and
and  to evaluate the penalty function measuring the r.m.s. difference between the theoretical and experimental phonon frequencies shown in Fig. 5. We refer to a perturbation as positive if it reduces that r.m.s difference. Otherwise, we refer to it as negative. In the pattern-move stage, we implement positive perturbations in the original directions, negative perturbations in opposite directions, magnitude proportional to their effects. We repeat the process until we can no longer improve the fitting between the circles and curves in Fig. 5.
We let Veff be third-order polynomials between the shells and second-order polynomials within the first shell, with 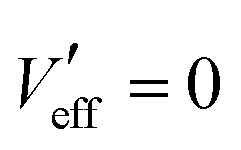 when r = 0. We list the values of Veff and its derivatives in Pb in Table 1. We have
 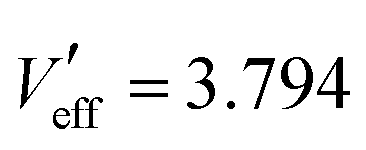 , 0.020, 0.637, 0.894, 0.150, −1.137 and
 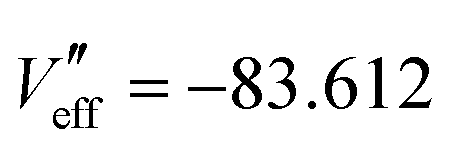 , −3.063, −2.038, 2.932, −0.094, −0.078 on the first six atomic shells in Pd, a = 0.389 nm.
| m | Siteb | N m | r × a | V eff |
|
|
|---|---|---|---|---|---|---|
| a V eff and its derivatives in eV, a = 0.495 nm. b One sample site per atomic shell, in 0.5a. | ||||||
| 0 | (0, 0, 0) | 1 | 0.000 | −2.868 | — | — |
| 1 | (1, 1, 0) | 12 | 0.350 | −0.599 | 2.138 | −17.062 |
| 2 | (2, 0, 0) | 6 | 0.495 | 0.034 | 0.002 | −1.839 |
| 3 | (2, 1, 1) | 24 | 0.606 | 0.028 | 0.030 | −0.175 |
| 4 | (2, 2, 0) | 12 | 0.700 | 0.001 | −0.193 | −2.417 |
| 5 | (3, 1, 0) | 24 | 0.783 | −0.013 | 0.191 | −0.173 |
| 6 | (2, 2, 2) | 8 | 0.857 | 0.029 | 0.000 | −0.542 |
| 7 | (3, 2, 1) | 48 | 0.926 | 0.035 | 0.031 | −0.050 |
| 8 | (4, 0, 0) | 6 | 0.990 | 0.040 | −0.001 | −0.101 |
| 9 | (4, 1, 1) | 36 | 1.050 | 0.039 | 0.000 | 0.420 |
| 10 | (4, 2, 0) | 24 | 1.107 | 0.009 | −0.198 | −0.355 |
| 11 | (3, 3, 2) | 24 | 1.161 | −0.024 | 0.000 | −0.002 |
| 12 | (4, 2, 2) | 24 | 1.213 | −0.024 | −0.005 | −0.123 |
| 13 | (4, 3, 1) | 72 | 1.262 | −0.007 | 0.124 | 0.020 |
| 14 | (5, 2, 1) | 48 | 1.356 | 0.027 | 0.000 | 0.001 |
| 15 | (4, 4, 0) | 12 | 1.400 | 0.027 | 0.000 | 0.000 |
| 16 | (4, 3, 3) | 48 | 1.443 | 0.029 | 0.017 | −0.011 |
| 17 | (4, 4, 2) | 30 | 1.485 | 0.032 | 0.004 | −0.193 |
| 18 | (5, 3, 2) | 72 | 1.526 | 0.017 | −0.135 | 0.168 |
| 19 | (6, 2, 0) | 24 | 1.565 | 0.001 | −0.008 | −0.055 |
| 20 | (5, 4, 1) | 48 | 1.604 | 0.000 | −0.012 | 0.117 |


In Fig. 6 we use the vertical lines to present the locations of the shells. We also use the shaded silhouette to present the pseudopotentials for the electron–phonon interactions. Although the curves and silhouettes are significantly different, especially within the first shell, we should note the values of Veff between the shells do not affect the phonons. We can let, for example, Veff ≡ 0 within the first shell (empty core model).47
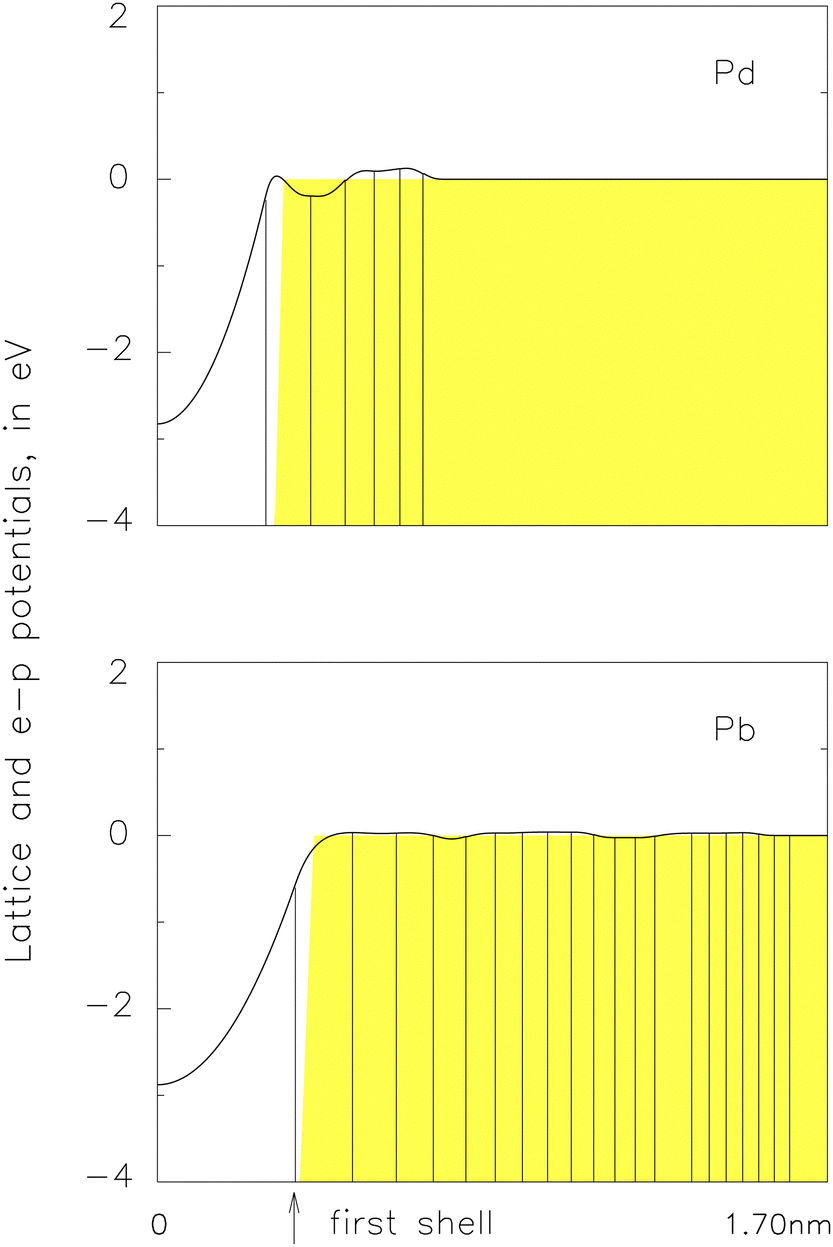 | ||
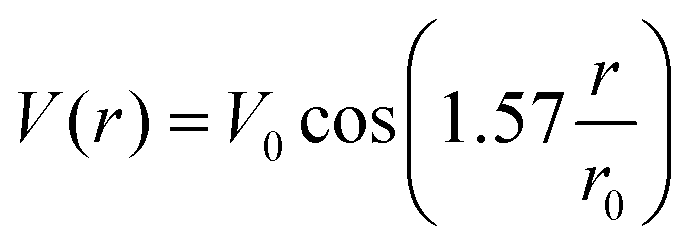
| Fig. 6 Pseudopotentials for lattice vibrations, Veff in eqn (16) (curves), and electron–phonon interactions, V in eqn (20) (silhouettes), in palladium (top, V0 = 31.6 eV and r0 = 0.324 nm) and lead (bottom, V0 = 29.0 eV and r0 = 0.397 nm for the silhouette),43 vertical lines indicate radius of the atomic shells. | ||
XI. Alternative pairing: resistivity
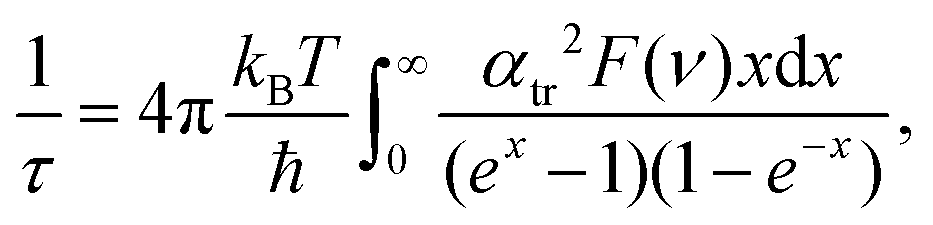
Next, we evaluate ρ(T) for electrical resistivity against temperatures. The formula involves a pseudopotential, V, for the interactions between phonons and electrons. We will use the experimental values of ρ(T) to determine V and compare it with say Veff in eqn (16). We start with the Drude formula: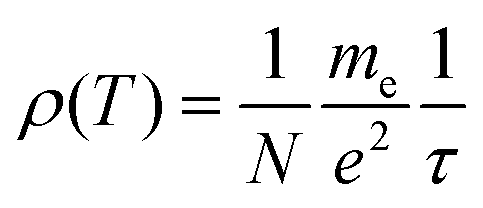 | (17) |
 | (18) |
 | (19) |
is the circular frequency of the phonon, identifies polarization, ε and εF electron energy and Fermi energy, respectively, q = k′−k, k and k′ stand for the initial and end states of an electron.31
In eqn (19) we have the matrix element:52
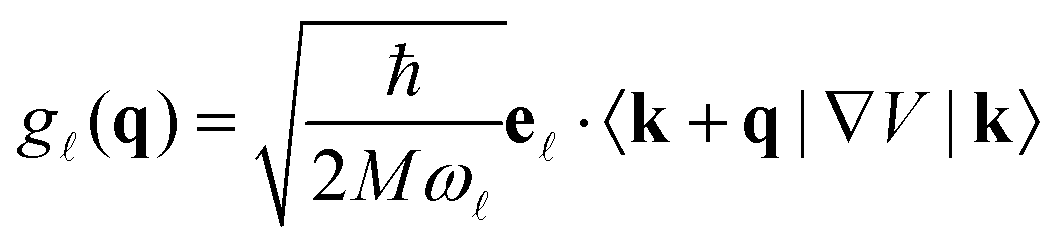 | (20) |
 | (21) |
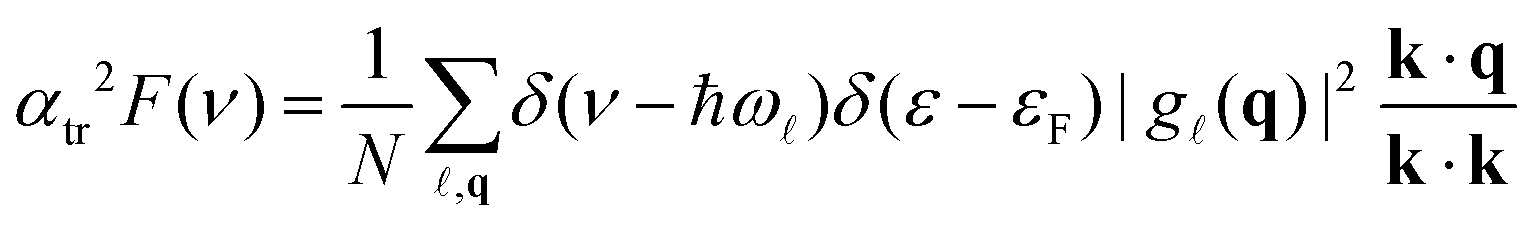
In metals, the electron–phonon interactions take place just on the Fermi surface due to the exclusion principle. We convert the summation in eqn (19) into integration. We let dk′ = (dk′/dε)dε to let the integration accommodate the delta function, δ(ε − εF), to implement the physics. Sine k′2sin(θ)dθ = qdq = q(dq/dω)dω, the summation in eqn (19) also accommodates δ(ν − ħω), where θ is the angle between k and k′ in Fig. 4. The output of eqn (19) depends on the direction of k. We average it over the Fermi surface and find the analytical expression for αtr2F(ν) in ref. 43.
We perform a two-dimensional search to specify V(r) in eqn (21) to minimize the difference between the experimental and computational values of ρ(T) illustrated in Fig. 7. We find
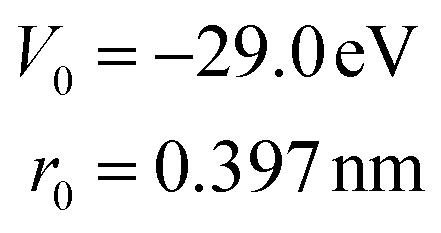 | (22) |
 | ||
| Fig. 7 Electric resistivity from experimental measurement (circles), computation (solid curves) and S & S evaluation (filled squares). Top: In palladium, deviation = 0.26% on average against resistivity in lead at 300 K. Bottom: In lead, deviation = 0.14% on average.43 | ||
XII. Alternative pairing: superconductivity
We test if our pairing scheme in eqn (15), which excludes an extensive range of phonons, ensures accurate superconductivity. We will perform a two-dimensional search to specify V(r) in eqn (21) to minimize the difference between the experimental and computational values of the superconducting tunnelling current shown in the bottom part of Fig. 8. We will compare the resulting values of V0 and r0 with the values in eqn (22). | ||
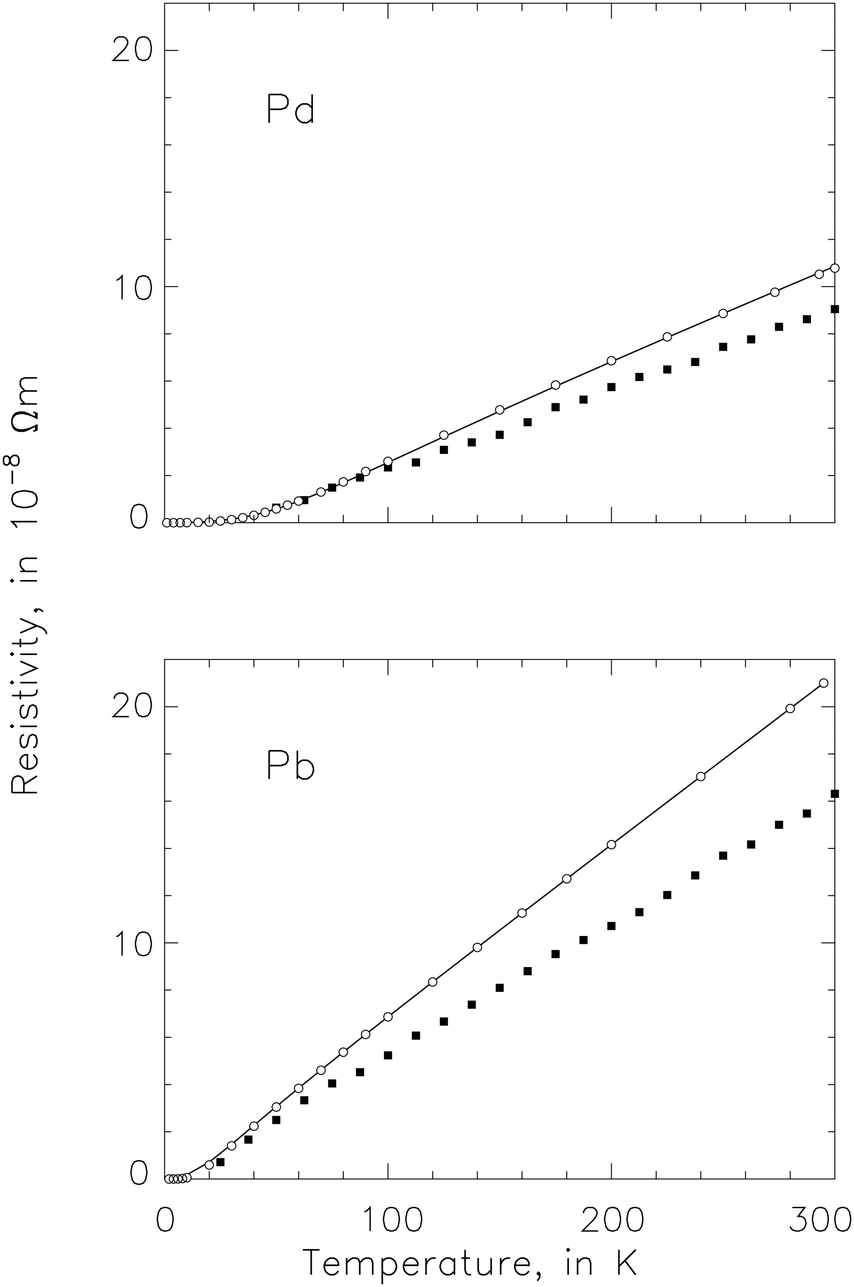
| Fig. 8 Superconductivity in Pb, from the alternative pairing scheme in eqn (15) to curtail phonon contributions, Δ0 adjusted to ensure an accurate value of Tc. Top: α2F(ν) from experiment (silhouette) and computation (histogram). Bottom: Tunnelling conductance from experiment (open circles) and computation (small circles). | ||
In the top part of Fig. 8, the shaded silhouette represents the experimental α2F(ν) from ref. 49 which arises from the measured values of the superconducting tunnelling current shown in the bottom part of the figure. Our numerical α2F(ν), shown as the histogram, arises from eqn (8) which in turn arises from S(q) in eqn (15) and g(q) in eqn (20)via V(r) in eqn (21). It enables us the solve the Eliashberg equation at T = 0 numerically provided we know the edge of the superconducting gap function, Δ0.52 We vary the trial value of Δ0 until we find the experimental value of Tc from our numerical solution to the Eliashberg equation at T > 0.
Eventually, we find the computational tunnelling conductance current shown as the solid curve in the bottom part of Fig. 8. We have λ = 1.464 for our numerical α2F(ν), compared with λ = 1.33 ± 0.02 in ref. 49. We find μ* = 0.0994 and Δ0 = 1.442 meV, giving 2Δ0/kBTc = 4.654, compared with μ* = 0.1 ± 0.02 and Δ0 = 1.358 ± 0.004 in ref. 49. We find
 | (23) |
We find that, within the 0.3% error margin between the experimental and computational values of ρ(T), V0 and r0 in eqn (22) are not unique. On the other hand, we always find unique values of V0 and r0 in eqn (23) to fit values of the tunnelling currents, full of rich details about the phonons. Therefore, we find V0 and r0 in eqn (22) iteratively. We treat V0 and r0 from eqn (23) as trial values of their counter parts in eqn (22) and proceed to fit ρ(T) once again. Usually, one iteration is sufficient to secure proper values of V0 and r0 in eqn (22).
In the top part of Fig. 3, we use the curve to show the S & S α2F(ν) in Pd, λ = 0.35 (0.34 by our calculation).23 It leads trough the Eliashberg equation at T = 0 to Δ0 = 0.0286 meV when μ* = 0.13. Consequently, we find Tc = 0.19 K from the relation 2Δ0/kBTc = 3.52, that is Pd becomes a superconductor. In comparison, with the umklapp pairing scheme in eqn (15), we find a different α2F(ν) shown as the shaded silhouette in the top part of Fig. 2, λ = 0.199. It leads through the Eliashberg equation to Δ0 = 0, giving Tc = 0.
XIII. Alternative pairing: numerical scheme
The scheme in eqn (15) arises entirely from the theoretical point of view to avoid the pairing difficulty revealed and analysed in Sections VII and VIII. Now we test a pairing scheme arising from a numerical point of view. We will include or exclude phonons depending on if the output of the Eliashberg equation matches experimental data accurately.In Eqn (8), we let S(q) = Si when θ = θi, i = 0,1,2,…,20, θi being mesh points evenly distributed between θ = 0 and π/2. We always force Si = 0 when θ > π/2. We follow the procedure of Hooke and Jeeves56 to vary the values of Si to minimize the difference between the experimental and computational values of the superconducting tunnelling conductance, shown as the small circles and the curve, respectively, in the bottom part of Fig. 9. We force Si = 0 when θ < θN initially but let the procedure run free afterwards.
 | ||
| Fig. 9 Superconductivity in Pb from the alternative pairing scheme, with numerical S(q) in eqn (8) and same g(q) in eqn (8) and (19), conventions identical with Fig. 8. | ||
We evaluate the matrix element in eqn (20) with the pseudopotential in eqn (21) and (22) so that the strength of the electron–phonon interactions is identical to that for electrical resistivity. We find the computational tunnelling conductance current shown as the solid curve in the bottom part of Fig. 9. We have λ = 1.726 for the numerical α2F(ν) shown as the histogtam in the top part of Fig. 9. We find μ* = 0.151, Δ0 = 1.458 meV, giving 2Δ0/kBTc = 4.706.
In Fig. 10, we use the solid curve to present S(q) for our numerical pairing scheme. It takes the value of Si when θ = θi. Otherwise, we define its value by interpolation. It fits well the theoretical values of S(q) in eqn (15), shown as the shaded rectangle, apart from some minor disturbances between q = 0 and qD. The slight slope of the curve around qD is from the non-spherical geometry of the phonon BZ.
 | ||
| Fig. 10 Survival rate, S(q), in lead from theory (silhouette) and numerical calculation (curve). | ||
XIV. Discussion: palladium
We find λ = 0.199 in Pd, α2F(ν) shown as the shaded silhouette in the top part of Fig. 3, giving Tc = 0 in accord with the experiment. We are not alone. In 1977, Papaconstantopoulos and co-workers found superconducting properties of 32 metals, from self-consistent band-structure calculations and measured values of the Debye temperature, in conjunction with the theory of Gaspari and Gyorffy, λ = 0.148 (0.281 without correction) in Pd.58 Consequently, in 2010, Doubble and co-workers concluded that the observation of strong spin fluctuations in Pd does not lead to a large contribution to the linear specific heat.59S & S found λ = 0.340 in Pd, α2F(ν) shown as the curve in the top part of Fig. 3, giving Tc > 0 in contrast to the experiment. They, too, are not alone. In 1978 and 1979, Pinski, Allen and Butler found λ = 0.41 in Pd,42,60 phonons integrated over BZ following a similar practice to investigate Nb.40 In 2005, Takezawa, Nagara and Suzuki found λ = 0.377 from DFT, phonons integrated on an 8 × 8 × 8 mesh within BZ.61 In 2006, Sklyadneva and co-workers found λ = 0.40 also from DFT, phonons integrated over a dense mesh in the first BZ.62
In 2020, Kawamura, Hizume and Ozaki found superconducting properties (or the lack of them) of almost all elements in the periodic table from DFT via first-principles calculations with necessary material informatics.63 They integrated phonons in BZ with the optimized tetrahedron method described briefly by Savrasov.22 Interestingly, they found λ = 0.325 or 0.333 in Pd, which leads through their first-principles μ* and spin fluctuations to Tc = 0.
In 1979, Striktzer found Pd films, irradiated with He+ ions, became superconductors, Tc = 3.2 K.64 He suggested that, in the case of λ = 0.34 or so, irradiation might have smeared the Fermi surface to defeat the effect of spin fluctuations and revive superconductivity. He was open to considering smaller λ because he mentioned superconductivity enhancement by irradiation.
In 2013, Hayashi and co-workers found λ = 0.35 ± 0.05 from an angle-resolved photo-emission study of electron structure and self-energy in non-superconducting Pd.65 It is not clear if λ∼ 0.35 still stands in ref. 42,60–63 after the authors have extended their theory to include the umklapp phonons.
XV. Discussion: alkali metals
In Fig. 2, we present a spherical Fermi surface confined entirely within the first BZ without touching its boundary. The gaps between the Fermi surface and its replicas block umklapp scattering when thermal agitations are too weak to drive the electron to jump across the gaps. In the case of alkali metals, the plot in Fig. 2 is no longer schematic but realistic. In 1971, Ekin showed with careful experiment and analysis that, in potassium, the contribution to electrical resistivity from umklapp phonons drops rapidly below ∼2.5 K.66Consequently, the analysis in Sections VII and VIII may not apply to alkali metals. In the absence of the umklapp phonons, represented by the curved dashed arrows in Fig. 4, we will not encounter inconsistent or double occupancies of the paired electron states. It appears reasonable for Yan, Zhang, Wang and Yang to use the MP scheme to study superconductivity in dense Li.67 The use of the MP scheme in ref. 24 and 27 might also be justifiable if the authors could prove similarities between hydrides and alkali metals.
Furthermore, in any metal, umklapp phonons might not drive scattered electrons to cover the entire Fermi surface. There might be some pockets of the electron states on the surface beyond the reach of umklapp scattering, leaving room for normal phonons to pair electrons, evidenced by the minor disturbances of S(q) below Debye momentum in Fig. 10.
Regrettably, in either alkali or any other metals, we do not have sufficient reason to follow S & S and Andersen21–23 to assume V = Veff in eqn (6) and (7). It is a great convenience, but we may not be in a position to enjoy it safely. It allows us to identify, for example, the roles of acoustic or optical phonons, but we cannot be sure about it. We still have to estimate Tc roughly from the values of TD, λ and μ* (ref. 68) not very different from the practice of McMillan in 1968.69
XVI. Discussion: BCS interaction
The interaction term of the reduced Hamiltonian, Vkk′ in eqn (2.14) in ref. 1, has no dependence on temperature in the BCS theory. It then leads through the entropy of the electron pair ensemble to Tc. An anonymous referee asks us to replace it with its counterpart in a replacement theory70 where we must choose the interaction term from eqn (4)–(6) if T < Tc. Otherwise, we choose eqn (7)–(9). We do not know Vkk′ before we know Tc. We also do not know Tc before we know Vkk′. We have been puzzled by the dilemma. We believe it will be more appropriate for us to follow70 or comment on it in future.XVII. Conclusions
Peter, Ashkenazi and Dacorogna called for a reduction of phonon contributions to superconductivity to solve a historical difficulty of the BCS theory. It has led to widespread applications of the MP scheme, readily available from computer packages, to evaluate superconductivity clearly because the scheme excludes umklapp phonons. González-Pedreros, Camargo-Martínez and Baquero believe the umklapp process does not contribute to superconductivity. Du and colleagues believe the umklapp process is relevant if the Fermi momentum is much smaller than the Debye momentum. Otherwise, they believe pairing occurs without a noticeable contribution of the umklapp phonons.Savrasov and Savrasov investigated the effect of the MP scheme before and after a metal becomes a superconductor. In their evaluation, superconductivity in Pb is overly strong in the absence of the umklapp phonons. The electrical resistivity becomes too weak. Furthermore, Pd becomes a superconductor in ambient erroneously. It also is with weak electrical resistivity. The lesson is clear: we must reduce phonon contributions when and only when the metal is superconducting to avoid unwanted weakening of electrical resistivity.
The BCS theory indeed obliges us to do so. It assigns definite occupation probabilities to the paired electron states, sometimes inconsistent with the occupation probabilities due to umklapp scattering. We find we must exclude all the normal phonons. We also have to exclude the umklapp phonons capable of driving an electron to the other hemisphere of the Fermi surface. It leads to accurate resistivity and superconductivity in Pb and Pd. In particular, it explains why Pd is not a superconductor in the bulk form.
Further verification of the approach against other classical metallic and (or) novel high-temperature superconductors, such as various hydrides under pressure, is necessary because it concerns the worth of many previous and future endeavours. It also is urgent in light of the rapid development in the field.
Conflicts of interest
There are no conflicts to declare.Acknowledgements
We thank the late Professor David George Walmsley for his inspiration, experience and contributions in this direction of study.References
- J. Bardeen, L. N. Cooper and J. R. Schrieffer, Phys. Rev., 1957, 108, 1175–1204 CrossRef CAS.
- N. W. Ashcroft, Phys. Rev. Lett., 1968, 21, 1748–1749 CrossRef CAS.
- N. W. Ashcroft, Phys. Rev. Lett., 2004, 92, 187002 CrossRef CAS PubMed.
- C. B. Satterthwaite and I. L. Toepke, Phys. Rev. Lett., 1970, 25, 742–743 CrossRef.
- B. Stritzker and W. Buckel, Z. Phys. A, 1972, 257, 1–8 CrossRef CAS.
- A. P. Drozdov, M. I. Eremets, I. A. Troyan, V. Ksenofontov and S. I. Shylin, Nature, 2015, 525, 73–76 CrossRef CAS PubMed.
- E. Snider, N. Dasenbrock-Gammon, R. McBride, M. Debessai, H. Vindana, K. Vencatasamy, K. V. Lawler, A. Salamat and R. P. Dias, Nature, 2020, 586, 373–377 CrossRef CAS PubMed.
- B. N. Ganguly, Z. Phys. A, 1973, 265, 433–439 CrossRef CAS.
- D. A. Papaconstantopoulos, B. M. Klein, E. N. Economou, E. N. Economou and L. L. Boyer, Phys. Rev. B: Condens. Matter Mater. Phys., 1978, 7, 141–149 CrossRef.
- D. V. Semenoka, I. A. Kruglovb, I. A. Savkind, A. G. Kvashnina and A. R. Oganova, Curr. Opin. Solid State Mater. Sci., 2020, 24, 100808 CrossRef.
- J. A. Flores-Livas, L. Boeri, A. Sanna, G. Profeta, R. Arita and M. Eremets, Phys. Rep., 2020, 856, 1–78 CrossRef CAS.
- F. Peng, Y. Sun, C. J. Pickard, R. J. Needs, Q. Wu and Y. Ma, Phys. Rev. Lett., 2017, 119, 107001 CrossRef PubMed.
- B. Chen, L. J. Conway, W. Sun, X. Kuang, C. Lu and A. Hermann, Phys. Rev. B, 2021, 103, 035131 CrossRef CAS.
- X. Dou, X. Kuang, W. Sun, G. Jiang, C. Lu and A. Hermann, Phys. Rev. B, 2021, 104, 224510 CrossRef CAS.
- Q. Duan, J. Shen, X. Zhong, H. Lu and C. Lu, Phys. Rev. B, 2022, 105, 214503 CrossRef CAS.
- S. Li, H. Wang, W. Sun, C. Lu and F. Peng, Phys. Rev. B, 2022, 105, 224107 CrossRef CAS.
- A. Baldereschi, Phys. Rev. B: Solid State, 1973, 7, 5212–5215 CrossRef CAS.
- D. J. Chadi and M. L. Cohen, Phys. Rev. B: Solid State, 1973, 8, 5747–5753 CrossRef.
- H. J. Monkhorst and J. D. Pack, Phys. Rev. B: Solid State, 1976, 13, 5188–5192 CrossRef.
- P. Giannozzi, S. Baroni and N. Bonini, et al. , J. Phys.: Condens. Matter, 2009, 21, 395502 CrossRef PubMed.
- S. Y. Savrasov, D. Y. Savrasov and O. K. Andersen, Phys. Rev. Lett., 1994, 72, 372–375 CrossRef CAS PubMed.
- S. Y. Savrasov, Phys. Rev. B: Condens. Matter Mater. Phys., 1996, 54, 16470–16486 CrossRef CAS PubMed.
- S. Y. Savrasov and D. Y. Savrasov, Phys. Rev. B: Condens. Matter Mater. Phys., 1996, 54, 16487–16501 CrossRef CAS PubMed.
- J. A. Camargo-Martínez, G. I. González-Pedreros and R. Baquero, Supercond. Sci. Technol., 2019, 32, 125013 CrossRef.
- G. I. González-Pedreros, J. A. Camargo-Martínez and R. Baquero, Supercond. Sci. Technol., 2021, 34, 098001 CrossRef.
- G. I. González-Pedreros, J. A. Camargo-Martínez and F. Mesa, Sci. Rep., 2021, 11, 22618 CrossRef PubMed.
- M. Du, Z. Zhang, H. Song, H. Yu, T. Cui, V. Z. Kresinc and D. Duan, Phys. Chem. Chem. Phys., 2021, 23, 6717–6724 RSC.
- M. Du, Z. Zhang, H. Song, H. Yu, T. Cui, V. Z. Kresinc and D. Duan, Phys. Chem. Chem. Phys., 2022, 24, 1898–1899 RSC.
- N. F. Mott and H. Jones, The Theory of the Properties of Metals and Alloys, 1936 Search PubMed.
- P. G. Tomlinson and J. P. Carbotte, Phys. Rev. B: Solid State, 1976, 13, 4738–4744 CrossRef CAS.
- P. G. Tomlinson and J. P. Carbotte, Can. J. Phys., 1977, 55, 751–760 CrossRef CAS.
- A. Eiling and J. S. Schiling, J. Phys. F: Met. Phys., 1981, 11, 623–639 CrossRef CAS.
- C. R. Leavens and J. P. Carbotte, Ann. Phys., 1972, 70, 338–377 CAS.
- P. T. Truant and J. P. Carbotte, Can. J. Phys., 1974, 52, 618–623 CrossRef CAS.
- H. K. Leung, J. P. Carbotte and C. R. Leavens, J. Low Temp., 1976, 24, 25–34 CrossRef CAS.
- M. Peter, J. Ashkenazi and M. Dacorogna, Helv. Phys. Acta, 1977, 50, 267–278 CAS.
- B. N. Harmon and S. K. Sinha, Phys. Rev. B: Solid State, 1977, 16, 3919–3924 CrossRef CAS.
- D. Glötzel, D. Rainer and H. R. Schober, Z. Phys. B, 1979, 35, 317–326 CrossRef.
- A. Al-Lehaibi, J. C. Swihart, W. H. Butler and F. J. Pinski, Phys. Rev. B: Condens. Matter Mater. Phys., 1987, 36, 4103–4111 CrossRef CAS PubMed.
- W. H. Butler, H. G. Smith and N. Wakabayashi, Phys. Rev. Lett., 1977, 39, 1004–1007 CrossRef CAS.
- W. H. Butler, F. J. Pinski and P. B. Allen, Phys. Rev. B: Condens. Matter Mater. Phys., 1979, 19, 3708–3721 CrossRef CAS.
- F. J. Pinski, P. B. Allen and W. H. Butler, Phys. Rev. Lett., 1978, 41, 431–434 CrossRef CAS.
- X. H. Zheng and D. G. Walmsley, Phys. Scr., 2014, 89, 095803 CrossRef CAS.
- X. H. Zheng and D. G. Walmsley, Phys. Scr., 2019, 94, 085801 CrossRef CAS.
- J. P. Carbotte and R. C. Dynes, Phys. Rev., 1968, 172, 476–484 CrossRef CAS.
- P. J. Hasnip, K. Refson, M. I. J. Probert, J. R. Yates, S. J. Clark and C. J. Pickard, Phil. Trans. R. Soc. A, 2022, 372, 20130270 CrossRef PubMed.
- J. C. Slater, Phys. Rev., 1937, 51, 846–851 CrossRef CAS.
- N. W. Ashcroft, Phys. Lett., 1966, 23, 48–50 CrossRef CAS.
- W. L. McMillan and J. M. Rowell, Phys. Rev. Lett., 1965, 14, 108–112 CrossRef CAS.
- X. H. Zheng and J. X. Zheng, Supercond. Sci. Technol., 2021, 34, 098002 CrossRef.
- X. H. Zheng and J. X. Zheng, Phys. Chem. Chem. Phys., 2022, 24, 1896–1897 RSC.
- J. P. Carbotte, Rev. Mod. Phys., 1990, 62, 1027–1157 CrossRef CAS.
- R. Stedman, L. Almqvist and G. Nilson, Phys. Rev., 1967, 162, 549–557 CrossRef CAS.
- A. P. Miiller and B. N. Brockhouse, Can. J. Phys., 1971, 49, 704–723 CrossRef.
- X. H. Zheng and D. G. Walmsley, J. Low Temp. Phys., 2012, 166, 279–297 CrossRef CAS.
- R. Hooke and T. A. Jeeves, J. Assoc. Comput. Mach., 1961, 8, 212–229 CrossRef.
- N. W. Ashcroft and N. D. Mermin, Solid State Physics, Brooks/Cole, 1976 Search PubMed.
- D. A. Papaconstantopoulos, B. M. Klein, A. R. Williams, V. L. Morruzzi and J. F. Janak, Phys. Rev. B: Solid State, 1977, 15, 4221–4226 CrossRef CAS.
- R. Doubble, S. M. Hayden, P. Dai, H. A. Mook, J. R. Thompson and C. D. Fros, Phys. Rev. Lett., 2010, 105, 027207 CrossRef CAS PubMed.
- F. J. Pinski and W. H. Butler, Phys. Rev. B: Condens. Matter Mater. Phys., 1979, 19, 6010–6015 CrossRef CAS.
- T. Takezawa, H. Nagara and N. Suzuki, Phys. Rev. B: Condens. Matter Mater. Phys., 2005, 71, 012515 CrossRef.
- I. Yu Sklyadneva, A. Leonardo, P. M. Echenique, S. V. Eremeev and E. V. Chulkov, J. Phys.: Condens. Matter, 2006, 18, 7923–7935 CrossRef.
- M. Kawamura, Y. Hizume and T. Ozaki, Phys. Rev. B, 2020, 101, 134511 CrossRef CAS.
- B. Striktzker, Phys. Rev. Lett., 1979, 42, 1769–1793 CrossRef.
- H. Hayashi, K. Shimada, J. Jiang, H. Iwasawa, Y. Aiura, T. Oguchi, H. Namatame and M. Taniguchi1, Phys. Rev. B: Condens. Matter Mater. Phys., 2013, 87, 035140 CrossRef.
- J. W. Ekin, Phys. Rev. Lett., 1971, 26, 1551–1553 CrossRef.
- Y. Yan, Y. Zhang, Y. Wang and G. Yang, Solid State Commun., 2016, 225, 7–11 CrossRef CAS.
- X. H. Zheng, J. X. Zheng and D. G. Walmsley, Solid State Commun., 2019, 297, 17–20 CrossRef CAS.
- W. L. McMillan, Phys. Rev., 1968, 167, 331–344 CrossRef CAS.
- A. D. Arulsamy, Phys. Scr., 2029, 94, 055803 CrossRef.
| This journal is © the Owner Societies 2023 |