Phase equilibrium, dynamics and rheology of phospholipid–ethanol mixtures: a combined molecular dynamics, NMR and viscometry study†
Received
26th January 2023
, Accepted 12th May 2023
First published on 12th May 2023
Abstract
Binary mixtures of ethanol and phospholipids DOPC and DOPE have been investigated in a composition range relevant for topical drug delivery applications. This was done using a combined computer simulation and experimental approach where molecular dynamics simulations of ethanol–lipid mixtures with different compositions were performed. Several key properties including diffusion coefficients, longitudinal relaxation times, and shear viscosity were computed. In addition, diffusion coefficients, viscosities and NMR longitudinal relaxation times were measured experimentally for comparison and in order to validate the results from simulation. Diffusion coefficients and relaxation times obtained from simulations are in good agreement with results from NMR and computed viscosities are in reasonable agreement with viscometry experiments indicating that the simulations provide a realistic description of the ethanol–phospholipid mixtures. Structural changes in the simulated systems were investigated using an analysis based on radial distribution functions. This showed that the structure of ethanol–DOPC mixtures remains essentially unchanged in the investigated concentration range while ethanol–DOPE mixtures undergo structural rearrangements with the tendency for forming small aggregates on the 100 ns time scale consisting of less than 10 lipids. Although our simulations and experiments indicate that no larger aggregates form, they also show that DOPE has stronger aggregation tendency than DOPC. This highlights the importance of the character of the lipid headgroup for lipid aggregation in ethanol and gives new insights into phase equilibrium, dynamics and rheology that could be valuable for the development of advanced topical drug delivery formulations.
1 Introduction
Phospholipids are ubiquitous in biological systems as crucial building blocks of the cell membrane making up a barrier between the cytosol and the surroundings of the cell.1 Different lipids vary in their chemical structure, i.e. character of the headgroup, length of the hydrocarbon tails and degree of unsaturation. These biomolecules have numerous important functions in living systems. For instance, lipids facilitate signaling and transport of molecules across the cell membrane and organelle by processes such as endo- and exocytosis and they also participate in externalization/internalization of toxic substances as well as nanoparticles. In addition, the lipid membrane hosts receptors that play important roles in various types of diseases including viral infection.2,3 Another area where phospholipids play an important role is the uptake of active pharmaceutical ingredients (API) in addition to being important constituents in drug delivery formulations for treatment of various diseases.4 The outer most layer of the skin, i.e. stratum corneum, consists of a complex mixture of different lipids regulating its permeability to various hazardous substances as well as pharmaceuticals.5 Facilitating the uptake of APIs through the skin is thus one of the central challenges in topical drug delivery.
Phospholipids are amphiphilic molecules consisting of a polar headgroup and non-polar hydrocarbon tails. The amphiphilic character gives rise to a rich phase equilibrium in aqueous media where lipids optimize their interaction with the surrounding solvent leading to the formation of various mesophases, e.g. micelles, liposomes and bilayers, depending on the lipid concentration.6 The formation of such aggregates crucially depends on the energy contributions to the free energy due to complex molecular interactions as well as entropic terms related to the ordering of molecules in the mixture.7 Here the effect of lipid concentration and the chemical structure of the lipid, i.e. character of the polar head group, can be expected to play an important role in addition to the polarity of the solvent. While a significant amount of scientific work has been devoted to studies of water–phospholipid mixtures, much less is known about lipid phase equilibrium in other solvents. Although the aqueous environment best represents the conditions in biological systems other more volatile polar solvents, e.g. ethanol, are of interest for pharmaceutical applications. A number of previous studies have considered the effect of ethanol on lipid bilayers and vesicles immersed in water.8–10 Furthermore, bilayers consisting of lipids abundant in the stratum corneum have been studied at different ethanol/water ratios in order to investigate the effect of ethanol on skin permeability.11 Structural changes occurring in the absence of water in the concentration range relevant for topical drug delivery applications (<30 wt% lipid) are of considerable interest for developing such formulations. To the best of our knowledge this work is the first to combine computer simulation, NMR spectroscopy and viscometry to investigate this composition range.
The systems investigated in this work are model systems representing how lipids behave in the bulk of AKVANO® formulations. The AKVANO® drug delivery technology is based on water-free lipid formulations. The active ingredient is dissolved in a volatile solvent system along with one or several lipids, which provide different characteristics in the formulation, such as solubilization, skin barrier restoration or enhancing skin permeation. The volatile solvent system is based on short chain alcohols, such as ethanol, with or without the addition of silicone oils. The obtained formulation is a sprayable liquid, suitable for cutaneous application. When the solvent evaporates, a thin lipid layer is formed on the skin surface for the effective deposition of the active ingredient. Earlier studies indicated that the formulations have low levels of aggregation and low viscosity.12 The aim of the present study was to investigate the physical properties in a systematic manner, especially focusing on the impact of increasing lipid concentration.
Several experimental techniques can provide valuable information about liquid mixtures. Light scattering can provide information about lipid aggregation and aggregate size while diffuse X-ray and neutron scattering can probe the local structure in liquid mixtures.13,14 One of the most important experimental techniques is NMR spectroscopy capable of providing information about both structure and dynamics.15,16 Diffusion coefficients obtained from NMR provide information about the overall motion of lipids in the liquid mixture while longitudinal relaxation times for individual protons carry information about the reorientational motion of different parts of the molecule. Viscometry provides important information about the rheological properties of the ethanol–lipid mixture. While the complex character of molecular interactions in ethanol–phospholipid systems make them challenging to describe using simple theories for liquid mixtures computer simulation has emerged as a powerful complement to experiments capable of studying molecular systems in atomistic detail. In particular, the molecular dynamics (MD) technique has been used extensively for the study of liquid mixtures17,18 allowing Newtonian equations of motion to be integrated for systems of ∼105 interacting particles generating trajectories with lengths reaching up to the microsecond time scale. Although lipid–ethanol mixtures can undergo structural changes on longer time scales, this makes it possible to study lipid aggregation and important initial events for structural rearrangements as well as formation of mesophases in atomistic detail. However, the quality of the results obtained from MD strongly depends on the force fields describing molecular interactions, which makes it important to compare results from MD with experiments. In this work we carry out MD simulations of lipid–ethanol mixtures of different compositions under conditions relevant for pharmaceutical applications and investigate how the structure of simulated systems change as a function of lipid concentration and compare the effect of changing lipid headgroup (from PC to PE). In addition, the diffusion coefficients of lipids and ethanol and longitudinal relaxation times are measured using NMR experiments and compared with the values computed from MD simulations. Viscosity measurements are also carried out and compared with results from simulations.
The lipids chosen for this study were 1,2-dioleoyl-sn-glycero-3-phosphocholine (DOPC) and 1,2-dioleoyl-sn-glycero-3-phosphoethanolamine (DOPE). These systems are simplified models representing the bulk of AKVANO® topical drug delivery formulations. We also carry out a number of NMR and viscometry experiments in order to get insight into dynamical and rheological properties which we then compare with results from our simulations. In the next section “Methodology” we describe computational details for the MD simulations as well as experimental procedures for the NMR and viscosity measurements. In the “Results” section we describe the structure of the studied systems using an analysis based on radial distribution functions as well as viscosity, diffusion coefficients and longitudinal relaxation times obtained from the MD simulations. Here we also present diffusion coefficients and longitudinal relaxation times measured using NMR as well as results from viscometry experiments. In the “Discussion” section we provide interpretations of the results and compare MD simulations with experiments. In the “Conclusion” section we summarize our main findings, highlight most important results and provide an outlook for future research directions.
2 Methodology
2.1 Molecular dynamics simulations
The simulated systems were binary mixtures of phospholipids DOPC and DOPE with ethanol having different lipid concentrations. Chemical structures of these lipids are shown in Fig. 1 together with labels for hydrogen atoms that will be used in the discussion of NMR relaxation. For the two phospholipids investigated in this work nine mixtures with lipid concentration in the range 5–30 wt% were simulated. In addition, we performed a simulation of pure ethanol. The compositions of the simulated systems are shown in Table 1. All systems were constructed by placing 100 lipids in random positions in a cubic box suitable for accommodating the necessary number of lipids to obtain the desired concentrations, and then solvating the lipids with ethanol molecules. Periodic boundary conditions were applied in all directions. Ethanol molecules were described using the General Amber Force Field19 (GAFF) with atomic charges obtained from the antechamber20 software computed using its semi-empirical quantum chemistry program. This combination was found to provide good agreement with the experimental enthalpy of vaporization for ethanol (see Section S1 of the ESI†).21 DOPC and DOPE lipids were described using the Slipids22,23 force field. Slipids and GAFF have previously been combined for simulation of systems consisting of lipids and small organic molecules.24 Energy minimization was carried out using the steepest descent algorithm in order to relax large forces present in the initial configuration. MD simulations were then performed using the leap-frog25 integrator and a 2 fs time step at temperature 298 K and pressure 1 bar with H-bonds constrained using the LINCS26 algorithm. The temperature was held constant using the V-rescale thermostat27 with a time constant of 0.5 ps. The pressure was fixed using the Berendsen barostat28 with the time constant set to 5 ps. All simulations were carried out using the Gromacs29 software. Electrostatic interactions were computed using the particle mesh Ewald method30 with a 1.2 nm cutoff and a Fourier spacing of 0.12 nm. Each system was simulated for at least 500 ns of which first 50 ns were omitted from the analysis. Since computation of time correlation functions (TCFs) from a time series for estimation of viscosity requires high temporal resolution, we carried out 20 ns additional simulation saving pressure tensor components every MD step for each system. In order to calculate NMR relaxation times we also extended our trajectories by 1 ns where trajectories were saved every 20 fs in order to compute reorientational TCFs. In these simulations we used the Parrinello–Rahman barostat31 since it provides the correct NPT ensemble.
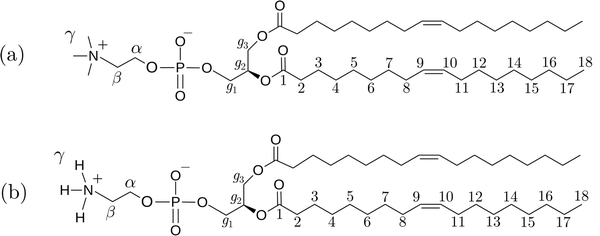 |
| | Fig. 1 Chemical structures of the two phospholipids (a) 1,2-dioleoyl-sn-glycero-3-phosphocholine (DOPC) and (b) 1,2-dioleoyl-sn-glycero-3-phosphoethanolamine (DOPE). | |
Table 1 Simulated systems
| System |
Number of lipids |
Number of ethanol |
Simulation time (ns) |
Box length (nm) |
| EtOH |
0 |
82![[thin space (1/6-em)]](https://www.rsc.org/images/entities/char_2009.gif) 509 509 |
35 |
20.2 |
| DOPC-5 wt% |
100 |
32![[thin space (1/6-em)]](https://www.rsc.org/images/entities/char_2009.gif) 420 420 |
578 |
15.0 |
| DOPC-10 wt% |
100 |
15![[thin space (1/6-em)]](https://www.rsc.org/images/entities/char_2009.gif) 357 357 |
1135 |
11.8 |
| DOPC-15 wt% |
100 |
9669 |
828 |
10.3 |
| DOPC-20 wt% |
100 |
6825 |
1262 |
9.3 |
| DOPC-30 wt% |
100 |
3981 |
1000 |
8.1 |
| DOPE-5 wt% |
100 |
30![[thin space (1/6-em)]](https://www.rsc.org/images/entities/char_2009.gif) 685 685 |
549 |
15.1 |
| DOPE-10 wt% |
100 |
14![[thin space (1/6-em)]](https://www.rsc.org/images/entities/char_2009.gif) 535 535 |
1000 |
11.7 |
| DOPE-20 wt% |
100 |
6460 |
808 |
9.5 |
| DOPE-30 wt% |
100 |
3768 |
840 |
8.8 |
2.2 NMR spectroscopy
DOPC and DOPE were obtained from Lipoid AG, Switzerland. Each lipid was weighed accurately into a vial, dissolved in absolute ethanol (VWR, Sweden) to obtain approximately 1 ml solution with the intended concentration, and thereafter transferred to an NMR tube (5 mm OD). DOPE did not dissolve in ethanol for concentrations exceeding 5 wt%. Proton NMR spectroscopic, relaxation and diffusion measurements were performed on a Bruker 500 MHz Avance III spectrometer operating at Larmor frequency for protons of 500 MHz and equipped with a dedicated high-field-gradient diffusion setup. A diffusion probe Diff30 with a gradient of up to 900 G cm−1 was used. The 90° pulse width was calibrated to 5 ms. The temperature was regulated with an accuracy of 0.1 °C. Representative spectra of phospholipid–ethanol mixtures are included in Fig. S1 in the S2 Section of the ESI.† The spectral assignment was performed according to literature data.32,33 The longitudinal relaxation time T1 was measured by the inversion-recovery method.
For diffusion measurements, the pulsed-field-gradient (PFG) method based on stimulated echo (STE) was used.34 In this experiment, the displacements of molecules are monitored via field-gradient-assisted de- and re-phasing of spin coherences. Random molecular translations induce re-phasing errors leading to decreased echo amplitude upon increasing the dephasing efficiency as given by the Stejskal–Tanner relation,35 see eqn (1):
where
g and
δ are the strength and the length of the applied gradients, respectively; Δ, the diffusion time;
D, the self-diffusion coefficient; and
γ, the gyromagnetic ratio of the observed nuclei. The signal intensities are recorded on increasing the gradient strength,
g, and the diffusion coefficient,
D, is calculated by fitting
eqn (1) to experimental points. In the measurements on phospholipid–ethanol mixtures, the gradient pulse length and the diffusion time were set to 1 and 20 ms, respectively, and the gradient strength was varied stepwise in the range of 10–640 G cm
−1. The sample temperature was set to 25 °C.
2.3 Viscometry
Rheological characterizations were performed on an Anton Paar MCR702e Space rheometer using a double gap bob and cup measuring geometry (DG27), with a bob outer diameter of 27 mm and cup inner diameter of 29 mm, in the single motor-transducer configuration. The C-PTD 200 accessory was used to maintain the measuring temperature at 20 °C. The same material and procedure as for the NMR experiments were used for sample preparation. Approximately 10 ml of sample was used for every measurement. At each shear rate in the measurement range, the constant shear rate creep test was performed and the viscosity value at the sample's steady state was recorded. Fig. S2 in the S3 Section of the ESI† shows viscosity as a function of the shear rate.
3 Results
3.1 Structure of lipid–ethanol mixtures and aggregation
In order to understand possible structural changes and reorganization of lipids in the investigated concentration interval we computed radial distribution functions (RDF) between different atoms as well as the center of mass (COM) of lipid molecules. We also calculated running coordination numbers (RCN) providing information about the average number of neighbors within a certain radius. Fig. 2 shows RDFs between the COM of lipid molecules and the corresponding running coordination number for different lipid concentrations. For DOPC (see Fig. 2(a)) the RDF gradually increases to unity but shows no peaks. This means that each lipid excludes a certain volume around itself from other lipids and the local density then becomes equal to the value in the bulk. The fact that this RDF does not have any peaks means that there are no correlations between the COM of lipids which is due to the flexibility of lipid molecules allowing their COM to fluctuate independently of each other. Essentially no change in the RDF is seen when increasing the concentration from 5 to 30 wt% and the increase of RCN simply reflects the increase of concentration. This indicates that the DOPC–ethanol mixture does not undergo aggregation or significant structural reorganization in the investigated concentration range. For DOPE the situation is different (see Fig. 2(b)) with a broad RDF peak around 11 Å showing that this is the most probable separation between the COM of lipid molecules. Increasing the lipid concentration from 5 to 30 wt% leads to an almost two-fold decrease in the height of this peak. This shows that the mixture undergoes structural rearrangements caused by clustering when lipids which approached each other at about 11 Å COM separation distance due to effective attraction, decrease the probability for other lipids to come at this distance. In addition, the RCN increases with concentration following the same trend as for DOPC but taking higher values, and the peak integrates to 2–8 lipids within a radius of 20 Å. We also calculated RDFs between individual atoms in lipids and found that the highest peak occurs between P and N atoms, which are centers of the lipids charged groups, see Fig. 3(a) and (b). For DOPC (see Fig. 3(a)) a high peak occurs at about 5 Å corresponding to the direct interaction between the phosphate and choline groups. A second smaller peak at around 7 Å corresponds to indirect P–N interaction mediated by an ethanol molecule. It can be noted that while the RDF for DOPC is essentially unchanged as the lipid concentration increases the peaks in the RDF for DOPE decrease supporting the observations from the RDF between COM of lipids. Additional RDFs showing the structure of ethanol around lipids are shown in Fig. S3 in the S4 Section of ESI† together with RDF between oxygen atoms in ethanol.
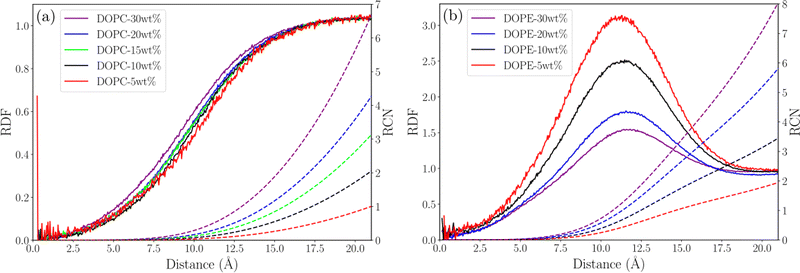 |
| | Fig. 2 Lipid COM–COM RDF (solid line) and RCN (dashed line) for (a) DOPC systems and (b) DOPE systems. | |
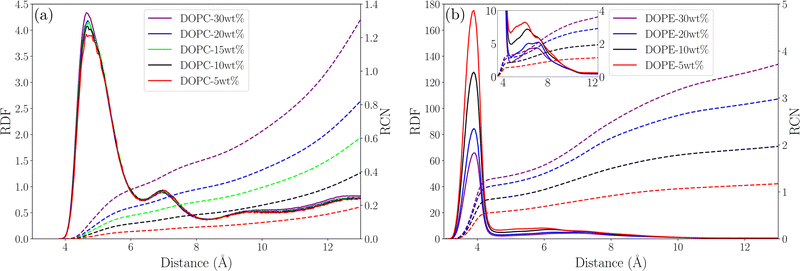 |
| | Fig. 3 Phosphorous–nitrogen RDF (solid line) and RCN (dashed line) for (a) DOPC systems and (b) DOPE systems with the inlet showing the second RDF peak in the close-up. | |
In order to gain additional insight into the structural changes that the lipid–ethanol mixtures undergo we visualized the simulated systems. Fig. 4 shows snapshots of the simulated systems from the end of the simulations. It can be noted that when the lipid concentration increases DOPC lipids remain distributed uniformly in the system. However, for the systems with DOPE the lipids show a clear tendency to form small aggregates with clusters consisting of typically <10 polar headgroups in proximity to each other. This is in agreement with the results from the RDF analysis showing that while RDFs for DOPC are essentially independent of lipid concentration the RDFs for DOPE show decreasing height of peaks with increased concentration. This can be understood in terms of formation of small lipid clusters and shows that the character of the polar headgroup plays an important role for the aggregation behavior of lipids in ethanol. In order to understand on what time scale formation of such clusters take place we investigated how the RDF between COM of DOPE lipids vary between 50 ns time windows in the trajectory. Fig. S4 in the S5 Section of ESI† shows how the RDF curves change as a function of time for the system with the highest and the lowest concentration (DOPE-30 wt% and DOPE-5 wt%) up to simulation time of 500 ns as well as the maximum value of each RDF projected onto the yz-plane. It can be noted that the shape of the RDF curve for DOPE-30 wt% converges to its equilibrium shape within the first 100–150 ns and then remains essentially identical throughout the rest of the simulation. For DOPE-5 wt% the RDF maximum increases up to 200 ns and then becomes stable. This suggests that the structure of the system, consisting of smaller lipid clusters (Fig. 4), becomes stable during this initial time (100–200 ns) and remains unchanged thereafter. The faster convergence for DOPE-30 wt% compared to DOPE-5 wt%, despite slower diffusion in DOPE-30 wt%, can be explained by shorter average lipid–lipid separation due to a higher concentration as they come together. It should be noted that in our experiments DOPE did not dissolve in ethanol for lipid concentrations >5 wt%. Simulations were started with lipid molecules dissolved in ethanol and no larger aggregates were observed. It should be pointed out that the time scale accessible to MD simulations is limited and can be too short for large aggregates to form. However, RDFs from simulations indicate that DOPE has stronger aggregation tendency than DOPC which is in line with experiment.
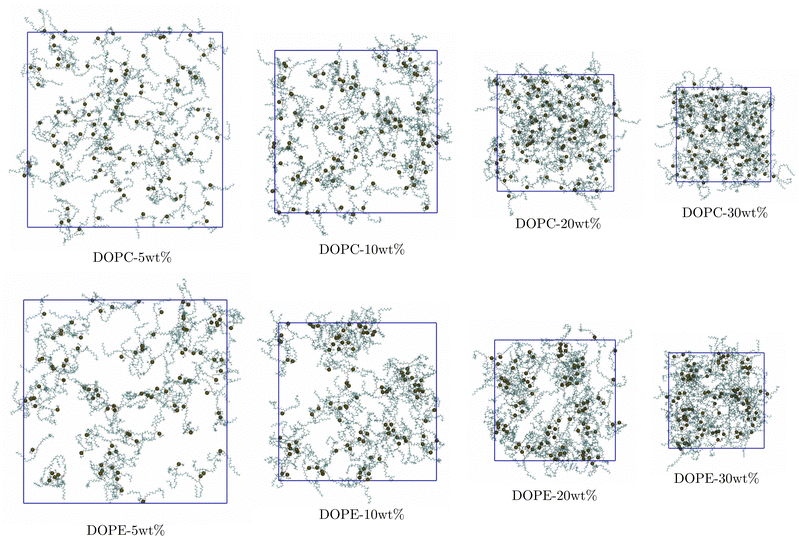 |
| | Fig. 4 Snapshots showing distribution of lipids at the end of simulations (carbon-cyan, hydrogen-white, oxygen-red, nitrogen-blue, and phosphorous-black van der Waals spheres). | |
3.2 Diffusion
Diffusion is an important property describing the rate at which molecules migrate in a liquid mixture and thus affect the time scale for aggregation as well as other important processes including transport and uptake of pharmaceutical compounds through the skin. Furthermore, it is highly sensitive to structural reorganization/aggregation which can lead to a significant slowing down of diffusion. In order to better understand how the dynamics of lipids and ethanol molecules in the mixture depend on lipid concentration we computed the mean square displacement (MSD) for the center of mass (COM) of these molecules. The obtained MSD curves (see Fig. S5 and S6 in the S6 Section of the ESI†) show that the MSD gradually decreases with increased lipid concentration both for DOPC (see Fig. S5a, ESI†) and DOPE (see Fig. S5c, ESI†). However, the difference when increasing the lipid concentration from 20 to 30 wt% is smaller for DOPE compared to DOPC. For ethanol we also found that the MSD decreases when the lipid concentration is increased. The diffusion coefficient is related to slope of the MSD curve in the long time limit according eqn (2):| |  | (2) |
where r(t) is the position of a lipid molecule's COM at a time origin t and r(t + τ) is the position at a later time t + τ where τ is the lag time. The angle brackets in eqn (1) denote an average over molecules and time origins on the trajectory. We computed diffusion coefficients from the slopes of the MSD curves in Fig. S5 and S6 (ESI†) in the range 50 ns ≤ τ ≤ 100 ns for lipids and 1 ns ≤ τ ≤ 4 ns for ethanol. Uncertainties correspond to standard deviations obtained from five different parts of the trajectories. The computed diffusion coefficients are presented together with results from NMR in Table 2. Fig. 5(a) and (b) shows diffusion coefficients for lipids and ethanol as a function of the lipid concentration. For diffusion of lipids (see Fig. 5(a)) the simulations correctly reproduce the trend of decreasing diffusion but it is noted that the simulation data overestimates the NMR results by up to 1.0 × 10⁻⁶ cm2 s−1 for DOPC at the lower lipid concentrations while the agreement is excellent for 30 wt%. This gives confidence that the simulations presented in this work correctly describe dynamics of lipid molecules in the mixture. The slight overestimation of diffusion for low lipid concentration can be attributed to the ethanol model used in this work giving faster diffusion for ethanol than the values obtained from NMR. It is noted that the values for ethanol from our simulations is about a factor of two larger than that measured with NMR independent of lipid concentration (see Fig. 5(b)). The decrease of diffusion coefficient is almost linear both in the data from experiment and from simulation. However, the simulation predicts a more rapid decrease than what is observed in the NMR experiment. For both lipids and ethanol the decrease of the diffusion coefficient as function of lipid concentration is gradual suggesting that the system does not undergo structural rearrangements affecting diffusion in the investigated concentration range. Yeh and Hummer36 have suggested a correction of diffusion coefficients calculated in systems of finite size with periodic boundary conditions. Corrected diffusion coefficients are presented in Section S7 of the ESI.† However, since our simulations already overestimate diffusion coefficients the corrected values are in worse agreement with NMR.
Table 2 Diffusion coefficients and viscosities from MD simulations and experiment
| System |
D
lipid (MD) [10−6 × cm2 s−1] |
D
lipid (Exp) [10−6 × cm2 s−1] |
D
EtOH (MD) [10−6 × cm2 s−1] |
D
EtOH (Exp) [10−6 × cm2 s−1] |
η (MD) [mPa s] |
η (Exp) [mPa s] |
| EtOH |
— |
— |
24.06 ± 0.07 |
10.69 ± 0.26 |
0.47 ± 0.03 |
1.09638 |
| DOPC-5 wt% |
3.74 ± 0.04 |
2.72 ± 0.11 |
21.63 ± 0.07 |
9.89 ± 0.06 |
0.52 ± 0.06 |
1.5 ± 0.2 |
| DOPC-10 wt% |
3.00 ± 0.15 |
2.15 ± 0.15 |
19.23 ± 0.10 |
9.07 ± 0.19 |
0.64 ± 0.05 |
1.8 ± 0.2 |
| DOPC-15 wt% |
2.36 ± 0.07 |
1.75 ± 0.03 |
16.97 ± 0.04 |
8.26 ± 0.13 |
0.68 ± 0.05 |
— |
| DOPC-20 wt% |
1.87 ± 0.04 |
1.53 ± 0.03 |
14.78 ± 0.06 |
7.55 ± 0.11 |
0.90 ± 0.06 |
3.0 ± 0.3 |
| DOPC-30 wt% |
1.13 ± 0.05 |
1.02 ± 0.02 |
10.89 ± 0.04 |
6.00 ± 0.04 |
1.28 ± 0.09 |
4.1 ± 0.2 |
| DOPE-5 wt% |
2.62 ± 0.08 |
2.54 ± 0.10 |
21.73 ± 0.05 |
9.99 ± 0.16 |
0.53 ± 0.02 |
1.5 ± 0.1 |
| DOPE-10 wt% |
2.02 ± 0.15 |
— |
19.47 ± 0.08 |
— |
0.62 ± 0.03 |
— |
| DOPE-20 wt% |
1.13 ± 0.03 |
— |
15.58 ± 0.08 |
— |
0.88 ± 0.09 |
— |
| DOPE-30 wt% |
0.54 ± 0.04 |
— |
11.98 ± 0.07 |
— |
1.37 ± 0.12 |
— |
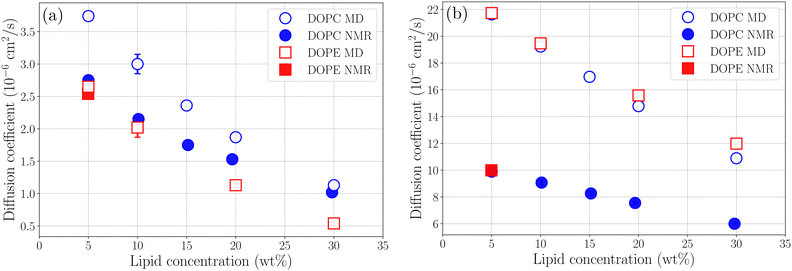 |
| | Fig. 5 Diffusion coefficients for (a) lipids and (b) ethanol as a function of lipid concentration. | |
3.3 NMR relaxation
In order to investigate the reorientational dynamics of molecules in the mixture we computed longitudinal relaxation times (T1) for protons in different environments as a function of lipid concentration. The longitudinal relaxation time carries information about the reorientation rates of molecular vectors in different parts of the lipid molecule. For relaxation by second rank interactions (e.g.1H–1H dipolar interaction) the relevant TCF is that of l = 2 spherical harmonics for the orientation of the spin–spin vector with respect to an external magnetic field. In an isotropic system the orientation of the spin–spin vector with respect to the magnetic field is specified by the polar angle θ alone and the spherical harmonics reduce to Legendre polynomials. For computational simplicity we computed the TCF of the second order Legendre polynomial, see eqn (3):| | | C(τ) = 〈P2[u(t)·u(t + τ)]〉 | (3) |
where u(t) is a molecular vector at a time origin t and u(t + τ) is the same vector at a later time t + τ where τ is the lag time and P2(x) = (3x2 − 1)/2 is the second order Legendre polynomial. Angular brackets denote an average over time origins and molecules in the system. Although one should in principle consider reorientation of H–H vectors for relaxation via1H–1H dipolar interaction we expect correlation times of C–H vectors to carry the same information about the local reorientational dynamics in different parts of the molecules and therefore use these in our calculation of relaxation times. The longitudinal relaxation time is directly related to the spectral density function, i.e. Fourier transform of the TCF. A central quantity in relaxation theory is the correlation time which is the integral of the TCF, according to eqn (4):| |  | (4) |
Under assumption that fluctuations in the polar angle θ and the spin–spin distance are uncorrelated one obtains in the extreme narrowing limit (ωτc ≪ 1 where ω is the Larmor frequency), a simple expression for the relaxation time,37,38 see eqn (5):
| |  | (5) |
where
μ0 is the vacuum permeability,
ħ is reduced Planck's constant,
γ is the proton gyromagnetic ratio,
rij is the spin–spin separation and
N accounts for the number of spin–spin interactions. Since the Larmor frequency is of the order ∼10
6 Hz and correlation times are of the order ∼10
−12 s the extreme narrowing condition is satisfied. The ∼
r−3 dependence of the dipolar interaction motivates only considering relaxation due to spins in spatial proximity. Here we take
N to be the number of neighboring protons bonded to the same carbon atom and use 〈
rij〉 = 1.79 Å which is the H–H distance corresponding to the C–H bond length of 1.1 Å and H–C–H angle of 109°.
Fig. 6 shows TCFs and relaxation times for C18 protons in DOPC and CH
2 protons in ethanol (results for other protons are found in Tables S2 and S3 in the S8 Section of the ESI
†). It can be noted that the calculated relaxation times are of the same order of magnitude as those measured using NMR for C18 protons (
Fig. 6(a) and (c)) but for CH
2 protons in ethanol (
Fig. 6(b) and (d)) the relaxation time is about one order of magnitude longer in the simulations compared to NMR. This difference is most certainly due to the influence of atmospheric paramagnetic oxygen dissolved in the NMR samples.
39 The MD simulations showed weak concentration dependence for
T1 which is in agreement with NMR results. This gives confidence that our simulations give a realistic description of reorientational dynamics of lipid molecules in the lipid–ethanol mixture. For CH
2 protons in ethanol
T1 from both NMR and MD simulations predict that
T1 decreases with increasing lipid concentration due to slowing down of reorientational dynamics (longer
τc). However, the effect is stronger in the simulation data which suggest that relaxation is dominated by some mechanism other than dipolar interaction,
i.e. paramagnetic relaxation from dissolved oxygen. It should be noted here that deviations from the experimental values of
T1 are sensitive to our choice of 〈
rij〉 but do not affect the trends which are in line with experiment. The method for calculating longitudinal relaxation times used here is simplified, and studying more correctly the reorientation dynamics requires more detailed analysis. However, our approach gives an overall agreement with experimental data and the deviations observed for ethanol can be attributed to paramagnetic relaxation and limitations in the force field description of ethanol.
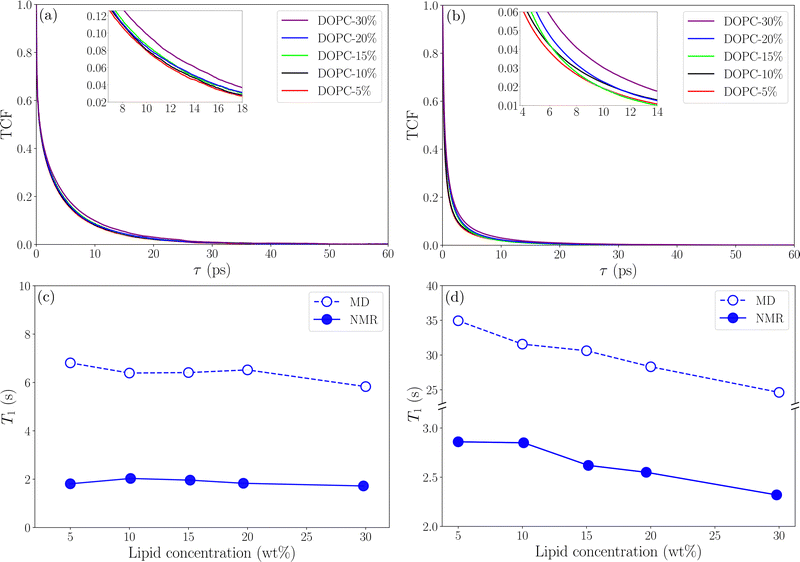 |
| | Fig. 6 TCFs and longitudinal relaxation time for protons as a function of lipid concentration (a)–(c) C18 and (b)–(d) CH2 in ethanol. The inlets show parts of TCF curves in the close-up. | |
3.4 Viscosity
Another property of the lipid–ethanol mixture that is essential for pharmaceutical applications is viscosity. This quantity describes the liquid mixtures resistance to flow and is important to control in order for the mixture to have the desired rheological properties. For a topical formulation to be applied onto skin by spraying it must have viscosity in a suitable range. Viscosity can be estimated from equilibrium simulations by analysis of fluctuations in the off-diagonal elements of the pressure tensor. We calculated viscosity using the following Green–Kubo relation, see eqn (6):| |  | (6) |
where Pαβ (t) is an off-diagonal element of the pressure tensor at a time origin t and Pαβ (t + τ) is its value at a later time t + τ where τ is the lag time. The angle brackets denote an average over time origins in the trajectory. Viscosities reported in this work are averages of the three independent off-diagonal elements of the pressure tensor and uncertainties are the corresponding standard deviations. Convergence of the Green–Kubo integral with respect to the upper integration limit is discussed in the S9 Section of the ESI.† Computed viscosities are presented in Table 2 together with corresponding values measured in viscometry experiments. It is noted that the viscosity of pure ethanol from our simulations 0.47 mPa s is about a factor of two smaller than the value 1.096 mPa s reported from viscometry measurements, at temperature 298.15 K and atmospheric pressure, by Gonçalves et al.40Fig. 7 shows viscosity as function of DOPC and DOPE lipid concentration where a clear trend of viscosity increasing with lipid concentration is observed for both DOPC- and DOPE–ethanol mixtures. Also here MD simulations underestimate the viscosity from experiment. This is most likely a consequence of the too fast diffusion of ethanol in our simulations since viscosity and diffusion are inversely related at constant temperature (according to the Stoke–Einstein relation). It should be pointed out that the calculated viscosities for systems with DOPC and DOPE are very similar both in their magnitude and concentration dependence. In fact, the results for DOPC and DOPE fall within each other's error bars and therefore do not allow us to discuss any differences between viscosities due to the different lipid headgroups. However, we note that viscosities for both lipids follow a realistic trend where the viscosity increases gradually as function of lipid concentration and also falls in a reasonable range although somewhat lower than what is measured in viscometry experiments. The gradual increase of viscosity is in line with our results for diffusion and RDFs indicating that no significant aggregation occurs in the investigated concentration range. The Stokes–Einstein relation predicts a linear relation between the diffusion coefficient and the reciprocal viscosity provided that temperature and the effective size of the diffusing molecule are constant. If lipids aggregate deviations from linearity can be expected. In order to obtain further insight about how diffusion and viscosity depend on concentration we plotted lipid diffusion coefficient as function of reciprocal viscosity together with fitted straight lines (see Fig. 8). A linear trend is clearly seen in the data from MD and experiment for DOPC showing that the effective size of molecules does not change as the concentration increases. Results for DOPE in Fig. 8 indicate possible deviations from linearity (though on the edge of statistical error) suggesting weak tendency for aggregation. The different slopes of lines fitted to data from MD simulations and experiments show that the hydrodynamic radius of lipid molecules is somewhat larger in the simulations compared to experiments. Parameters from linear fit and estimated hydrodynamic radii are provided in Table S4 in the S10 Section of the ESI.†
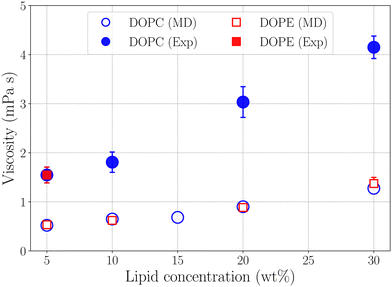 |
| | Fig. 7 Viscosity as a function of lipid concentration from simulations and experiment. | |
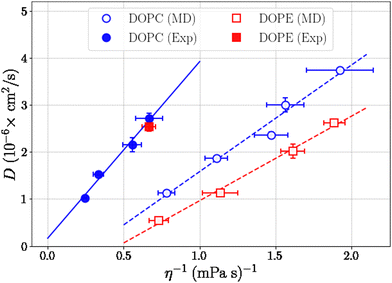 |
| | Fig. 8 Diffusion coefficients for lipids as a function of reciprocal viscosity and lines from linear fit. | |
4 Conclusions
In this work we have studied structure, dynamics and rheology of ethanol–phospholipid mixtures in a composition range relevant for topical drug delivery applications. This was done using a combined MD simulation, NMR and viscometry approach. Several key properties including diffusion coefficients, viscosity and longitudinal relaxation times were computed from the trajectories generated by the simulations. In addition, diffusion coefficients and longitudinal relaxation times were measured using NMR and viscosities were determined by viscometry measurements. It was found that diffusion coefficients for both lipids and ethanol decrease gradually with increasing lipid concentration and that the simulations reproduced the trends in the experimental data quite well. This indicates that no significant rearrangements of lipids occur that affect the dynamics of molecules in the mixture. Diffusion coefficients for lipids were in good agreement with NMR while diffusion of ethanol in the simulations was roughly a factor of two overestimated. This is likely due to limitations in the force field description of ethanol. Longitudinal relaxation times from simulations were of the same order of magnitude as those measured using NMR for lipids and the trend of weak concentration dependence of relaxation times was reproduced. However, the simulations overestimated the relaxation times for ethanol which is most likely due to paramagnetic relaxation effect from dissolved oxygen which is present only in experiments. The structure of the investigated systems was studied using RDFs which showed that while there are no correlations between COM of DOPC lipids for DOPE there is a most probable lipid–lipid separation corresponding to 10–12 Å suggesting that DOPE lipids, in contrast to DOPC, form small clusters. Although there is no most probable separation between COM of DOPC lipids there exist correlations between individual atoms and we found that the strongest effective attraction occurs between the phosphate and choline group. RDF time window analysis indicated that clusters form on the 100–200 ns time scale after which the system keeps its equilibrium structure. While the structure of the system is independent of concentration for DOPC it is seen that for DOPE it gradually changes as function of concentration. However, no large aggregates form on the time scale of our simulations. The lower aggregation tendency of DOPC suggests that it can be more suitable for use in topical drug delivery formations. However, we point out that real formulations contain more components and can exhibit more complex phase behavior than the simple model systems considered in this work. These results give new insight into the phase equilibrium, structure and dynamics of ethanol–phospholipid mixtures in a composition range that has previously not been investigated. Our findings highlight the importance of the chemical structure of the lipid headgroup for the aggregation behavior of lipids in ethanol and can be important for further development of advanced topical drug delivery formulations. Although results from our MD simulations are in reasonable agreement with experiments it should be pointed out that discrepancies are most likely due to limitations in the force field description of molecular interactions. This includes representation of the charge distribution using atomic point charges, no polarizability as well as combination of force fields describing lipids and ethanol. Future work can investigate the effect of changing the length of lipid tails as well as the degree of unsaturation and simulate lipid dissolution in ethanol. Furthermore, simulations can be performed with other force fields in order to verify that our results are general and not sensitive to our choice of interaction potentials.
Author contributions
F. G.: investigation – MD simulations, methodology, visualization, writing – original draft. A. L.: conceptualization, methodology, supervision, writing – review and editing. S. V. D.: conceptualization, investigation – NMR experiments, methodology, writing. V. R.: conceptualization, methodology, writing. J. H.: conceptualization, methodology, writing.
Conflicts of interest
J. H. and V. R. are presently employed by Lipidor AB and F. G.'s PhD position has been funded partly by Lipidor AB. A. L. and S. V. D. report no conflict of interest.
Acknowledgements
This work has been supported and funded by Lipidor AB and by the Swedish Research Council VR project no. 2017-04278 (to S. V. D.) and no. 2021-04474 (to A. L.). Roland Kádár and Ases Akas Mishra at Chalmers University of Technology are gratefully acknowledged for performing viscometry measurements.
References
- M. Edidin, Lipids on the frontier: a century of cell-membrane bilayers, Nat. Rev. Mol. Cell Biol., 2003, 4, 414–418 CrossRef CAS PubMed.
- R. Chakravarti, R. Singh, A. Ghosh, D. Dey, P. Sharma, R. Velayutham, S. Roy and D. Ghosh, A review on potential of natural products in the management of COVID-19, RSC Adv., 2021, 11, 16711–16735 RSC.
- Y. Deng and A. Angelova, Coronavirus-induced host cubic membranes and lipid-related antiviral therapies: a focus on bioactive plasmalogens, Front. Cell Dev. Biol., 2021, 9, 630242 CrossRef PubMed.
- P. Liu, G. Chen and J. Zhang, A review of liposomes as a drug delivery system: current status of approved products, regulatory environments, and future perspectives, Molecules, 2022, 27, 1372 CrossRef CAS PubMed.
- M. A. Lampe, A. L. Burlingame, J. Whitney, M. L. Williams, B. E. Brown, E. Roitman and P. M. Elias, Human stratum corneum lipids: characterization and regional variations, J. Lipid Res., 1983, 24, 120–130 CrossRef CAS.
- S. M. Gruner, P. R. Cullis, M. J. Hope and C. P. S. Tilcock, Lipid polymorphism: the molecular basis of nonbilayer phases, Annu. Rev. Biophys. Biophys. Chem., 1985, 14, 211–238 CrossRef CAS PubMed.
- N. B. Rego and A. J. Patel, Understanding hydrophobic effects: Insights from water density fluctuations, Annu. Rev. Condens. Matter Phys., 2022, 13, 303–324 CrossRef.
- M. Patra, E. Salonen, E. Terama, I. Vattulainen, R. Faller, B. W. Lee, J. Holopainen and M. Karttunen, Under the influence of alcohol: the effect of ethanol and methanol on lipid bilayers, Biophys. J., 2006, 90, 1121–1135 CrossRef CAS PubMed.
- T. Kondela, J. Gallová, T. Hauß, J. Barnoud, S. J. Marrink and N. Kučerka, Alcohol interactions with lipid bilayers, Molecules, 2017, 22, 2078 CrossRef PubMed.
- Shobhna and H. K. Kashyap, Deciphering Ethanol-Driven Swelling, Rupturing, Aggregation, and Fusion of Lipid Vesicles Using Coarse-Grained Molecular Dynamics Simulations, Langmuir, 2022, 38, 2445–2459 CrossRef CAS PubMed.
- R. Gupta, Y. Badhe, B. Rai and S. Mitragotri, Molecular mechanism of the skin permeation enhancing effect of ethanol: A molecular dynamics study, RSC Adv., 2020, 10, 12234–12248 RSC.
- J. Holmbäck, V. Rinwa, T. Halthur, P. Rinwa, A. Carlsson and B. Herslöf, AKVANO®: A Novel Lipid Formulation System for Topical Drug Delivery-In Vitro Studies, Pharmaceutics, 2022, 14, 794 CrossRef PubMed.
- U. Vierl, L. Löbbecke, N. Nagel and G. Cevc, Solute effects on the colloidal and phase behavior of lipid bilayer membranes: ethanol-dipalmitoylphosphatidylcholine mixtures, Biophys. J., 1994, 67, 1067–1079 CrossRef CAS PubMed.
- H. E. Fischer, A. C. Barnes and P. S. Salmon, Neutron and x-ray diffraction studies of liquids and glasses, Rep. Prog. Phys., 2005, 69, 233 CrossRef.
- B. W. Koenig and K. Gawrisch, Lipid–Ethanol Interaction Studied by NMR on Bicelles, J. Phys. Chem. B, 2005, 109, 7540–7547 CrossRef CAS PubMed.
- V. Castro, S. V. Dvinskikh, G. Widmalm, D. Sandström and A. Maliniak, NMR studies of membranes composed of glycolipids and phospholipids, Biochim. Biophys. Acta, Biomembr., 2007, 1768, 2432–2437 CrossRef CAS PubMed.
- A. Vishnyakov, A. P. Lyubartsev and A. Laaksonen, Molecular dynamics simulations of dimethyl sulfoxide and dimethyl sulfoxide-water mixture, J. Phys. Chem. A, 2001, 105, 1702–1710 CrossRef CAS.
- H. Kovacs and A. Laaksonen, Molecular dynamics simulation and NMR study of water-acetonitrile mixtures, J. Am. Chem. Soc., 1991, 113, 5596–5605 CrossRef CAS.
- J. Wang, R. M. Wolf, J. W. Caldwell, P. A. Kollman and D. A. Case, Development and testing of a general amber force field, J. Comput. Chem., 2004, 25, 1157–1174 CrossRef CAS PubMed.
- J. Wang, W. Wang, P. A. Kollman and D. A. Case, Antechamber: an accessory software package for molecular mechanical calculations, J. Am. Chem. Soc., 2001, 222, 1157–1174 Search PubMed.
- D. M. T. Newsham and E. J. Mendez-Lecanda, Isobaric enthalpies of vaporization of water, methanol, ethanol, propan-2-ol, and their mixtures, J. Chem. Thermodyn., 1982, 14, 291–301 CrossRef CAS.
- F. Grote and A. P. Lyubartsev, Optimization of slipids force field parameters describing headgroups of phospholipids, J. Phys. Chem. B, 2020, 124, 8784–8793 CrossRef CAS PubMed.
- J. P. M. Jämbeck and A. P. Lyubartsev, Derivation and systematic validation of a refined all-atom force field for phosphatidylcholine lipids, J. Phys. Chem. B, 2012, 116, 3164–3179 CrossRef PubMed.
- J. P. M. Jämbeck and A. P. Lyubartsev, Exploring the free energy landscape of solutes embedded in lipid bilayers, J. Phys. Chem. Lett., 2013, 4, 1781–1787 CrossRef PubMed.
- R. W. Hockney, S. P. Goel and J. W. Eastwood, Quiet high-resolution computer models of a plasma, J. Comput. Phys., 1974, 14, 148–158 CrossRef.
- B. Hess, H. Bekker, H. J. C. Berendsen and J. G. E. M. Fraaije, LINCS: a linear constraint solver for molecular simulations, J. Comput. Chem., 1997, 18, 1463–1472 CrossRef CAS.
- G. Bussi, D. Donadio and M. Parrinello, Canonical sampling through velocity rescaling, J. Chem. Phys., 2007, 126, 014101 CrossRef PubMed.
- H. J. C. Berendsen, J. P. M. Postma, W. F. Van Gunsteren, A. DiNola and J. R. Haak, Molecular dynamics with coupling to an external bath, J. Chem. Phys., 1984, 81, 3684–3690 CrossRef CAS.
- D. Van Der Spoel, E. Lindahl, B. Hess, G. Groenhof, A. E. Mark and H. J. C. Berendsen, GROMACS: fast, flexible, and free, J. Comput. Chem., 2005, 26, 1701–1718 CrossRef CAS PubMed.
- T. Darden, D. York and L. Pedersen, Particle mesh Ewald: An N·log (N) method for Ewald sums in large systems, J. Chem. Phys., 1993, 98, 10089–10092 CrossRef CAS.
- M. Parrinello and A. Rahman, Polymorphic transitions in single crystals: A new molecular dynamics method, J. Appl. Phys., 1981, 52, 7182–7190 CrossRef CAS.
- Z. Zhou, B. G. Sayer, D. W. Hughes, R. E. Stark and R. M. Epand, Studies of Phospholipid Hydration by High-Resolution Magic-Angle Spinning Nuclear Magnetic Resonance, Biophys. J., 1999, 76, 387–399 CrossRef CAS PubMed.
- N. H. Rhys, I. M. Duffy, C. L. Sowden, L. Christopher, C. D. Lorenz and S. E. McLain, On the hydration of DOPE in solution, J. Chem. Phys., 2019, 150, 115104 CrossRef PubMed.
- W. S. Price, Pulsed-field gradient nuclear magnetic resonance as a tool for studying translational diffusion: Part II. Experimental aspects, Concepts Magn. Reson., 1998, 10, 197–237 CrossRef CAS.
- E. O. Stejskal and J. E. Tanner, Spin Diffusion Measurements: Spin Echoes in the Presence of a Time-Dependent Field Gradient, J. Chem. Phys., 1965, 42, 288 CrossRef CAS.
- I. C. Yeh and G. Hummer, System-size dependence of diffusion coefficients and viscosities from molecular dynamics simulations with periodic boundary conditions, J. Phys. Chem. B, 2004, 108, 15873–15879 CrossRef CAS.
- P. M. Singer, D. Asthagiri, W. G. Chapman and G. J. Hirasaki, Molecular dynamics simulations of NMR relaxation and diffusion of bulk hydrocarbons and water, J. Magn. Reson., 2017, 277, 15–24 CrossRef CAS PubMed.
-
J. Kowalewski and L. Mäler, Nuclear spin relaxation in liquids: theory, experiments, and applications, Taylor & Francis, New York, 2006 Search PubMed.
- M. E. Mirhej, Proton spin relaxation by paramagnetic molecular oxygen, Can. J. Chem., 1965, 43, 1130 CrossRef CAS.
- F. A. M. M. Gonçalves, A. R. Trindade, C. S. M. F. Costa, J. C. S. Bernardo, I. Johnson, I. M. A. Fonseca and A. G. M. Ferreira, PVT, viscosity, and surface tension of ethanol: New measurements and literature data evaluation, J. Chem. Thermodyn., 2010, 42, 1039–1049 CrossRef.
|
| This journal is © the Owner Societies 2023 |
Click here to see how this site uses Cookies. View our privacy policy here.  Open Access Article
 *a,
Sergey V.
Dvinskikh
 b,
Vibhu
Rinwa
c and
Jan
Holmbäck
 c
c

![[thin space (1/6-em)]](https://www.rsc.org/images/entities/char_2009.gif) 509
509![[thin space (1/6-em)]](https://www.rsc.org/images/entities/char_2009.gif) 420
420![[thin space (1/6-em)]](https://www.rsc.org/images/entities/char_2009.gif) 357
357![[thin space (1/6-em)]](https://www.rsc.org/images/entities/char_2009.gif) 685
685![[thin space (1/6-em)]](https://www.rsc.org/images/entities/char_2009.gif) 535
535


