 Open Access Article
Velocity-map imaging of photoelectron circular dichroism in non-volatile molecules using a laser-based desorption source
Chris
Sparling
 a,
Stuart W.
Crane†
 a,
Lewis
Ireland
 a,
Ross
Anderson
 a,
Omair
Ghafur‡
a,
Jason B.
Greenwood
a,
Omair
Ghafur‡
a,
Jason B.
Greenwood
 b and
Dave
Townsend
 *ac
*ac
aInstitute of Photonics & Quantum Sciences, Heriot-Watt University, Edinburgh, EH14 4AS, UK. E-mail: d.townsend@hw.ac.uk
bSchool of Mathematics and Physics, Queen's University Belfast, Belfast, BT7 1NN, UK
cInstitute of Chemical Sciences, Heriot-Watt University, Edinburgh, EH14 4AS, UK
First published on 8th February 2023
Abstract
We present an initial demonstration of a velocity-map imaging (VMI) experiment using a back-irradiation laser-based desorption source directly integrated into the electrode assembly. This has the potential to greatly expand the utility of the popular VMI approach by permitting its use with high density plumes of non-volatile molecular samples. Photoelectron circular dichroism measurements on the phenylalanine molecule using 400 nm multiphoton ionization are used to illustrate this novel method, revealing forward-backward emission asymmetries on the order of 7%.
I. Introduction
The extremely widespread use of velocity-map imaging (VMI)1 throughout the gas-phase molecular dynamics community has developed over the last two decades due to the highly differential nature of the information it provides.2,3 The technique is a high-resolution variant of the photofragment imaging experiments originally pioneered by Chandler and Houston,4 and maps the full three-dimensional (3D) momentum distribution of charged particles (i.e. photoions or photoelectrons) produced in a photodissociation, photoionization or scattering experiment onto a two-dimensional (2D) position sensitive detector. This simultaneously yields both energy- and angle-resolved data in a single image.A key requirement for gas-phase VMI measurements is the introduction of intact sample molecules into a vacuum spectrometer. While this is not often an issue for volatile liquids or solids, many larger molecules, exhibiting lower vapour pressures, can prove more of a challenge. The high temperatures required to evaporate or sublimate low-volatility samples may cause molecules which are more thermally labile to decompose upon heating. This effectively prohibits any meaningful imaging study of these molecules without resorting to alternative sample delivery strategies. The methods of electrospray ionization (ESI) and matrix-assisted laser desorption/ionization (MALDI) are commonly used for gas phase studies of thermally labile, non-volatile molecules.5–9 Although these techniques have provided significant progress in studies of biomolecular spectroscopy and photochemical dynamics, there are limitations to their scope: in ESI, a gas-phase sample is created using polar molecules that easily undergo ion (or proton) attachment (or detachment) and therefore often yield a modified form of the molecule of interest (with potentially different underlying electronic and nuclear structure than in the corresponding neutral species). In MALDI, the preparation conditions must be tailored to the desired target, with the resulting gas-phase sample containing matrix molecules and associated solvents. Very recently, the use of the MALDI approach to produce 3D momentum images of the common matrix solvent 2,5-dihydroxybenzoic acid has been reported.9 More generally though, any images, mass spectrum or – more critically – photoelectron spectrum arising from a laser interaction with a matrix/solvent target will potentially be polluted by these contaminants. This makes MALDI a challenging approach for photoelectron imaging experiments.
An alternative method for preparing gas-phase samples is through use of laser-based desorption (LBD) methods.10–15 In contrast to the techniques mentioned above, this approach facilitates the production of neutral molecular targets that are free from any solvent contamination, and can be applied generally to a wide range of low vapour pressure species. Since laser desorption avoids direct optical interaction with the molecular sample, it is also considerably cleaner and less destructive than simple ablation-based techniques. In the LBD scheme, sample molecules are deposited onto a thin metal substrate, the back (i.e. uncoated) side of which is irradiated by a desorption laser. As expanded upon in more detail shortly, this produces plumes of intact molecules for use in a range of spectroscopic studies.
Many large molecules of potential interest to chemistry and biology exhibit chirality. This leads to two distinct enantiomers existing for a given chiral molecule, one “left-handed” and the other “right-handed”. This handedness has direct consequences for how a molecule can interact with living organisms, particularly due to stereospecific bindings at sites on macromolecules. The ability to synthesize enantiopure compounds and develop reliable chiral recognition techniques is therefore clearly of great importance to a wide range of fields under the umbrella of biological and chemical sciences. This is particularly relevant in the pharmaceuticals sector, where enantio-specificity is a critical consideration for the development, testing, and quality assurance of many drugs. Identifying and quantifying chirality therefore remains an active area of research. Techniques such as polarimetry and circular dichroism (CD)16,17 spectroscopy rely on weak interactions between the magnetic dipole moment of chiral molecules and the propagating electromagnetic radiation. This can be observed experimentally as either the rotation of the plane of incident linearly polarized light, or in the differential absorption of left- and right-circularly polarized light. Due to the weak nature of CD effects, however, the difference in measured signals is inherently small (typically less than 0.1%). As such, these techniques are often only feasible for solution phase measurements where sample densities are high. For chiral recognition in the gas phase, a stronger universal physical interaction is desired.
In recent years, photoelectron circular dichroism (PECD) has become a leading candidate for such a probe. Instead of relying on differential absorption due to weak magnetic dipole effects, PECD manifests itself as an asymmetry in the laboratory frame photoelectron angular distribution (PAD) of a gas-phase chiral molecular sample following ionization with circularly polarized light.18 The asymmetry can be measured directly using a simple stereo detection system, where the total yield of photoelectrons moving forwards or backwards relative to the direction of laser beam propagation are collected independently.15,19,20 Alternatively, a more detailed, angle-resolved view of the dichroism may be obtained using VMI techniques. By ionizing a chiral sample molecule with alternately left- and right-circularly polarized light and examining the difference between the two PAD images, the PECD effect can be isolated and analyzed.21–24 This chiroptical phenomenon is present even within the electric dipole approximation, and so has significantly larger (typically two orders of magnitude) signal levels when compared to other CD related effects. This has fast-tracked PECD to be the dominant tool for studying chiral molecules in the gas phase.19,24–29 For the approach to revolutionise the speed and sensitivity by which chiral pharmaceuticals can be analysed, however, a simple and reliable method for delivering a wide range of low vapour pressure solid samples into the gas phase is required.
In this report, we present the first use of an LBD source within a VMI experiment by recording and analysing the PECD of the highly non-volatile phenylalanine molecule. This approach is a complimentary strategy to recent studies using ESI sources6–8 to investigate the PECD of non-volatile systems in anionic form. With the approach detailed here, however, the PECD imaged is that of the neutral molecule. We compare the recorded PAD images and corresponding high-quality PECD images for L-, D- and DL-phenylalanine, demonstrating that the novel spectrometer we have developed can measure subtle enantiomeric properties. It is anticipated this work will help pave the way for the use of LBD sources in a wide variety of photochemical imaging studies on low-vapour-pressure systems, greatly expanding the utility of VMI and PECD experiments.
II. Experimental methodology
The LBD set-up used for this work is based on the initial approach employed by Greenwood and co-workers12,13 and has been used previously within our research group for performing time-resolved ion-yield measurements.30–32 PECD effects in low vapour pressure systems (including phenylalanine) have also been studied using LBD sources, but have made use of the stereo-collection technique discussed earlier.15,19,20 The work presented here represents the first demonstration of how such an LBD apparatus may be exploited specifically for much more powerful imaging applications. Given the inherent advantage the imaging approach affords by providing complete energy- and angle-resolved information in a single measurement, extending the range of systems that may be studied in this way represents a significant advance.An overview illustration of the experimental set-up is presented in Fig. 1. Briefly, the source consists of a piece of 10 μm thick 316 stainless steel foil (Ø 32 mm) onto which powdered sample of L-, D- or DL-phenylalanine (obtained from TCI, with a stated purity and enantiomeric excess of ≥98%) was deposited. This is simply done by placing a small amount of powdered sample onto the foil centre and then adding a few drops of methanol. The resulting suspension is then spread out evenly over the foil to produce a uniform coating (typically 0.3–0.5 mm thick) once the methanol evaporates. This procedure is found to be just as effective as more complicated application strategies (e.g. airbrushing). The coated foil was then clamped within the repeller electrode forming part of the ion optics assembly used for VMI of photoelectrons produced during ionization. The 445 nm output from a continuous-wave (CW) laser diode (Kale CNC, max. output 1 W) was focused onto the rear (i.e. uncoated) side of the foil to produce a plume of desorbed phenylalanine molecules. Both CW and nanosecond pulsed lasers are commonly used for desorption sources.13 Recent work from Wang et al.14 has provided a direct like-for-like comparison of the two different approaches and concludes that near identical desorbed plumes can be produced in each case. Due to the low cost and wide availability of CW diode lasers, we anticipate that these sources will be a more popular first choice for experimental groups seeking to develop their own LBD experiments. The centre of the circular foil is displaced from the central time-of-flight axis of the spectrometer. This allowed for the sample to be periodically replenished by rotating the foil within the repeller electrode using an air-to-vacuum feedthrough and a simple gear assembly. To achieve steady signal levels, the foil was continuously rotated at a speed of approximately 5 mrad s−1. The thinness of the foil along with the low thermal conductivity of stainless steel ensures that absorption of the irradiating CW laser generates a localized hotspot from which molecules undergo thermally induced desorption. The temperature and area of this focal spot was controlled by adjusting the voltage supplied to the diode and/or by varying the focusing conditions of the desorption laser beam. For this experiment, the desorption laser power used was 300 mW and the beam was focused to a spot size approximately 1 mm in diameter. From previous work12,30 we estimate the maximum temperature of the spot on the foil to be 410 ± 10 K and, based on an assumed 5% ionization efficiency, calculate a plume number density of order 108 cm−3.
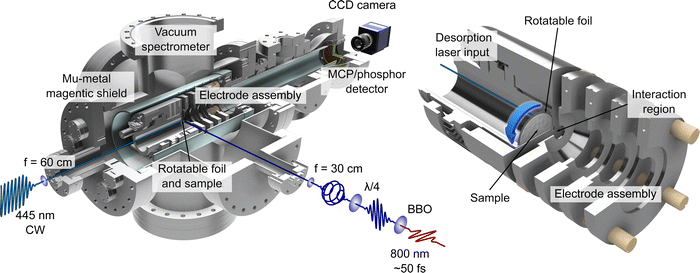 | ||
| Fig. 1 Illustrations of the LBD-VMI experimental setup. On the left, a half-sectional view of the complete vacuum spectrometer is shown, with the LBD source mounted inside. Schematics of the optical setup for the desorption and photoionization lasers are also shown. On the right, a closeup half-sectional view of the LBD source and VMI electrode assembly is shown. The sample foil is shown in full. The centre of the circular foil is displaced from the main time-of-flight axis of the spectrometer so that the sample may be replenished periodically by rotating the foil – as indicated by the blue arrow. See the main text and ref. 30 for additional details. | ||
The laser system for production of the ionizing PECD pulses was a 1 kHz, regeneratively amplified Ti:sapphire system (Spectra-Physics, Spitfire Pro/Empower) seeded by a Ti:sapphire oscillator (Spectra-Physics, Tsunami/Millennia eV). The fundamental output had a central wavelength of 800 nm with a temporal pulse duration of 55 fs (full width at half maximum). The 400 nm (10 μJ per pulse, 9 × 10¹³ W cm−2 when focused) second harmonic of the fundamental was produced using a 0.5 mm thick β-barium borate (BBO) crystal. The polarization state of the 400 nm pulses was controlled using a quarter-waveplate (EKSMA Optics 460-4435) mounted in a high-precision motorized rotation stage (Thorlabs K10CR1/M). This facilitated frequent automated switching between left circular polarization (LCP) or right circular polarization (RCP) during PECD data acquisition. The degree of circular polarization can be quantified by measuring the corresponding Stokes vectors.33 Characteristic plots measuring the critical S3 Stokes parameter of the LCP and RCP light using the quarter-waveplate method are shown within the upper panel of Fig. 2. For both LCP and RCP light, the beam is highly circularly polarized (|S3| = 0.99 ± 0.01). The corresponding S1 and S2 Stokes parameters (describing any linear components of the polarization) are both measured to be <0.05.
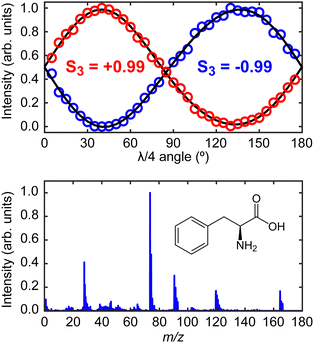 | ||
| Fig. 2 Upper panel shows the S3 Stokes parameter characterization plots for the left- (S3 = −0.99) and right-circular (S3 = +0.99) laser polarizations.33 These values are very close to the limiting cases of −1 and +1, respectively. Lower panel shows the time-of-flight mass spectrum of phenylalanine recorded using the instrument described in Fig. 1, along with a schematic molecular structure of the L-enantiomer. Detailed peak assignments can be found in Huang et al.11 | ||
The desorbed plume of phenylalanine molecules produced by the CW diode laser intersected with the focused (f = 30 cm) 400 nm PECD laser pulses approximately 2–3 mm above the foil surface. Photoelectrons generated following ionization were then accelerated along a flight tube towards a 40 mm MCP detector coupled to a phosphor screen. The 2D projection of the full 3D-PAD was then imaged using a CCD camera (640 × 480 pixels) positioned externally to the vacuum spectrometer. Based on the size of the image relative to calibration reference data (expanded upon in more detail below), we may reasonably assume phenylalanine molecules are ionized predominantly via three-photon absorption (D0 adiabatic and vertical ionization potentials of phenylalanine are 8.5 eV and 8.9 eV, respectively,34 while the total 3 × 400 nm photon energy is 9.3 eV). The laser polarization switching, and image acquisition were controlled by LabVIEW software developed in-house. Starting with LCP light, an image was recorded and averaged over 2.5 × 10⁴ laser shots, before moving to the RCP position on the quarter-waveplate. A complete data set consisted of 10 cycles back and forth between the two circular polarizations. Before imaging any photoelectrons, the polarity of the VMI electrodes was reversed to record a time-of-flight mass spectrum by using a fast silicon photomultiplier (SensL, MicroFm-100350 × 18/MicroEVB-1mm) to pick up light emitted from the phosphor screen. This information (see lower panel of Fig. 2) confirmed that no phenylalanine clusters were present in the desorbed sample, and no material was detected from the foil substrate itself. The parent and fragment m/z features detected in our mass spectrum show excellent position and relative intensity agreement with results reported by Huang et al. using both strong-field and electron impact ionization methods.11 Upon finishing data collection, a very low background pressure of 1,3-butadiene was introduced into the spectrometer via a needle valve. This allowed recording of additional data from a molecule with a well-known, structured photoelectron spectrum to provide accurate image pixel-to-energy calibration.
III. Results and discussion
Fig. 3 presents the raw experimental images recorded for D-, L-, and DL-phenylalanine using LCP and RCP ionization light. The right column then shows the PECD normalized difference image for each pure enantiomer and the racemate. A clear asymmetry (of around 7%) can be seen in the PECD images of both the L- and D-phenylalanine, whereas this effect cancels out to zero for the DL-racemic mixture. The sign of the asymmetry is also switched for the two different enantiomers. This asymmetry can be quantified in a single term, known as the G-value.35 By first integrating over all forward (denoted as F, for angles 0° through 90°) and backward (B, for angles 90° to 180°) photoelectron emission angles for each laser polarization (denoted by the superscript p = +1 for LCP and p = −1 for RCP) G may be calculated using eqn (1): | (1) |
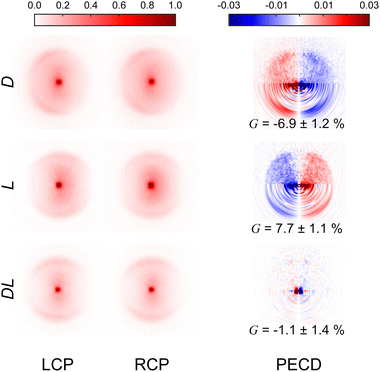 | ||
| Fig. 3 Experimental VMI images recorded for D-, L- and DL-phenylalanine using both LCP and RCP. The laser propagation direction is from left to right and the images are 2-fold symmetrized (i.e. the top and bottom halves of the raw data have been averaged together – which is valid given the symmetry of the photoelectron angular distribution described by eqn (2)). The PECD difference images (LCP – RCP) are also included in the right-hand column. The lower half of these PECD images show processed output following application of the pBASEX method. A clear asymmetry is present in the PECD images for each enantiomer. For D-phenylalanine, the PECD image reveals an overabundance of photoelectrons detected in the backwards direction (indicated by red on the colour scheme) with a corresponding depletion of electrons in the forwards direction (blue). This asymmetry is of similar magnitude for L-phenylalanine, but of opposite sign (red and blue are exchanged). Within a small degree of background noise, no significant asymmetry is seen for racemic phenylalanine, as expected. See text for details and discussion. | ||
These values are included in Fig. 3 and are in excellent agreement with each other (equal in magnitude but opposite in sign). This confirms that LBD-based imaging techniques are a highly sensitive tool for studying large non-volatile molecular systems and their chiral properties.
A more quantitative description of PECD can be found by reconstructing the full 3D-PAD for each laser polarization. Due to the three-photon nature of the ionization process, the original 3D-PAD will have the following generalized form for a given polarization:24,36
 | (2) |
 | (3) |
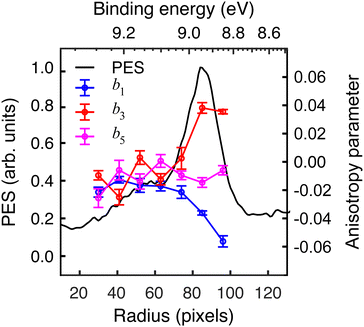
The extracted radial distribution and angular coefficients bl for D-phenylalanine are shown in Fig. 4. A majority of the measured asymmetry is due to the b1 contribution, which corresponds to a pure cos![[thin space (1/6-em)]](https://www.rsc.org/images/entities/char_2009.gif) θ forward/backward asymmetry. There is also a smaller, but non-negligible contribution from the b3 and b5 parameters.
θ forward/backward asymmetry. There is also a smaller, but non-negligible contribution from the b3 and b5 parameters.
The influence of conformational state distributions on observed PECD signals has been a popular area of recent research, and conformer-specific experiments have been previously reported.38,39 Even for small conformational changes, the effect on the PECD can be dramatic. The estimated 410 K temperature of the foil in the present LBD measurements places an upper bound on that of the plume itself. At these temperatures, we expect to access a range of phenylalanine conformers, and so the PECD measured here is therefore an average over these. Trying to tune the temperature by lowering the desorption laser power led to a dramatic reduction in signal levels to below those realistically required for an imaging experiment. The images presented here were recorded at the lowest possible foil temperature that permitted stable signal levels. From work by von Helden et al.,40 we estimate that under these conditions three conformers contribute significantly to the observed photoelectron signals in our data, with minimal contributions from other, higher energy structures. Without further temperature control or additional adiabatic cooling measures, it is not possible to isolate the contributions of each individual conformer. This may potentially be achieved, however, by performing the experiment presented here at a series of higher desorption powers and systematically measuring the PECD of the different conformational ensembles as a function of temperature. This will form the basis of a future publication and is beyond the scope of this present demonstration. By averaging the 30–100 radial pixels region in Fig. 4 (where signal levels are consistently high), a single set of convenient bl parameter values can be used to describe the PECD of each enantiomer, as shown graphically in Fig. 5. These data are broadly consistent, with any small variation in the extremely sensitive anisotropy parameters possibly resulting from uncertainties in the quoted enantiomeric excess of the D and L samples.
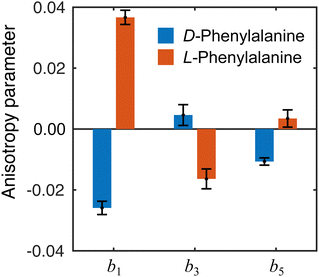 | ||
| Fig. 5 Angular anisotropy parameters bl averaged over the peak (30–100 pixels) in the PES in Fig. 4. The values measured for each enantiomer are in reasonable agreement with each other (similar magnitude but opposite sign), indicating the LBD approach is producing reliable results. Error bars denote a 1σ uncertainty. | ||
The anisotropy parameters may also provide an alternative route to calculate the G-value, as introduced earlier, which for a three-photon multiphoton ionization process, is given by:24
 | (4) |
From the averaged bl values and the derived GMP-value, the PECD measurements performed with the LBD approach for each enantiomer are seen to be consistent with each other (again, approximately equal in magnitude but opposite in sign) and are also in good agreement with the G-values calculated using the simple forward-backward integral approach. These data are summarized in Table 1.
| b 1 | b 3 | b 5 | G MP (%) | G (%) | |
|---|---|---|---|---|---|
| D | −0.026 ± 0.002 | 0.005 ± 0.003 | −0.010 ± 0.001 | −5.7 ± 0.8 | −6.9 ± 1.2 |
| L | 0.038 ± 0.002 | −0.016 ± 0.003 | 0.004 ± 0.001 | 8.2 ± 1.0 | 7.7 ± 1.1 |
| DL | −0.007 ± 0.005 | 0.005 ± 0.006 | −0.008 ± 0.007 | −1.6 ± 0.8 | −1.1 ± 1.4 |
IV. Conclusion
Our successful first demonstration of an LBD source being used for a VMI measurement as challenging and sensitive as PECD clearly demonstrates that the novel instrument we have developed can produce intact gas phase molecules for highly differential imaging studies. As well as expanding the utility of PECD to much more challenging samples, the LBD approach can be exploited generally within any VMI experiment and used more widely for a broad range of photoionization and photodissociation dynamical studies on non-volatile molecular species. We therefore anticipate that our initial demonstration will lead to a wider adoption of LBD sources for use in novel VMI applications within the next few years.Conflicts of interest
There are no conflicts to declare.Acknowledgements
This work was made possible by Leverhulme Trust Research Project Grant RPG-2012-735, Carnegie Trust Research Incentive Grant 70264, and EPSRC Platform Grant (EP/P001459). We also thank Heriot-Watt University for providing C. S. and L. I. with PhD funding and R. A. with an undergraduate summer vacation bursary.References
- A. T. J. B. Eppink and D. H. Parker, Rev. Sci. Instrum., 1997, 68, 3477–3484 CrossRef CAS.
- D. W. Chandler, P. L. Houston and D. H. Parker, J. Chem. Phys., 2017, 147, 013601 CrossRef PubMed.
- X. Yang, D. C. Clary and D. M. Neumark, Chem. Soc. Rev., 2017, 46, 7481–7482 RSC.
- D. W. Chandler and P. L. Houston, J. Chem. Phys., 1987, 87, 1445–1447 CrossRef CAS.
- A. El-Aneed, A. Cohen and J. Banoub, Appl. Spectorsc. Rev., 2009, 44, 210–230 CrossRef CAS.
- P. Krüger and K. M. Weitzel, Angew. Chem., Int. Ed., 2021, 60, 17861–17865 CrossRef PubMed.
- P. Krüger, J. H. Both, U. Linne, F. Chirot and K. M. Weitzel, J. Phys. Chem. Lett., 2022, 13, 6110–6116 CrossRef PubMed.
- J. Triptow, A. Fielicke, G. Meijer and M. Green, Angew. Chem., Int. Ed., 2022, 62, e202212020 Search PubMed.
- G. A. Stewart, D. Debrah, Y. Ranathunga, T. A. Olowolafe, H. B. Schlegel, S. K. Lee and W. Li, J. Phys. Chem. C, 2022, 126, 17135–17140 CrossRef CAS.
- V. V. Golovlev, S. L. Allman, W. R. Garrett, N. I. Taranenko and C. H. Chen, Int. J. Mass Spectrom. Ion Processes, 1997, 169/170, 69–78 CrossRef CAS.
- Z. Huang, T. Ossenbrügen, I. Rubinsky, M. Schust, D. A. Horke and J. Küpper, Anal. Chem., 2018, 90, 3920–3927 CrossRef CAS PubMed.
- C. R. Calvert, L. Belshaw, M. J. Duffy, O. Kelly, R. B. King, A. G. Smyth, T. J. Kelly, J. T. Costello, D. J. Timson, W. A. Bryan, T. Kierspel, P. Rice, I. C. E. Turcu, C. M. Cacho, E. Springate, I. D. Williams and J. B. Greenwood, Phys. Chem. Chem. Phys., 2012, 14, 6289–6297 RSC.
- F. Calegari, A. Trabattoni, A. Palacios, D. Ayuso, M. C. Castrovilli, J. B. Greenwood, P. Decleva, F. Martín and M. Nisoli, J. Phys. B: At., Mol. Opt. Phys., 2016, 49, 142001 CrossRef.
- S. W. Wang, G. L. Abma, P. Krüger, A. van Roij, M. Balster, N. Janssen and D. A. Horke, Eur. Phys. J. D, 2022, 76, 128 CrossRef CAS.
- A. Comby, C. M. M. Bond, E. Bloch, D. Descamps, B. Fabre, S. Petit, Y. Mairesse, J. B. Greenwood and V. Blanchet, Chirality, 2020, 32, 1225–1233 CrossRef CAS PubMed.
- N. Berova, P. Polavarapu, K. Nakanishi and R. Woody, Comprehensive chiroptical spectroscopy, John Wiley & Sons, 2012 Search PubMed.
- L. D. Barron, Molecular light scattering and optical activity, Cambridge University Press, Cambridge, 2004 Search PubMed.
- B. Ritchie, Phys. Rev. A: At., Mol., Opt. Phys., 1976, 13, 1411–1415 CrossRef.
- J. Miles, D. Fernandes, A. Young, C. M. M. Bond, S. W. Crane, O. Ghafur, D. Townsend, J. Sá and J. B. Greenwood, Anal. Chim. Acta, 2017, 984, 134–139 CrossRef CAS PubMed.
- C. M. M. Bond, Doctor of Philosophy, Queen's University Belfast, 2021 Search PubMed.
- G. A. Garcia, L. Nahon, M. Lebech, J. C. Houver, D. Dowek and I. Powis, J. Chem. Phys., 2003, 119, 8781–8784 CrossRef CAS.
- L. Nahon, G. A. Garcia, C. J. Harding, E. Mikajlo and I. Powis, J. Chem. Phys., 2006, 125, 114309 CrossRef PubMed.
- C. Lux, M. Wollenhaupt, T. Bolze, Q. Liang, J. Köhler, C. Sarpe and T. Baumert, Angew. Chem., Int. Ed., 2012, 51, 5001–5005 CrossRef CAS PubMed.
- C. S. Lehmann, N. Bhargava Ram, I. Powis and M. H. M. Janssen, J. Chem. Phys., 2013, 139, 234307 CrossRef PubMed.
- C. Lux, M. Wollenhaupt, C. Sarpe and T. Baumert, Chem. Phys. Chem., 2015, 16, 115–137 CrossRef CAS PubMed.
- S. Beaulieu, A. Ferré, R. Géneaux, R. Canonge, D. Descamps, B. Fabre, N. Fedorov, F. Légaré, S. Petit, T. Ruchon, V. Blanchet, Y. Mairesse and B. Pons, New J. Phys., 2016, 18, 102002 CrossRef.
- A. Comby, S. Beaulieu, M. Boggio-Pasqua, D. Descamps, F. Légaré, L. Nahon, S. Petit, B. Pons, B. Fabre, Y. Mairesse and V. Blanchet, J. Phys. Chem. Lett., 2016, 7, 4514–4519 CrossRef CAS PubMed.
- A. Comby, E. Bloch, C. M. M. Bond, D. Descamps, J. Miles, S. Petit, S. Rozen, J. B. Greenwood, V. Blanchet and Y. Mairesse, Nat. Commun., 2018, 9, 5212 CrossRef CAS PubMed.
- S. Beauvarlet, E. Bloch, D. Rajak, D. Descamps, B. Fabre, S. Petit, B. Pons, Y. Mairesse and V. Blanchet, Phys. Chem. Chem. Phys., 2022, 24, 6415–6427 RSC.
- O. Ghafur, S. W. Crane, M. Ryszka, J. Bockova, A. Rebelo, L. Saalbach, S. De Camillis, J. B. Greenwood, S. Eden and D. Townsend, J. Chem. Phys., 2018, 149, 034301 CrossRef PubMed.
- S. W. Crane, O. Ghafur, T. Y. Cowie, A. G. Lindsay, J. O. F. Thompson, J. B. Greenwood, M. W. P. Bebbington and D. Townsend, Phys. Chem. Chem. Phys., 2019, 21, 8152–8160 RSC.
- S. W. Crane, O. Ghafur, L. Saalbach, M. J. Paterson and D. Townsend, Chem. Phys. Lett., 2020, 738, 136870 CrossRef CAS.
- B. Schaefer, E. Collett, R. Smyth, D. Barrett and B. Fraher, Am. J. Phys., 2007, 75, 163 CrossRef.
- S. Campbell, E. M. Marzluff, M. T. Rodgers, J. L. Beauchamp, M. E. Rempe, K. F. Schwink and D. L. Lichtenberger, J. Am. Chem. Soc., 1994, 116, 5257–5264 CrossRef CAS.
- M. H. M. Janssen and I. Powis, Phys. Chem. Chem. Phys., 2013, 16, 856–871 RSC.
- K. L. Reid, Annu. Rev. Phys. Chem., 2003, 54, 397–424 CrossRef CAS PubMed.
- G. A. Garcia, L. Nahon and I. Powis, Rev. Sci. Instrum., 2004, 75, 4989–4996 CrossRef CAS.
- R. Hadidi, D. K. Božanić, H. Ganjitabar, G. A. Garcia, I. Powis and L. Nahon, Commun. Chem., 2021, 4, 72 CrossRef CAS PubMed.
- J. Dupont, V. Lepère, A. Zehnacker, S. Hartweg, G. A. Garcia and L. Nahon, J. Phys. Chem. Lett., 2022, 13, 2313–2320 CrossRef CAS PubMed.
- G. von Helden, I. Compagnon, M. N. Blom, M. Frankowski, U. Erlekam, J. Oomens, B. Brauer, R. B. Gerber and G. Meijer, Phys. Chem. Chem. Phys., 2008, 10, 1248–1256 RSC.
Footnotes |
| † Present address: Department of Chemistry, Brown University, Providence, RI 02912, USA. |
| ‡ Present address: Daresbury Laboratory, Keckwick Lane, Daresbury, WA4 4AD. |
| This journal is © the Owner Societies 2023 |

