
On the not so anomalous water-induced structural transformations of choline chloride–urea (reline) deep eutectic system†
Hugo
Monteiro
a,
Alexandre
Paiva
a,
Ana Rita C.
Duarte
a and
Nuno
Galamba
 *b
*b
aLAQV, REQUIMTE, Departamento de Química, Nova School of Science and Technology, 2829-516 Caparica, Portugal
bBioISI - Biosystems and Integrative Sciences Institute, Faculty of Sciences of the University of Lisbon, C8, Campo Grande, 1749-016 Lisbon, Portugal. E-mail: njgalamba@fc.ul.pt
First published on 22nd November 2022
Abstract
The choline chloride–urea binary mixture in the molar ratio (1![[thin space (1/6-em)]](https://www.rsc.org/images/entities/char_2009.gif) :2), commonly known as reline, is an archetypal solvent among deep eutectic solvents (DES). Neutron diffraction (ND) and empirical potential structure refinement (EPSR) results provided evidence that reline exhibits a peculiar structural transformation upon water addition that manifests in a sudden dewetting of the choline cations at ∼51 wt% water and, therefore, a non-monotonic variation of the choline–water and choline–choline coordination. Here, we study, through molecular dynamics (MD), the influence of water on the structure of a choline chloride:urea:water DES (1:2:ζ; ζ = 0 to 40), to gain additional insight into the molecular source of this peculiar structural transformation. Five different force fields were investigated. Our results show that the ND/EPSR non-monotonic behavior of the choline–choline coordination is qualitatively reproduced by those force fields that describe more accurately the dynamics of the DES, namely, the diffusion and viscosity coefficients. However, the apparent increase of the choline–choline coordination at ζ > 10 (41 wt%) is associated with the drain of a particular first coordination sphere, rather than with a dewetting of the choline cations, as predicted by ND/EPSR. Thus, a monotonic increase of the choline–water coordination is found instead, as well as the emergence of a tetrahedral hydrogen bond network of water, opposite to ND/EPSR. The highest rate of depletion upon initial hydration is found for urea around choline (∼0.9 urea molecules/ζ), whereas choline depicts the highest rate of hydration (∼2.5 water molecules/ζ). These rates decrease with ζ and a structural transition that stabilizes above 41 wt% is observed, consistent with ND/EPSR results. Despite limitations in the force fields, we argue that the experimental and simulation opposite pictures could be related to an underestimation of water's hydrogen bond network portrayed by the EPSR method. Overall, a smoother transition from a DES to an aqueous solution of the DES components is portrayed by MD, compared with ND/EPSR.
:2), commonly known as reline, is an archetypal solvent among deep eutectic solvents (DES). Neutron diffraction (ND) and empirical potential structure refinement (EPSR) results provided evidence that reline exhibits a peculiar structural transformation upon water addition that manifests in a sudden dewetting of the choline cations at ∼51 wt% water and, therefore, a non-monotonic variation of the choline–water and choline–choline coordination. Here, we study, through molecular dynamics (MD), the influence of water on the structure of a choline chloride:urea:water DES (1:2:ζ; ζ = 0 to 40), to gain additional insight into the molecular source of this peculiar structural transformation. Five different force fields were investigated. Our results show that the ND/EPSR non-monotonic behavior of the choline–choline coordination is qualitatively reproduced by those force fields that describe more accurately the dynamics of the DES, namely, the diffusion and viscosity coefficients. However, the apparent increase of the choline–choline coordination at ζ > 10 (41 wt%) is associated with the drain of a particular first coordination sphere, rather than with a dewetting of the choline cations, as predicted by ND/EPSR. Thus, a monotonic increase of the choline–water coordination is found instead, as well as the emergence of a tetrahedral hydrogen bond network of water, opposite to ND/EPSR. The highest rate of depletion upon initial hydration is found for urea around choline (∼0.9 urea molecules/ζ), whereas choline depicts the highest rate of hydration (∼2.5 water molecules/ζ). These rates decrease with ζ and a structural transition that stabilizes above 41 wt% is observed, consistent with ND/EPSR results. Despite limitations in the force fields, we argue that the experimental and simulation opposite pictures could be related to an underestimation of water's hydrogen bond network portrayed by the EPSR method. Overall, a smoother transition from a DES to an aqueous solution of the DES components is portrayed by MD, compared with ND/EPSR.
I. Introduction
Deep eutectic solvents (DESs) are mixtures formed by a hydrogen bond (HB) donor and an HB acceptor, characterized by a depression of the melting point relative to its components.1–3 While sharing some properties with room temperature ionic liquids, notably, negligible vapor pressures, nonflammability, and thermal stability, they have, in general, several advantages, including, biodegradability, low toxicity, and reduced cost.1 The solvents are usually obtained by mixing Lewis or Brønsted acids and bases and can contain a variety of anionic/cationic species. These green solvents are, therefore, being explored in multiple applications,1,2,4 ranging from electrochemical applications2,5 to biocatalysis,6 and CO2 capture.7,8The mixture of choline chloride and urea at the molar ratio of 1:2, known as reline, was the first DES reported3 and is probably the most studied mixture among DESs.3,9–13 The components, choline chloride and urea, are solid at room temperature, with normal melting points of 575 K and 406 K, respectively, whereas the mixture is liquid with an impressive melting point of 285 K.3
Despite the abovementioned broad range of potential applications, a comprehensive view of the relationship between DESs’ physicochemical properties and structure remains elusive, motivating recent studies that focused on the assessment of the putative formation of a DES based on the mixture's structure.14
DESs are commonly highly viscous fluids and water can be used to reduce the viscosity for specific applications.2 This, in addition to the fact that some DESs, including reline, are hygroscopic, fostered the study of the structure and the physicochemical properties of DESs as a function of the water content.13,15–30
Hammond et al.9 studied the structure of reline through neutron diffraction (ND) and the empirical potential structure refinement (EPSR) method,31 providing key information on the structural organization of the DES components. A subsequent ND/EPSR study by Hammond et al.15 focused on the effect of water on the nanostructure of reline. The latter provided evidence that the DES nanostructure was retained up to 41 wt% H2O because of water sequestration around the choline cations. At 51 wt% H2O, the DES structure was disrupted and water–water and DES–water interactions become dominant, with the mixture being best described as an aqueous solution of the DES components. These results led to the proposal of a structural picture where a “Water-in-DES” to a “DES-in-Water” transition occurs at 51 wt% (83 mol%) H2O, characterized by a non-monotonic variation of the choline–choline, chloride–water, urea–water, and choline–water coordination numbers. This transition is rather abrupt with choline cations losing over five water molecules, on average, from their coordination sphere, upon the transition from a 41 wt% H2O to a 51 wt% H2O system. In addition, water self-hydration is remarkably low at high water contents, when some bulk water-like environment could be expected to emerge in the mixture.
The structure of reline was also widely explored through molecular simulations with both rigid16,32–34 and polarizable10 force fields as well as through first principles10,19 molecular dynamics (MD). Kumari et al.16 reached similar conclusions to those of Hammond et al. through MD simulations, namely, a structural crossover at 41 wt% H2O. Sapir and Harries32 also found, through MD, a transition between a “Water-in-DES” (up to ∼30 wt% H2O) and a “DES-in-Water” (30–50 wt% H2O), whereas beyond ∼50 wt% H2O the solution changed into an aqueous electrolyte-like mixture.
While the abovementioned structural transition seems consensual among simulation and experimental studies the pronounced increase of the choline–choline and decrease of the choline–water coordination upon water addition at 41 wt% H2O remains poorly understood. Furthermore, it is not clear whether such a transition is reproduced by the force fields used in the abovementioned MD works.
Herein, we study, through MD, the mixture of choline chloride and urea at the molar ratio of 1:2 and different water contents, ζ (ζ = 0 to 40). The main goal of this work is two-fold: (a) assess whether force fields explored in previous simulation works can reproduce the experimental ND/EPSR structural results and (b) provide molecular insight into the origin of the non-monotonic hydration of the choline cation and to a less extent of the chloride anion and urea.
The remainder of the article is organized as follows: Section II provides a detailed description of the methods and force fields used; Section III discusses the structure of choline chloride and urea in the absence of water and the water-induced structural transformations of the DES; the merits of each force field are discussed in the light of the diffusion coefficient of the components and the shear viscosity of the pure DES; we end with some conclusions in Section IV.
II. Methods
A. Molecular dynamics
MD of choline chloride–urea (ChCl:U) in the ratio (1:2) was carried out for 500 molecules of choline and 500 chloride anions (ChCl), and 1000 molecules of urea (U). The DES–water mixtures were studied for distinct water contents, ζ, namely, ChCl:U:W (1:2:ζ) with ζ = 0, 1, 2, 5, 10, 15, 20, 30, and 40, which correspond to the following water molar percentages (mol%), 0.0, 25, 40, 62.5, 76.92, 83.33, 86.96, 90.61, and 93.02, and weight percentages (wt%), 0.0, 6.48, 12.18, 25.74, 40.95, 50.98, 58.10, 67.53, and 73.50. The number of choline cations, chloride anions, and urea molecules was kept constant and equal to those used for ζ = 0, in the aqueous DES simulations.
The MD simulations were carried out in the isothermal–isobaric (NpT) ensemble at 298 K and 0.1 MPa in a cubic box with periodic boundary conditions, with the program GROMACS.35 The systems were first equilibrated in the NpT ensemble for 5 ns after a 100 ps simulation in the canonical (NVT) ensemble. The trajectories were then propagated in the NpT ensemble for 50 ns and 10 ns, for ζ = 0–15 and ζ = 20–40, respectively. For the force fields (GAFF0.8-PPC and CHARMM36-SH; see Section B) for which a faster dynamics, as probed by the self-diffusion coefficients of the components, was found, shorter MD were carried out, except for the pure DES (ζ = 0). The trajectories for the MD of the GAFF0.8-PPC reline, for some ζ, were further extended to calculate the shear viscosity (see Section C).
The T and p were controlled with the thermostat of Bussi et al.36 and the Parrinello–Rahman barostat,37 and the equations of motion were solved with the Verlet leap-frog algorithm with a 1 fs time-step. Electrostatic interactions were computed via the particle-mesh Ewald (PME) method.38 A cut-off of 1 nm was used for non-bonded van der Waals and the PME real space electrostatic interactions. Heavy atom-hydrogen covalent bonds were constrained with the LINCS algorithm.39
B. Force fields
Various force fields have been proposed and investigated in the study of the equilibrium and transport properties of reline. Herein we explored five rigid (i.e., non-polarizable) force fields for choline chloride and urea.Doherty and Acevedo34 proposed OPLS-aa40 parameters for choline chloride and various hydrogen bond donors, including urea. For reline the authors adjusted the Lennard-Jones (12-6) parameters and the partial charges to match the radial distribution functions (rdfs) reported by Hammond et al.9 from ND/EPSR. Since our main goal is to understand the molecular source of the nonmonotonic behavior of the choline–choline and DES–water coordination, we investigated this force field, hereinafter referred to as OPLS-DA. The main limitation of this force field concerns the dynamics of reline, with the components lying in a sub-diffusive regime in the temperature window 298–328 K.34 The TIP4P/2005 water model41 was used in the simulations with water, as it provides a very good description of liquid water and aqueous solutions42 of OPLS-aa organic molecules.
MD simulations with the OPLS-DA force field, nonetheless, showed a seemingly abnormal aggregation tendency for urea, as discussed in Section III. To understand the possible dependence of the urea force field, the OPLS-DA force field of choline chloride was simulated with the original OPLS-aa force field of urea. The Lennard-Jones parameters and the partial charges of this force field hereinafter referred to as OPLS-DA/Urea, are compared with those of the DA force field in the ESI† (Table S1).
The force field proposed by Perkins, Painter, and Colina33 based on GAFF,43 with the partial charges of choline scaled by a factor of 0.8 was also used, combined with the TIP4P-Ew model of water.44 The authors33 probed different force field modifications and found this force field, hereinafter referred to as GAFF0.8-PPC, to provide a reasonable description of the self-diffusion coefficients of reline's components.
The last force fields investigated were the original and a scaled parameterization of CHARMM3645 with the SPC/E water model.46 Kumari et al.16 showed that the CHARMM36 force field reproduces well the experimental total structure factor of reline (see Fig. S1 of ref. 16, ESI†). Although CHARMM36 is usually simulated with TIP3P water, the SPC/E model was used here instead since the former provides a poor description of liquid water.47 Furthermore, the SPC/E model was used in the work of Kumari et al.16 The mean square displacement (MSD) (see Section C) of choline, chloride, and urea showed that this force field also predicts a dynamic too slow, similar to the OPLS-DA force field. A similar conclusion was found by Sapir and Harris32 who reported improved results by scaling the charge of every CHARMM36 atom by a factor of 0.85. Therefore, we also investigated this force field, hereinafter referred to as CHARMM36-SH.
The density of reline obtained in this work with the abovementioned force fields is given in Table 1. In spite of some dispersion of the experimental values, especially the value reported by D’Agostino et al.,17 a reasonable agreement is found relative to the value reported by Leron and Li13 (1.198 g cm−3), also found in other experimental studies.25,26,48 The GAFF0.8-PPC and CHARMM36-SH force fields exhibit a good concordance with this value, slightly overpredicting and underpredicting, respectively, the density, by 0.75% and 1.2%. Larger deviations are found for the remaining force fields.
:U:W (1:2:0) at 298 K and 0.1 MPa
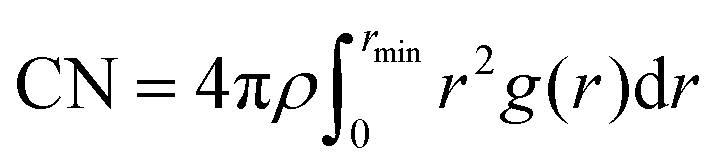
To analyze the coordination of the DES components we calculated the partial radial distribution functions (rdfs) for the distinct components. The rdfs were calculated through eqn (1),
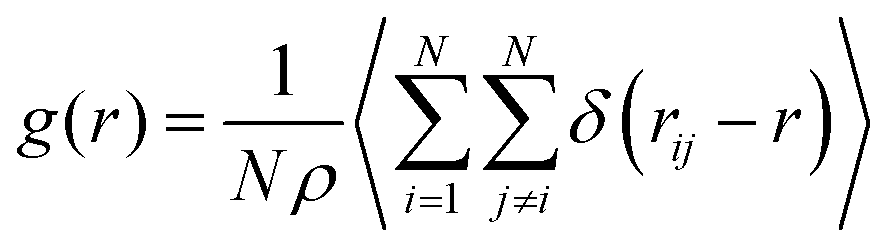 | (1) |
 | (2) |
The center of mass (COM) of each component was used to calculate the rdfs. However, because the COM was not used in the study of Hammond et al.15 on reline–water mixtures we also assessed the rdfs for the specific atoms used in that ND/EPRS study. Those are the C atoms represented in Fig. 1 as spheres. For urea, however, the results are similar to those found with the COM (as expected) and are omitted. In addition, the reference C atom (Fig. 1) of choline, results in significant differences, relative to the COM, only for the choline–choline pair distribution functions.
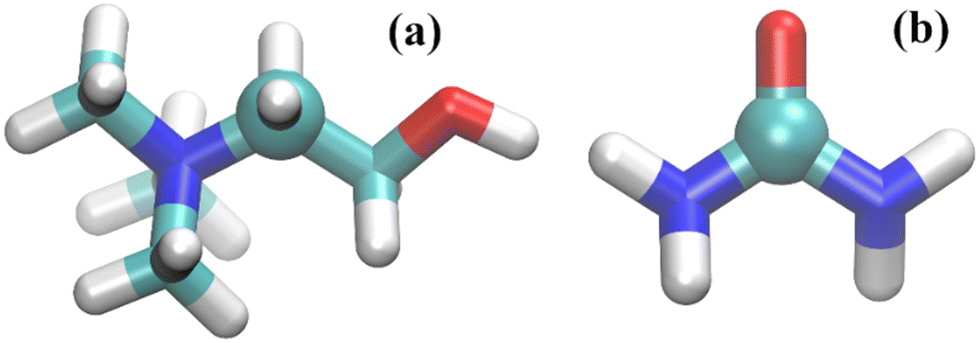 | ||
| Fig. 1 Molecular representation of (a) choline and (b) urea; carbon atoms – cyan; oxygen atoms – red; nitrogen atoms – blue; and hydrogen atoms – white. The C atoms used to calculate the rdfs labelled C atom throughout this study and in ref. 15 are depicted as spheres. | ||
C. Transport coefficients
The mean square displacement of the DES components and water were computed and the diffusion coefficients estimated through the Einstein relation,49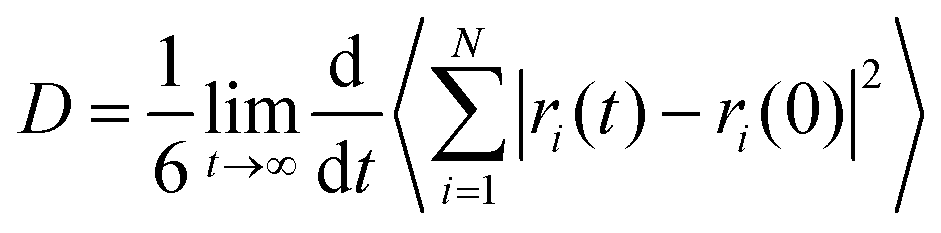 | (3) |
The shear viscosity, η, was calculated through integration of the stress (aka pressure) tensor time correlation function (tcf),50
 | (4) |
 | (5) |
 | (6) |
The viscosity was calculated for ζ = 0 for the OPLS-DA, GAFF0.8-PPC, and CHARMM36-SH force fields. That of the OPLS-DA/Urea and CHARMM36 force fields was not calculated as this is expected to be significantly higher than the experimental viscosity, similar to the OPLS-DA (see Section III). Longer trajectories were carried out to calculate the viscosity, in particular, 1.1 μs for OPLS-DA, 1 μs for GAFF0.8-PPC, and 400 ns for CHARMM36-SH. The viscosity and respective errors were estimated by calculating the average and the standard deviation in the time frame where the cumulative sum of the integral in eqn (2) plateaus out. The viscosity of the GAFF0.8-PPC reline–water mixtures was also computed, as this force field showed the best agreement with the experimental data for non-aqueous reline. The length of the trajectories was inversely proportional to ζ, with the longest (300 ns) for ζ = 1 and the shortest (50 ns) for ζ = 40. The length of the trajectories was defined by the invariance of the viscosity coefficient upon additional propagation of the trajectories. The accurate calculation of the Green-Kubo viscosity55,56 depends on the proper convergence of the stress tensor tcfs including putative long-time tails (not observed here) and that fluctuations are small enough not to significantly influence the integral of eqn (2) and (4).
III. Results and discussion
Fig. 2 compares the partial radial distribution functions (rdfs) of reline (ζ = 0) for the different force fields, with the experimental ND/EPSR results of Hammond et al.9 A good qualitative agreement is observed with every force field. Interestingly, some improvement is found with the OPLS-DA/Urea relative to the OPLS-DA force field. Nevertheless, the OPLS-DA/Urea force field does not improve the dynamics of the DES, as discussed below. The CHARMM36-SH (Fig. 2g–h) shows some improvement concerning the urea–chloride rdf, relative to CHARMM36, while predicting a similar structure for the remaining pair components. | ||
| Fig. 2 Reline (ChCl:U) (1:2) experimental (dashed lines) and MD (solid lines) partial rdfs for the distinct force fields; (a and b) OPLS-DA, (c and d) OPLS-DA/Urea, (e and f) GAFF0.8-PPC, (g and h) CHARMM36 and CHARM36-SH (dot dashed lines). The COM of choline and urea were used to compute the experimental9 ND/EPSR and the MD rdfs. | ||
In spite of the observed differences between the experimental and simulation rdfs these results provide some confidence that the structure of reline, upon the addition of water, might be, at least qualitatively, reproduced, providing molecular insight into the components’ reorganization.
The diffusion and shear viscosity coefficients calculated in this work for non-aqueous reline are given in Table 2. The dynamics of the OPLS-DA, OPLS-DA/Urea, and CHARMM36 is too slow as assessed from the diffusion coefficients. The diffusion coefficients were estimated from the 10–25 ns time-frame where the MSD exhibits a linear regime (Fig. S1, ESI†). Notice the diffusion coefficients of the OPLS-DA, OPLS-DA/Urea, and CHARMM36 models are over an order of magnitude lower than the experimental values. For this reason, the viscosity was calculated only for OPLS-DA, among these force fields. The latter required a long trajectory to compute the stress tensor tcf with a reasonable precision (see Fig. S2, ESI†). The viscosity (∼20000 mPa s) is significantly higher than that reported by Doherty and Acevedo34 obtained with a different method. The differences, in our view, are associated with the parameters used to compute the viscosity in that study, as discussed by Bittner et al.57 The viscosity of the OPLS-DA reline is a relatively rough estimative because the stress tcf converges at long delay times (∼50 ns) and large fluctuations are observed. Although fluctuations can be quenched by running longer trajectories the key point here is that the OPLS-DA, along with the OPLS-DA/Urea and CHARMM36 force fields, predict an exceedingly slow dynamics, reflected in the diffusion coefficients and (dynamic) viscosity.
:U:W (1:2:0) at 298 K and 0.1 MPa
| Exp/model | D Chol (10−8 cm2 s−1) | D Cl (10−8 cm2 s−1) | D Urea (10−8 cm2 s−1) | η (mPa s) |
|---|---|---|---|---|
| Exp | 3.5;17 3.330 | — | 6.6;17 4.230 | 750;17 859;26 1398;48 1571;25 175028 |
| OPLS-DA | 0.11 | 0.18 | 0.25 | ∼20000 ± 135 |
| OPLS-DA/Urea | 0.08 | 0.11 | 0.17 | — |
| GAFF0.8-PPC | 1.5 | 2.0 | 2.9 | ∼950 ± 20 |
| CHARMM36 | 0.06 | 0.08 | 0.12 | — |
| CHARMM36-SH | 5.6 | 8.1 | 13.4 | ∼210 ± 15 |
The GAFF0.8-PPC and CHARMM36-SH predict higher diffusion coefficients and lower viscosities, in reasonable agreement with the experimental data. The GAFF0.8-PPC underpredicts, whereas the CHARMM36-SH overpredicts the diffusion coefficients. The viscosity of the CHARMM36-SH model (∼210 mPa s) is too low, whereas that of the GAFF0.8-PPC force field (∼950 mPa s) is comparable to the value reported by Shekaari et al.26 (∼859 mPa s) and lower than most other experimental values (see Table 2). The dispersion of the experimental data precludes, however, additional improvement of GAFF0.8-PPC force field and, therefore, this was not pursued in this work.
Fig. 3a compares the density at the distinct water contents with the experimental values reported by Leron and Li.13 The density was fitted to the equation,21
| ρ = ρ0 exp[−a/(ζ + b)] | (7) |
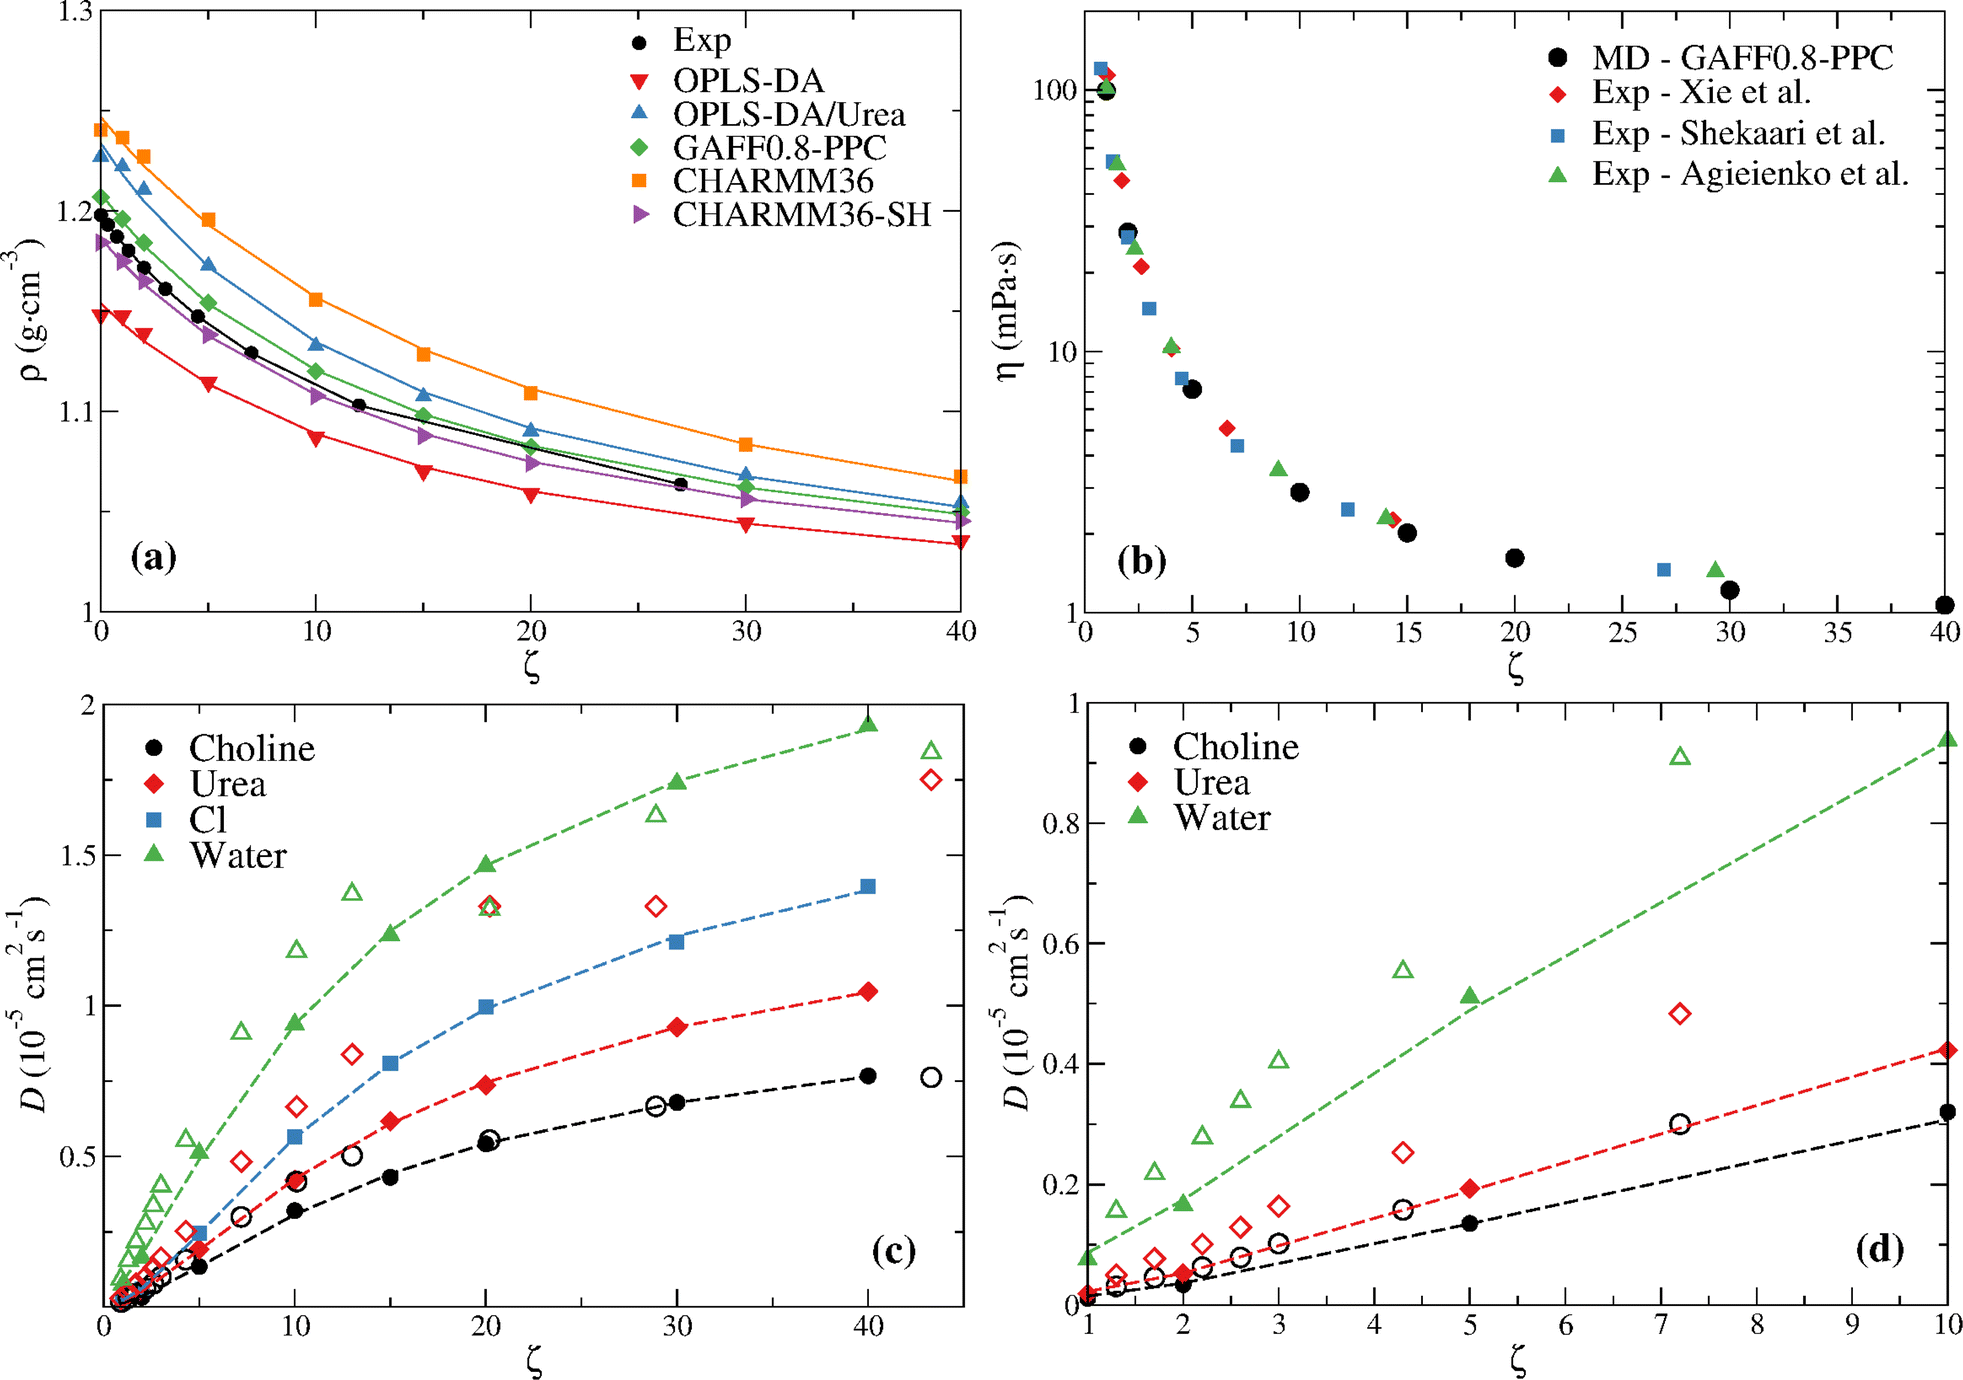 | ||
| Fig. 3 (a) MD density of reline for the different water content mixtures compared with experimental data. The experimental values of Leron and Li13 are shown; the experimental values of Xie et al.,25 Shekaari et al.,26 and Agieienko and Buchner48 are similar and are omitted for clarity; Lines are fits to eqn (7). (b) MD viscosity of GAFF0.8-PPC reline for the different water content mixtures compared with experimental data. (c) MD diffusion coefficients of GAFF0.8-PPC reline (filled symbols) for the different water contents compared with experimental data30 (open symbols); Lines are fits to eqn (7). (d) Low water content (ζ ≤ 10) data depicted in (c), except for chloride, for which there is no experimental data. | ||
A nearly quantitative agreement can be seen for GAFF0.8-PPC and CHARMM36-SH models. This, in addition to the improved description of the transport coefficients, especially the GAFF0.8-PPC force field, indicates that these are the most accurate force fields.
Every force field predicts a lower rate of change of ρ (i.e., (∂ρ/∂ζ)) upon the ζ = 0 → 1 transition, opposite to the experimental data. This is especially marked for the OPLS-DA, OPLS-DA/Urea, and CHARMM36 models, seemingly indicating an enhanced ability to accommodate water in the DES without disrupting its structure.
Fig. 3b compares the GAFF0.8-PPC viscosity at the distinct water contents with experimental data and Fig. 3c and d compare the diffusion coefficients with the experimental data of Di Pietro et al.;30 the MD η and D data are also given in Table S2 (ESI†). The MD viscosity is in good agreement with the experimental data, especially from Shekaari et al.,26 although a slightly lower viscosity is found at the highest ζ. Larger differences between the GAFF0.8-PPC MD diffusion coefficients (filled symbols) and the experimental NMR data (open symbols) are observed (Fig. 3c and d); this is especially marked for urea. Furthermore, the experimental data shows a seeming transition at ζ ≥ 20 (58 wt%), and a non-monotonic variation of the water and urea self-diffusion coefficients, not observed in the simulations. Notice the experimental diffusion coefficients of water at ζ = 20 (58 wt%) and urea at ζ = 30 (68 wt%) slowdown below the values at ζ = 13 and ζ = 20, respectively (Fig. 3c). This non-monotonic behavior of diffusion does not seem to be related, however, with the structural transition reported by Hammond et al.15 since this occurs between ζ = 10 and ζ = 15. We now turn attention to the structural analysis of aqueous reline.
Fig. 4 displays the DES and the DES–water coordination numbers found with the OPLS-DA and the OPLS-DA/Urea force fields. The ND/EPSR coordination numbers are shown in the bottom plots. The latter were not calculated for the COM of choline and urea but for the C atoms depicted in Fig. 1 instead. Hence, in addition to the COM we calculated the rdfs using these same C atoms. Significant differences were found only for the choline–choline rdfs and these results are given in Fig. 4a and d (black circles).
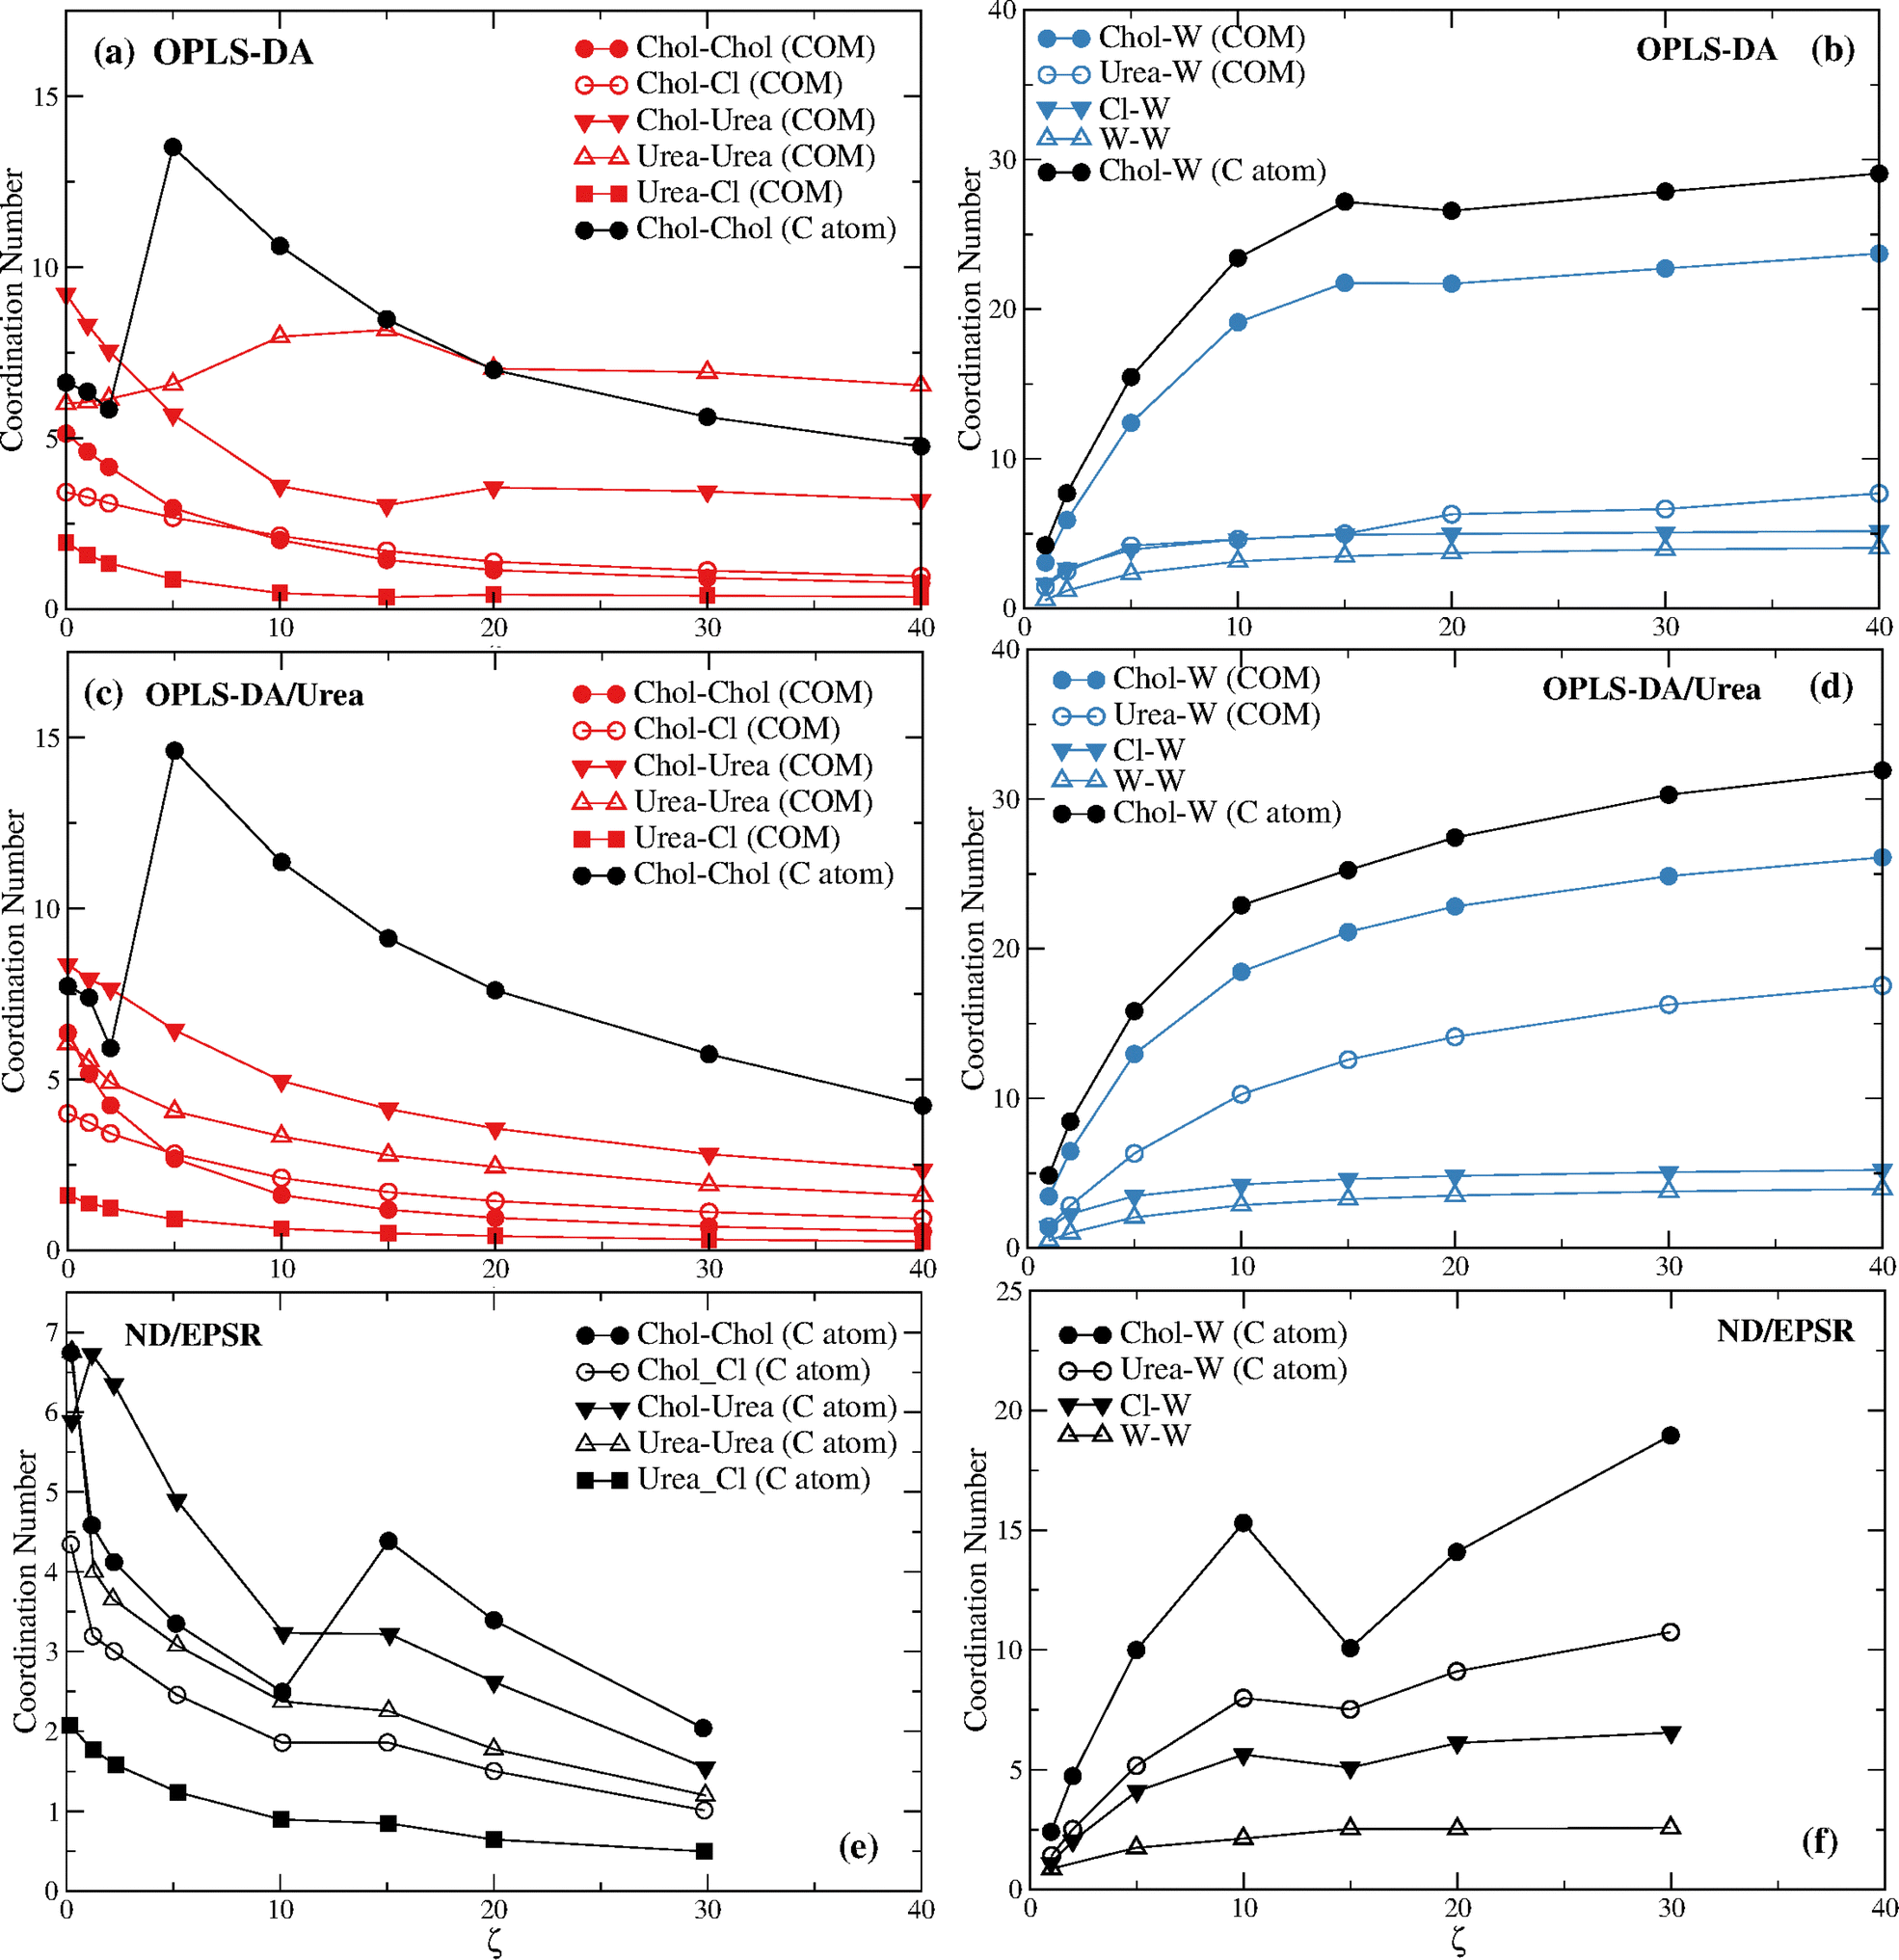 | ||
| Fig. 4 The coordination numbers of (a) reline components for the OPLS-DA force field; (b) reline components and water for the OPLS-DA force field; (c) reline components for the OPLS-DA/Urea force field; (d) reline components and water for the OPLS-DA/Urea force field; (e) reline components from experimental ND/EPSR; and (f) reline components and water from experimental ND/EPSR. | ||
The most prominent feature of Fig. 4 is the non-monotonic behavior of the choline–choline (C atom) coordination, seemingly consistent with the experimental data. However, the coordination increase occurs between ζ = 2 and ζ = 5, whereas the ND/EPSR results show such a transition between ζ = 10 and ζ = 15. In addition, a larger (by a factor of ∼4) coordination change is observed for the MD results. More importantly, this crossover is strictly associated with the collapse of the first hydration sphere (see Fig. 5c and d) and not with a similar crossover of the choline hydration number (see Fig. 4b and d), opposite to ND/EPSR (see Fig. 4f). A similar transition is not observed when the COM of choline is used to assess the choline–choline rdf.
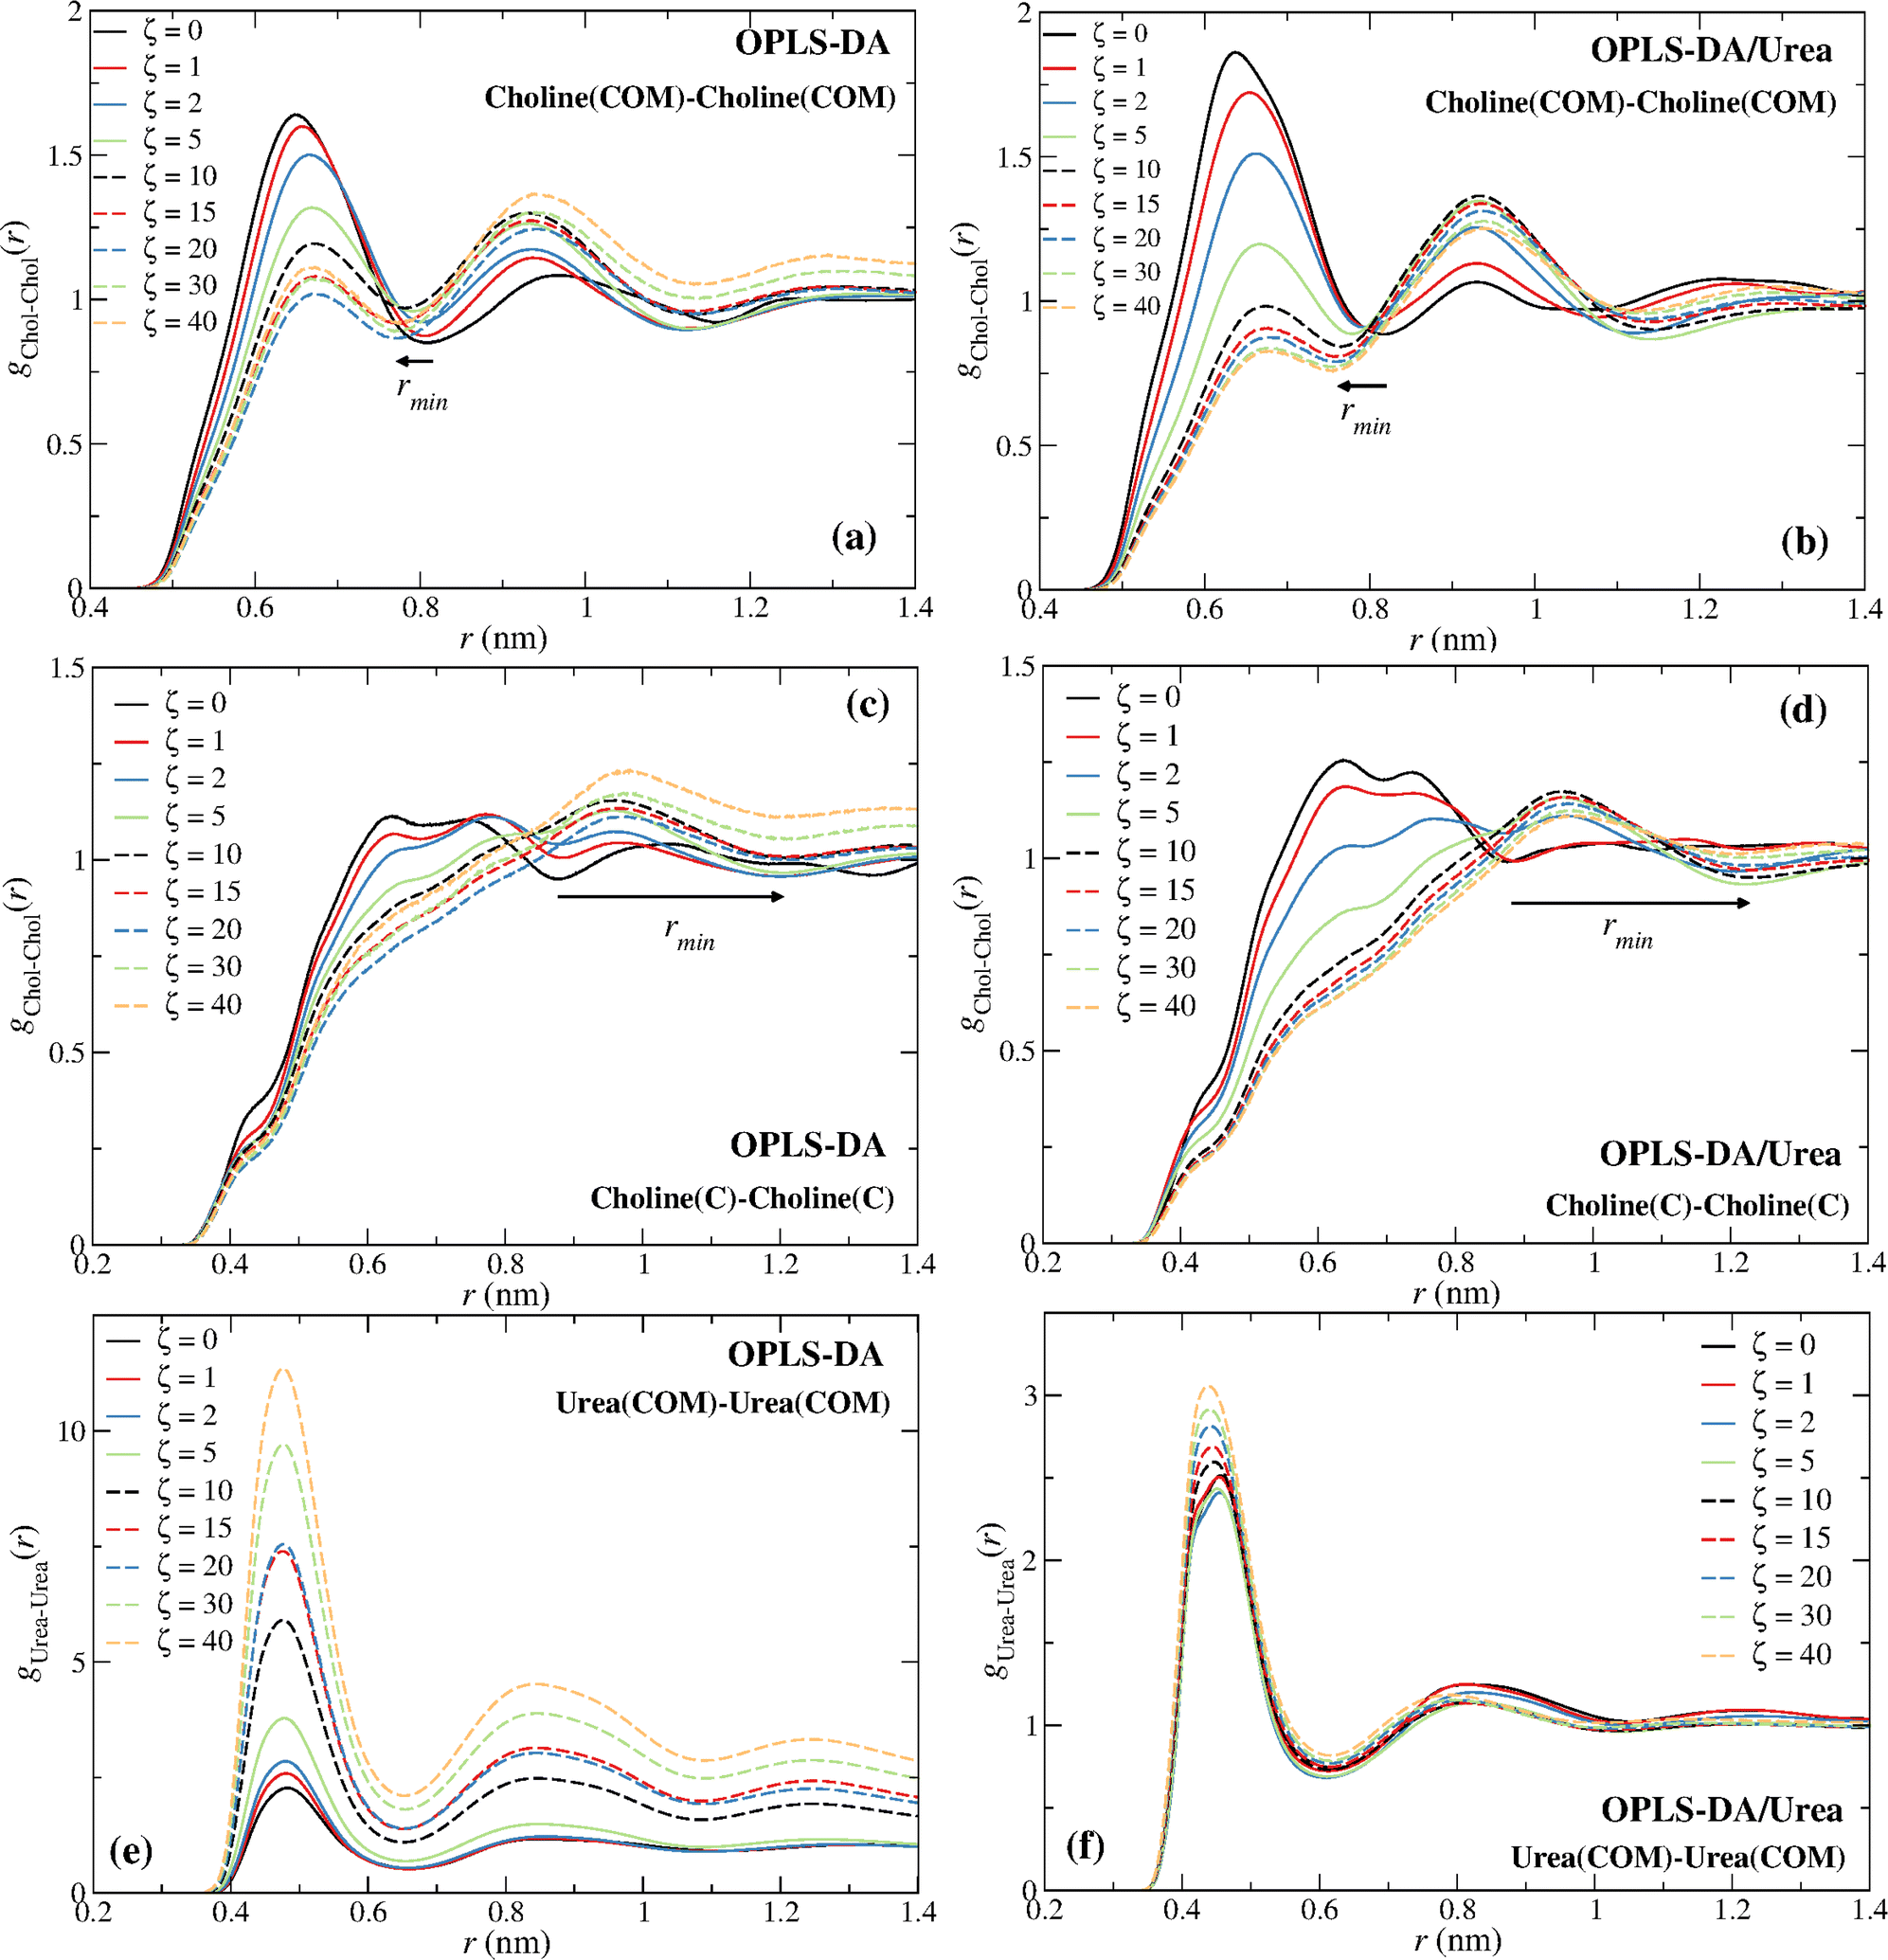 | ||
| Fig. 5 Radial distribution functions, g(r). (a) OPLS-DA choline–choline (COM), (b) OPLS-DA/Urea choline–choline (COM), (c) OPLS-DA choline–choline (C atom), (d) OPLS-DA/Urea choline–choline (C atom), (e) OPLS-DA urea–urea (COM), and (f) OPLS-DA/Urea urea–urea (COM). Notice the larger y-scale in (e) associated with the aggregation of urea. The arrows mark the shift of the first minimum with the water content, ζ, increase. | ||
The respective DES and DES–water rdfs for the distinct force fields are given in Fig S4 and S13 of the ESI.† The shoulder in the choline–water (COM) rdfs for the OPLS-DA and OPLS-DA/Urea displayed in Fig. S9 (ESI†) was neglected in the calculation of the coordination numbers in Fig. 4 and the deeper minimum used instead; this does not change the qualitative behavior of the choline–water coordination number. For the choline–water (C atom) coordination numbers the second minimum was used instead (see Fig. S13, ESI†), since the first minimum corresponds to a few water molecules (<3 at the largest ζ), those closer to the reference C atom (see Fig. 1).
The increase of the choline–urea coordination number at low water contents (ζ ≤ 2) found through ND/EPSR is also not reproduced neither for the COM nor the C atom rdfs, although a minor increase is found with the OPLS-DA/Urea force field when the C atom is used (see Fig. S14, ESI†).
The distinct choline–choline rdfs are given in Fig. 5. The comparison of the Chol–Chol (COM) and the Chol–Chol (C atom) rdfs shows that the C atom is not a good probe of the Chol COM. A continuous decrease of the height of the first peak, with the exception of the OPLS-DA for ζ ≥ 20 (Fig. 5a; see discussion below), and a shift of the Chol–Chol (COM) rdf first minimum to a lower distance can be observed (Fig. 5a and b), whereas the Chol–Chol (C atom) rdf exhibits a large shift to a longer distance for ζ ≥ 5 (Fig. 5c and d), with the drain of the first coordination sphere. The first minimum of the Chol–Chol (C atom) rdf at ζ ≥ 5 is actually the second minimum at lower water contents. This results in a large shift of the first minimum, explaining the sudden increase in the coordination number from ζ = 2 to ζ = 5 seen in Fig. 4a and c. A stabilization of the water-induced choline–choline structural reorganization is observed at ζ = 10 (∼41 wt%) with the first minimum converging to a nearly constant distance for larger water contents (ζ ≥ 10) (see Fig. 5a–d). This is consistent with previous experimental15 and simulation16,32 studies and in keeping with the view that reline undergoes a major (continuous) structural transition at ∼41 wt%.
A second feature displayed in Fig. 4 concerns the apparent aggregation of urea in the OPLS-DA model; notice the increase in the urea–urea coordination number in Fig. 4a. This can also be inferred from Fig. 5e, with the urea–urea rdfs converging to 1 at large distances for large water contents, suggesting the existence of major inhomogeneities in the system; thus, in these systems a urea molecule “sees” more urea molecules at a close distance than it would see in a homogenous system. This inhomogeneities also explain the non-monotonic decrease of the height of the first peak in Fig. 5a. A similar behavior is not observed with the OPLS-DA/Urea model (Fig. 5f). Fig. 6a shows that such an abnormal aggregation occurs indeed for the OPLS-DA model, but not for the other force fields, displaying only some moderate aggregation.
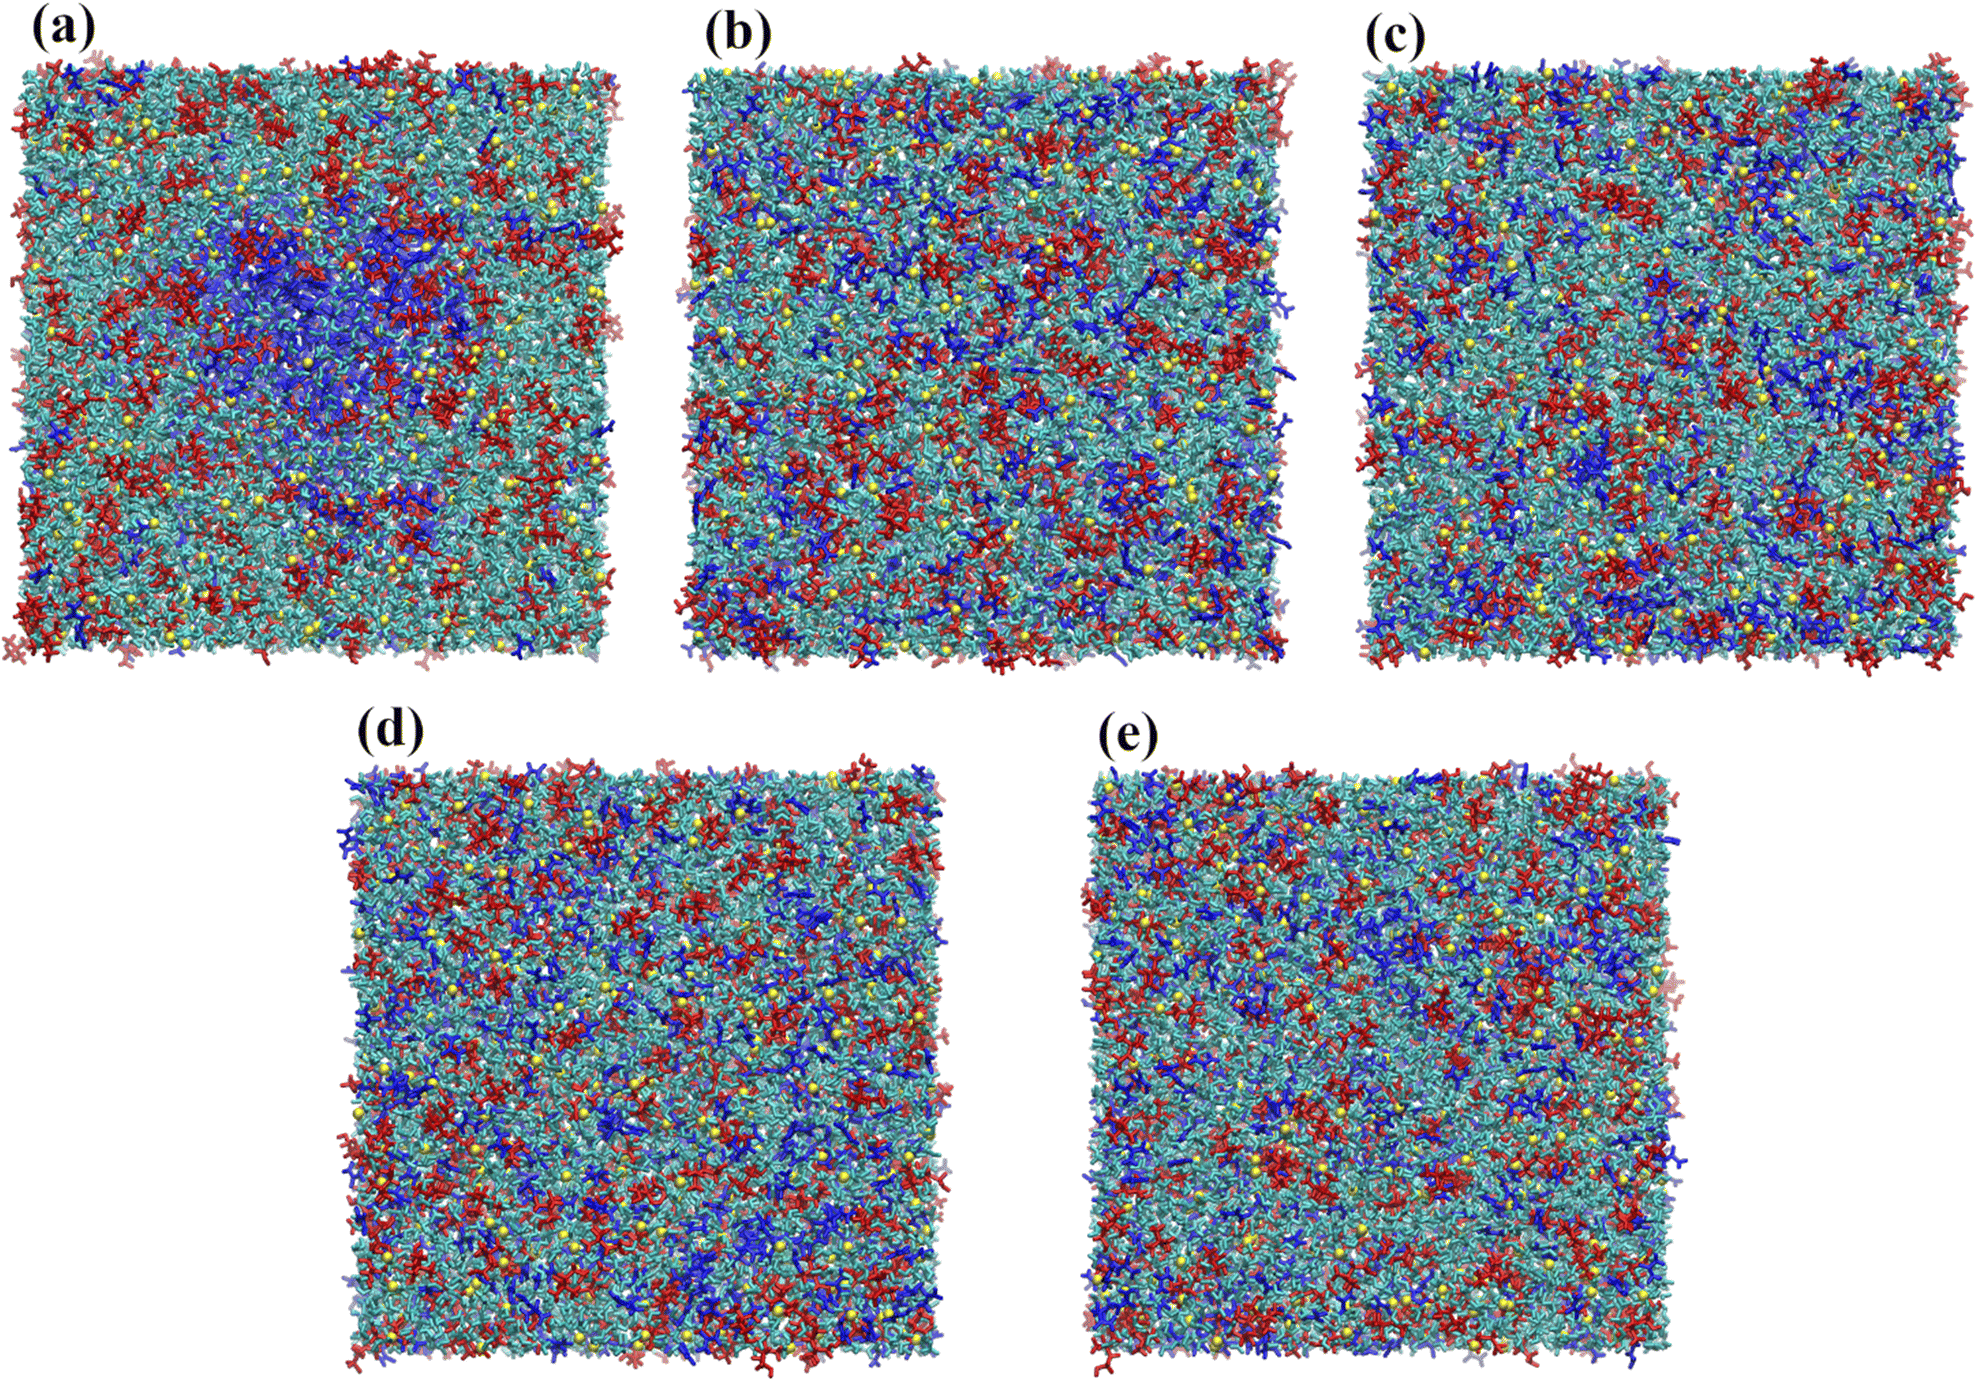 | ||
| Fig. 6 MD snapshot of reline at ζ = 20 (10000 water molecules) for the different force fields: (a) OPLS-DA; (b) OPLS-DA/Urea; (c) GAFF0.8-PPC; (d) CHARMM36; and (e) CHARMM36-SH. Color scheme: choline (red), chloride (yellow), urea (blue), water (cyan). A water-induced demixing can be observed for OPLS-DA reline, with a large urea aggregate forming in the center of the box. | ||
Before we proceed to discuss in detail the differences between the ND/EPSR and the simulation DES–water and water–water coordination we consider the behavior of the choline–choline and choline–water coordination found with the GAFF0.8-PPC, CHARMM36, and CHARMM36-SH force fields (Fig. 7). GAFF0.8-PPC (Fig. 7a) and CHARMM36-SH (Fig. 7e) display a similar qualitative choline–choline (C atom) coordination to the ND/EPSR whereas CHARMM36 (Fig. 7c) shows a crossover at a lower ζ. The latter does predict a crossover at the same ζ although for the choline–choline (COM) rdfs. However, again, the non-monotonicity of the choline–choline coordination number is not associated with a decrease of the choline–water coordination (Fig. 7b and f), opposite to ND/EPSR. Furthermore, an increase of the choline–urea coordination at ζ = 1 is not observed neither relative to the COM nor the C atom.
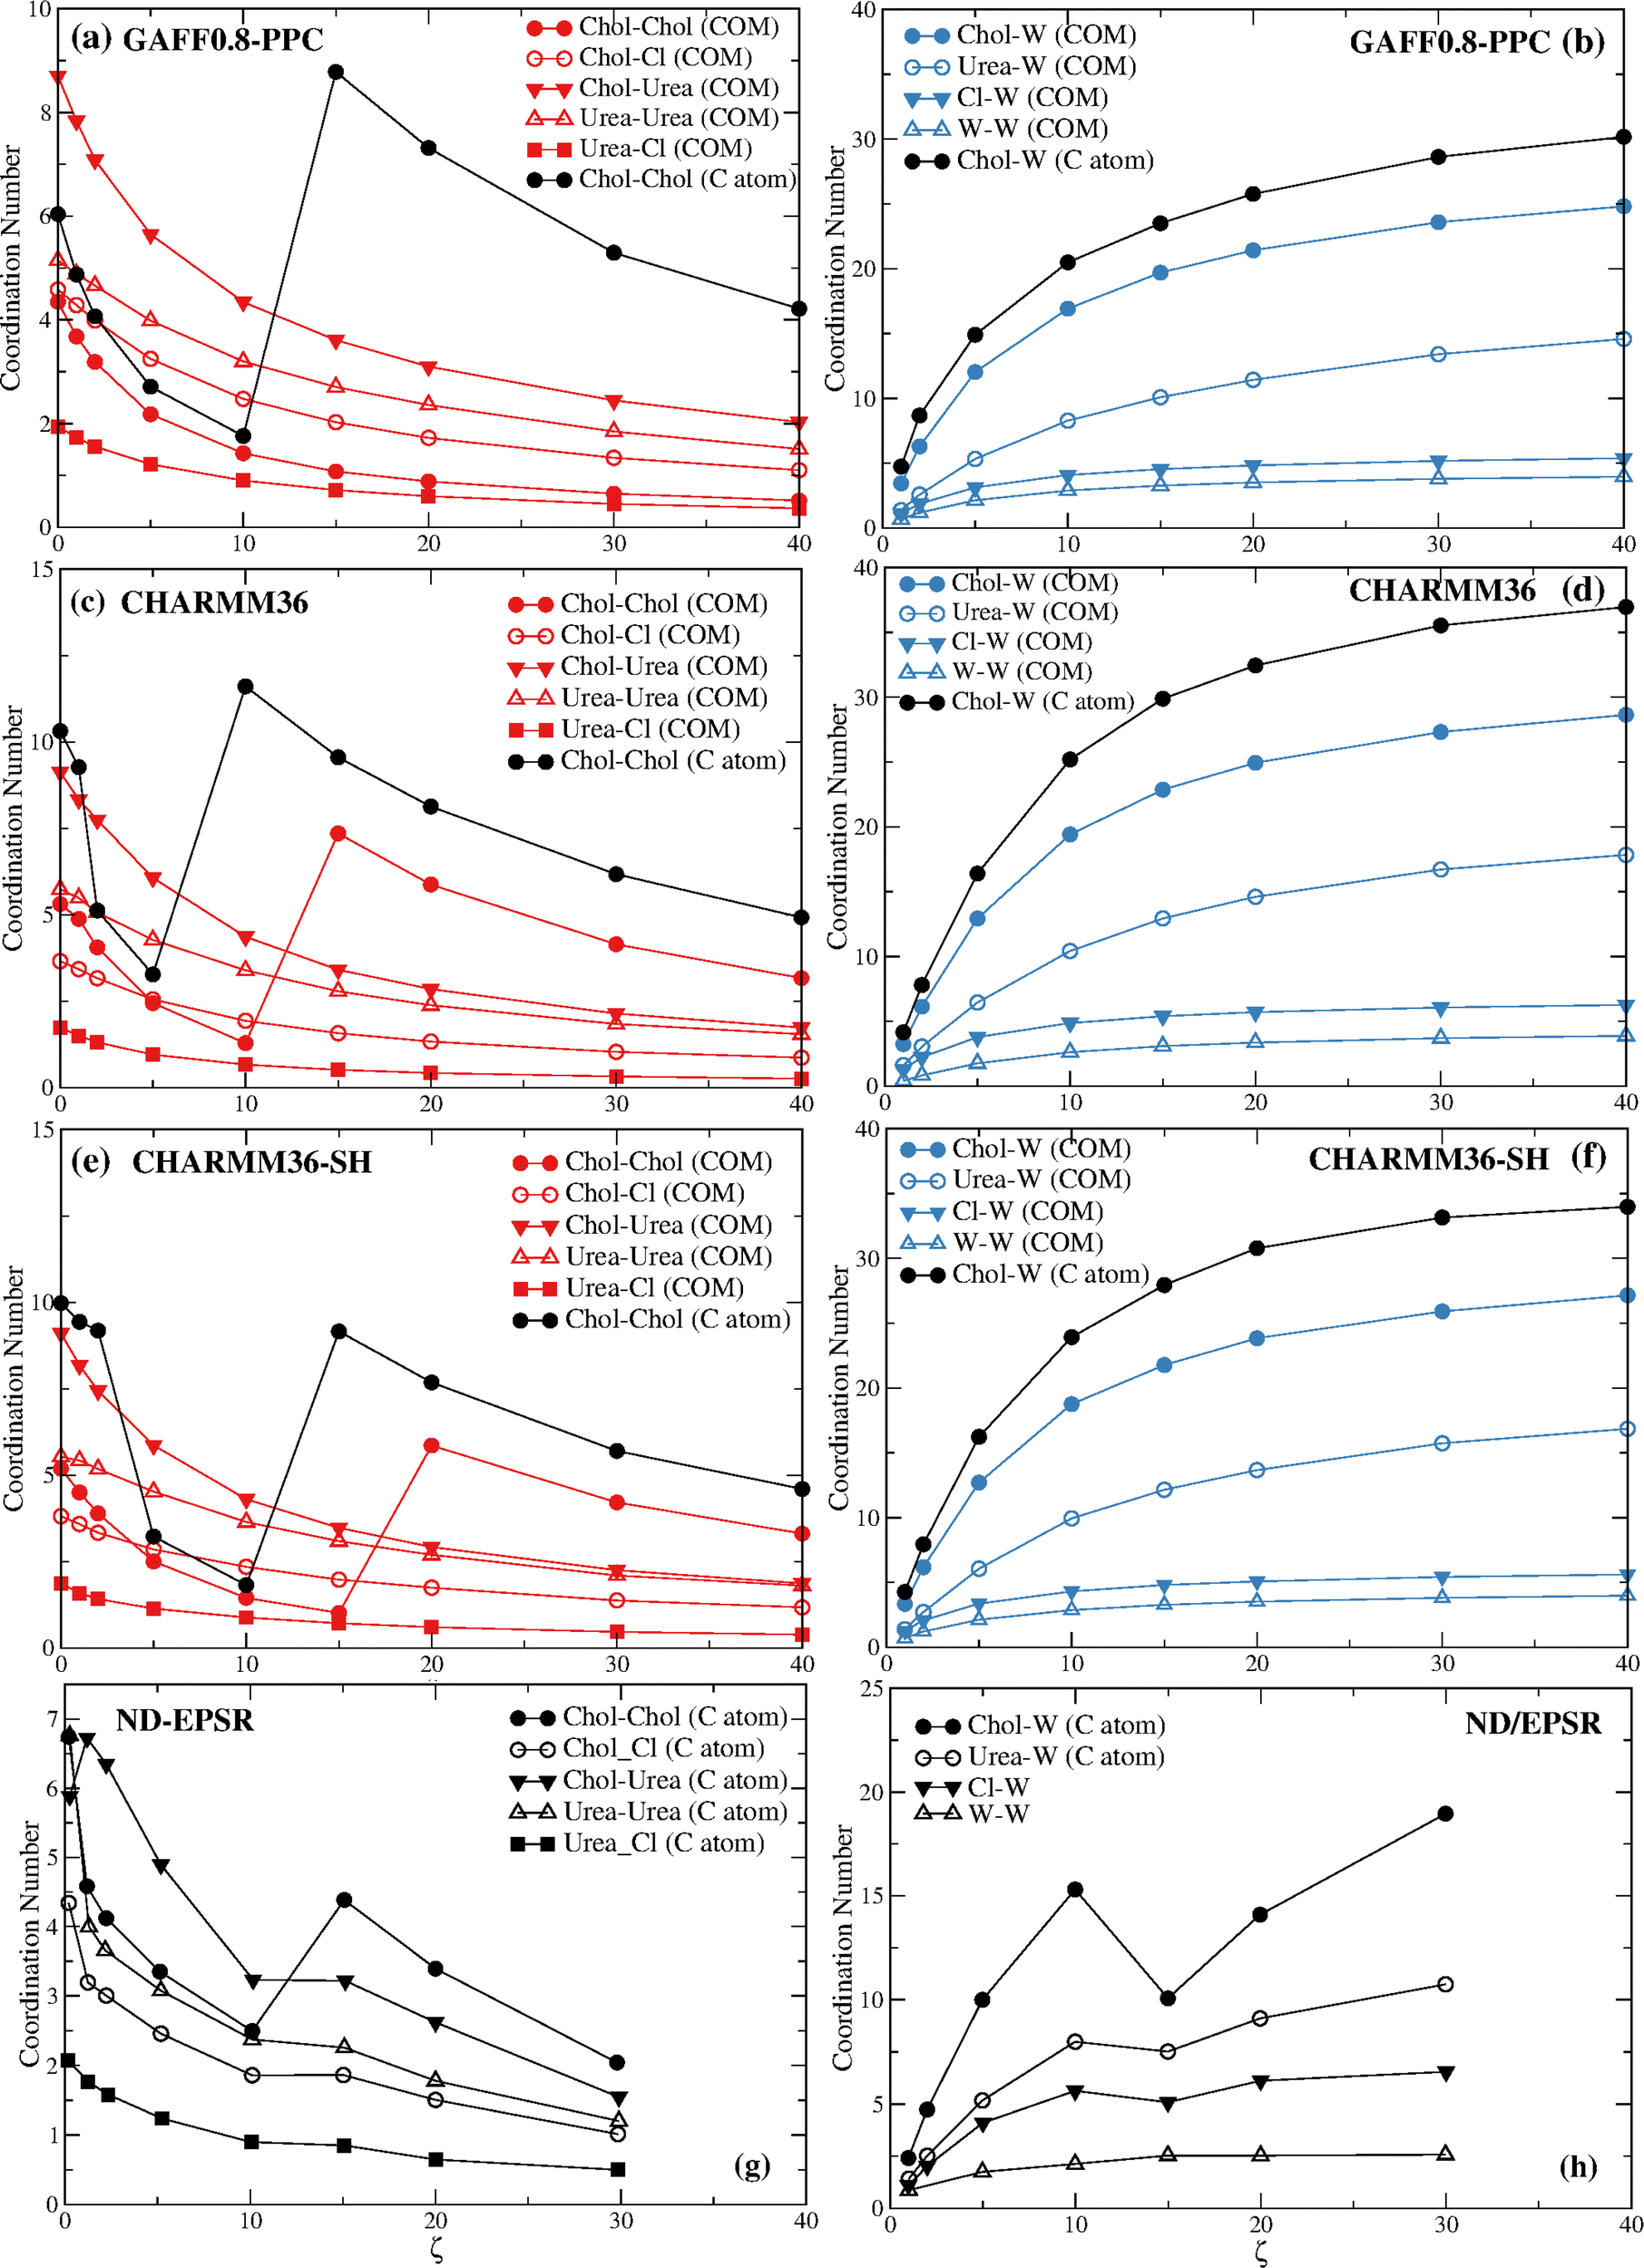 | ||
| Fig. 7 The coordination numbers of the (a) reline components for the GAFF0.8-PPC force field; (b) reline components and water for the GAFF0.8-PPC force field; (c) reline components for the CHARMM36 force field; (d) reline components and water for the CHARMM36 force field; (e) reline components for the CHARMM36-SH force field; (f) reline components and water for the CHARMM36-SH force field; (g) reline components from experimental ND/EPSR; and (h) reline components and water from experimental ND/EPSR. | ||
Fig. 8 displays the choline–choline rdfs for the GAFF0.8-PPC and the CHARMM36 models. The coordination increase is again associated with the disappearance of the first coordination sphere due to the intrusion of water molecules around the choline cation.
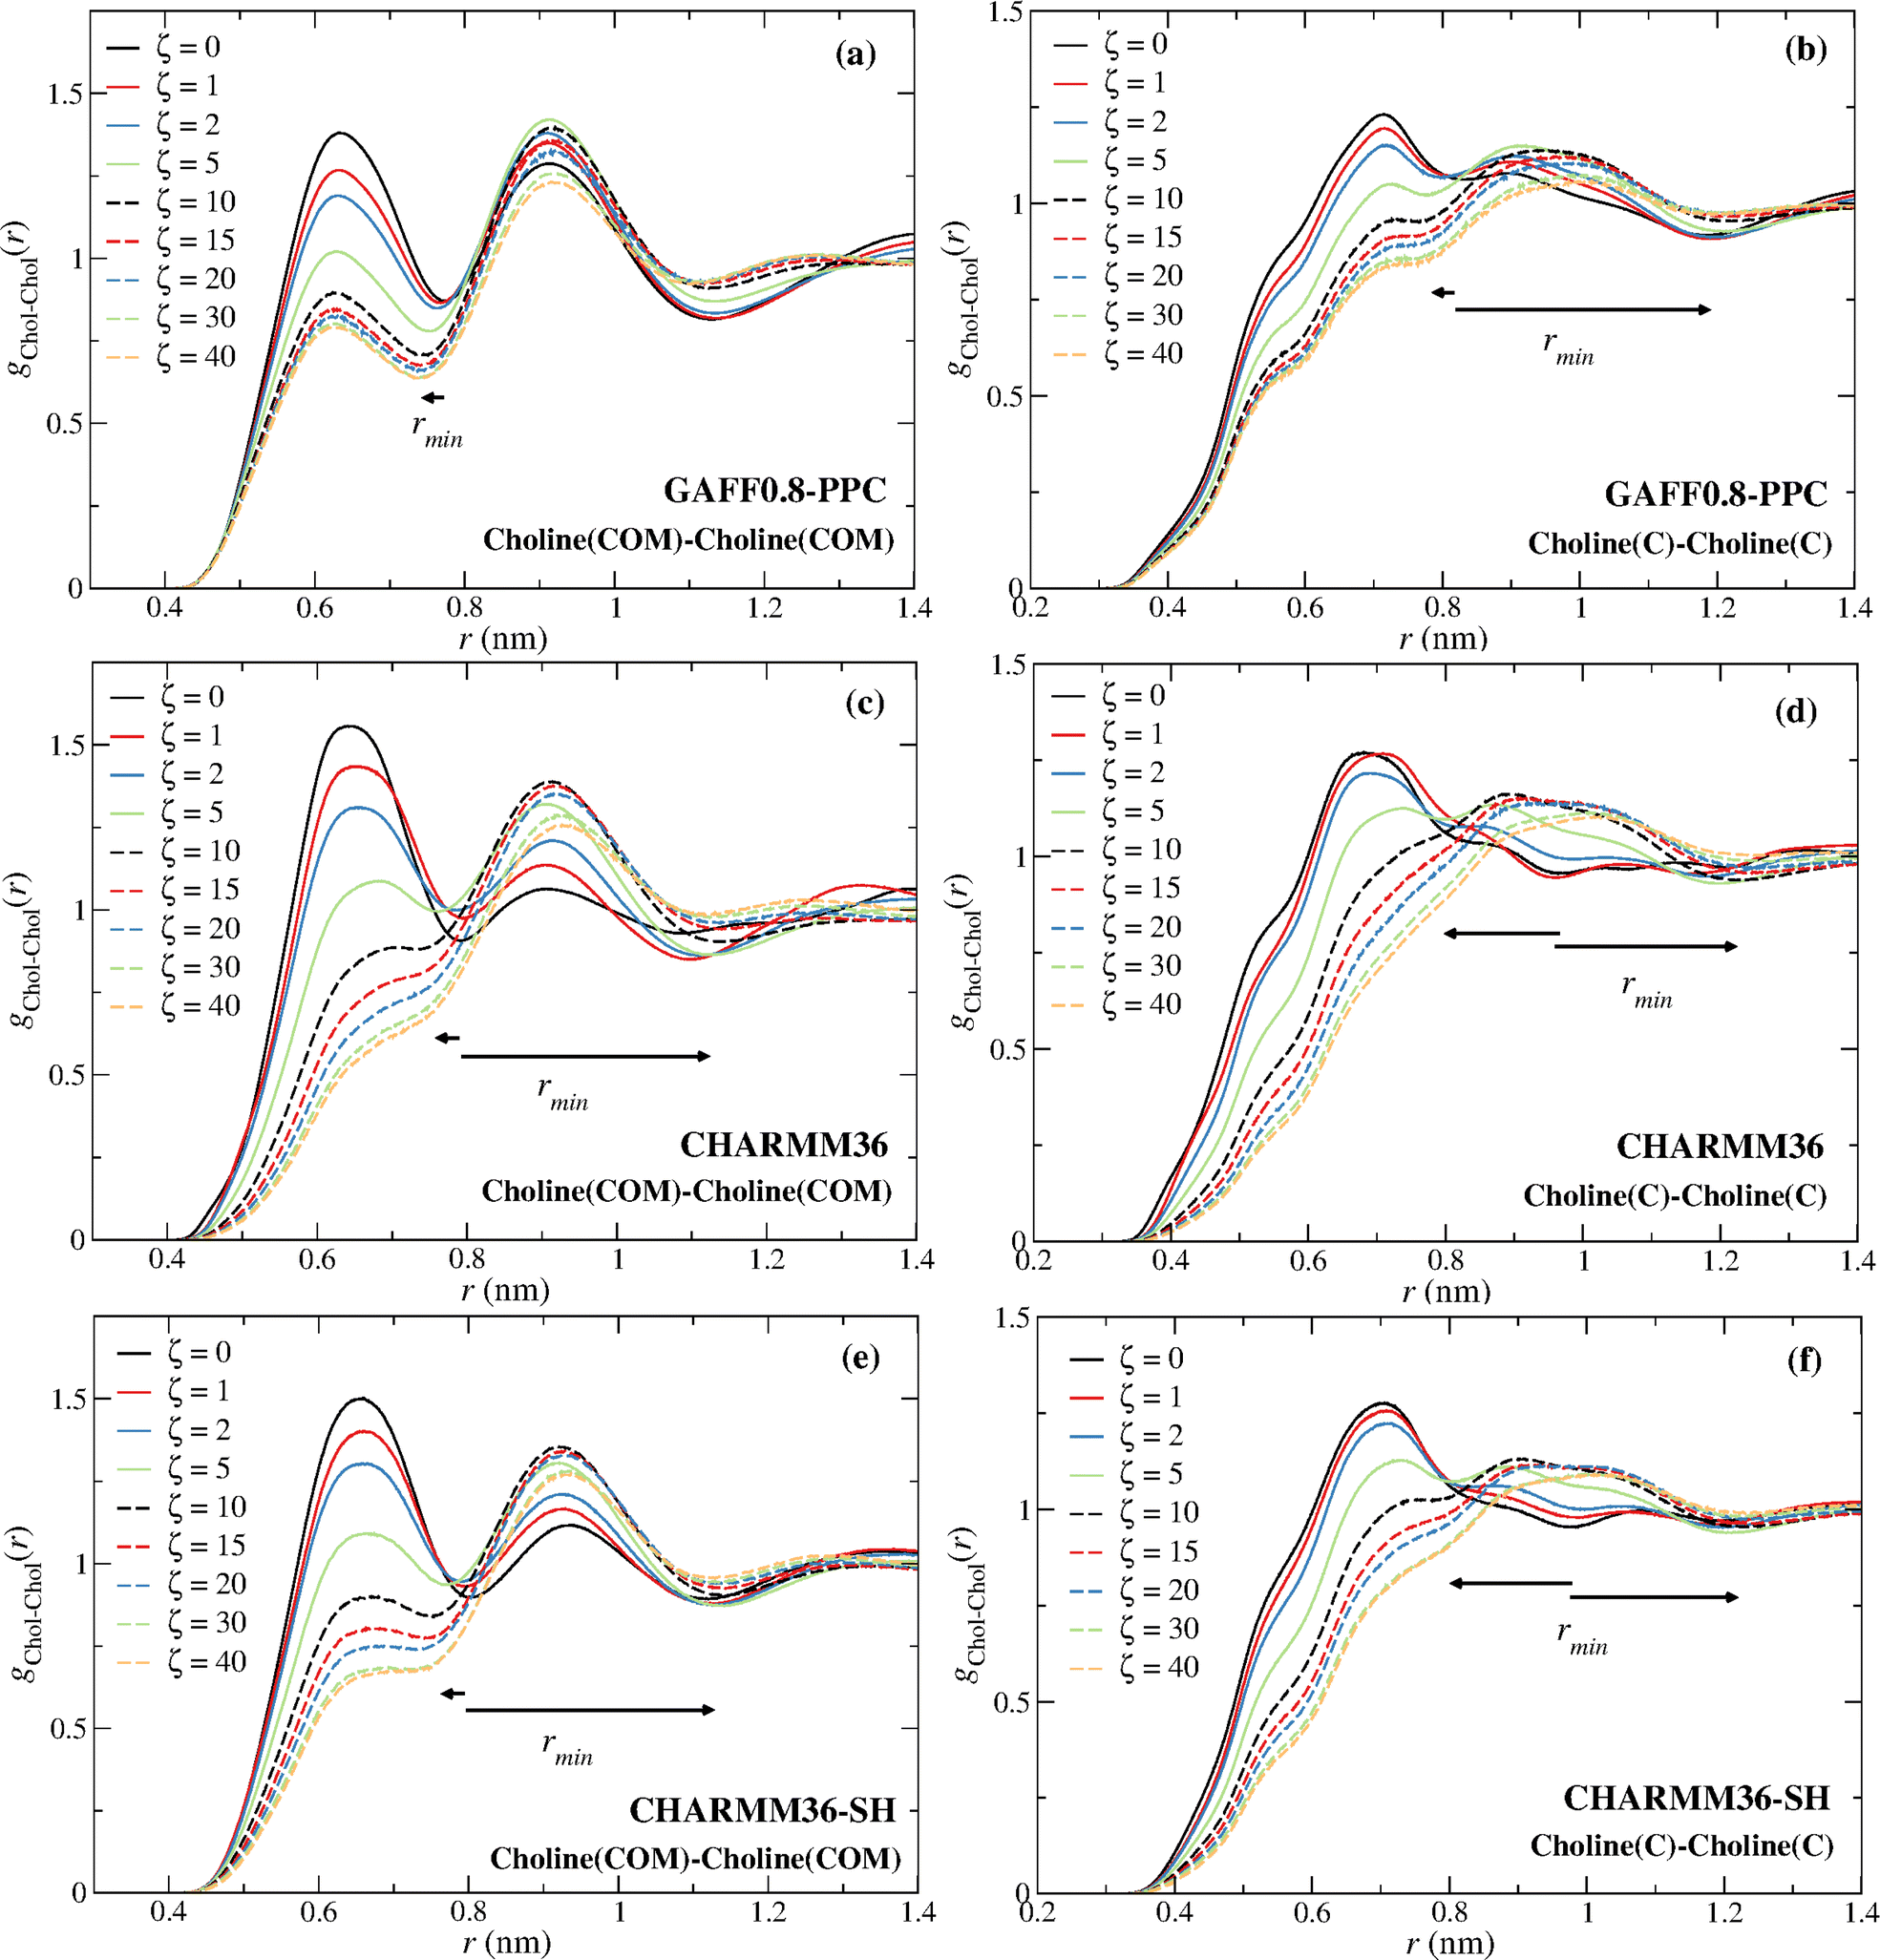 | ||
| Fig. 8 (a and b) GAFF0.8-PPC choline–choline (COM), choline–choline (C atom) rdfs; (c and d) same rdfs for the CHARMM36 force field; (e and f) same rdfs for the CHARMM36-SH force field. The smaller arrows mark the shift of the first minimum to small distances at low ζ, relative to ζ = 0; the longer arrows mark the shift to long distances, relative to ζ = 0, associated with the drain of the first coordination sphere. | ||
The non-monotonicity of the choline–choline (COM) coordination number found for CHARMM36 and CHARMM36-SH also results from the drain of the first coordination layer, becoming a shoulder of the second choline–choline coordination sphere.
Table 3 gives the coordination numbers for the GAFF0.8-PPC/TIP4P/2005 reline system at the different water ratios, plotted in Fig. 7a and b.
| ζ = 0 | ζ = 1 | ζ = 2 | ζ = 5 | ζ = 10 | ζ = 15 | ζ = 20 | ζ = 30 | ζ = 40 | |
|---|---|---|---|---|---|---|---|---|---|
| Chol–Chol | 4.3 | 3.7 | 3.2 | 2.2 | 1.4 | 1.1 | 0.9 | 0.6 | 0.5 |
| Chol–W | — | 3.4 | 6.3 | 12.0 | 16.9 | 19.7 | 21.4 | 23.6 | 24.8 |
| Chol–Cl | 4.6 | 4.3 | 4.0 | 3.2 | 2.5 | 2.0 | 1.7 | 1.3 | 1.1 |
| Chol–urea | 8.7 | 7.8 | 7.1 | 5.6 | 4.3 | 3.6 | 3.1 | 2.4 | 2.0 |
| Cl–W | — | 1.1 | 1.9 | 3.1 | 4.1 | 4.5 | 4.8 | 5.2 | 5.4 |
| Urea–urea | 5.1 | 4.9 | 4.7 | 4.0 | 3.2 | 2.7 | 2.4 | 1.8 | 1.5 |
| Urea–W | — | 1.4 | 2.6 | 5.3 | 8.3 | 10.1 | 11.4 | 13.4 | 14.6 |
| Urea–Cl | 1.9 | 1.7 | 1.6 | 1.2 | 0.9 | 0.7 | 0.6 | 0.5 | 0.4 |
| W–W | — | 0.7 | 1.2 | 2.1 | 2.9 | 3.3 | 3.5 | 3.8 | 4.0 |
As can be seen, the departure of ∼1 urea molecule around the choline cation at ζ = 1 is accompanied by the arrival of ∼3.4 water molecules. The arrival of another ∼3 water molecules at ζ = 2 induces the departure of a coline cation. Thus, at ζ = 2 choline loses in average ∼1 choline, ∼0.5 chloride anions, and ∼1.5 urea molecules from its solvation sphere, whereas a hydration sphere starts to build with ∼6.3 water molecules. At ζ = 5 choline loses a second choline, gains almost another ∼6 water molecules, and loses another 1.5 urea molecules and 0.8 chloride anions.
Fitting the reline–reline and reline–water coordination numbers of Table 3 to eqn (7) and taking the first derivative with respect to ζ it is possible to estimate, respectively, the rate of depletion of each component with ζ and the rate of hydration of each component with ζ. Fig. 9 shows that the highest rates of depletion occur for urea around choline followed by choline around choline (up to ζ = 7.0). Notice that the rate of depletion of every component is monotonic and always < 1 molecule/ζ (see also Table 3), decreasing with ζ. With regard to hydration, a significantly higher rate of hydration is found for the choline cation, relative to the other components, which is in keeping with the ability of the cation to sequestrate water molecules, as found by Hammond et al.,15 delaying the stabilization of the structural transition up to ζ ∼ 10.
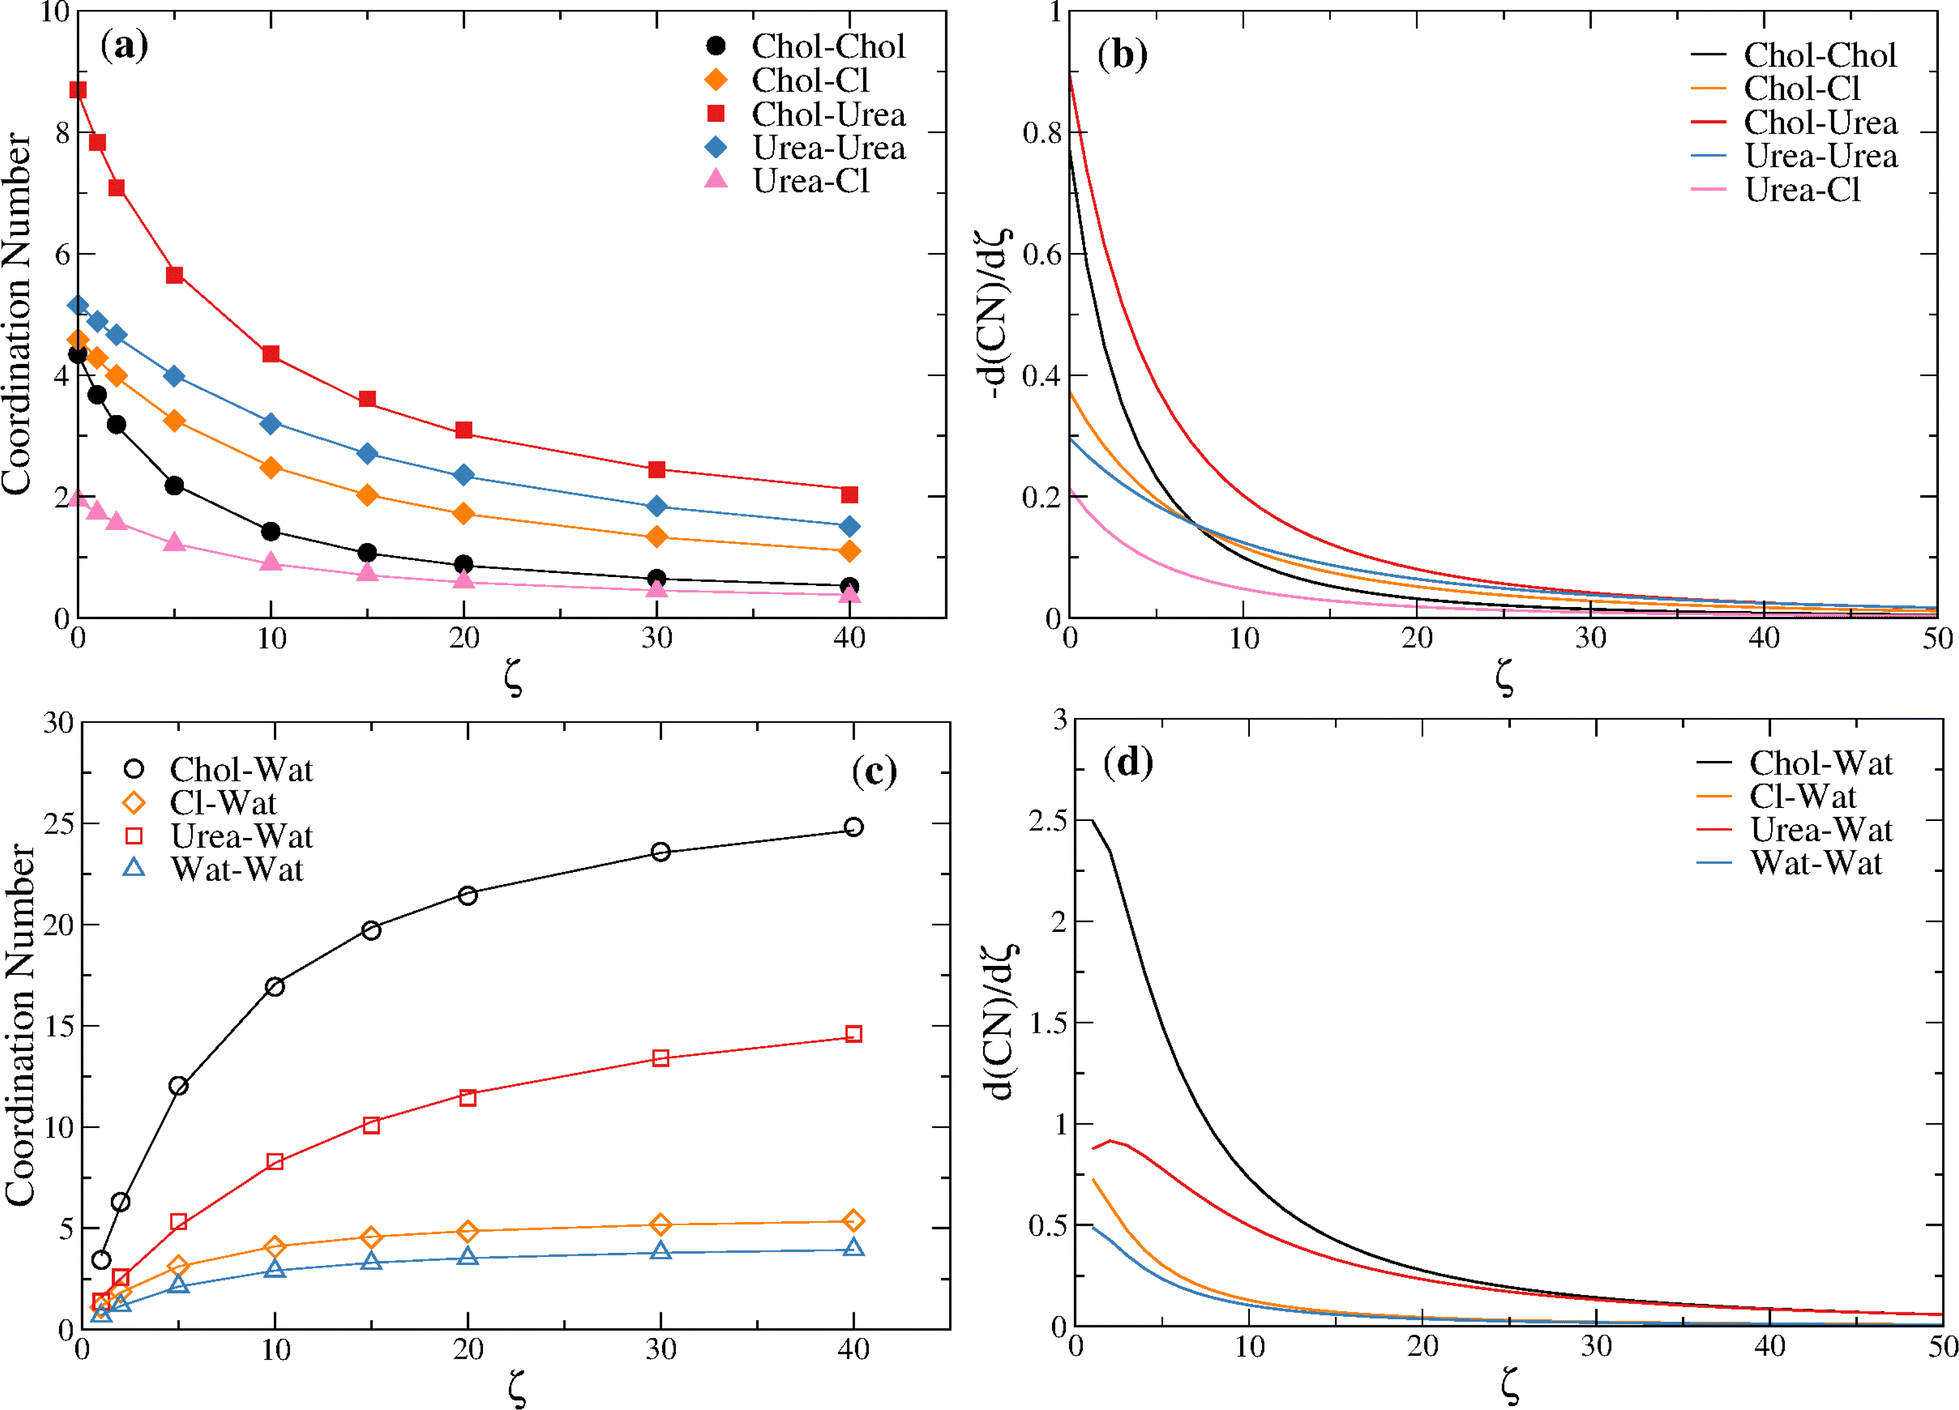 | ||
| Fig. 9 (a) Reline–reline coordination numbers fitted to eqn (7); (b) rate of depletion of reline–reline components as estimated from d(NC)/dζ, with NC given by eqn (7); (c) reline–water coordination numbers fitted to eqn (7); rate of hydration of reline components as estimated from d(NC)/dζ, with NC given by eqn (7). | ||
A major difference between the ND/EPSR and the MD structure, however, concerns the hydration numbers of the distinct components of reline. The MD predict a larger hydration around the distinct species, including choline. Perhaps more surprising is the fact that the ND/EPSR results predict a water molecule to be hydrated by only ∼2.5 water molecules at ζ = 30, whereas the MD of the distinct DES/water models predict a value of ∼4.0 closer to the value in bulk water. The OW–OW coordination numbers found for reline at ζ = 30 are: 3.9, 3.8, 3.8, 3.7, and 3.8, obtained for the OPLS-DA/TIP4P-2005, OPLS-DA/Urea/TIP4P-2005, GAFF0.8-PPC/TIP4P-Ew, CHARMM36/SPC/E, and CHARMM36-SH/SPC/E force fields, respectively.
The experimental coordination number of (pure) water is ∼4.7. This number was obtained herein by integrating the experimental oxygen–oxygen (OW–OW) rdf of water reported by Soper58 up to the first minimum (0.339 nm). This is compared in Table 4 with the coordination number of pure water predicted by the different water models used, and the TIP3P water model used in the EPSR method by Hammond et al.;15 although a slight modification is introduced in the TIP3P water model used in the EPSR method,15 this does not lead to any significant differences relative to the original model.
| Exp/model | ρ (g cm−3) | First minimum (rmin ±0.001 nm) | CN (rmin) | CN (r = 0.333 nm) | D (10−5 cm2 s−1) |
|---|---|---|---|---|---|
| Exp59 | 0.997 | 0.339 | 4.67 | 4.45 | 2.3 |
| TIP4P/2005 | 0.997 | 0.333 | 4.44 | 4.44 | 2.2 |
| TIP4P-EW | 0.995 | 0.333 | 4.42 | 4.42 | 2.3 |
| SPC/E | 0.999 | 0.333 | 4.45 | 4.45 | 2.4 |
| TIP3P | 0.986 | 0.357 | 5.60 | 4.49 | 5.4 |
Fig. S15 (ESI†) compares the experimental oxygen–oxygen (OW–OW) partial rdf with those for the different water models in pure liquid water at 298 K and 0.1 MPa. While the height of the first peak in TIP3P water is more similar to that of real water, the remaining features are not, a point long discussed in the literature.47 In addition, the first minimum appears at a longer distance and the coordination number is larger than the experimental value (see Table 4). The diffusion coefficients are also shown. These are consistent with previous studies that pointed out the much too large self-diffusion coefficient of TIP3P water.47
While the OW–OW coordination number in reline is necessarily lower than in bulk water, because many water molecules are in the DES components’ coordination spheres, the MD results predict a larger and increasing value with ζ, than the experimental ND/EPSR results. However, this does not seem to be connected with the TIP3P model since a larger coordination number is found with this model for neat water. In addition, the lower choline–water coordination observed at ζ = 15 and ζ = 20, relative to ζ = 10, cannot be reproduced by any force field.
The puzzling behavior of the choline–water coordination found through ND/EPSR should be associated with either a sudden drain of water from the first choline–water coordination sphere or with the formation of a new first peak at a shorter distance for ζ = 15. The first hypothesis seems highly unlikely since more water is being introduced in the system and, therefore, such a coordination sphere should continuously increase. The second, although plausible, was also not observed for any force field (see Fig. S13, ESI†). Whereas this can be a flaw of the force fields, the fact that a much lower water–water coordination is found through ND/EPSR than that found in bulk water, suggests that EPSR could underestimate the formation of water–water hydrogen bonds (HBs). Notice that along with a decrease of the choline–water coordination number a concomitant decrease of the chloride–water and urea–water coordination number is observed, which is compensated by a small increase of the water–water coordination. Further addition of water fills the different components’ hydration layers without changing water's coordination which remains non-tetrahedral (i.e., ≪4 water neighbors) and apparently unchanged up to ζ = 30. This picture contrasts with that portrayed by the GAFF0.8-PPC and the CHARMM36-SH force fields which, in spite of an increase of the choline–choline (C atom rdf) coordination at ζ = 15, display a continuous increase of the number of water molecules around every component.
IV. Conclusions
DESs emerged in the last decades as promising green solvent media in many chemical processes and applications where organic solvents are commonly used. A foremost feature of these solvents is the possibility of tailoring their physicochemical properties through the addition of water. A comprehensive understanding of the relationship between DES–water composition, structure, and dynamics, towards the development of optimized mixtures for specific applications, can, however, be hampered by the intrinsic complexity of the systems, reflected in conflicting experimental results for properties such as viscosity. While water significantly lowers the viscosity of DES it increases the complexity of the mixture's structure and, therefore, the disentanglement of the total structure factor assessed through neutron or X-ray diffraction into partial structure factors. For reline, ND/EPSR results indicate an abnormal hydration pattern of the components, especially noticeable for choline cations. The latter suffer a significant dewetting at around 51 wt% of water, concomitant with an increase of the choline–choline coordination.Herein, we investigated the water-induced structural changes of reline, aiming at gaining insight into the non-monotonic variation of the choline–choline and choline–water coordination reported through ND/EPSR. Five different force fields were investigated. The CHARMM36-SH and GAFF0.8-PPC provided the most accurate description of the structure and dynamics of the DES.
Our results show that in spite of a reasonable description of the partial radial distribution functions of the DES in the absence of water, the non-monotonic variation of the DES–water coordination, observed through ND/EPSR, is not supported by simulations. Whereas force field limitations cannot be ruled out, the low water–water coordination found through the EPSR method at large water contents suggests the EPSR model may not provide an accurate description of the components’ hydration, including water, which remains non-tetrahedral, opposite to the MD results.
The MD show a monotonic increasing hydration of every component at increasing water contents, and the stabilization of a structural transition above around ζ = 10 (41 wt%), when choline cations lose ∼70% of the choline nearest neighbors, ∼50% of the urea nearest neighbors, and ∼45% of the chloride nearest neighbors.
Overall, our simulations predict a smoother transition between a “Water in DES” to a “DES in Water”,15 where, although the rate of water retention by choline decreases with the water content, there is no evidence of a crossing point where a dewetting occurs, as predicted by ND/EPSR.
Conflicts of interest
There are no conflicts to declare.Acknowledgements
We would like to thank Prof. Maria Di Pietro for providing the experimental data for the diffusion coefficient of reline. HM acknowledges financial support from FCT through a PhD scholarship 2021.07457.BD. AP received financial support from FCT through IF/01146/2015. This work has received funding from the ERC-2016-CoG 725034 and was supported by the Associate Laboratory for Green Chemistry (LAQV) financed by national funds from FCT/MCTES (UIDB/50006/2020). NG acknowledges financial support from Fundação para a Ciência e a Tecnologia (FCT) of Portugal (CEEC/2018). NG acknowledges support from UIDB/04046/2020 and UIDP/04046/2020 centre grants from FCT, Portugal (to BioISI) and the Portuguese National Distributed Computing Infrastructure (http://www.incd.pt).References
- B. B. Hansen, S. Spittle, B. Chen, D. Poe, Y. Zhang, J. M. Klein, A. Horton, L. Adhikari, T. Zelovich, B. W. Doherty, B. Gurkan, E. J. Maginn, A. Ragauskas, M. Dadmun, T. A. Zawodzinski, G. A. Baker, M. E. Tuckerman, R. F. Savinell and J. R. Sangoro, Deep Eutectic Solvents: A Review of Fundamentals and Applications, Chem. Rev., 2021, 121(3), 1232–1285, DOI:10.1021/acs.chemrev.0c00385.
- E. L. Smith, A. P. Abbott and K. S. Ryder, Deep Eutectic Solvents (DESs) and Their Applications, Chem. Rev., 2014, 114(21), 11060–11082, DOI:10.1021/cr300162p.
- A. P. Abbott, G. Capper, D. L. Davies, R. K. Rasheed and V. Tambyrajah, Novel Solvent Properties of Choline Chloride/Urea MixturesElectronic Supplementary Information (ESI) Available: Spectroscopic Data, Chem. Commun., 2003,(No. 1), 70–71, 10.1039/b210714g See.
- A. Paiva, R. Craveiro, I. Aroso, M. Martins, R. L. Reis and A. R. C. Duarte, Natural Deep Eutectic Solvents – Solvents for the 21st Century, ACS Sustainable Chem. Eng., 2014, 2(5), 1063–1071, DOI:10.1021/sc500096j.
- S. Azmi, M. F. Koudahi and E. Frackowiak, Reline Deep Eutectic Solvent as a Green Electrolyte for Electrochemical Energy Storage Applications, Energy Environ. Sci., 2022, 15(3), 1156–1171, 10.1039/D1EE02920G.
- M. Pätzold, S. Siebenhaller, S. Kara, A. Liese, C. Syldatk and D. Holtmann, Deep Eutectic Solvents as Efficient Solvents in Biocatalysis, Trends Biotechnol., 2019, 37(9), 943–959, DOI:10.1016/j.tibtech.2019.03.007.
- G. García, S. Aparicio, R. Ullah and M. Atilhan, Deep Eutectic Solvents: Physicochemical Properties and Gas Separation Applications, Energy Fuels, 2015, 29(4), 2616–2644, DOI:10.1021/ef5028873.
- S. Sarmad, J.-P. Mikkola and X. Ji, Carbon Dioxide Capture with Ionic Liquids and Deep Eutectic Solvents: A New Generation of Sorbents, ChemSusChem, 2017, 10(2), 324–352, DOI:10.1002/cssc.201600987.
- O. S. Hammond, D. T. Bowron and K. J. Edler, Liquid Structure of the Choline Chloride–Urea Deep Eutectic Solvent (Reline) from Neutron Diffraction and Atomistic Modelling, Green Chem., 2016, 18(9), 2736–2744, 10.1039/C5GC02914G.
- K. Jeong, J. G. McDaniel and A. Yethiraj, Deep Eutectic Solvents: Molecular Simulations with a First-Principles Polarizable Force Field, J. Phys. Chem. B, 2021, 125(26), 7177–7186, DOI:10.1021/acs.jpcb.1c01692.
- S. Kaur, A. Malik and H. K. Kashyap, Anatomy of Microscopic Structure of Ethaline Deep Eutectic Solvent Decoded through Molecular Dynamics Simulations, J. Phys. Chem. B, 2019, 123(39), 8291–8299, DOI:10.1021/acs.jpcb.9b06624.
- O. Ciocirlan, O. Iulian and O. Croitoru, Effect of Temperature on the Physico-Chemical Properties of Three Ionic Liquids Containing Choline Chloride, Rev. Chim. B(Bucharest, Rom.), 2010, 61, 721–723 CAS.
- R. B. Leron and M.-H. Li, High-Pressure Density Measurements for Choline Chloride: Urea Deep Eutectic Solvent and Its Aqueous Mixtures at T= (298.15 to 323.15) K and up to 50 MPa, J. Chem. Thermodyn., 2012, 54, 293–301, DOI:10.1016/j.jct.2012.05.008.
- F. Cappelluti, A. Mariani, M. Bonomo, A. Damin, L. Bencivenni, S. Passerini, M. Carbone and L. Gontrani, Stepping Away from Serendipity in Deep Eutectic Solvent Formation: Prediction from Precursors Ratio, J. Mol. Liq., 2022, 367, 120443, DOI:10.1016/j.molliq.2022.120443.
- O. S. Hammond, D. T. Bowron and K. J. Edler, The Effect of Water upon Deep Eutectic Solvent Nanostructure: An Unusual Transition from Ionic Mixture to Aqueous Solution, Angew. Chem., 2017, 129(33), 9914–9917, DOI:10.1002/ange.201702486.
- P. Kumari, Shobhna, S. Kaur and H. K. Kashyap, Influence of Hydration on the Structure of Reline Deep Eutectic Solvent: A Molecular Dynamics Study, ACS Omega, 2018, 3(11), 15246–15255, DOI:10.1021/acsomega.8b02447.
- C. D’Agostino, R. C. Harris, A. P. Abbott, L. F. Gladden and M. D. Mantle, Molecular Motion and Ion Diffusion in Choline Chloride Based Deep Eutectic Solvents Studied by 1H Pulsed Field Gradient NMR Spectroscopy, Phys. Chem. Chem. Phys., 2011, 13(48), 21383, 10.1039/c1cp22554e.
- A. Pandey and S. Pandey, Solvatochromic Probe Behavior within Choline Chloride-Based Deep Eutectic Solvents: Effect of Temperature and Water, J. Phys. Chem. B, 2014, 118(50), 14652–14661, DOI:10.1021/jp510420h.
- E. O. Fetisov, D. B. Harwood, I.-F. W. Kuo, S. E. E. Warrag, M. C. Kroon, C. J. Peters and J. I. Siepmann, First-Principles Molecular Dynamics Study of a Deep Eutectic Solvent: Choline Chloride/Urea and Its Mixture with Water, J. Phys. Chem. B, 2018, 122(3), 1245–1254, DOI:10.1021/acs.jpcb.7b10422.
- Q. Gao, Y. Zhu, X. Ji, W. Zhu, L. Lu and X. Lu, Effect of Water Concentration on the Microstructures of Choline Chloride/Urea (1:2)/Water Mixture, Fluid Phase Equilib., 2018, 470, 134–139, DOI:10.1016/j.fluid.2018.01.031.
- H. Monteiro, A. Paiva, A. R. C. Duarte and N. Galamba, Structure and Dynamic Properties of a Glycerol–Betaine Deep Eutectic Solvent: When Does a DES Become an Aqueous Solution?, ACS Sustainable Chem. Eng., 2022, 10(11), 3501–3512, DOI:10.1021/acssuschemeng.1c07461.
- A. S. D. Ferreira, R. Craveiro, A. R. Duarte, S. Barreiros, E. J. Cabrita and A. Paiva, Effect of Water on the Structure and Dynamics of Choline Chloride/Glycerol Eutectic Systems, J. Mol. Liq., 2021, 342, 117463, DOI:10.1016/j.molliq.2021.117463.
- S. Kaur, A. Gupta and H. K. Kashyap, How Hydration Affects the Microscopic Structural Morphology in a Deep Eutectic Solvent, J. Phys. Chem. B, 2020, 124(11), 2230–2237, DOI:10.1021/acs.jpcb.9b11753.
- S. Sarkar, A. Maity and R. Chakrabarti, Microscopic Structural Features of Water in Aqueous–Reline Mixtures of Varying Compositions, Phys. Chem. Chem. Phys., 2021, 23(6), 3779–3793, 10.1039/D0CP05341D.
- Y. Xie, H. Dong, S. Zhang, X. Lu and X. Ji, Effect of Water on the Density, Viscosity, and CO2 Solubility in Choline Chloride/Urea, J. Chem. Eng. Data, 2014, 59(11), 3344–3352, DOI:10.1021/je500320c.
- H. Shekaari, M. T. Zafarani-Moattar and B. Mohammadi, Thermophysical Characterization of Aqueous Deep Eutectic Solvent (Choline Chloride/Urea) Solutions in Full Ranges of Concentration at T = (293.15–323.15) K, J. Mol. Liq., 2017, 243, 451–461, DOI:10.1016/j.molliq.2017.08.051.
- A. Yadav and S. Pandey, Densities and Viscosities of (Choline Chloride + Urea) Deep Eutectic Solvent and Its Aqueous Mixtures in the Temperature Range 293.15 K to 363.15 K, J. Chem. Eng. Data, 2014, 59(7), 2221–2229, DOI:10.1021/je5001796.
- D. Lapeña, F. Bergua, L. Lomba, B. Giner and C. Lafuente, A Comprehensive Study of the Thermophysical Properties of Reline and Hydrated Reline, J. Mol. Liq., 2020, 303, 112679, DOI:10.1016/j.molliq.2020.112679.
- M. E. Di Pietro, O. Hammond, A. van den Bruinhorst, A. Mannu, A. Padua, A. Mele and M. Costa Gomes, Connecting Chloride Solvation with Hydration in Deep Eutectic Systems, Phys. Chem. Chem. Phys., 2021, 23(1), 107–111, 10.1039/D0CP05843B.
- M. E. Di Pietro, M. Tortora, C. Bottari, G. Colombo Dugoni, R. V. Pivato, B. Rossi, M. Paolantoni and A. Mele, In Competition for Water: Hydrated Choline Chloride:Urea vs Choline Acetate:Urea Deep Eutectic Solvents, ACS Sustainable Chem. Eng., 2021, 9(36), 12262–12273, DOI:10.1021/acssuschemeng.1c03811.
- A. K. Soper, Empirical Potential Monte Carlo Simulation of Fluid Structure, Chem. Phys., 1996, 202(2–3), 295–306, DOI:10.1016/0301-0104(95)00357-6.
- L. Sapir and D. Harries, Restructuring a Deep Eutectic Solvent by Water: The Nanostructure of Hydrated Choline Chloride/Urea, J. Chem. Theory Comput., 2020, 16(5), 3335–3342, DOI:10.1021/acs.jctc.0c00120.
- S. L. Perkins, P. Painter and C. M. Colina, Molecular Dynamic Simulations and Vibrational Analysis of an Ionic Liquid Analogue, J. Phys. Chem. B, 2013, 117(35), 10250–10260, DOI:10.1021/jp404619x.
- B. Doherty and O. Acevedo, OPLS Force Field for Choline Chloride-Based Deep Eutectic Solvents, J. Phys. Chem. B, 2018, 122(43), 9982–9993, DOI:10.1021/acs.jpcb.8b06647.
- D. Van Der Spoel, E. Lindahl, B. Hess, G. Groenhof, A. E. Mark and H. J. C. Berendsen, GROMACS: Fast, Flexible, and Free, J. Comput. Chem., 2005, 26(16), 1701–1718, DOI:10.1002/jcc.20291.
- G. Bussi, D. Donadio and M. Parrinello, Canonical Sampling through Velocity Rescaling, J. Chem. Phys., 2007, 126(1), 014101, DOI:10.1063/1.2408420.
- M. Parrinello and A. Rahman, Polymorphic Transitions in Single Crystals: A New Molecular Dynamics Method, J. Appl. Phys., 1981, 52(12), 7182–7190, DOI:10.1063/1.328693.
- U. Essmann, L. Perera, M. L. Berkowitz, T. Darden, H. Lee and L. G. Pedersen, A Smooth Particle Mesh Ewald Method, J. Chem. Phys., 1995, 103(19), 8577–8593, DOI:10.1063/1.470117.
- B. Hess, H. Bekker, H. J. C. Berendsen and J. G. E. M. Fraaije, LINCS: A Linear Constraint Solver for Molecular Simulations, J. Comput. Chem., 1997, 18(12), 1463–1472, DOI:10.1002/(SICI)1096-987X(199709)18:12
![[double bond splayed right]](https://www.rsc.org/images/entities/char_e00a.gif) 1463::AID-JCC4
1463::AID-JCC4![[double bond splayed left]](https://www.rsc.org/images/entities/char_e009.gif) 3.0.CO;2-H.
3.0.CO;2-H. - W. L. Jorgensen, D. S. Maxwell and J. Tirado-Rives, Development and Testing of the OPLS All-Atom Force Field on Conformational Energetics and Properties of Organic Liquids, J. Am. Chem. Soc., 1996, 118(45), 11225–11236, DOI:10.1021/ja9621760.
- J. L. F. Abascal and C. Vega, A General Purpose Model for the Condensed Phases of Water: TIP4P/2005, J. Chem. Phys., 2005, 123(23), 234505, DOI:10.1063/1.2121687.
- K. Tamoliunas and N. Galamba, Protein Denaturation, Zero Entropy Temperature, and the Structure of Water around Hydrophobic and Amphiphilic Solutes, J. Phys. Chem. B, 2020, 124(48), 10994–11006, DOI:10.1021/acs.jpcb.0c08055.
- J. Wang, R. M. Wolf, J. W. Caldwell, P. A. Kollman and D. A. Case, Development and Testing of a General Amber Force Field, J. Comput. Chem., 2004, 25(9), 1157–1174, DOI:10.1002/jcc.20035.
- H. W. Horn, W. C. Swope, J. W. Pitera, J. D. Madura, T. J. Dick, G. L. Hura and T. Head-Gordon, Development of an Improved Four-Site Water Model for Biomolecular Simulations: TIP4P-Ew, J. Chem. Phys., 2004, 120(20), 9665–9678, DOI:10.1063/1.1683075.
- J. Huang and A. D. MacKerell, CHARMM36 All-Atom Additive Protein Force Field: Validation Based on Comparison to NMR Data, J. Comput. Chem., 2013, 34(25), 2135–2145, DOI:10.1002/jcc.23354.
- H. J. C. Berendsen, J. R. Grigera and T. P. Straatsma, The Missing Term in Effective Pair Potentials, J. Phys. Chem., 1987, 91(24), 6269–6271, DOI:10.1021/j100308a038.
- P. Mark and L. Nilsson, Structure and Dynamics of the TIP3P, SPC, and SPC/E Water Models at 298 K, J. Phys. Chem. A, 2001, 105(43), 9954–9960, DOI:10.1021/jp003020w.
- V. Agieienko and R. Buchner, A Comprehensive Study of Density, Viscosity, and Electrical Conductivity of (Choline Chloride + Glycerol) Deep Eutectic Solvent and Its Mixtures with Dimethyl Sulfoxide, J. Chem. Eng. Data, 2021, 66(1), 780–792, DOI:10.1021/acs.jced.0c00869.
- J. M. Haile, Molecular Dynamics Simulation: Elementary Methods, Wiley professional paperback series, Wiley, New York, 1997 Search PubMed.
- P. J. Daivis and D. J. Evans, Comparison of Constant Pressure and Constant Volume Nonequilibrium Simulations of Sheared Model Decane, J. Chem. Phys., 1994, 100(1), 541, DOI:10.1063/1.466970.
- T. Chen, B. Smit and A. T. Bell, Are Pressure Fluctuation-Based Equilibrium Methods Really Worse than Nonequilibrium Methods for Calculating Viscosities, J. Chem. Phys., 2009, 131(24), 246101, DOI:10.1063/1.3274802.
- S. Nosé and M. L. Klein, Constant Pressure Molecular Dynamics for Molecular Systems, Mol. Phys., 1983, 50(5), 1055–1076, DOI:10.1080/00268978300102851.
- D. M. Heyes, Pressure Tensor of Partial-Charge and Point-Dipole Lattices with Bulk and Surface Geometries, Phys. Rev. B: Condens. Matter Mater. Phys., 1994, 49(2), 755–764, DOI:10.1103/PhysRevB.49.755.
- N. Galamba, C. A. Nieto de Castro and J. F. Ely, Molecular Dynamics Simulation of the Shear Viscosity of Molten Alkali Halides, J. Phys. Chem. B, 2004, 108(11), 3658–3662, DOI:10.1021/jp036234x.
- J. M. Haile, Molecular Dynamics Simulation: Elementary Methods, Wiley professional paperb., A Wiley-Interscience publication, Wiley, New York, NY, 1997 Search PubMed.
- M. P. Allen and D. J. Tildesley, Computer Simulation of Liquids, Oxford University Press, 2017, vol. 1, DOI:10.1093/oso/9780198803195.001.0001.
- J. P. Bittner, L. Huang, N. Zhang, S. Kara and S. Jakobtorweihen, Comparison and Validation of Force Fields for Deep Eutectic Solvents in Combination with Water and Alcohol Dehydrogenase, J. Chem. Theory Comput., 2021, 17(8), 5322–5341, DOI:10.1021/acs.jctc.1c00274.
- A. K. Soper, The Radial Distribution Functions of Water as Derived from Radiation Total Scattering Experiments: Is There Anything We Can Say for Sure?, ISRN Phys. Chem., 2013, 2013, 1–67, DOI:10.1155/2013/279463.
- R. Mills, Self-Diffusion in Normal and Heavy Water in the Range 1-45.Deg, J. Phys. Chem., 1973, 77(5), 685–688, DOI:10.1021/j100624a025.
Footnote |
| † Electronic supplementary information (ESI) available. See DOI: https://doi.org/10.1039/d2cp04139a |
| This journal is © the Owner Societies 2023 |