
Theoretically seeking charge transport materials with inherent mobility higher than 2,6-diphenyl anthracene: three isomers of 2,6-dipyridyl anthracene†
Guiya
Qin
a,
Panpan
Lin
ac,
Xiaoqi
Sun
b,
Jingfu
Guo
 *b,
Jianxun
Fan
d,
Lifei
Ji
e,
Hui
Li
a and
Aimin
Ren
*a
*b,
Jianxun
Fan
d,
Lifei
Ji
e,
Hui
Li
a and
Aimin
Ren
*a
aInstitute of Theoretical Chemistry, College of Chemistry, Jilin University, Changchun, 130023, China. E-mail: renam@jlu.edu.cn
bSchool of Physics, Northeast Normal University, Changchun 130024, P. R. China
cCollege of Chemistry and Chemical Engineering, Qiqihar University, Qiqihar, 161006, P. R. China
dCollege of Chemistry and Materials Science, Weinan Normal University, Weinan 714000, China
eHebei Provincial Key Laboratory of Photoelectric Control on Surface and Interface, Hebei University of Science and Technology, Shijiazhuang, 050018, P. R. China
First published on 13th October 2022
Abstract
2,6-Diphenyl anthracene (2,6-DPA) is a well-known anthracene derivative with high hole mobility (34 cm2 V−1 s−1) among p-type organic semiconductors (OSCs). In contrast, three 2,6-dipyridyl anthracene (2,6-DPyA) molecules (ortho-, meta-, and para-pyridyl), which are isoelectronic to 2,6-DPA showed relatively low mobility in experiments. To explore the origin of different charge transport properties and gain new inspiration on the design of novel organic semiconductor materials, the intrinsic hole transport property of 2,6-DPA and three isomeric 2,6-DPyAs were theoretically investigated and compared by quantum-chemical methodology and molecular dynamics simulation. The calculated results indicate that the intrinsic mobility of 2,6-DPyA-b (meta-) is superior to that of 2,6-DPA (12.73 vs. 3.54 cm2 V−1 s−1). Furthermore, the possibility that 2,6-DPyA-b may be strongly affected by thermal fluctuations is excluded because of the strong intermolecular C–H⋯N interactions (H-bonds). In addition, the crystal growth morphology prediction is considered in depth by the attachment energy (AE) model. The prediction results demonstrate that the strong intermolecular H-bonds in 2,6-DPyA do not facilitate the formation of a large and regular crystal face but rather the production of many grains and grain boundaries, which is not conducive to the charge carrier transport. This study reflects the paradox of the H-bond in OSCs and highlights the indispensability of the mesoscopic crystal growth morphology prediction in identifying high performance OSC materials and the establishment of the relationship between microcosmic organic molecules and macroscopic device performance.
1. Introduction
With remarkable progress in low-cost, light-weight, flexible and easy large-area manufacturing processes, organic semiconductors (OSCs) have been widely applied in a variety of photoelectric materials, such as the common organic field effect transistor (OFET) devices, organic thin film transistors (OTFTs), and organic light-emitting transistor (OLET) devices, which recently emerged as the most promising light signal detectors and functional, wearable electronics.1–10 However, the low charge carrier mobility and collection efficiency of the charge carriers of a majority of organic OSC materials limit their application and the further development of organic phototransistors. Hence, exploring multifunctional OSCs with high mobility is essential to achieve high performance and has been the pursuit of most researchers.11–13As we all know, OSCs with high mobility occur in the form of extended π-conjugated structures.14–17 As the basic skeleton of multifunctional OSCs, anthracene with both charge transport and luminescence properties has attracted the attention of researchers. The hole mobility of anthracene is 0.02–3 cm2 V−1 s−1.18,19 From the extensive research performed to date, the common routes for a single molecule to improve the charge transport properties of devices are the following three ways:20 (i) introducing long alkyl chains to enhance the solubility and stabilize the layered-packing motif in the industrial process,21,22 (ii) introducing substituents with an aromatic ring/extended π-electronic structure on the basis of typical molecules, which could be beneficial to the further delocalization of orbital wavefunctions,23 and (iii) introducing heteroatoms24–26 (e.g., N, S, and O) or different substituent groups27,28 to regulate and control the electronic structure, and hence modulate the charge injection barrier and the carrier transport type. In recent years, according to these ways, a lot of anthracene derivatives have been widely investigated and synthesized as one of the most promising candidates for OFETs and OLETs.6,29–32
As early as in 2005, the Yoshiro Yamashita group prepared two anthracene derivatives (2,6-bis(4-trifluoromethylphenyl)anthracene and 2,6-dithienylanthracene) that were applied for OFETs, and they proved that the n- and p-type activities can be achieved through the introduction of acceptor or donor substitutions into the terminal position of the anthracene core, respectively.33 In recently years, Soon-Ki Kwon et al. studied the alkyl chain length dependence of the field-effect mobility in a series of asymmetric anthracene derivatives, which concluded that a moderate side chain length appeared to be optimal for promoting self-organization in OFETs.34 Moreover, the charge transport property of a series of 2,6-di(4-alkyl-phenyl)anthracenes (Cn-Ph-Ants, n = 0–4 and 6) was also investigated.35 The result indicated an increasing tendency of mobility with shorter alkyl chain length. The film order, crystallinity, and grain size can be enhanced with a decrease in the alkyl chain length. Zhang and Jia et al. have synthesized and characterized three anthracene derivatives with asymmetric structures, (E)-2-styrylanthracene (2-phvA), 2-(phenylethynyl) anthracene (2-pheA) and 2-phenylanthracene (2-phA).31 Among them, 2-phvA exhibited the highest mobility of 10 cm2 V−1 s−1, which was one of the highest mobilities among the asymmetric anthracene derivatives. Moreover, several anthracene derivatives with symmetrical structures have been reported to possess a high mobility of over 10 cm2 V−1 s−1, for instance, 2,6-di(2-naphthyl)anthracene (dNaAnt) and 2,6-bis(4-methoxyphenyl)anthracene (BOPAnt).36,37 Their single-crystal FETs showed mobilities of up to 12.3 and 16.6 cm2 V−1 s−1, respectively.36,37 Furthermore, 2,6-diphenyl anthracene (2,6-DPA) is the most remarkable anthracene derivative, which was synthesized and researched by the Hu Group.38–40 The hole mobility of the 2,6-DPA single crystal transistor is as high as 34 cm2 V−1 s−1. However, herein, we will focus on the other small molecules with similar structures, such as 2,6-dithienyl anthracene (2,6-DTA) and 2,6-dipyridyl anthracene (2,6-DPyA), which replace the phenyls with the isoelectronic thienyl and pyridyl, respectively. Their reported mobilities are at least four orders of magnitude lower than that of 2,6-DPA. For 2,6-DTA, the hole mobilities for the OTFT-devices are in the range of 0.004–0.06 cm2 V−1 s−1.33 As for 2,6-DPyA, the OTFT properties of the three isomeric 2,6-DPyAs with different N-atom positions have been researched experimentally for comparison.41 The experimental results showed that the three isomeric 2,6-DPyAs all have light-emitting properties, but the thin film mobilities of 2,6-di(pyridin-2-yl)anthracene (2,6-DPyA-a) and 2,6-di(pyridin-3-yl)anthracene (2,6-DPyA-b) are 0.05 cm2 V−1 s−1 and 10−5 cm2 V−1 s−1, respectively. Meanwhile, there was no charge transport behavior for 2,6-di(pyridin-4-yl) anthracene (2,6-DPyA-c) because of the small transfer integral and inferior crystallinity. In 2019, the Meng group used the Marcus hopping theory to compare the charge transport properties of 2,6-DPA and 2,6-DTA.42 The main theoretical evidences for the lower mobility of 2,6-DTA are as follows: (i) larger hole reorganization energy (λ) during the charge transfer process caused by a flexible geometry; (ii) smaller electronic coupling because of the reduced HOMO overlap. However, compared to 2,6-DPA, the theoretical reasons for the low mobilities for the three 2,6-DPyA devices are not yet clear. Still, the origin that leads to the low mobilities of these 2,6-DPyAs should be different from 2,6-DTA because, in general, the intra-ring substitution of the carbons of benzene with N-atoms did not increase the λ. Furthermore, the electronic coupling from the HOMO overlap is not notably reduced after investigation. Moreover, a more important point is that the inferior crystallinity, connectivity and film morphology of the 2,6-DPyA materials may be more significant factors that affect the charge transport property. However, the above speculations cannot be pinned due to insufficient evidence. The N-atom is a commonly doped atom in organic materials. It is essential to find out how the different positions of nitrogen atoms (N-atoms) affect the intrinsic charge transfer properties, and whether it has an effect on the morphology of the crystal growth for 2,6-DPyAs. As far as we know, the 2,6-DPyAs series of molecules are also an important functional module of amplified spontaneous emission materials.43 To make this point clear is essential for achieving the further design strategy of anthracene derivatives or other OSC materials with excellent charge transport property and other optoelectronic functional materials. From the viewpoint described above, in contrast to pure trial-and-error experimental approaches, the intrinsic properties of the material at the molecular level are not easy to be intuitively reflected by experimental measurements. Accordingly, it makes the basic theoretical research all the more important.
In this study, the charge transport properties of 2,6-DPA and three isomeric 2,6-DPyAs were theoretically investigated in detail. Because of the experimental band-like transport behavior and temperature dependence of the mobility of 2,6-DPA,40 the quantum nuclear tunneling charge transport hopping theory44 and classical molecular dynamics (MD) simulations were adopted to explore the dependence of the band-like transport and temperature, and assess the effect of temperature on the non-local electron–phonon coupling (thermal fluctuation). Moreover, the QM/MM method was used to consider the solid environment as a limited space to obtain their single molecular geometries and electronic properties. The attachment energy (AE) model was further applied to predict the crystal growth morphology, which was developed on the basis of the periodic bond-chain (PBC) model. Furthermore, the intermolecular noncovalent interactions in these crystals were analyzed to deeply understand the great effects on the crystal packing, thermal fluctuation, growth morphology. It is of great theoretical and practical value to study the intermolecular interactions from a microscopic view to link the mesoscopic growth morphology with the macroscopic device performance, and finally to establish a bridge between the microcosmic intermolecular interaction and macroscopic device performance.
2. Transport mechanisms and computational methods
As is well-known, there are two established extreme semiclassical theories; one is the band transport model, and the other is the hopping regime. The former applies to the fully delocalized systems, while the latter applies to completely localized systems (Marcus theory).45 For Boltzmann's band transport theory, it excessively overestimates the mobility of OSCs on account of the fact that the quantum localization effect is not considered. Whereas, in relation to Marcus theory, the part of the nuclear degrees of freedom is treated as classical, and this may give rise to overestimating the energy barrier of the reorganization at low temperatures and further underestimating the charge hopping rate. Thus, Marcus theory always underestimates the mobility for band-like systems. Nan et al. proposed a more detailed hopping model to circumvent this shortcoming by considering the quantum nuclear tunneling effect arising from the multi-vibrational modes in the charge transport process.44 For many high-mobility systems with weak electronic delocalization states, such as rubrene, a simple and easy nuclear tunneling hopping model is enough to describe the band-like transport behavior.46 The charge transfer rate is written as: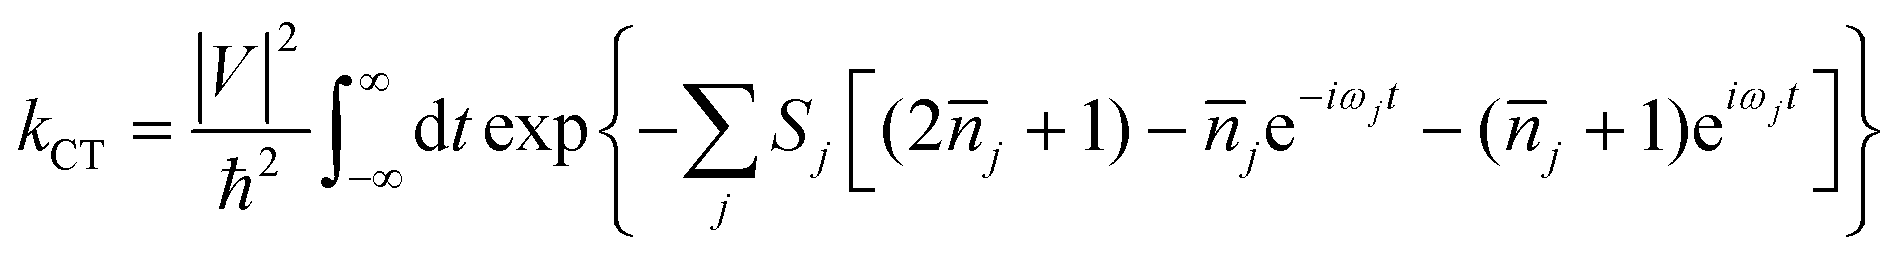 | (1) |
![[n with combining macron]](https://www.rsc.org/images/entities/i_char_006e_0304.gif) j in the above formula represents the phonon occupation number of the jth vibrational mode with frequency ωj, j = 1/(eħωj/kBT − 1).
j in the above formula represents the phonon occupation number of the jth vibrational mode with frequency ωj, j = 1/(eħωj/kBT − 1).
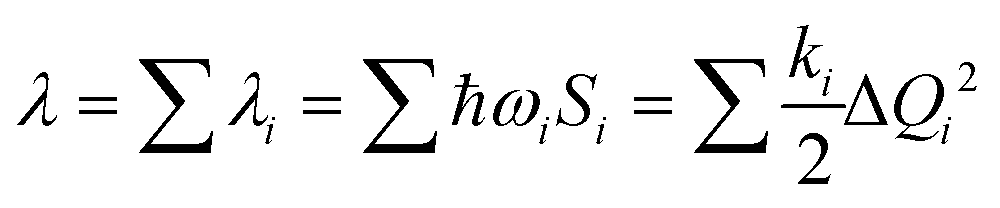
The λ for the charge transfer of materials consists of the internal reorganization energy (λint) and the external reorganization energy (λext). Owing to λext being much smaller than λint in pure organic condensed phases, it is neglected in this study.47 For λint, it can be calculated by two ways: one is the normal-mode analysis (NM) mentioned above, where the complete expression is:
 | (2) |
The other way to calculate the λint is the adiabatic potential surfaces (AP) method, which is expressed as follows:
| λh/e = λ(1)int + λ(2)int = Eh/e(QN) − Eh/e(Qh/e) + EN(Qh/e) − EN(QN) | (3) |
In formula (1), the transfer integral V between the two neighboring molecules i and j can be calculated through the site energy-corrected coupling method:45
 | (4) |
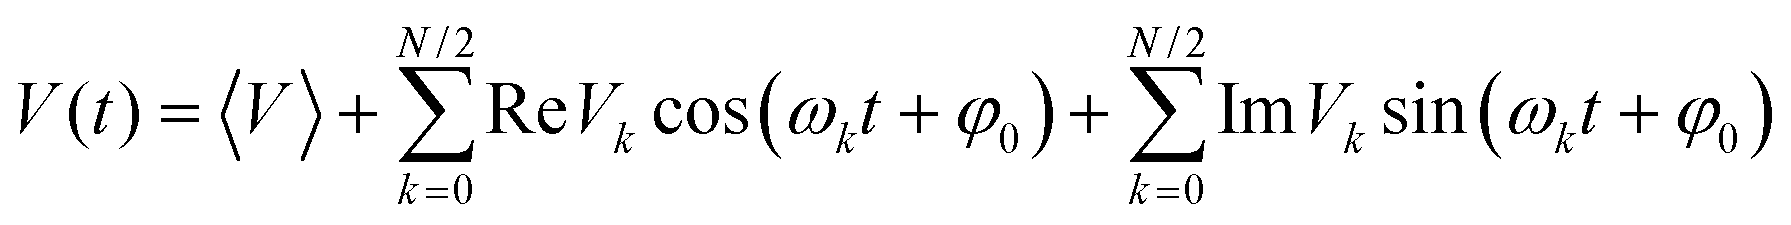
It has been confirmed that the effect of lattice vibrations on V is considered as a serious damage upon the charge transport character in OSC devices. Therefore, in order to obtain the carrier mobilities under the effect of lattice vibrations, it is indispensable to explore the effect of the nonlocal electron–phonon coupling on V, that is, thermal disorder effect. It could be expressed in terms of the time evolution of V, (V(t)):48,49
 | (5) |
![[thin space (1/6-em)]](https://www.rsc.org/images/entities/char_2009.gif) Vk and ImVk represent the amplitudes of the cosine and sine basis functions, respectively. φ0 is a phase factor, and it has been proved that evaluating the transfer integral fluctuations for the inequivalent dimer is sufficient. The φ0 can be chosen randomly because the fluctuation of V between different dimers has hardly any correlation.
Vk and ImVk represent the amplitudes of the cosine and sine basis functions, respectively. φ0 is a phase factor, and it has been proved that evaluating the transfer integral fluctuations for the inequivalent dimer is sufficient. The φ0 can be chosen randomly because the fluctuation of V between different dimers has hardly any correlation.
For the nuclear tunneling models, after carrying out the charge transfer rate, the mobility can be evaluated through assuming a random diffusion process via the Einstein formula:50
 | (6) |
 | (7) |
3. Results and discussion
3.1 Geometric structure and basic properties
The molecular structure plays an important role in determining the properties of the material. Thus, a deeper understanding of the structural difference between 2,6-DPA and 2,6-DPyAs is needed. Considering the restriction of the substituent torsion by the surrounding molecules in the crystal, the geometric structures of these studied molecules in Fig. 1 were firstly optimized through the quantum mechanics and molecular mechanics (QM/MM) method,52–54 which can be carried out in the Gaussian 09 ONIOM module.55 B3LYP/6-31+G(d,p) is used in the QM layer, and the UFF force field is employed in the MM layer. The order of the torsion angles between the pyridyl/phenyl and anthracene plane for these optimized molecules is 2,6-DPyA-b (34.20°/−33.13°) > 2,6-DPyA-a (26.19°/−26.21°) > 2,6-DPA (19.53°/−19.55°) > 2,6-DPyA-c (9.34°/−9.35°), which is almost the same as those of the crystal structures (Table S1, ESI†). Among them, the molecular backbone of 2,6-DPyA-c is the closest to the plane, which may facilitate the effective overlap of the frontier molecular orbital.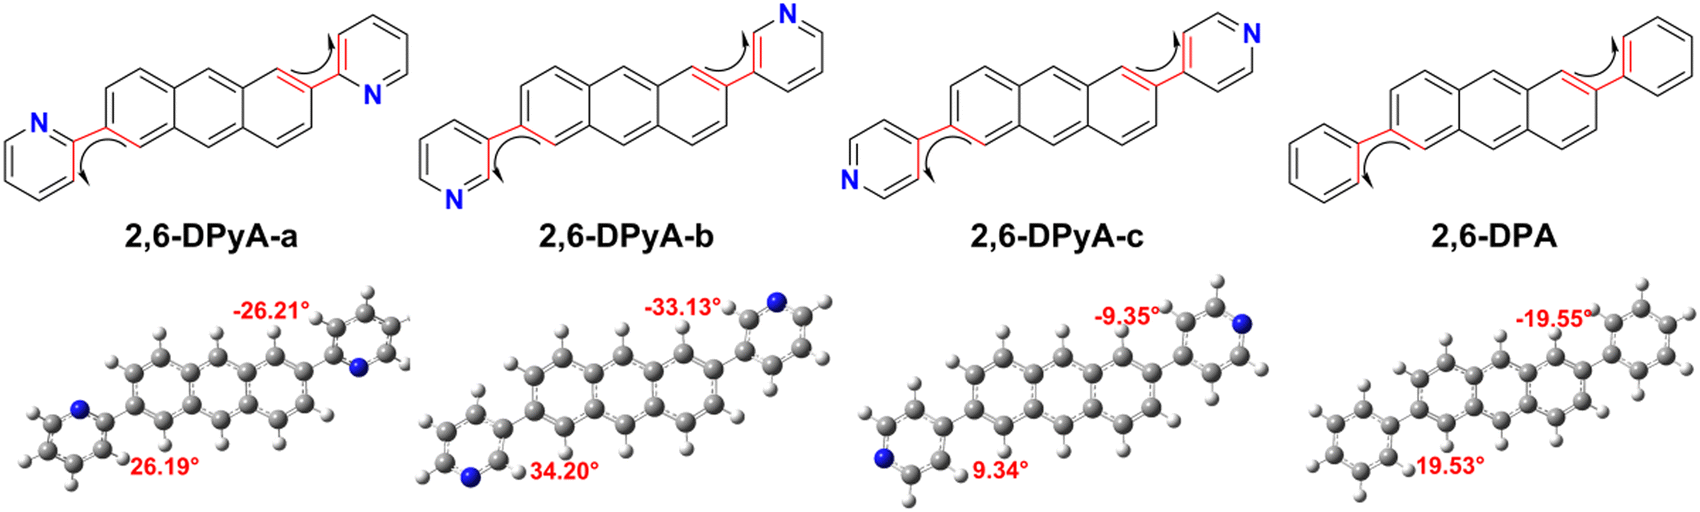 | ||
| Fig. 1 Molecular chemical structures in this study and the optimized geometries by the QM/MM method at the B3LYP/6-31+G(d,p) level. The red part is the torsion angles between the substituent moieties (pyridyl and phenyl) and anthracene plane. | ||
Secondly, the highest occupied molecular orbital (HOMO) and the lowest unoccupied molecular orbital (LUMO), relating to the charge injection, were calculated and are described in Fig. 2. It can be visually seen that the HOMO and LUMO electronic probabilities/clouds are delocalized on both the central anthracene ring and the lateral substituents (pyridyl and phenyl) for all studied compounds. The energy level of the frontier molecular orbital is controlled by the position of the N-atom, and decreases successively from the ortho-, meta- and para- positions (2,6-DPyA-a, 2,6-DPyA-b, 2,6-DPyA-c), and the variation tendency is in line with the experimental measurement results, as shown in Table S2 (ESI†). For 2,6-DPyA-c, the low HOMO level means that the injection barrier of the hole increases when worked with the Au electrode (Au electrode potential: −5.1 eV).49 This could be one of the reasons for observing no transport property experimentally.41 Meanwhile, there is a small difference between the experimental phenomenon and theoretical results. The HOMO levels of 2,6-DPA and 2,6-DPyA-b (−5.60 eV and −5.58 eV) are similar experimentally. However, the theoretical results show that the HOMO level of 2,6-DPA is more similar to that of 2,6-DPyA-a (−5.41 eV and 5.45 eV), but is different from the −5.68 eV for 2,6-DPyA-b. This means that, in the case of the same source/drain electrode (Au), the hole injection abilities of 2,6-DPA and 2,6-DPyA-a are similar, but the injection barriers of 2,6-DPyA-b are a little greater than those of 2,6-DPA. As for the energy gaps between HOMO and LUMO, the changes of all compounds are not obvious (3.21–3.32 eV). The energy gap of 2,6-DPyA-b is slightly larger than that for the others.
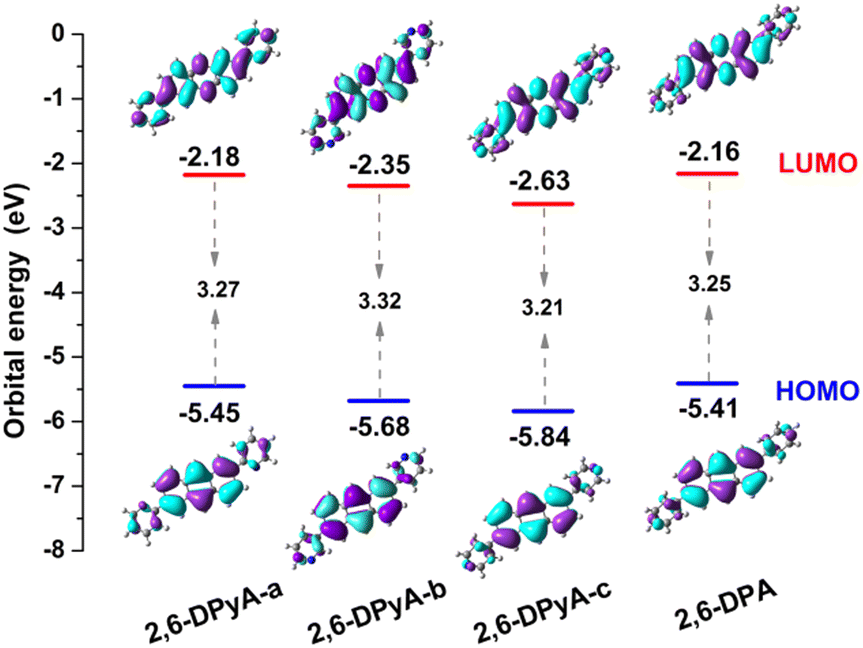 | ||
| Fig. 2 The spatial distributions of HOMO and LUMO, as well as their orbital energies. | ||
The oxidation and reduction ability can be characterized by the value of the ionization potentials (IPs) and electron affinities (EAs), which could offer useful information about the performance and ambient stability of the organic device. The calculated results of IPs and EAs are displayed in Table 1. The trend of IPs for all of the studied compounds is as follows: 2,6-DPyA-c (7.08 eV) > 2,6-DPyA-b (6.90 eV) > 2,6-DPyA-a (6.69 eV) > 2,6-DPA (6.60 eV). The results are consistent with the trend of the HOMO levels. For the EAs of 2,6-DPyA-c, 2,6-DPyA-b, 2,6-DPyA-a and 2,6-DPA, the values are 1.52, 1.21, 1.11 and 1.02 eV, respectively, which is in accordance with the trend of the LUMO levels. That is to say, the oxidation activities become weaker but reduction activity increases in the order of 2,6-DPyA-a, 2,6-DPyA-b and 2,6-DPyA-c, compared with 2,6-DPA. It also means that the ambient stability is ensured for the N-doped anthracene derivatives.
| QM/MM | |||
|---|---|---|---|
| λ h(NM/AP) | IP | EA | |
| 2,6-DPyA-a | 0.128/0.129 | 6.69 | 1.11 |
| 2,6-DPyA-b | 0.144/0.144 | 6.90 | 1.21 |
| 2,6-DPyA-c | 0.133/0.133 | 7.08 | 1.52 |
| 2,6-DPA | 0.142/0.142 | 6.60 | 1.02 |
3.2 Reorganization energy and vibration mode analysis
The reorganization energy (λ) stands for the geometric relaxation energy during the charge transfer process between the neighboring electron-donor and electron-acceptor species. It is one of the crucial parameters to judge the quality of the charge transfer, and a smaller λ is in favor of the charge transport. For these investigated anthracene derivatives, the hole λs (λhs) were also calculated by two methods (NM and AP) to verify whether the harmonic oscillator approximation is effective during the charge transport process, and the results are listed in Table 1. The results obtained by the two methods are in good agreement, indicating that these compounds can be reliably described by the harmonic oscillator approximation. Moreover, in the displaced harmonic oscillator model, the Huang–Rhys factor (HRF) is a measure of the electron–phonon coupling interaction, and is commonly used to characterize the extent of geometric relaxation. The strength directly connects with the displacement (di) along the normal mode i between the equilibrium geometries of the two states. The magnitudes of each frequency contribution to the HRF and λh are marked in Fig. 3, and the characteristic vibration modes of the high- and low-frequency regions are also assigned.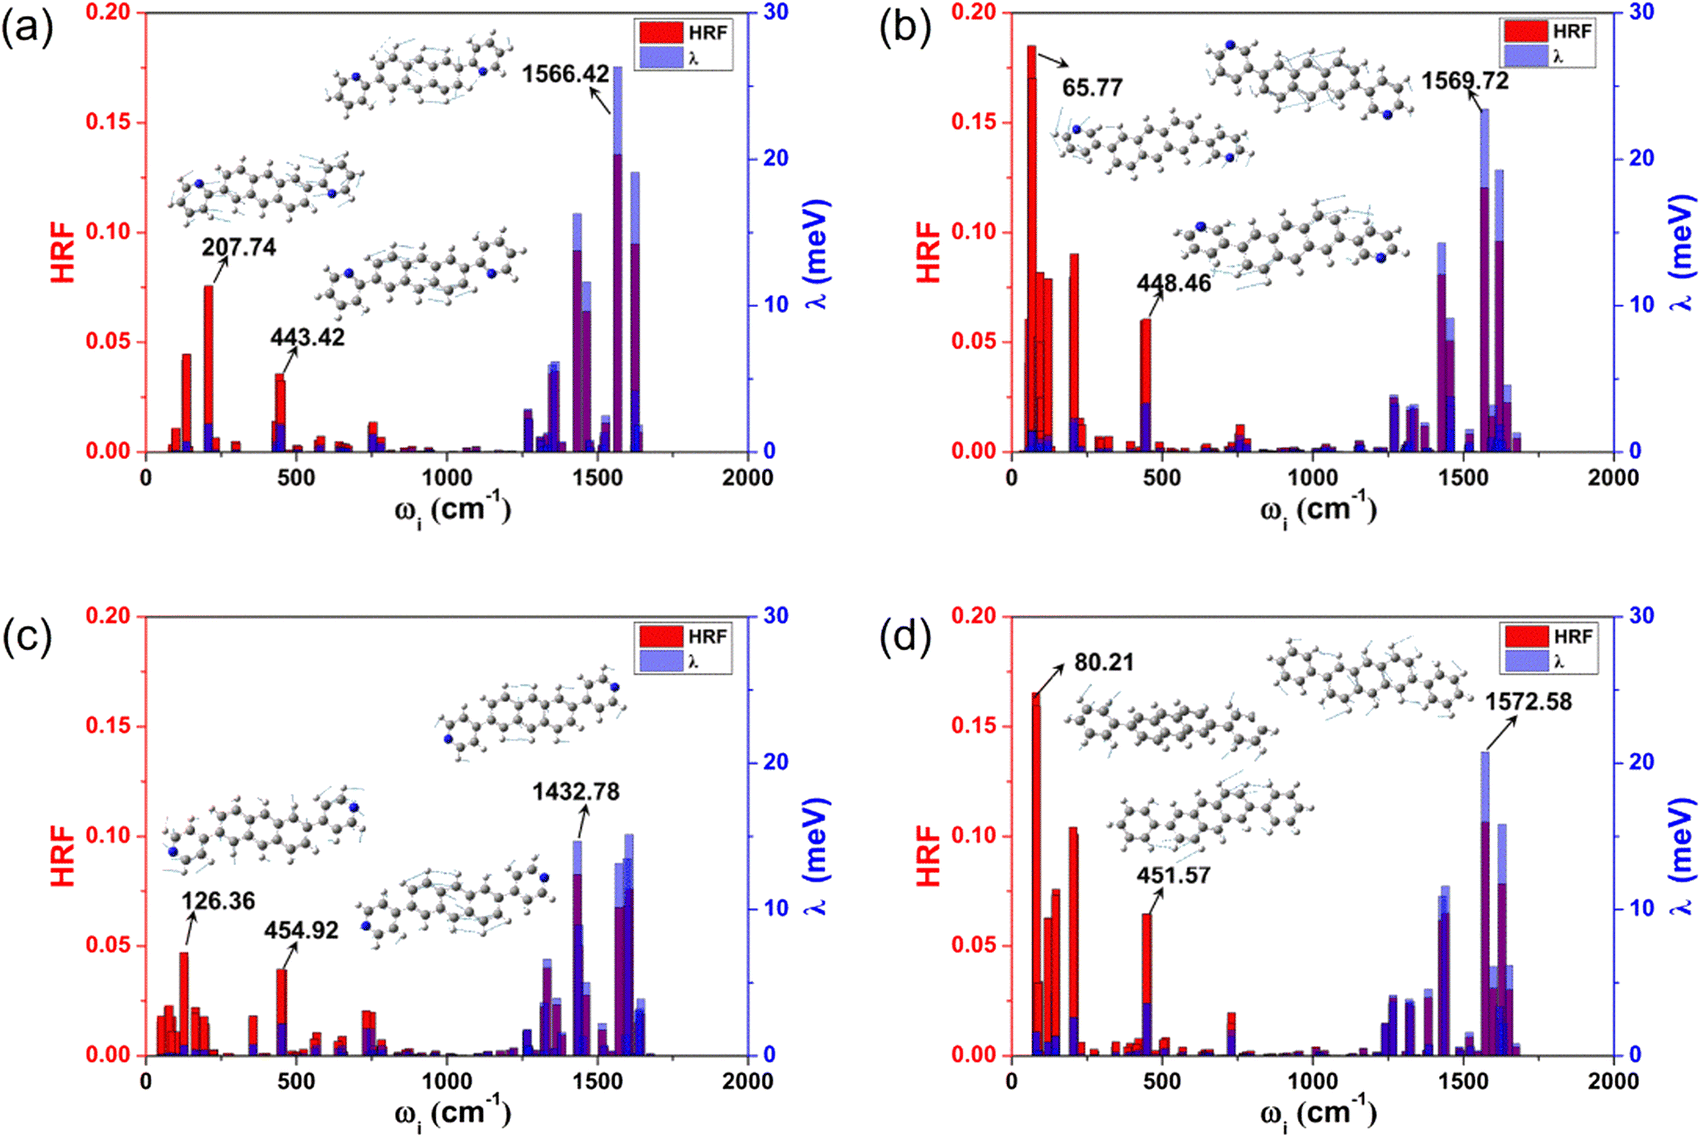 | ||
| Fig. 3 Contribution of each individual vibration mode i to the HRF and λh. (a–d) Represent the 2,6-DPyA-a, 2,6-DPyA-b,2,6-DPyA-c, and 2,6-DPA, respectively. The numbers marked in the figure represent the frequency of the normal mode corresponding to the large Huang Rhys factors. | ||
From Fig. 3, the main contributions to λh arise from the high frequency region (1250–1700 cm−1), which are mainly assigned to the hybrid vibrations of the C–H bending and C![[double bond, length as m-dash]](https://www.rsc.org/images/entities/char_e001.gif) C stretching vibration motions. The typical frequency values are 1566.42 cm−1 (for 2,6-DPyA-a), 1569.72 cm−1 (for 2,6-DPyA-b), 1432.78 cm−1 (for 2,6-DPyA-c) and 1572.58 cm−1 (for 2,6-DPA), and the corresponding contributions to λh are 26.32, 23.43, 14.67, and 20.76 meV, respectively. Their HRFs in these high-frequencies are also large, indicating the important effect of these high frequency vibrations for charge transport. Different from 2,6-DPyA-a and 2,6-DPyA-c, there are some large HRFs located in the low-frequency region (<500 cm−1) for 2,6-DPyA-b (65.77 cm−1) and 2,6-DPA (80.22 cm−1), respectively, which are mainly derived from the swing vibration modes of the meta-pyridyl ring or phenyl ring. 2,6-DPyA-b has a larger HRF value in the low frequency region, indicating that the meta-pyridyl ring is more deformed during the charge transfer processes when compared to the other two isomers. Meanwhile, these torsional modes contribute largely to λh. According to Table 1, the λh of 2,6-DPyA-b is nearly equal to that of 2,6-DPA, while the λh of 2,6-DPyA-a and 2,6-DPyA-c are relatively small. The order is as follows: 2,6-DPyA-b (0.144 eV) > 2,6-DPA (0.142 eV) > 2,6-DPyA-c (0.133 eV) > 2,6-DPyA-a (0.128 eV). It is not difficult to understand the small λh for 2,6-DPyA-c because its polarized direction is aligned with that of the anthracene core. However, it is not clear why the λh of 2,6-DPyA-a is also small. In order to clearly identify the differences in λh of these compounds, the λh can be broadly divided into four parts: 0–500 cm−1 is the lateral substituent torsion vibration and out-of-plane bending vibration of the whole molecular skeleton; 500–1250 cm−1 mainly belongs to the C–H out-of-plane bending vibration; 1250–1700 cm−1 mainly consists of the CC stretching vibrations and the in-plane C–H bending vibrations; and a higher frequency vibration range (>1700 cm−1) that almost contributes nothing to λh. The classification results are displayed in Table S3 (ESI†). We found that the most obvious difference comes from the low frequency range (<500 cm−1), in which the contributions of all vibration modes to the λh are 11.33, 22.56, 10.70 and 23.85 meV for 2,6-DPyA-a, 2,6-DPyA-b, 2,6-DPyA-c and 2,6-DPA, respectively. This is mainly due to the molecular vibration at 450 cm−1, which is mainly manifested as the in-plane C–H swing vibration at the edge of the anthracene skeleton, as shown in Fig. 3. For 2,6-DPyaA-b and 2,6-DPA, the vibration direction is toward the direction of the substituent. The impact of this vibration mode on the reorganization energy is greater than the vibration of 2,6-DPyA-a, and 2,6-DPyA-c towards the inner side of the skeleton. According to the above analysis for the λh related to the charge transfer property, we found that the molecules in the 2,6-DPyA series have a smaller λh than 2,6-DPA.
C stretching vibration motions. The typical frequency values are 1566.42 cm−1 (for 2,6-DPyA-a), 1569.72 cm−1 (for 2,6-DPyA-b), 1432.78 cm−1 (for 2,6-DPyA-c) and 1572.58 cm−1 (for 2,6-DPA), and the corresponding contributions to λh are 26.32, 23.43, 14.67, and 20.76 meV, respectively. Their HRFs in these high-frequencies are also large, indicating the important effect of these high frequency vibrations for charge transport. Different from 2,6-DPyA-a and 2,6-DPyA-c, there are some large HRFs located in the low-frequency region (<500 cm−1) for 2,6-DPyA-b (65.77 cm−1) and 2,6-DPA (80.22 cm−1), respectively, which are mainly derived from the swing vibration modes of the meta-pyridyl ring or phenyl ring. 2,6-DPyA-b has a larger HRF value in the low frequency region, indicating that the meta-pyridyl ring is more deformed during the charge transfer processes when compared to the other two isomers. Meanwhile, these torsional modes contribute largely to λh. According to Table 1, the λh of 2,6-DPyA-b is nearly equal to that of 2,6-DPA, while the λh of 2,6-DPyA-a and 2,6-DPyA-c are relatively small. The order is as follows: 2,6-DPyA-b (0.144 eV) > 2,6-DPA (0.142 eV) > 2,6-DPyA-c (0.133 eV) > 2,6-DPyA-a (0.128 eV). It is not difficult to understand the small λh for 2,6-DPyA-c because its polarized direction is aligned with that of the anthracene core. However, it is not clear why the λh of 2,6-DPyA-a is also small. In order to clearly identify the differences in λh of these compounds, the λh can be broadly divided into four parts: 0–500 cm−1 is the lateral substituent torsion vibration and out-of-plane bending vibration of the whole molecular skeleton; 500–1250 cm−1 mainly belongs to the C–H out-of-plane bending vibration; 1250–1700 cm−1 mainly consists of the CC stretching vibrations and the in-plane C–H bending vibrations; and a higher frequency vibration range (>1700 cm−1) that almost contributes nothing to λh. The classification results are displayed in Table S3 (ESI†). We found that the most obvious difference comes from the low frequency range (<500 cm−1), in which the contributions of all vibration modes to the λh are 11.33, 22.56, 10.70 and 23.85 meV for 2,6-DPyA-a, 2,6-DPyA-b, 2,6-DPyA-c and 2,6-DPA, respectively. This is mainly due to the molecular vibration at 450 cm−1, which is mainly manifested as the in-plane C–H swing vibration at the edge of the anthracene skeleton, as shown in Fig. 3. For 2,6-DPyaA-b and 2,6-DPA, the vibration direction is toward the direction of the substituent. The impact of this vibration mode on the reorganization energy is greater than the vibration of 2,6-DPyA-a, and 2,6-DPyA-c towards the inner side of the skeleton. According to the above analysis for the λh related to the charge transfer property, we found that the molecules in the 2,6-DPyA series have a smaller λh than 2,6-DPA.
3.3 Crystal packing, intermolecular interactions and transfer integral
Ordinarily, the molecular packing patterns in organic crystals are related to the various interactions, such as the van der Waals, π⋯π interactions and H-bond. As shown in Table 2, 2,6-DPyA-a, 2,6-DPyA-c, and 2,6-DPA all belong to the P21/c space group of the monoclinic system. 2,6-DPyA-b crystallizes in the space group Pca21, which is a member of the orthonormal system, and their packing motifs are demonstrated in Fig. 4. Although the space groups are slightly different, they all exhibit a typical 2D herringbone packing pattern. In this section, in order to analyze the packing patterns, the close intermolecular contacts in their crystals are firstly visualized and quantified via Hirshfeld surface analysis with the CrystalExplorer package.56,57 The shape index (SI) surface58 is chosen to represent the close intermolecular contacts because it could provide an even clearer indication by its complementary colour scheme. The graphical results are displayed in Fig. 5 for 2,6-DPyAs and Fig. S1 (ESI†) for 2,6-DPA.| Space group | Cell parameters | Volume (Å3) | |
|---|---|---|---|
| 2,6-DPyA-a | P21/c (14) | a: 17.318, b: 6.2349, 7.3422 (Å) | 393.594 |
| α: 90.00, β: 96.81, γ: 90.00 (°) | |||
| 2,6-DPyA-b | Pca21 (29) | a: 7.437, b: 6.280, 35.030 (Å) | 409.017 |
| α: 90.00, β: 90.00, γ: 90.00 (°) | |||
| 2,6-DPyA-c | P21/c (14) | a: 12.582, b: 6.5.997, 10.882 (Å) | 399.044 |
| α: 90.00, β: 103.31, γ: 90.00 (°) | |||
| 2,6-DPA | P21/c (14) | a: 17.973, b: 7.352, c: 6.245 (Å) | 412.573 |
| α: 90.00, β: 90.60, γ: 90.00 (°) |
 | ||
| Fig. 4 The packing motifs for 2,6-DPyA-a (a), 2,6-DPyA-b (b), 2,6-DPyA-c (c), and 2,6-DPA (d). The blue lines represent for the C–H⋯N H-bond (unit: Å). | ||
 | ||
| Fig. 5 The Hirshfeld surface with shape index for 2,6-DPyA-a (a), 2,6-DPyA-b (b), 2,6-DPyA-c (c). | ||
From the results, it was found that two main types of intermolecular contacts are prevalent in these crystal structures, one is the C⋯H (C–H⋯π) contacts among the herringbone packing dimers in the transport layer, and the other is the H⋯H contacts for the parallel stacking patterns throughout the crystal. However, because of the different structures, their contribution to each crystal is different, even the isomers in 2,6-DPyA series. For 2,6-DPA, it basically involves these two kinds of contacts. The C⋯H contacts are mainly distributed on the whole molecular skeleton with proportions of 56.3%, and the remaining part is mainly H⋯H contacts with a proportion of 42.4%. Moreover, the C⋯C contacts are few and negligible. For the 2,6-DPyA series, all kinds of contact for 2,6-DPyA-a and 2,6-DPyA-b are very similar in both value and distribution region. The C⋯H contacts are mainly distributed on the anthracene skeleton, and the proportions are 37.6% and 37.9%, respectively. However, for the C⋯H contacts of 2,6-DPyA-c, besides the distribution on the anthracene skeleton, it is also partially distributed on a pyridyl ring because of the small torsion angle and good π-conjugation with the anthracene core. Thus, its proportion increased to 49.1%. With regard to the most major H⋯H contacts, the proportions of 2,6-DPyA-a, -b, and -c are in the order of 44.2%, 40.6%, and 32.9%, respectively, which are widely distributed around the molecular periphery. Moreover, unlike 2,6-DPA, the typical pattern of the red and blue triangles appeared on their SI surfaces of pyridyl rings (shown in Fig. 5). This is characteristic of π⋯π intermolecular interaction. With reference to the packing mode of the crystals, the π⋯π contact for 2,6-DPyA-a and 2,6-DPyA-b is situated on two pyridyl rings between the two closest herringbone-like molecules. Meanwhile, it appears between one pyridyl ring and the anthracene skeleton for 2,6-DPyA-c. The packing models are shown in detail in Fig. 4(a–c).
The intermolecular interaction energy between the two molecules can be used to quantitatively estimate the strength of interaction among the molecules in a crystal, which is obtained by measuring the relative stability of a dimer. The charge transfer integral (V) between two molecules characterizes the electronic coupling strength between the neighboring molecule pairs, which is a vital parameter for the carrier transport rate. Since the intermolecular interaction energy and electron couplings between adjacent layers are too small to affect the hole transport, only those of the dimers within the layer have been studied. The dimers are composed of the central red molecule and the adjacent molecules, named Dimer 1 and Dimer 2,…, Dimer 6 (D1 and D2,…, D6), respectively, and shown in Fig. 6.
 | ||
| Fig. 6 Centroid distances d (in Å) and hole transfer integrals Vh (in meV along the major hopping directions selected based on the crystal structure, the molecules in red are the central molecules, the molecules in the same color show the equal value of Vh. | ||
Although, the relationship between the intermolecular interactions and V is not clear, the intermolecular interactions can affect the assembly of molecules, and ultimately the V. Thus, the total interaction energies for each important dimer were considered and calculated by means of the symmetry-adapted perturbation theory (SAPT).59 The energy decomposition results in Table 3 show that the strongest interacting configurations for all compounds are the herringbone-packing dimers (D1, D2, D4, D5) with interaction energy values in the range of −15.62 to −18.36 kcal mol−1. Meanwhile, it falls in the region of −9.32 to −11.26 kcal mol−1 for the parallel-packing dimers (D3, D6). It is implied that the dimer of the herringbone-packing (edge-to-face) motif will possess stronger stability than the slipped π-stacking (edge-to-edge) motif (−9.32 to −12.20 kcal mol−1) for the studied systems. Since these dimers have been derived from different molecular structures and dimer packing motifs, the comparison between their absolute values is limited. At this point, the relative values can provide more valuable information.60 Thus, the percentage of each energy component was computed, and the results are shown in Table 3.
| Dimer | E elstat | E exch | E ind | E disp | E total | |
|---|---|---|---|---|---|---|
| 2,6-DPyA-a | 1 | −7.41 (15.13%) | 15.73 (32.12%) | −2.00 (4.09%) | −23.83 (48.66%) | −17.51 |
| 3 | −5.76 (23.12%) | 6.83 (27.41%) | −1.48 (5.93%) | −10.85 (43.53%) | −11.26 | |
| 2,6-DPyA-b | 1 | −7.97 (16.44%) | 15.10 (31.16%) | −2.03 (4.18%) | −23.37 (48.22%) | −18.27 |
| 2 | −7.67 (16.47%) | 14.10 (30.28%) | −1.90 (4.09%) | −22.89 (49.16%) | −18.36 | |
| 3 | −7.51 (27.59%) | 7.51 (27.58%) | −1.75 (6.43%) | −10.45 (38.41%) | −12.20 | |
| 2,6-DPyA-c | 1 | −6.17 (15.86%) | 11.65 (29.93%) | −1.63 (4.20%) | −19.46 (50.01%) | −15.62 |
| 3 | −3.98 (17.19%) | 6.67 (28.80%) | −0.97 (4.20%) | −11.53 (49.81%) | −9.81 | |
| 2,6-DPA | 1 | −7.64 (15.92%) | 15.08 (31.40%) | −1.93 (4.01%) | −23.37 (48.67%) | −17.86 |
| 3 | −3.27 (19.29%) | 3.83 (22.54%) | −0.58 (3.40%) | −9.29 (54.77%) | −9.32 |
Through the specific data of energy decomposition in Table 3, we found that the contributions of the dispersion interactions to the total interaction energies are the highest at nearly half of the total interaction energies, which are mainly ascribed to the C–H⋯π interaction and the π⋯π interactions. These interactions exist among all herringbone-packing dimers and π-stacking dimers. The second largest component is the exchange repulsive energy. For the π-stacking dimers, this component is larger than that of the herringbone-packing dimers. As for the induction component, it accounts for a tiny portion (<7%). With the introduction of N-atoms, the induction components and exchange repulsive energy components of the π-stacking pattern (D3 and D6) of 2,6-DPyA series increase compared to 2,6-DPA. In addition, we found that the induction and electrostatic components of dimer 3(6) of 2,6-DPyA-a and 2,6-DPyA-b are significantly superior to that of the other two molecules, which are indicative of the intermolecular H-bond (C–H⋯N) between the π-stacking dimers (the topological properties61 are shown in Fig. S2, ESI†). As depicted in Fig. 4, the bond length of C–H⋯N in 2,6-DPyA-b (2.507/2.502 Å) is shorter than that in 2,6-DPyA-a (2.710 Å), indicating the stronger hydrogen bond in the former. For 2,6-DPyA-c, there is no hydrogen-bond within the transport layer. Meanwhile, between the layers within the crystal, the hydrogen-bond length of C–H⋯N is 2.633 Å, as displayed in Fig. 4(c).
The hole Vs (Vhs) between the nearest-neighbor molecules were calculated at the GGA/PW91/DZP level by the Amsterdam density functional (ADF) package.62 As depicted in Fig. 6, six main transport routes are found in the crystals of all compounds. For 2,6-DPA, the most effective transport pathways are D1, D2, D4 and D5 of the herringbone packing with Vhs of 56.97 meV, and the Vhs of the other two slipped π-stacking packing pathways (D3 and D6) are 10.13 meV, which is consistent with the previous calculation by the Wang group.52 For the three compounds of the 2,6-DPyA series, the most effective transport pathways are the four pathways of the herringbone packing (D1, D2, D4 and D5), which is the same as that for 2,6-DPA. The Vhs of 2,6-DPyA-a and 2,6-DPyA-b are even larger than that of 2,6-DPA. The Vh values of pathways D1, D2, D4 and D5 for 2,6-DPyA-a are 70.50 meV. For 2,6-DPyA-b, the pathways are axisymmetric in the form of slight differences in Vhs. The Vhs of pathways D1 and D5 are 67.35 meV, and those for D2 and D4 are 65.63 meV. Based on the result of the Hirshfeld Surface analysis, this is mainly because of the electron couplings on the parallel pyridyl rings and a smaller dislocation distance between the two closest herringbone-like molecules. Moreover, as for the slipped π-stacking directions of 2,6-DPyA-a and 2,6-DPyA-b, their Vhs are 30.53 meV and 31.54 meV, respectively, which are also much larger than that of 2,6-DPA. This is primarily a result of their small displacements along the molecular long-axis (0.36/0.30 Å vs. 1.03 Å) and short-axis direction (5.53/5.49 Å vs. 5.77 Å), which is depicted in Fig. S3 (ESI†). As for 2,6-DPyA-c, the Vhs of the six transport routes (D1–D6) are smaller than that for 2,6-DPA, and basically equal for the various transport pathways (8.77–8.83 meV). The main reason for this is the larger displacement (1.74 Å) along the molecular long-axis direction. In turn, it can be realized that in the case of the pyridyl ring connected to the π skeleton, the N-atoms can avoid the long and short axis slips when they are in the ortho- and meta-positions, which is beneficial to obtaining the large electronic couplings.
3.4 The effect of thermal fluctuation
As a high-mobility organic semiconductor, there is always an intrinsically large V allowing for the charge carrier between neighboring monomers to form delocalized states. It is confirmed that in the high mobility systems available to date, device optimization has been pushed to the extent that the mobility of the materials is basically subject to thermal fluctuation (also called dynamic disorder) in Vs. For the transistor made with the 2,6-DPA thin-film, its hole mobility has been reported to exhibit temperature dependence property in the literature.40 Hence, the thermal fluctuation of Vhs for 2,6-DPA is taken into account by combining MD simulation with quantum chemistry calculation at different temperatures (100–300 K). The MD simulation was performed using the COMPASS force field, NVT ensemble, Berendsen thermostat, and the upper limit of the time was set to 120 ps with 60 fs time steps. A total of 1800 snapshots were extracted from the dynamic trajectories after thermal equilibration. The Vhs of the dimers at each snapshot were also calculated as in the above method (PW91/DZP). One can see that from our theoretical simulation, the fluctuations of Vh follow the Gaussian distribution, and the absolute values of the average hole transfer integrals (|〈Vhs〉|) and its standard deviations (σ) are listed in Table 4. In the meantime, the ratio of σ/|〈Vh〉| was used to evaluate the strength of the nonlocal electron–phonon couplings.| Comp. | Dimer | 300 K | 200 K | 100 K | ||||||
|---|---|---|---|---|---|---|---|---|---|---|
| |〈Vh〉| | σ | R | |〈Vh〉| | σ | R | |〈Vh〉| | σ | R | ||
| 2,6-DPyA-a | 1 | 42.48 | 42.91 | 1.01 | 57.24 | 25.73 | 0.45 | 58.68 | 15.78 | 0.27 |
| 3 | 14.29 | 7.89 | 0.55 | 16.61 | 6.13 | 0.37 | 18.01 | 3.91 | 0.22 | |
| 2,6-DPyA-b | 1 | 53.73 | 23.94 | 0.45 | 54.59 | 20.41 | 0.37 | 48.83 | 14.35 | 0.29 |
| 3 | 25.93 | 7.42 | 0.29 | 27.03 | 6.72 | 0.25 | 28.87 | 3.98 | 0.14 | |
| 2,6-DPyA-c | 1 | 2.42 | 14.80 | 6.12 | 3.51 | 12.01 | 3.42 | 3.50 | 6.54 | 1.87 |
| 3 | 14.74 | 13.26 | 0.90 | 16.10 | 13.23 | 0.82 | 17.97 | 7.50 | 0.42 | |
| 2,6-DPA | 1 | 39.67 | 23.99 | 0.60 | 45.28 | 19.72 | 0.44 | 47.44 | 10.65 | 0.22 |
| 3 | 6.77 | 7.72 | 1.14 | 5.42 | 6.10 | 1.13 | 6.60 | 3.40 | 0.52 | |
In order to more clearly show the fluctuation situation of the Vhs at different temperatures, the values of each snapshot along the main transport pathways of 2,6-DPA (dimer 1) are shown in Fig. S4 (ESI†). The values of |〈V〉| and σ at different temperatures are listed in Table S4 (ESI†). Taking the 2,6-DPA herringbone stacking dimer (dimer 1) as an example, we found that the fluctuations of Vhs mainly stem from the low-frequency intermolecular vibrations (<160 cm−1) at low temperature (shown in Fig. 7). As the temperature rises, the low-frequency region changes more dramatically. When the temperature is at 300 K, the frequency region is extended to 200 cm−1. On account of the molecular thermal fluctuations, the |〈Vh〉|s of 2,6-DPA decreased relative to the static value (Vh = 56.97 meV), and even gradually dwindled from its static value as the temperature increased from 100 K to 300 K, varying in the range between 47.44 meV (100 K) and 39.67 meV (300 K). At the same time, as shown in Fig. 7 and Table 4, there is a corresponding increase in the volatility of V, and the ratio between its magnitude of volatility (σ) and average value of the transport integrals (Vhs). That is, the value of σ/|〈Vh〉| changes from 0.22 to 0.60 (100–300 K). Next, we analyzed the dimers of the slipped π-stacking. The variation trend of Vhs between 100 K and 250 K is almost identical to that of herringbone stacking. However, at 300 K, the |〈Vh〉| is slightly greater than those at other temperatures, and the σ/|〈Vh〉| is smaller than that at 250 K. This means that the nonlocal electron–phonon coupling is not necessarily linearly decreased with the increase of temperature. However, the electronic coupling fluctuations along the slipped π-stacking direction seem to be more intense than that along the herringbone stacking direction. Due to the small |〈Vh〉|s along the slipped π-stacking direction, it is still the effect of thermal fluctuations in the herringbone stacking direction that has the main influence on the transport performance of materials. Therefore, based on the above parts, for 2,6-DPA, the thermal fluctuation acts as a phonon scattering behavior during the hole transport process. The hole transport of materials will be obstructed severely by thermal fluctuation. This kind of obstruction becomes more apparent as the temperature increases.
 | ||
| Fig. 7 Count distributions of the transfer integral V of the uppermost transport pathways for 2,6-DPA at 300 K, 250 K, 200 K, 150 K and 100 K. The blue solid line represents the Gaussian fit, the red vertical line points to the average values of transfer integrals 〈V〉 on the right side, and the Fourier transformations of the thermal deviation amplitudes (real and imaginary) at the corresponding temperatures are on the left side. | ||
Furthermore, from the above analysis, it is conjectured that the effect of thermal fluctuations for the 2,6-DPyA series also might be the cause of the undesirable charge transport properties shown in the experimental results.41 Hence, the effect of thermal fluctuations for the 2,6-DPyA series as the hole transport materials are calculated as well. To save computing resources and time, we default that the Vhs of dimers along pathways 1, 2, 3 and 4 of 2,6-DPyA-b are approximately equal, and the thermal fluctuations of only one of the pathways in 2,6-DPyA-b is mainly taken into account. The thermal fluctuation results at 300 K, 200 K, and 100 K for the 2,6-DPyA series are displayed in Table 4. The change curves of the V over time, Gaussian fitting and Fourier transformations of dimer 1 are depicted in Fig. 8 and Fig. S5–S8 (ESI†). There are both similarities and differences between the 2,6-DPyA series and 2,6-DPA. The similarity lies in the fact that the thermal fluctuations (R = σ/|〈V〉|) for the 2,6-DPyA series become dramatic with the increase of temperature (100–300 K). However, the intensity of the thermal fluctuation is quite different. Taking the D1 pathway with the condition at 300 K as an example, the order of σ/|〈Vh〉| is as follows: 2,6-DPyA-c (6.12) > 2,6-DPyA-a (1.01) > 2,6-DPA (0.60) > 2,6-DPyA-b (0.45). This means that 2,6-DPyA-c fluctuates most dramatically by temperature. In addition, 2,6-DPyA-a is strongly affected. Meanwhile, 2,6-DPyA-b is the most stable, and even less than 2,6-DPA. The reason can be explained as follows: for 2,6-DPyA-c, the static state Vhs is small, and a small structural change will cause significant fluctuations in Vhs. For 2,6-DPyA-a, the ortho-substituted N-atom results in less steric hindrance between the pyridyl and the core of anthracene, and a more flexible rotation of the substituent. With regards to 2,6-DPyA-b, we considered that the strong intermolecular interaction between the π⋯π stacking stabilizes the overall intermolecular fluctuation. Moreover, unlike 2,6-DPA, the electronic coupling fluctuations slipped π-stacking direction of the 2,6-DPyA series are more stable than that along the herringbone direction, especially the 2,6-DPyA-a and 2,6-DPyA-b. The range of σ/|〈Vh〉| from 100 K to 300 K is 0.22–0.55 and 0.14–0.29, respectively. Compared to 2,6-DPA and 2,6-DPyA-b, it should be due to the fact that the intermolecular interactions along the slipped π-stacking direction (electrostatic and introduction interaction energies caused by the C–N⋯H bond) attenuate the thermal fluctuations. The value of σ/|〈Vh〉| is 0.29, which is smaller than that of 2,6-DPyA-a due to the stronger C–N⋯H bond. Furthermore, it is worth noting that for dimer 3 of 2,6-DPyA-c, the |〈Vh〉|s at different temperatures are larger than its static state value (8.77 meV). To some extent, the thermal disorder along the slipped π-stacking direction is favorable, characterizing the phonon assistance feature. This behavior could change its charge transport characteristics from isotropic to anisotropic. Furthermore, its values of σ/|〈Vh〉| are also smaller than that of 2,6-DPA due to the presence of the C–N⋯H bond between the layers. Hence, it can be concluded that the intermolecular H-bond can inhibit the thermal fluctuation. Furthermore, the stronger the hydrogen bond is, the more obvious the inhibition effect is. On the other hand, from the R values of the 2,6-DPyA series in Table 4, it can be found that the introduction of the N-atom to the terminal benzene enhances the nonlocal electron–phonon coupling effect of the herringbone stacking, while it reduces that of the parallel π-stacking (100 K). This is more evident when the temperature rises. Still, by and large, the C–N⋯H bonds formed by the introduction of the N-atom can suppress the nonlocal electron phonon coupling effect.
 | ||
| Fig. 8 Count distributions of the transfer integral V of the uppermost transport pathways for 2,6-DPyA-a (left) and 2,6-DPyA-b (right) at 100 K, 200 K, and 300 K. The blue solid line represents the Gaussian fit, and the red vertical line points to the average values of the transfer integrals 〈V〉. | ||
3.5 Charge-transfer rate and mobility
According to the above parameters, the charge transfer rate (kCT) for each transport pathway at 300 K could be evaluated on the basis of the kinetic Monte Carlo (KMC) simulation, and the results are shown in Table S5 (ESI†). In order to clarify the effect of temperature on kCT, the change curve of kCT with temperature is calculated, assuming the Vs = 1 eV, and the results are shown in Fig. S9 (ESI†). At this point, the reference kCT is only associated with electron–phonon coupling. According to Fig. 3, the electron–phonon coupling in the high-frequency region is similar. Therefore, the difference in the change trend of kCT lies in the low-frequency region. We found that the reference kCT of 2,6-DPA does not change at the low temperature region (<40 K) with the increase of temperature. The rate decreases rapidly within 40–200 K, and decreases slowly at room temperature (300 K) or higher temperature. This resulted from the contribution of the large electron–phonon coupling in the low-frequency region to the reference kCT. For 2,6-DPyA-b, the reference kCT change trend is similar to that of 2,6-DPA, and it even has a larger kCT value for a larger electron–phonon coupling in the low-frequency region. As for 2,6-DPyA-a and 2,6-DPyA-c, there is no significant change in the reference kCT as a function of temperature. Meanwhile, for this value of the latter, it is two orders of magnitude smaller than that of the other molecules, which is on account of the weaker local electron–phonon coupling in the low-frequency region. This rate analysis is in accordance with the results of the reorganization energy.On the basis of the kCT of every pathway, the hole mobility (μh) can be calculated according to the quantum nuclear tunneling model and Einstein equation. The calculated results under the static state conditions and thermal fluctuation at different temperatures (100, 200 and 300 K) of 2,6-DPA are displayed in Table 5. Herein, the experimental measured values are displayed as well for comparison. In the experiment, 2,6-DPA exhibits a band-like behavior at 200–300 K,40 indicating that the μh decreases with the increase of temperature. It can be observed that the calculated μhs of 2,6-DPA increase upon cooling from 300 K to 200 K, which is consistent with the band-like transport feature. Within the temperature range from 200 K to 300 K, the calculated μhs of the unidirectional main transport pathway under thermal fluctuation conditions range from and 9.49 to 4.05 cm2 V−1 s−1, which is consistent with the experimental measurement range (from 11 to 4.6 cm2 V−1 s−1).40 However, at the low temperature range of 200–100 K, the calculated μh still exhibits an increasing trend, reaching 34.4 cm2 V−1 s−1 at 100 K. The value is close to the maximum μh value reported experimentally, and the experimental crystal was prepared exactly at 100 K. Unfortunately, this relevant experimental data show that the mobility at 100 K is 5.9 cm2 V−1 s−1, and the change of mobility at low temperature has not been clearly explored. It should be noted that there are many complicated factors that are neglected in theoretical simulations, such as the defects, and the quantum tunneling model cannot fully consider the thermal activation of carriers in low-temperature shallow traps.
| Comp. | Dimer | Static state (300 K) | μ avg-h | 300 K | 200 K | 100 K | ||||||
|---|---|---|---|---|---|---|---|---|---|---|---|---|
| μ h | μ h | μ avg-h | Exp. | μ h | μ avg-h | Exp. | μ h | μ avg-h | Exp. | |||
| 2,6-DPyA-a | 1 | 7.33 | 2.78 | 1.86 | 0.92 | 0.05d | 6.18 | 2.23 | 11.95 | 4.63 | ||
| 3 | 1.94 | 0.36 | 0.81 | 1.93 | ||||||||
| 2,6-DPyA-b | 1 | 11.21 | 4.30 | 7.65 | 3.04 | 10−5d |
15.92 | 6.15 | 37.35 | 15.21 | ||
| 3 | 4.01 | 2.87 | 5.58 | 18.25 | ||||||||
| 2,6-DPyA-c | 1 | 0.20 | 0.09 | 0.12 | 0.51 | — | 0.12 | 0.16 | 0.09 | 0.39 | ||
| 3 | 0.18 | 0.47 | 0.84 | 2.27 | ||||||||
| 2,6-DPA | 1 | 7.66 | 2.68 | 4.05 | 1.39 | 4.6c (14.8b, 34a) | 9.49 | 3.10 | 11 | 34.40 | 10.58 | 5.9c |
| 3 | 0.42 | 0.15 | 0.16 | 1.03 | ||||||||
For the 2,6-DPyA series, it has been reported that the charge transport properties of OFET for the three isomeric devices are not ideal in experiment. Especially for 2,6-DPyA-c, no charge transfer behavior is observed. 2,6-DPyA-a and 2,6-DPyA-b exhibited thin film mobilities of 0.05 and 10−5 cm2 V−1 s−1 at room temperature, respectively.41 Based on the static state μhs that we calculated in the single crystal, the unidirectional intrinsic μh of 2,6-DPyA-c is low at about 0.18–0.20 cm2 V−1 s−1. It is possible that the charge transfer performance cannot be shown by considering the limitations of the experimental conditions. However, along a single direction, the maximum intrinsic μhs of 2,6-DPyA-a (7.33 cm2 V−1 s−1) and 2,6-DPyA-b (11.21 cm2 V−1 s−1) are comparable to that of 2,6-DPA (7.66 cm2 V−1 s−1). Because of the serious scattering effect of the thermal fluctuation on the crystal 2,6-DPyA-a, the μh at room temperature (1.86 cm2 V−1 s−1 at 300 K) is reduced by nearly 4 times compared with the static μh. For 2,6-DPyA-b, its intrinsic μh is largest among the three molecular crystals, exhibiting excellent charge transfer behavior. It is also the least affected by the thermal fluctuation. With a reduction of only 1.5 times, the value of μh at 300 K is 7.65 cm2 V−1 s−1 under thermal fluctuation, which is also larger than that for 2,6-DPA.
Because of the anisotropic Vs, the anisotropy mobility is taken into account, which can identify the changes in the charge transfer behavior in all directions.63 Accordingly, based on the 2D transport planes, the angle-dependent anisotropies of μh for the four single crystals we studied are shown in Fig. 9, and the calculated values are listed in Table S6 (ESI†). We found that the main transport plane for 2,6-DPA corresponds to the (001) plane (b–c plane). In this plane, the values of anisotropic μh at 300 K and 200 K are in the range of 3.54–4.71 cm2 V−1 s−1 and 8.11–11.03 cm2 V−1 s−1 under the condition of thermal disorder, which agree well with the experimental values of 4.6 and 11 cm2 V−1 s−1, respectively. Its anisotropy is not significant, and the highest μh value occurs at φ = 90/270° relative to the c axis. Moreover, the value of the intrinsic anisotropy of μh that we calculated at low temperature (100 K) can even reach nearly 40 cm2 V−1 s−1, proving its excellent charge transfer property. As for the 2,6-DPyA series, the main transport planes of 2,6-DPyA-a and 2.6-DPyA-c are the same as that of 2,6-DPA. The variation trend of the anisotropic μh of 2,6-DPyA-a (7.91–8.40 cm2 V−1 s−1) is the same as that of 2,6-DPA, and the static value is also close with a value of 7.01–9.13 cm2 V−1 s−1. When the thermal fluctuation is considered, the anisotropic μh is less than 2,6-DPA (1.92–2.16 vs. 3.54–4.71 cm2 V−1 s−1). Whereas 2,6-DPyA-c exhibits the nature of the isotropic μh in the static state condition, which has values within the range of 0.27–0.30 cm2 V−1 s−1. However, when it comes to thermal disorder, 2,6-DPyA-c displays remarkable anisotropic behavior with the maximum μh occurring at φ = 0/180°, that is, the direction of the b-axis. Furthermore, the isotropic behavior is weakened as the temperature increases. As for 2,6-DPyA-b, its main transport plane is the a–b plane (001 plane), where it almost manifested the properties of isotropic μh. The static μhs range in all directions is 12.73–13.34 cm2 V−1 s−1, which shows the largest μh among the four studied molecular crystals. Due to 2,6-DPyA-b being less affected by thermal fluctuations, it has the largest μh as well after considering the thermal fluctuations. At room temperature (300 K), the isotropic μh of 2,6-DPyA-b is in the range of 8.93–9.24 cm2 V−1 s−1, which is about twice as high as that of 2,6-DPA. As the temperature decreases, the mobility increases even up to 49.35 cm2 V−1 s−1 at 100 K (shown in Fig. 9). Hence, 2,6-DPyA-b is comparable to or even better than 2,6-DPA in terms of intrinsic μh, and could have great application potential in the charge transfer properties.
 | ||
| Fig. 9 The anisotropic μh under static state (300 K) and thermal fluctuations (300 K, 200 K and 100 K) conditions in the {100} plane for 2,6-DPyA-a, 2,6-DPyA-c and 2,6-DPA, and in the {001} plane for 2,6-DPyA-b. | ||
3.6 Crystal morphology
As discussed above, in addition to the traditional study of intrinsic charge transfer properties of the materials, another important factor for determining the charge transport property of the OFET material is the crystal morphology.64 The carrier mobility should be decreased due to the grain boundaries. Here, we explore whether the poor morphology is responsible for the low mobility measured in the experiment. In the past few years, there have been many kinds of morphology prediction models for the material, such as the Bravais–Friedel–Donnay–Harker (BFDH) rules, attachment energy (AE) model, Monto Carlo simulation and others. The AE model is extensively used in the area of organic materials on account of its simple calculation procedures and relatively reliable accuracy.65 Here, in order to exclude other intermolecular interactions caused by solvent molecules, the solvent effect is not considered. Only the growth morphology in the gas phase was predicted based on the AE theory by using Materials Studio 8.0. The geometry optimization is the first step to be performed by the COMPASS force field. The crystal morphology of three 2,6-DPyA and 2,6-DPA molecules were then predicted basing on the crystal graph, which describes the interaction energy between the center of mass of one molecule with all other molecules in the range of one unit cell.66 The morphology prediction results are shown in Fig. 10. The parameters of the main crystal growth facets of the 2,6-DPyA series and 2,6-DPA are displayed in Fig. S10–S13 and Table S7 (ESI†) in detail. | ||
| Fig. 10 The predicted morphology by using the AE model for 2,6-DPyA-a (a), 2,6-DPyA-b (b), 2,6-DPyA-c (c), and 2,6-DPA (d). The MI facets are labeled together with their Miller indices. | ||
Intuitively, the computational study of the morphology of 2,6-DPA presents a regular hexagonal pattern, bounded by {100}, {110}, {011} and their symmetry facets (Fig. 10(d)), which all grow along the intermolecular C–H⋯π interactions. The attachment energies of these growth facets are −9.027, −39.595 and −52.974 kcal mol−1, and the percentage of total facet area of each part is 71.516%, 11.717%, and 16.767%, respectively. The contribution of each growth facets to the overall morphology is obvious, and it is easier to obtain the complete and flat crystal morphology under ideal conditions. The {100} facet has the largest interplanar distance (d100 = 17.972 Å), which indicates that it is the most morphologically important facet of the 2,6-DPA crystal. This value is coincident with the measured layer-to-layer experimental distances (18.0 Å in the films).39 These calculated data, which almost perfectly agree with the experimental study, prove the validity of the AE model.
For the 2,6-DPyA series, as shown in Fig. 10(a)–(c), the biggest crystal planes for 2,6-DPyA-a, -b, and -c are {100}, {002}/{00−2}, and {100}, respectively, which is consistent with experimental observation.41 Compared to 2,6-DPA, due to the introduction of N-atoms, the intermolecular interaction energies become diverse. As a result, more crystal growth facets appear in the 2,6-DPyA series. The total number of main crystal facets forming the growth morphology for 2,6-DPA and 2,6-DPyA-a, -b, and -c is 10, 16, 18 and 44, respectively, and their total attachment energies are very different. Comparing the morphology and attachment energy of the three molecular crystals in the 2,6-DPyA series, we found that the growth rate of the different facets should be influenced by the position and amount of N-atoms. The dimer in the crystal planes with strong attachment energy is established by the C–H⋯N interactions or H-bond with adjacent molecules. It can be found that the more N-atoms exposed outside of the plane, the higher the attachment energy will be obtained, such as {010}, {110}, {111}, {11−1} and the {200} crystal facets of 2,6-DPyA-b (Fig. S12, ESI†). Their attachment energies are −98.605, −104.474, −104.630, −104.630, and −121.305 kcal mol−1, respectively. The values are relatively high among the four molecules studied, which is consistent with the fact that this molecule has the strongest H-bonds in these facets. This also means that the crystal growth anisotropy of 2,6-DPyA-b is relatively strong. It is well known that a fast growth rate can lead to a decrease of the morphological importance of the crystal facets. Thus, in the crystal growth of 2,6-DPyA-b in the interlayer space, these facets ({010}, {110}, {111}, {11−1} and {200}) will gradually disappear, and then result in small crystalline grains. By contrast, the attachment energies for the growth facets of 2,6-DPyA-a are not as low as 2,6-DPyA-b, and the number of growth facets is smaller. This condition means that 2,6-DPyA-a could have larger crystalline grains than 2,6-DPyA-b. With regard to 2,6-DPyA-c, it is worth noting two points: one is that except for these low-index facets ({100}, {110}, {011}, {11−1} and {20−2}), some high-index facets also contribute to the growth morphology (shown in Table S7, ESI†). The percentage of the total growth face areas occupied by all symmetry images of these higher facets is 4.455%. The other point is that although the growth rate of these higher order growth facets is fast and identical, the interplanar distance (dhkl) is quite different. These uneven growth facets could hinder further crystal growth. Moreover, we found that the most important crystal growth facet {100} has the smallest attachment energy among the four crystals because the electrostatic term of the attachment energy is positive due to the electrostatic repulsion of the N-atoms between two growth facets. The above two points do not promote the crystal growth into uniform crystalline grains with fine connectivity. Here, we present a perspective for the position of the N-atom. When the position of the N-atoms gradually moved from the inside to the outside of the phenyl group, the molecular interaction between the N-atoms and other molecules gradually increased. This led to the gradually enhanced anisotropy of the crystal growth morphology, which is not conducive to the formation of large crystalline grains and flat morphology.
4. Conclusions
To summarize, we theoretically investigated the charge transport properties of 2,6-DPA and three isomers of 2,6-DPyA from microscopic and mesoscopic perspectives, so as to clarify the experimental phenomena and further understand the structural-property relationship. Firstly, we proved the band-like transport behavior of 2,6-DPA at 200–300 K based on the full quantum nuclear tunneling model. The hole mobility of 2,6-DPA that we calculated was in the range of 3.54–4.71 cm2 V−1 s−1 and 8.11–11.03 cm2 V−1 s−1 at 300 K and 200 K, respectively, which is quite consistent with the experimental results. Secondly, by using quantum-chemical method combined with MD simulations, three isomers of 2,6-DPyA single crystals were investigated from the following aspects: electronic structures, the ability of hole injection, redox stability, hole reorganization energies, normal modes analysis and transfer integrals, intermolecular interaction, thermal fluctuation, and anisotropic hole mobilities, so as to further understand the structural-property relationship. The calculation results show that the introduction of N-atoms on the terminal benzene can decrease the hole reorganization energy, and the existence of C–N⋯H bonds can suppress the nonlocal electron phonon coupling effect, which facilitate the charge transport. In particular, 2,6-DPyA-b is superior to 2,6-DPA in these basic indexes of the charge transport property that were mentioned above. 2,6-DPyA-b exhibits weaker phonon scattering and larger μh than 2,6-DPA because of the existence of the strongly intermolecular C–H⋯N interactions (H-bonds). The range of anisotropic μh at 300 K is 8.93–9.24 cm2 V−1 s−1 after considering the thermal fluctuation. Thirdly, in view of the low mobility observed in experiment, the crystal growth morphology prediction analysis is adopted from a mesoscopic perspective, and the results provide evidence that the poor connectivity is the main reason for the low mobility of 2,6-DPyA-b. Moreover, according to the comparative results of 2,6-DPyAs, we found that as the position of the N-atom moves from the inside to the outside of the molecule (from -ortho to -para), more N-atoms made contact with other molecules. Furthermore, the intermolecular interactions became more complex, and the anisotropy of the crystal morphology growth was enhanced, which is adverse to the formation of regular grains. Here, we propose a novel perspective to interpret that paradox of the intermolecular interactions in OSCs, like H-bonds. On the one hand, it can inhibit the thermal fluctuation and enhance the stability of the charge transport process. On the other hand, it can lead to one-dimensional rapid growth along the strong H-bond direction, which is not conducive to the formation of a large and flat morphology. Therefore, the regulation of the charge transport properties by H-bonds needs to be considered more comprehensively, not only with regards to the microscopic properties of the molecules, but also the mesoscopic morphology of the crystal growth.Author contributions
Guiya Qin, Prof, Jingfu Guo and Prof. Aimin Ren conceived and supervised the research. Guiya Qin wrote the paper. Panpan Lin, Prof. Jingfu Guo and Prof. Aimin Ren revised the paper. All authors contributed to the discussions. In addition, we are very grateful to Prof. Jingfu Guo for providing software technical support.Conflicts of interest
The authors declare no competing financial interest.Acknowledgements
This work was supported by the 2020-JCJQ Project (GFJQ2126-007) and the Natural Science Foundation of China (No. 22073035, 21473071, 21173099, 20973078, 20673045 and 51673164), the Natural Science Foundation of Science and Technology Department of Jilin Province, China (No. 20190201228JC).Notes and references
- L.-C. Hsu, T. Isono, Y.-C. Lin, S. Kobayashi, Y.-C. Chiang, D.-H. Jiang, C.-C. Hung, E. Ercan, W.-C. Yang, H.-C. Hsieh, K. Tajima, T. Satoh and W.-C. Chen, ACS Appl. Mater. Interfaces, 2021, 13, 2932–2943 CrossRef CAS PubMed.
- X. Ma, Z. Jiang, L. Xiang and F. Zhang, ACS Mater. Lett., 2022, 4, 918–937 CrossRef CAS.
- G. Lv, H. Wang, Y. Tong, L. Dong, X. Zhao, P. Zhao, Q. Tang and Y. Liu, Adv. Mater. Interfaces, 2020, 7, 2000306 CrossRef CAS.
- A. Li, L. Yan, M. Liu, I. Murtaza, C. He, D. Zhang, Y. He and H. Meng, J. Mater. Chem. C, 2017, 5, 5304–5309 RSC.
- H. Ling, S. Liu, Z. Zheng and F. Yan, Small Methods, 2018, 2, 1800070 CrossRef.
- Y. Dong, Y. Guo, H. Zhang, Y. Shi, J. Zhang, H. Li, J. Liu, X. Lu, Y. Yi, T. Li, W. Hu and L. Jiang, Front. Chem., 2019, 7, 11 CrossRef CAS PubMed.
- B. C.-K. Tee, A. Chortos, A. Berndt, A. K. Nguyen, A. Tom, A. McGuire, Z. C. Lin, K. Tien, W.-G. Bae and H. Wang, Science, 2015, 350, 313–316 CrossRef CAS PubMed.
- X. Huang, D. Ji, H. Fuchs, W. Hu and T. Li, ChemPhotoChem, 2020, 4, 9–38 CrossRef CAS.
- Z. Zhao, K. Liu, Y. Liu, Y. Guo and Y. Liu, Natl. Sci. Rev., 2022, 9, 6 Search PubMed.
- X. Yin, J. Yang and H. Wang, Adv. Funct. Mater., 2022, 32, 2202071 CrossRef CAS.
- C. Wang, X. Zhang, H. Dong, X. Chen and W. Hu, Adv. Energy Mater., 2020, 10, 2000955 CrossRef CAS.
- C. Zhang, Y. Zang, F. Zhang, Y. Diao, C. R. McNeill, C.-A. Di, X. Zhu and D. Zhu, Adv. Mater., 2016, 28, 8456–8462 CrossRef CAS PubMed.
- X. Dong, H. Zhang, Y.-X. Li, B. Liu, K. Pan, Y. Nie, M. Yu, M. Eginligil, J. Liu and W. Huang, Nano Res., 2022, 15, 9554–9572 CrossRef.
- T. Oyama, T. Mori, T. Hashimoto, M. Kamiya, T. Ichikawa, H. Komiyama, Y. S. Yang and T. Yasuda, Adv. Electron. Mater., 2018, 4, 1700390 CrossRef.
- R. Wawrzinek, J. Sobus, M. U. Chaudhry, V. Ahmad, A. Grosjean, J. K. Clegg, E. B. Namdas and S.-C. Lo, ACS Appl. Mater. Interfaces, 2019, 11, 3271–3279 CrossRef CAS PubMed.
- S. Wang, S. Zhou, Y. Tong, Z. Song, H. Wang, Q. Tang, X. Zhao and Y. Liu, Adv. Mater. Interfaces, 2019, 6, 1801984 CrossRef.
- C. Y. Han, W. M. Tang and P. T. Lai, IEEE Trans. Electron Devices, 2017, 64, 1716–1722 CAS.
- A. N. Aleshin, J. Y. Lee, S. W. Chu, J. S. Kim and Y. W. Park, Appl. Phys. Lett., 2004, 84, 5383–5385 CrossRef CAS.
- R. G. Kepler, Phys. Rev., 1960, 119, 1226–1229 CrossRef CAS.
- H. Bronstein, C. B. Nielsen, B. C. Schroeder and I. McCulloch, Nat. Rev. Chem., 2020, 4, 66–77 CrossRef CAS.
- H. Minemawari, M. Tanaka, S. Tsuzuki, S. Inoue, T. Yamada, R. Kumai, Y. Shimoi and T. Hasegawa, Chem. Mater., 2017, 29, 1245–1254 CrossRef CAS.
- K.-H. Kim, H. Yu, H. Kang, D. J. Kang, C.-H. Cho, H.-H. Cho, J. H. Oh and B. J. Kim, J. Mater. Chem. A, 2013, 1, 14538–14547 RSC.
- Y. Yu, N. Xue, C. Xiao, M. K. Ravva, Y. Guo, L. Wu, L. Zhang, Z. Li, W. Yue and Z. Wang, J. Mater. Chem. C, 2019, 7, 12263–12269 RSC.
- X.-K. Chen, L.-Y. Zou, J.-X. Fan, S.-F. Zhang and A.-M. Ren, Org. Electron., 2012, 13, 2832–2842 CrossRef CAS.
- M. L. Tang, A. D. Reichardt, T. Siegrist, S. C. Mannsfeld and Z. Bao, Chem. Mater., 2008, 20, 4669–4676 CrossRef CAS.
- M. Watanabe, W. T. Su, Y. J. Chang, T. H. Chao, Y. S. Wen and T. J. Chow, Chem. – Asian J., 2013, 8, 60–64 CrossRef CAS PubMed.
- Y. Ren, X. Yang, L. Zhou, J.-Y. Mao, S.-T. Han and Y. Zhou, Adv. Funct. Mater., 2019, 29, 1902105 CrossRef.
- G.-Y. Qin, L.-F. Ji, J.-X. Fan, N.-X. Zhang, P.-P. Lin, S.-F. Zhang, L.-Y. Zou and A.-M. Ren, J. Phys. Chem. A, 2019, 123, 3300–3314 CrossRef CAS PubMed.
- M. Chen, L. Yan, Y. Zhao, I. Murtaza, H. Meng and W. Huang, J. Mater. Chem. C, 2018, 6, 7416–7444 RSC.
- Y. Wang, D. Fang, T. Fu, M. U. Ali, Y. Shi, Y. He, Z. Hu, C. Yan, Z. Mei and H. Meng, Mater. Chem. Front., 2020, 4, 3546–3555 RSC.
- F. Qiu, Y. Dong, J. Liu, Y. Sun, H. Geng, H. Zhang, D. Zhu, X. Shi, J. Liu and J. Zhang, J. Mater. Chem. C, 2020, 8, 6006–6012 RSC.
- J. Li, D. Ji, Y. Hu, M. Chen, J. Liu, Z. Qin, Y. Sun, Y. Dang, Y. Zhen and H. Dong, J. Mater. Chem. C, 2020, 8, 15597–15602 RSC.
- S. Ando, J.-i Nishida, E. Fujiwara, H. Tada, Y. Inoue, S. Tokito and Y. Yamashita, Chem. Mater., 2005, 17, 1261–1264 CrossRef CAS.
- J. Y. Back, T. K. An, Y. R. Cheon, H. Cha, J. Jang, Y. Kim, Y. Baek, D. S. Chung, S.-K. Kwon and C. E. Park, ACS Appl. Mater. Interfaces, 2015, 7, 351–358 CrossRef CAS PubMed.
- D. Zhang, S. Yokomori, R. Kameyama, C. Zhao, A. Ueda, L. Zhang, R. Kumai, Y. Murakami, H. Meng and H. Mori, ACS Appl. Mater. Interfaces, 2020, 13, 989–998 CrossRef PubMed.
- J. Li, K. Zhou, J. Liu, Y. Zhen, L. Liu, J. Zhang, H. Dong, X. Zhang, L. Jiang and W. Hu, J. Am. Chem. Soc., 2017, 139, 17261–17264 CrossRef CAS PubMed.
- A. Li, L. Yan, C. He, Y. Zhu, D. Zhang, I. Murtaza, H. Meng and O. Goto, J. Mater. Chem. C, 2017, 5, 370–375 RSC.
- J. Liu, H. Zhang, H. Dong, L. Meng, L. Jiang, L. Jiang, Y. Wang, J. Yu, Y. Sun, W. Hu and A. J. Heeger, Nat. Commun., 2015, 6, 10032 CrossRef CAS PubMed.
- J. Liu, H. Dong, Z. Wang, D. Ji, C. Cheng, H. Geng, H. Zhang, Y. Zhen, L. Jiang and H. Fu, Chem. Commun., 2015, 51, 11777–11779 RSC.
- D. Ji, T. Li, J. Liu, S. Amirjalayer, M. Zhong, Z.-Y. Zhang, X. Huang, Z. Wei, H. Dong and W. Hu, Nat. Commun., 2019, 10, 1–8 CrossRef PubMed.
- J. Liu, W. Zhu, K. Zhou, Z. Wang, Y. Zou, Q. Meng, J. Li, Y. Zhen and W. Hu, J. Mater. Chem. C, 2016, 4, 3621–3627 RSC.
- Y. Zhu, X. Zeng, T. Fu, Y. Cao and H. Meng, Phys. Chem. Chem. Phys., 2019, 21, 4641–4649 RSC.
- G. Bolla, Q. Liao, S. Amirjalayer, Z. Tu, S. Lv, J. Liu, S. Zhang, Y. Zhen, Y. Yi and X. Liu, Angew. Chem., Int. Ed., 2021, 60, 281–289 CrossRef CAS PubMed.
- G. Nan, X. Yang, L. Wang, Z. Shuai and Y. Zhao, Phys. Rev. B: Condens. Matter Mater. Phys., 2009, 79, 115203 CrossRef.
- V. Coropceanu, J. Cornil, D. A. da Silva Filho, Y. Olivier, R. Silbey and J.-L. Brédas, Chem. Rev., 2007, 107, 926–952 CrossRef CAS PubMed.
- Y. Jiang, X. Zhong, W. Shi, Q. Peng, H. Geng, Y. Zhao and Z. Shuai, Nanoscale Horiz., 2016, 1, 53–59 RSC.
- Y. A. Berlin, G. R. Hutchison, P. Rempala, M. A. Ratner and J. Michl, J. Phys. Chem. A, 2003, 107, 3970–3980 CrossRef CAS.
- G. Nan and Z. Li, J. Mater. Chem. C, 2014, 2, 1447–1456 RSC.
- N. Zhang, A. Ren, L. Ji, S. Zhang and J. Guo, J. Phys. Chem. C, 2018, 122, 18880–18894 CrossRef CAS.
- L. B. Schein and A. R. McGhie, Phys. Rev. B: Condens. Matter Mater. Phys., 1979, 20, 1631–1639 CrossRef CAS.
- Z. Shuai, H. Geng, W. Xu, Y. Liao and J.-M. André, Chem. Soc. Rev., 2014, 43, 2662–2679 RSC.
- J. Fan, L. Lin and C. K. Wang, Phys. Chem. Chem. Phys., 2017, 19, 30147–30156 RSC.
- J. E. Norton and J.-L. Brédas, J. Am. Chem. Soc., 2008, 130, 12377–12384 CrossRef CAS PubMed.
- Q. Wu, T. Zhang, Q. Peng, D. Wang and Z. Shuai, Phys. Chem. Chem. Phys., 2014, 16, 5545–5552 RSC.
- M. J. Frisch, G. W. Trucks, H. B. Schlegel, G. E. Scuseria, M. A. Robb, J. R. Cheeseman, G. Scalmani, V. Barone, B. Mennucci and G. A. Petersson, Gaussian 09, Revision D.01, Gaussian, Inc., Wallingford CT, 2009, p. 201 Search PubMed.
- J. J. McKinnon, D. Jayatilaka and M. A. Spackman, Chem. Commun., 2007, 3814–3816 RSC.
- M. A. Spackman and D. Jayatilaka, CrystEngComm, 2009, 11, 19–32 RSC.
- J. J. McKinnon, M. A. Spackman and A. S. Mitchell, Acta Crystallogr., Sect. B: Struct. Sci., 2004, 60, 627–668 CrossRef PubMed.
- T. M. Parker, L. A. Burns, R. M. Parrish, A. G. Ryno and C. D. Sherrill, J. Chem. Phys., 2014, 140, 094106 CrossRef PubMed.
- W. Wang, Y. Zhang and Y.-B. Wang, J. Chem. Phys., 2014, 140, 094302 CrossRef PubMed.
- T. Lu and F. Chen, Multiwfn: A Multifunctional Wavefunction Analyzer, 2012 Search PubMed.
- G. te Velde, F. M. Bickelhaupt, E. J. Baerends, C. Fonseca Guerra, S. J. A. van Gisbergen, J. G. Snijders and T. Ziegler, J. Comput. Chem., 2001, 22, 931–967 CrossRef CAS.
- S.-H. Wen, A. Li, J. Song, W.-Q. Deng, K.-L. Han and W. A. Goddard III, J. Phys. Chem. B, 2009, 113, 8813–8819 CrossRef CAS PubMed.
- F. R. Massaro, M. Moret, M. Bruno and D. Aquilano, Cryst. Growth Des., 2012, 12, 982–989 CrossRef CAS.
- Y. Liu, S. Niu, W. Lai, T. Yu, Y. Ma, H. Gao, F. Zhao and Z. Ge, CrystEngComm, 2019, 21, 4910–4917 RSC.
- G. K. Veits, K. K. Carter, S. J. Cox and A. J. McNeil, J. Am. Chem. Soc., 2016, 138, 12228–12233 CrossRef CAS PubMed.
Footnote |
| † Electronic supplementary information (ESI) available: Calculated data; charge-transfer rate; topological properties at the intermolecular N⋯H bond critical points; the parameters of morphological prediction. See DOI: https://doi.org/10.1039/d2cp03926e |
| This journal is © the Owner Societies 2023 |