A new computational tool for interpreting the infrared spectra of molecular complexes†
Received
3rd August 2022
, Accepted 17th March 2023
First published on 28th March 2023
Abstract
The popularity of infrared (IR) spectroscopy is due to its high interpretive power. This study presents a new computational tool for analyzing the IR spectra of molecular complexes in terms of intermolecular interaction energy components. In particular, the proposed scheme enables associating the changes in the IR spectra occurring upon complex formation with individual types of intermolecular interactions (electrostatic, exchange, induction, and dispersion), thus providing a completely new insight into the relations between the spectral features and the nature of interactions in molecular complexes. To demonstrate its interpretive power, we analyze, for selected vibrational modes, which interaction types rule the IR intensity changes upon the formation of two different types of complexes, namely π⋯π stacked (benzene⋯1,3,5-trifluorobenzene) and hydrogen-bonded (HCN⋯HNC) systems. The exemplary applications of the new scheme to these two molecular complexes revealed that the interplay of interaction energy components governing their stability might be very different from that behind the IR intensity changes. For example, in the case of the dispersion-bound π⋯π-type complex, dispersion contributions to the interaction induced IR intensity of the selected modes are notably smaller than their first-order (electrostatic and exchange) counterparts.
1. Introduction
Intermolecular interactions are central to many areas of chemistry. Over the past several decades significant research effort has been made to understand the fundamental aspects of the interactions in molecular complexes and their manifestation, thus leading to stunning applications affecting practically all domains of everyday life including new opportunities in biomedical engineering, crystal engineering,1 and transmembrane anion transport.2 Spectroscopic techniques were frequently used to substantiate the formation and quantify the magnitude of intermolecular forces, with infrared (IR) spectroscopy at the forefront. One of the many examples is hydrogen-bonding interactions studied using IR spectroscopy as they are manifested by significant frequency shifts of the order of magnitude of hundreds of cm−1 and IR intensity changes of bands associated with the vibrational modes of functional groups involved in the hydrogen-bonding interactions.3,4 The experimental efforts have been supported by theoretical developments within the quantum mechanics framework, and nowadays the theory of intermolecular interactions forms an important part of modern interpretive chemistry. Despite some variations among available intermolecular interaction energy decomposition schemes, the fundamental interaction types include electrostatics, Pauli exchange, induction and dispersion. These interaction types, and their various cross-terms, can be rigorously calculated using e.g. Symmetry-Adapted Perturbation Theory (SAPT).5 There are also alternative strategies to decompose intermolecular interaction energies, often referred to as Energy Decomposition Analysis (EDA) approaches.6–13 Some of them introduce electrostatic, Pauli, and orbital interaction terms, as in Ziegler–Rauk EDA (ZR-EDA),7 or the mixture of both, that is, electrostatic, polarization, charge transfer, Pauli, and dispersion terms, as in the Absolutely Localized Molecular Orbital EDA (ALMO-EDA) methods.14 The results of intermolecular interaction energy decompositions are available for myriads of atomic and molecular complexes, thus enriching our understanding of how the basic interaction types govern the structure and stability of molecular complexes and their organization at the larger scale.15,16 The spectroscopic measurements are often supported by the results of energy decomposition analyses, linking indirectly the spectroscopic signatures with interaction types. However, as we have learned from pioneering works of Fowler and Sadlej,17 Bishop and Dupuis18 and Heijmen, Moszyński et al.,19 and their successors,20–22 the pattern of interaction types may be very different for interaction energies (related to stability) and electric properties (relevant for intensities of spectral signatures). The latter quantities can be analyzed conveniently using the concept of excess (interaction-induced) properties (ΔP),17,19–55i.e., for a complex AB composed of subsystems A and B:| | | ΔP = P(AB) − P(A) − P(B) | (1) |
As highlighted above, the values of ΔP can be further analyzed in terms of fundamental interaction types ΔPi.
The vast majority of works use eqn (1) to analyze the effect of intermolecular interactions on the pure electronic contribution to electric properties, ΔPel,i. In recent papers the authors introduced a new scheme for the decomposition of the excess vibrational nuclear relaxation contribution to electric properties.56–58 The aim of the current work is to demonstrate how the recently developed decomposition scheme can be extended to gain an insight into the changes in the IR spectra upon complex formation in terms of interaction types, i.e.
| | | ΔIia = Iia(AB) − Iia(A) − Iia(B) | (2) |
where, as previously,
i denotes an interaction energy component and
a stands for a normal mode of vibration. First, we will present a concise theoretical framework for the analysis of the excess IR intensities together with a decomposition scheme used to obtain individual interaction energy contributions. Then, the analysis of IR intensity changes for a few selected vibrational modes in benzene⋯1,3,5-trifluorobenzene (B⋯T) and HCN⋯HNC complexes will be performed as a proof of concept.
2 Theory
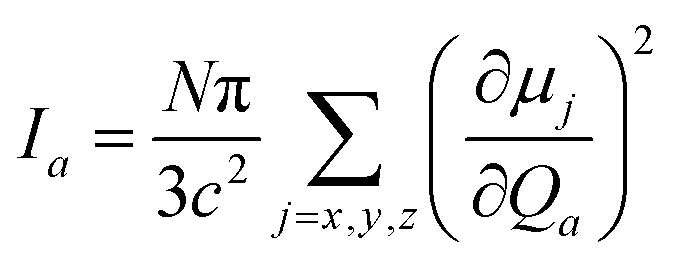
The excess property decomposition scheme56–58 relies on the electronic (ΔPel) and nuclear-relaxation (ΔPnr) contributions. The latter one usually provides the major vibrational contribution to the total response property change.59 There is a link between the a-th mode contribution to the average nuclear-relaxation polarizability:60–62| |  | (3) |
and the harmonic IR intensity for the a-th vibrational mode:| |  | (4) |
as both rely on the square of the first derivative of the dipole moment (μ) with respect to the normal mode Qa. ωa is the harmonic vibrational frequency of mode a, N is Avogadro's number, and c is the speed of light. Combining both equations leads to| | 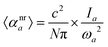 | (5) |
The above relation can be used for interaction-induced counterparts:| |  | (6) |
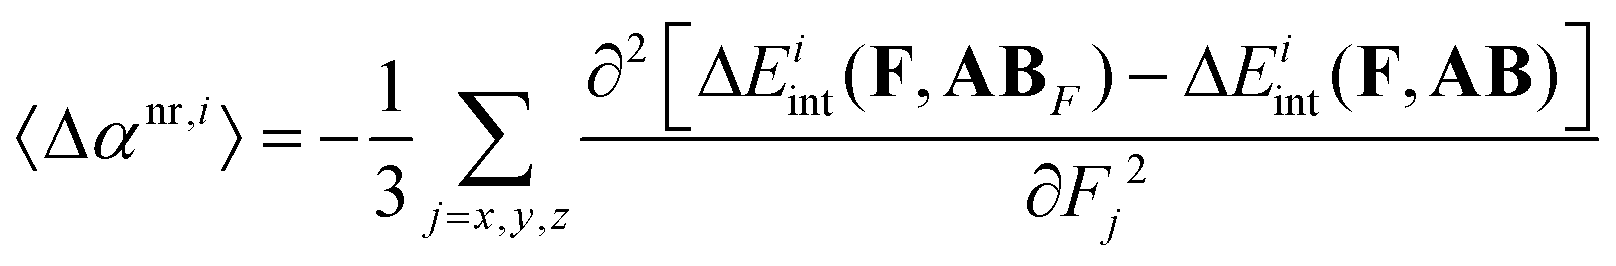
In our previous work58 we have demonstrated that the interaction-induced average nuclear-relaxation polarizability can be decomposed into interaction types i by employing the finite-field nuclear-relaxation (FF-NR) method:63| |  | (7) |
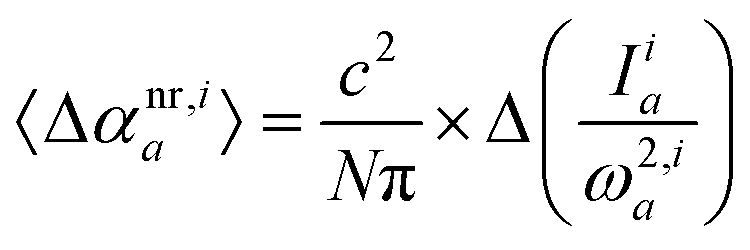
where ABF is the relaxed geometry of the complex AB in the presence of an electric field, Fj, whereas AB stands for the field-free equilibrium geometry of the complex. The field-dependent geometry optimizations required to determine ABF should be performed strictly maintaining the Eckart conditions.64,65 To obtain only the contribution of mode a to 〈Δαnr,i〉 (i.e. 〈Δαnr,ia〉) the field-dependent geometry optimizations should be performed in the subspace defined by a single vibrational mode, a. Then, the relation between 〈Δαnr,ia〉 and the shifts in the intensity and frequency of the mode a is given by| |  | (8) |
This equation allows interpreting a simultaneous change in the IR intensity and the vibrational frequency upon the formation of a complex in terms of the interaction types, i:| | 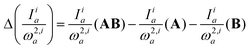 | (9) |
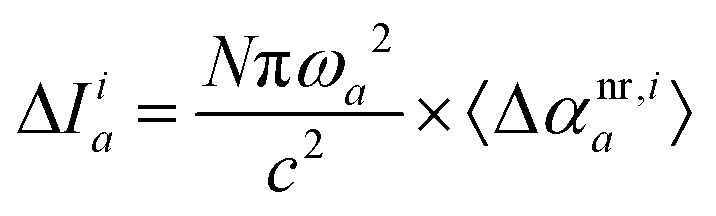
Eqn (9) can be used directly to decompose changes in the ratio of intensity and frequency squared for each mode upon complex formation, thus providing information regarding the interplay of interaction types and their manifestation through changes in band position and intensity. One can also consider two limiting cases of eqn (8): (a) constant transition intensity, or (b) constant transition frequency. The former is not of practical use as the relation Δω2,ia ∼ 1/〈Δαnr,ia〉 does not allow for direct decomposition of frequency changes. However, if the frequency change for a target vibrational mode upon complex formation is negligible, then the above relation allows for the direct decomposition of the IR intensity change of the mode a:| |  | (10) |
and the total excess IR intensity is the sum of interaction types:| |  | (11) |
In this work we will show how to benefit from the constant-frequency condition (limiting case (b)) which holds as a good approximation, for all studied cases in this work. It should be noted that nuclear relaxation polarizability does not account for any anharmonic corrections; and likewise, the IR intensities are evaluated adopting the harmonic approximation.
3. Computational details
Eqn (7)–(10) can be combined with any energy decomposition analysis (SAPT, ZR-EDA, ALMO-EDA, etc.), provided that field-dependent interaction energy terms can be determined. In the present work we employ the decomposition of MP2 interaction energy based on the variational–perturbational decomposition scheme (VP-EDS),66–69 in which the interpretation of the individual interactions is based on intermolecular perturbation theory.70 In VP-EDS, the total interaction energy obtained in a supermolecular approach is partitioned into several interaction energy terms as defined in the symmetry-adapted perturbation theory (SAPT).66–69 At the second-order Møller–Plesset perturbation theory level (MP2), the total VP-EDS interaction energy of the complex calculated by a supermolecular approach in the dimer-centered-basis set (DCBS)71 is partitioned into the Hartree–Fock (HF) and the electron correlation interaction energy components:| | | ΔEMP2int = ΔEHFint + ΔEMP2corr | (12) |
The HF term can be further partitioned into the electrostatic interactions of the charge densities of the unperturbed subsystems, ε(10)el, the exchange repulsion (ΔEHLex) and the charge delocalization (ΔEHFdel), which account for the exchange effects due to the Pauli antisymmetry principle and induction, respectively.| | | ΔEHFint = ε(10)el + ΔEHLex + ΔEHFdel | (13) |
The second-order electron correlation term, ΔEMP2corr:
| | | ΔEMP2corr = ε(12)el,r + ε(20)disp + ΔE(2)ex | (14) |
includes the second-order dispersion interaction,
ε(20)disp, as well as the electron correlation correction to the first-order electrostatic interaction,
ε(12)el,r, and the remaining second-order electron correlation effects (Δ
E(2)ex). The latter term accounts mainly for the uncorrelated exchange–dispersion and electron correlation corrections to the Hartree–Fock exchange repulsion.
68,70 The terms
ε(10)el and
ε(20)disp are obtained using standard polarization perturbation theory, whereas the term
ε(12)el,r is calculated using the formula proposed by Moszyński
et al.72 The numbers
n,
m in the superscript of terms such as
ε(nm)el refer to orders of perturbation in the intermolecular interaction operator (
n) and intramonomer correlation operator (
m), respectively.
Field-free equilibrium geometries of the two studied complexes were obtained by optimizations applying tight convergence criteria (10−11 Hartree and 10−9 Hartree Bohr−1 for energy and gradients, respectively) and employing the MP2 method in combination with the aug-cc-pVDZ (benzene⋯1,3,5-trifluorobenzene) and aug-cc-pVTZ (HCN⋯HNC) basis set.73–75 The vibrational analysis was performed at the same level of theory to confirm that the optimized structures are minima. All field-free computations were performed using the Gaussian program.76 Field-dependent geometry optimizations and property calculations were carried out using custom computer programs based on total energies obtained using the Gaussian program, enforcing again tight convergence thresholds. VP-EDS calculations of field-free and field-dependent interaction energy components were performed using a modified in-house version of the Gamess (US) program.77,78
4. Results and discussion
In order to demonstrate the interpretive power of the above described scheme we selected a benzene⋯1,3,5-trifluorobenzene (B⋯T) complex in stacked alignment and a hydrogen-bonded HCN⋯HNC complex. There are several reasons behind the selection of these complexes: (a) π⋯π stacking and hydrogen-bonding interactions play a key role in the formation of organic complexes (both types of intermolecular interactions govern the stability of nucleic acids), (b) the prototypical stacked and hydrogen-bonded complexes can be reliably treated at the MP2 level of theory, (c) they are asymmetric, with one moiety acting as electron donor and the other as electron acceptor, and thus not only dispersion, but also other interaction types can be important, and (d) each complex is composed of two different subsystems, thus safeguarding an interesting vibrational structure, i.e. different types of normal modes are localized on interacting molecules.
We will start with the analysis of stacked B⋯T complex. One normal mode of vibration localized on benzene (ν24) and two (degenerate) localized on 1,3,5-trifluorobenzene (ν56, ν57) were selected. The simulated spectra and atomic displacements for the corresponding monomeric and dimeric vibrational normal modes are shown in Fig. 1. The dominant band of benzene corresponds to the C–H out-of-plane in-phase vibration (a2u, top panel), while the most intense bands of 1,3,5-trifluorobenzene are given by two degenerate vibrations (1660.66 cm−1) corresponding to symmetric and asymmetric C–C stretching (middle panel). The bottom panel shows the spectra of the benzene⋯1,3,5-trifluorobenzene complex in stacked alignment (the equilibrium geometry is presented in the inset). All spectra were simulated assuming Lorentzian band broadening and half width at half maximum equal to 10 cm−1. There are two reasons behind the selection of these modes. First, these modes contribute to the largest-intensity peaks in the IR spectra of monomers, i.e., ν6 (benzene), ν26 and ν27 (1,3,5-trifluorobenzene). Second, they exhibit significant IR intensity changes upon complex formation. As shown in Table 1, the intensity of the mode ν24 of B⋯T complex, attributed to the in-phase out-of-plane bending of hydrogen atoms on benzene increases in comparison with the corresponding mode of isolated benzene, while the two other modes, corresponding to symmetric and asymmetric C–C stretching vibrations localized on 1,3,5-trifluorobenzene, respectively, exhibit a significant intensity drop upon B⋯T complex formation. Note that for all three selected normal modes the vibrational frequency shift on passing from the isolated subsystems to the B⋯T complex is very small (not exceeding 3 cm−1). Hence, one can safely employ eqn (10) to decompose the IR intensity changes (ΔI) induced by complex formation into individual interaction types (Table 2). The reported intermolecular interaction energy terms (ΔEint) indicate, as expected, that the major stabilizing factor is the dispersion energy. However, it should be pointed out that the MP2 method tends to overestimate this term, see e.g. ref. 79). Interestingly, the magnitudes of ΔI(20)disp are notably smaller compared to the first-order terms, especially for the modes ν56 and ν57, localized on 1,3,5-trifluorobenzene. Even in the case of mode ν24 localized on benzene, for which the delocalization plays only a minor role, the absolute value of ΔI(20)disp is roughly three times smaller than the first-order electrostatic contribution (ΔI(10)el). By and large, except for mode ν24, the sum of first-order terms contributing to the interaction-induced IR intensity (ΔI(10)el + ΔIHLex), as well as ΔIHFint, prevail over the dispersion contribution (ΔI(20)disp). This is in contrast with the interplay of components observed for the interaction energy. Consequently, for the two modes localized on 1,3,5-trifluorobenzene the intensity changes can be reliably predicted at the HF level, as higher-order interaction terms are small and cancel each other out. In the case of these two modes the qualitative pattern is similar, i.e. electrostatic and exchange interactions quench the IR intensity, while the delocalization term (encompassing induction contributions) has the opposite effect. On the other hand, the increase in the intensity of the mode ν24 upon the formation of the complex is mainly due to the interplay of large opposite-sign first-order components (positive electrostatic and negative exchange) and smaller dispersion contribution.
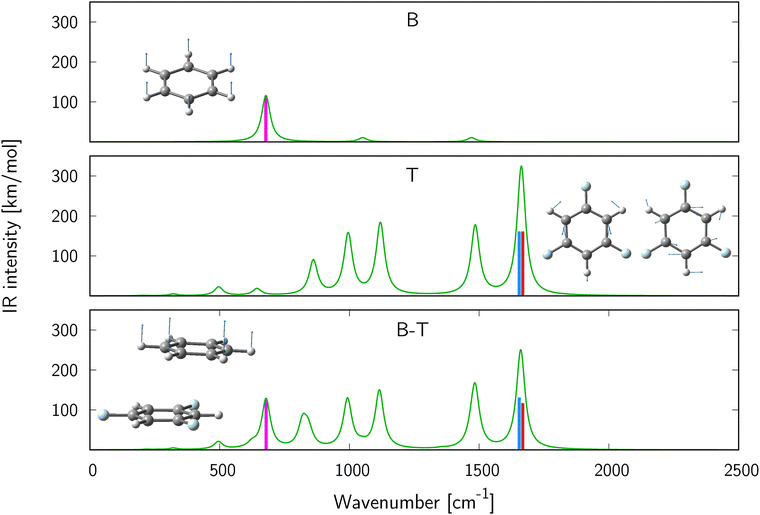 |
| | Fig. 1 Simulated IR spectra of benzene (top), 1,3,5-trifluorobenzene (middle) and their complex (bottom). Insets show atomic displacements corresponding to vibrational normal mode ν6 of benzene (top), ν26 and ν27 (middle) mode of 1,3,5-trifluorobenzene, and ν24 (bottom) of the complex. Bands corresponding to C–H stretching (>3000 cm−1) are not shown. | |
Table 1 Selected normal modes and their spectroscopic data. The values corresponding to complexes are shown in parentheses
|
|
Mode |
ω (cm−1) |
I (km mol−1) |
ΔI (km mol−1) |
| Benzene (B)⋯1,3,5-trifluorobenzene (T) |
| B |
ν
6 (ν24) |
678.34 (678.85) |
115.91 (124.63) |
8.72 |
| T |
ν
26 (ν56) |
1662.66 (1660.25) |
160.95 (130.95) |
−30.00 |
| T |
ν
27 (ν57) |
1662.66 (1660.40) |
160.95 (116.95) |
−44.00 |
|
|
| HCN⋯HNC |
| — |
— (ν3) |
— (173.95) |
— (5.97) |
5.97 |
| HCN |
ν
4 (ν12) |
3495.61 (3446.55) |
77.28 (166.27) |
88.99 |
Table 2 Excess IR intensity (ΔI, see eqn (10)) and interaction energy (ΔE, see eqn (12)–(14)) decomposition in the B⋯T complex
| Term |
X = E (kcal mol−1) |
X = I (km mol−1) |
| B⋯T |
HCN⋯HNC |
B⋯T |
HCN⋯HNC |
|
ν
24
|
ν
56
|
ν
57
|
ν
3
|
ν
12
|
|
The difference in both contributions is approximately 4 × 10⁻³ km mol−1.
The difference in both contributions is smaller than 10−3 km mol−1.
|
| ΔX(10)el |
−8.77 |
−10.22 |
29.92 |
−28.47 |
−55.94 |
7.43 |
61.35 |
| ΔXHLex |
19.57 |
9.37 |
−24.99 |
−58.98 |
−17.29 |
−10.58 |
−8.76 |
| ΔXHFdel |
−2.08 |
−4.19 |
−2.89 |
61.02 |
34.58 |
8.85 |
30.68 |
| ΔXHFint |
8.72 |
−5.04 |
2.04 |
−26.44 |
−38.65 |
5.70 |
83.27 |
| ΔX(12)el,r |
0.19 |
−0.52 |
−3.91 |
7.12 |
7.12 |
−0.33a |
4.38b |
| ΔX(2)ex |
3.50 |
1.41 |
−0.34 |
−9.15 |
−2.03 |
−0.33a |
4.38b |
| ΔX(20)disp |
−17.85 |
−3.41 |
11.05 |
4.07 |
−3.05 |
0.50 |
0.00 |
| ΔXMP2int |
−5.44 |
−7.56 |
8.84 |
−24.41 |
−36.61 |
5.54 |
92.03 |
We will now turn to the analysis of data obtained for the HCN⋯HNC complex. We chose two normal modes for the analysis, i.e. a non-localized intermolecular N–H stretching mode formed due to hydrogen bonding (ν4 in the complex, 174 cm−1) and the C–H stretching mode localized on HCN (ν12 in the complex, 3447 cm−1). The corresponding data are presented in Tables 1 and 2. The pattern of interaction types governing stability is typical for hydrogen-bonded complexes,57,80,81i.e. there is a large electrostatic component (quenched to a large extent by associated first-order exchange) and a smaller, but still significant stabilizing contribution from the delocalization term. Taken together, these components lead to a stabilizing interaction energy at the Hartree–Fock level. Higher-order corrections further contribute to the stabilization of the HCN⋯HNC complex. The analysis of interaction-induced IR intensity changes reveals that the qualitative pattern for ν4 and ν12 is similar, i.e. ΔI changes are governed by first-order electrostatic and exchange components and the delocalization term while the higher-order terms are much smaller; moreover, the signs of individual terms contributing to ΔIHFint follow the same trend – only the exchange component diminishes the intensity. Note that such a pattern was not found in the case of the investigated modes of the B⋯T complex. Even though we analyzed two different stretching vibrations in the linear hydrogen-bonded system (intra- and inter-molecular stretching) and the magnitudes of ΔI remain very different, the overall pattern of the dominant components remains similar.
Finally, let us comment on the differences between ΔI shown in Tables 1 and 2. The intensity changes presented in Table 1 include the effect of monomer relaxation, i.e.:
| ΔIa = Ia(ABAB) − Ia(AA) − Ia(BB) |
where
ABAB,
AA and
BB correspond to dimer and both monomers at their relaxed geometries (indicated by subscripts), respectively. For a vibrational mode a localized,
e.g., on monomer
A, the intensity change can be expressed as follows:
Since the proposed decomposition scheme for Δ
I is based on the definition of interaction energy, the corresponding formula for Δ
I reads
| ΔIa = Ia(ABAB) − Ia(AAB) − Ia(BAB) |
Hence, the differences in Δ
I between the two tables can be directly related to the effect of geometry deformation upon complex formation and its influence on the IR intensity changes. For the studied modes of the B⋯T complex this effect is negligible for mode
ν24, and one-order of magnitude smaller than the major contribution for
ν56 and
ν57. These findings are in agreement with the results obtained for two modes corresponding to the hydrogen-bonded complex where the effect of monomer relaxation does not exceed 8% of the total Δ
I value.
5. Summary and outlook
In summary, we have presented a new decomposition scheme for interpreting the IR intensity changes on passing from isolated subsystems to molecular complexes in terms of interaction types. To illustrate its potential we have applied the newly developed scheme to two important classes of molecular complexes: hydrogen-bonded (HCN⋯HNC) and π⋯π stacked (benzene⋯1,3,5-trifluorobenzene) systems. In more detail, we have analyzed three intense vibrational modes in the benzene⋯1,3,5-trifluorobenzene complex, namely the in-phase out-of-plane C–H bending of benzene and the C–C symmetric and asymmetric stretching modes of 1,3,5-trifluorobenzene. In the case of the HCN⋯HNC complex we analyzed two modes: the C–H stretching mode localized on HCN and a low-frequency non-localized mode appearing due to intermolecular interaction. We have thus demonstrated that the method can be employed to decompose the IR intensity changes upon complex formation for modes localized on monomers as well as non-localized modes appearing due to intermolecular interactions. The exemplary applications revealed that the interplay of interaction energy components governing stability (ΔEint) might qualitatively differ from that corresponding to IR intensity changes (ΔI), e.g., in the case of the dispersion-bound π⋯π-stacking complex, the dispersion contributions to the interaction induced IR intensity of the selected modes are notably smaller than the magnitudes of first-order (electrostatic and exchange) terms. The new scheme can also be applied to other types of neutral and charged complexes (halogen-bonded, tetrel-bonded, inclusive, atom-molecule, etc.).82–85 Provided that the shift of vibrational frequency upon complex formation is negligible, the proposed scheme allows the direct decomposition of infrared intensity changes; otherwise the change of intensity/frequency ratio can be decomposed providing useful information about the contribution of different interaction types to the net changes in IR spectroscopic signatures. The decomposition of IR intensity changes was realised via the variational–perturbational energy decomposition scheme at the MP2 level, but it can also be performed in combination with other EDA approaches. The proposed scheme thus represents a general tool that provides new physical insights into the manifestation of intermolecular forces in spectral properties of molecular complexes.
Conflicts of interest
There are no conflicts to declare.
Acknowledgements
R. Z. gratefully acknowledges support from the National Science Centre, Poland (Grant 2018/30/E/ST4/00457). J. M. L. is thankful for the funds from the Spanish government MICINN (PGC2018-098212-B-C22), and the Generalitat de Catalunya (2021SGR00623). The authors thank the Wroclaw Centre for Networking and Supercomputing for the generous allotment of computer time. The authors thank Miss Elizaveta F. Petrusevich for the preparation of the graphical abstract.
Notes and references
- G. R. Desiraju, J. Am. Chem. Soc., 2013, 135, 9952–9967 CrossRef CAS.
- P. A. Gale, J. T. Davis and R. Quesada, Chem. Soc. Rev., 2017, 46, 2497–2519 RSC.
- A. Buckingham, J. Del Bene and S. McDowell, Chem. Phys. Lett., 2008, 463, 1–10 CrossRef CAS.
- T. Fornaro, D. Burini, M. Biczysko and V. Barone, J. Phys. Chem. A, 2015, 119, 4224–4236 CrossRef CAS.
- B. Jeziorski, R. Moszyński and K. Szalewicz, Chem. Rev., 1994, 94, 1887–1930 CrossRef CAS.
- K. Morokuma, J. Chem. Phys., 1971, 55, 1236–1244 CrossRef CAS.
- T. Ziegler and A. Rauk, Theoret. Chim. Acta, 1977, 46, 1–10 CrossRef CAS.
- K. Kitaura and K. Morokuma, Int. J. Quantum Chem., 1976, 10, 325–340 CrossRef CAS.
- P. S. Bagus, K. Hermann and C. W. Bauschlicher, J. Chem. Phys., 1984, 80, 4378 CrossRef CAS.
- W. J. Stevens and W. H. Fink, Chem. Phys. Lett., 1987, 139, 15–22 CrossRef CAS.
- E. D. Glendening and A. Streitwieser, J. Chem. Phys., 1994, 100, 2900 CrossRef CAS.
- Y. Mo, J. Gao and S. D. Peyerimhoff, J. Chem. Phys., 2000, 112, 5530 CrossRef CAS.
- P. Su and H. Li, J. Chem. Phys., 2009, 131, 014102 CrossRef PubMed.
- P. R. Horn and M. Head-Gordon, Phys. Chem. Chem. Phys., 2016, 18, 23067 RSC.
- K. Müller-Dethlefs and P. Hobza, Chem. Rev., 2000, 100, 143–167 CrossRef PubMed.
- J. P. Wagner and P. R. Schreiner, Angew. Chem., Int. Ed., 2015, 54, 12274–12296 CrossRef CAS PubMed.
- P. Fowler and A. Sadlej, Mol. Phys., 1992, 77, 709–725 CrossRef CAS.
- D. M. Bishop and M. Dupuis, Mol. Phys., 1996, 88, 887–898 CAS.
- T. G. A. Heijmen, R. Moszynski, P. E. S. Wormer and A. van der Avoird, Mol. Phys., 1996, 89, 81–110 CrossRef CAS.
- B. Skwara, A. Kaczmarek, R. W. Góra and W. Bartkowiak, Chem. Phys. Lett., 2008, 461, 203–206 CrossRef CAS.
- R. W. Góra, R. Zaleśny, A. Zawada, W. Bartkowiak, B. Skwara, M. G. Papadopoulos and D. L. Silva, J. Phys. Chem. A, 2011, 115, 4691–4700 CrossRef PubMed.
- R. W. Góra and B. Błasiak, J. Phys. Chem. A, 2013, 117, 6859–6866 CrossRef PubMed.
- A. Buckingham and K. Clarke, Chem. Phys. Lett., 1978, 57, 321–325 CrossRef CAS.
- P. W. Fowler, K. L. C. Hunt, H. M. Kelly and A. J. Sadlej, J. Chem. Phys., 1994, 100, 2932–2935 CrossRef CAS.
- R. Moszynski, T. G. A. Heijmen, P. E. S. Wormer and A. van der Avoird, J. Chem. Phys., 1996, 104, 6997–7007 CrossRef CAS.
- C. Hättig, H. Larsen, J. Olsen, P. Jørgensen, H. Koch, B. Fernandez and A. Rizzo, J. Chem. Phys., 1999, 111, 10099–10107 CrossRef.
- H. Koch, C. Hättig, H. Larsen, J. Olsen, P. Jørgensen, B. Fernandez and A. Rizzo, J. Chem. Phys., 1999, 111, 10108–10118 CrossRef CAS.
- M. Jaszuński, A. Rizzo and P. Jørgensen, Theor. Chem. Acc., 2001, 106, 251–258 Search PubMed.
- A. Rizzo, C. Hättig, B. Fernandez and H. Koch, J. Chem. Phys., 2002, 117, 2609–2618 CrossRef CAS.
- J. L. Cacheiro, B. Fernandez, D. Marchesan, S. Coriani, C. Hättig and A. Rizzo, Mol. Phys., 2004, 102, 101–110 CrossRef CAS.
- A. Antušek, M. Jaszuński and A. Rizzo, J. Chem. Phys., 2007, 126, 074303 CrossRef PubMed.
- T. Bancewicz and G. Maroulis, Chem. Phys. Lett., 2010, 498, 349–352 CrossRef CAS.
- A. Chantzis and G. Maroulis, Chem. Phys. Lett., 2011, 507, 42–47 CrossRef CAS.
- D. Xenides, A. Hantzis and G. Maroulis, Chem. Phys., 2011, 382, 80–87 CrossRef CAS.
- G. Maroulis, A. Haskopoulos, W. Glaz, T. Bancewicz and J. Godet, Chem. Phys. Lett., 2006, 428, 28–33 CrossRef CAS.
- B.-Q. Wang, Z.-R. Li, D. Wu, X.-Y. Hao, R.-J. Li and C.-C. Sun, J. Phys. Chem. A, 2004, 108, 2464–2468 CrossRef CAS.
- B. Skwara, W. Bartkowiak, A. Zawada, R. W. Góra and J. Leszczynski, Chem. Phys. Lett., 2007, 436, 116–123 CrossRef CAS.
- A. Baranowska, B. Fernandez, A. Rizzo and B. Jansik, Phys. Chem. Chem. Phys., 2009, 11, 9871–9883 RSC.
- A. Baranowska, A. Zawada, B. Fernandez, W. Bartkowiak, D. Kedziera and A. Kaczmarek-Kedziera, Phys. Chem. Chem. Phys., 2010, 12, 852–862 RSC.
- A. Baranowska, B. Fernandez and A. J. Sadlej, Theor. Chem. Acc., 2011, 128, 555–561 Search PubMed.
- A. Zawada, R. W. Góra, M. M. Mikołajczyk and W. Bartkowiak, J. Phys. Chem. A, 2012, 116, 4409–4416 CrossRef CAS PubMed.
- A. Zawada, A. Kaczmarek-Kedziera and W. Bartkowiak, J. Mol. Model., 2012, 18, 3073–3086 CrossRef CAS PubMed.
- M. H. Champagne, X. Li and K. L. C. Hunt, J. Chem. Phys., 2000, 112, 1893–1906 CrossRef CAS.
- X. Li, C. Ahuja, J. F. Harrison and K. L. C. Hunt, J. Chem. Phys., 2007, 126, 214302 CrossRef CAS PubMed.
- T. Karman, E. Miliordos, K. L. C. Hunt, G. C. Groenenboom and A. van der Avoird, J. Chem. Phys., 2015, 142, 084306 CrossRef PubMed.
- M. Abel, L. Frommhold, X. Li and K. L. C. Hunt, J. Phys. Chem. A, 2011, 115, 6805–6812 CrossRef CAS PubMed.
- M. Abel, L. Frommhold, X. Li and K. L. C. Hunt, J. Chem. Phys., 2012, 136, 044319 CrossRef PubMed.
- C. D. Zeinalipour-Yazdi and D. P. Pullman, J. Phys. Chem. B, 2006, 110, 24260–24265 CrossRef CAS PubMed.
- G. Maroulis, Int. J. Quant. Chem., 2012, 112, 2231–2241 CrossRef CAS.
- J.-L. Godet, T. Bancewicz, W. Glaz, G. Maroulis and A. Haskopoulos, J. Chem. Phys., 2009, 131, 204305 CrossRef PubMed.
- A. Baranowska-Łaczkowska, B. Fernandez, A. Rizzo and B. Jansik, Mol. Phys., 2012, 110, 2503–2512 CrossRef.
- Ż. Czyżnikowska, R. W. Góra, R. Zaleśny, W. Bartkowiak, A. Baranowska-Łaczkowska and J. Leszczynski, Chem. Phys. Lett., 2013, 555, 230–234 CrossRef.
- A. Baranowska-Łaczkowska, B. Fernandez and R. Zaleśny, J. Comp. Chem., 2013, 34, 275–283 CrossRef PubMed.
- A. Baranowska-Łaczkowska and B. Fernandez, Mol. Phys., 2015, 113, 3362–3369 CrossRef.
- M. Medved, Š. Budzak, A. D. Laurent and D. Jacquemin, J. Phys. Chem. A, 2015, 119, 3112–3124 CrossRef CAS PubMed.
- R. Zaleśny, M. Garcia-Borrás, R. Góra, M. Medved and J. M. Luis, Phys. Chem. Chem. Phys., 2016, 18, 22467–22477 RSC.
- R. Zaleśny, M. Medved, R. W. Góra, H. Reis and J. M. Luis, Phys. Chem. Chem. Phys., 2018, 20, 19841–19849 RSC.
- M. Medved, A. Iglesias, H. Reis, R. Gora, J. M. Luis and R. Zaleśny, Phys. Chem. Chem. Phys., 2020, 22, 4225–4234 RSC.
- D. Bishop, Adv. Chem. Phys., 1998, 104, 1–40 CAS.
- D. Bishop and B. Kirtman, J. Chem. Phys., 1991, 95, 2646–2658 CrossRef CAS.
- D. M. Bishop and B. Kirtman, J. Chem. Phys., 1992, 97, 5255–5256 CrossRef CAS.
- D. M. Bishop, J. M. Luis and B. Kirtman, J. Chem. Phys., 1998, 108, 10008–10012 CrossRef.
- D. M. Bishop, M. Hasan and B. Kirtman, J. Chem. Phys., 1995, 103, 4157–4159 CrossRef CAS.
- C. Eckart, Phys. Rev., 1926, 28, 711 CrossRef.
- J. M. Luis, M. Duran, J. L. Andrés, B. Champagne and B. Kirtman, J. Chem. Phys., 1999, 111, 875 CrossRef CAS.
- M. Gutowski, F. V. Duijneveldt, G. Chałasińński and L. Piela, Mol. Phys., 1987, 61, 233–247 CrossRef CAS.
- W. A. Sokalski, S. Roszak and K. Pecul, Chem. Phys. Lett., 1988, 153, 153–159 CrossRef CAS.
- S. M. Cybulski, G. Chałasiński and R. Moszyński, J. Chem. Phys., 1990, 92, 4357–4363 CrossRef CAS.
- G. Chałasiński and M. M. Szcześniak, Chem. Rev., 1994, 94, 1723–1765 CrossRef.
- G. Chałasiński and M. M. Szcześniak, Mol. Phys., 1988, 63, 205–224 CrossRef.
- F. B. van Duijneveldt, J. G. C. M. van Duijneveldt-van de Rijdt and J. H. van Lenthe, Chem. Rev., 1994, 94, 1873–1885 CrossRef CAS.
- R. Moszyński, S. Rybak, S. Cybulski and G. Chałasiński, Chem. Phys. Lett., 1990, 166, 609–614 CrossRef.
- T. H. Dunning, J. Chem. Phys., 1989, 90, 1007–1023 CrossRef CAS.
- R. A. Kendall, T. H. Dunning and R. J. Harrison, J. Chem. Phys., 1992, 96, 6796–6806 CrossRef CAS.
- D. E. Woon and T. H. Dunning, J. Chem. Phys., 1994, 100, 2975–2988 CrossRef CAS.
-
M. J. Frisch, G. W. Trucks, H. B. Schlegel, G. E. Scuseria, M. A. Robb, J. R. Cheeseman, G. Scalmani, V. Barone, B. Mennucci, G. A. Petersson, H. Nakatsuji, M. Caricato, X. Li, H. P. Hratchian, A. F. Izmaylov, J. Bloino, G. Zheng, J. L. Sonnenberg, M. Hada, M. Ehara, K. Toyota, R. Fukuda, J. Hasegawa, M. Ishida, T. Nakajima, Y. Honda, O. Kitao, H. Nakai, T. Vreven, J. A. Montgomery, Jr., J. E. Peralta, F. Ogliaro, M. Bearpark, J. J. Heyd, E. Brothers, K. N. Kudin, V. N. Staroverov, R. Kobayashi, J. Normand, K. Raghavachari, A. Rendell, J. C. Burant, S. S. Iyengar, J. Tomasi, M. Cossi, N. Rega, J. M. Millam, M. Klene, J. E. Knox, J. B. Cross, V. Bakken, C. Adamo, J. Jaramillo, R. Gomperts, R. E. Stratmann, O. Yazyev, A. J. Austin, R. Cammi, C. Pomelli, J. W. Ochterski, R. L. Martin, K. Morokuma, V. G. Zakrzewski, G. A. Voth, P. Salvador, J. J. Dannenberg, S. Dapprich, A. D. Daniels, O. Farkas, J. B. Foresman, J. V. Ortiz, J. Cioslowski and D. J. Fox, Gaussian 09 Revision D.01, Gaussian Inc., Wallingford CT, 2009 Search PubMed.
- M. W. Schmidt, K. K. Baldridge, J. A. Boatz, S. T. Elbert, M. S. Gordon, J. H. Jensen, S. Koseki, N. Matsunaga, K. A. Nguyen, S. Su, T. L. Windus, M. Dupuis and J. A. Montgomery, J. Comput. Chem., 1993, 14, 1347–1363 CrossRef CAS.
-
R. W. Gora, EDS package, Revision 2.8.3, Wrocław, Poland, 1998–2008 Search PubMed.
- S. M. Cybulski and M. L. Lytle, J. Chem. Phys., 2007, 127, 141102 CrossRef PubMed.
- Ż. Czyżnikowska, P. Lipkowski, R. W. Góra, R. Zaleśny and A. C. Cheng, J. Phys. Chem. B, 2009, 113, 11511–11520 CrossRef PubMed.
- Z. Czyżnikowska, R. W. Góra, R. Zaleśny, P. Lipkowski, K. N. Jarzembska, P. M. Dominiak and J. Leszczynski, J. Phys. Chem. B, 2010, 114, 9629–9644 CrossRef PubMed.
- J. T. Kelly, T. L. Ellington, T. M. Sexton, R. C. Fortenberry, G. S. Tschumper and K. R. Asmis, J. Chem. Phys., 2018, 149, 191101 CrossRef PubMed.
- G. Cavallo, P. Metrangolo, R. Milani, T. Pilati, A. Priimagi, G. Resnati and G. Terraneo, Chem. Rev., 2016, 116, 2478–2601 CrossRef CAS PubMed.
- S. Scheiner, Phys. Chem. Chem. Phys., 2021, 23, 5702–5717 RSC.
- A. A. Popov, S. Yang and L. Dunsch, Chem. Rev., 2013, 113, 5989–6113 CrossRef CAS PubMed.
Footnote |
| † In memory of Professor Krzysztof Woliński. |
|
| This journal is © the Owner Societies 2023 |
Click here to see how this site uses Cookies. View our privacy policy here. 
 Open Access Article
 This Open Access Article is licensed under a Creative Commons Attribution-Non Commercial 3.0 Unported Licence
 ab,
Heribert
Reis
c,
Miroslav
Medveď
ab,
Heribert
Reis
c,
Miroslav
Medveď