
First (e,e) coincidence measurements on solvated sodium benzoate in water using a magnetic bottle time-of-flight spectrometer
L.
Huart
 abc,
M.
Fournier
ad,
R.
Dupuy
de,
R.
Vacheresse
d,
M.
Mailhiot
f,
D.
Cubaynes
g,
D.
Céolin
d,
M. A.
Hervé du Penhoat
c,
J. P.
Renault
b,
J.-M.
Guigner
c,
A.
Kumar
a,
B.
Lutet-Toti
d,
J.
Bozek
a,
I.
Ismail
d,
L.
Journel
d,
P.
Lablanquie
d,
F.
Penent
d,
C.
Nicolas
a and
J.
Palaudoux
*d
abc,
M.
Fournier
ad,
R.
Dupuy
de,
R.
Vacheresse
d,
M.
Mailhiot
f,
D.
Cubaynes
g,
D.
Céolin
d,
M. A.
Hervé du Penhoat
c,
J. P.
Renault
b,
J.-M.
Guigner
c,
A.
Kumar
a,
B.
Lutet-Toti
d,
J.
Bozek
a,
I.
Ismail
d,
L.
Journel
d,
P.
Lablanquie
d,
F.
Penent
d,
C.
Nicolas
a and
J.
Palaudoux
*d
aSynchrotron Soleil, 91192 Saint Aubin, France
bUniversité Paris-Saclay, CEA, CNRS, NIMBE, CEA Saclay, 91191 Gif-sur-Yvette, France
cInstitut de Minéralogie, de Physique des Matériaux et de Cosmochimie, Sorbonne Université, UMR CNRS 7590, MHNH, 75252 Paris, France
dSorbonne Université, CNRS, Laboratoire de Chimie Physique – Matière et Rayonnement, LCP-MR, F-75005 Paris Cedex 05, France. E-mail: jerome.palaudoux@sorbonne-universite.fr
eFritz-Haber-Institut der Max-Planck-Gesellschaft, Faradayweg 4-6, 14195 Berlin, Germany
fNano and Molecular Systems Research Unit, University of Oulu, PO Box 3000, FI-90014, Finland
gISMO, CNRS UMR 8214, Université Paris Sud, bâtiment 350, F-91405, Orsay, France
First published on 6th December 2022
Abstract
Understanding the mechanisms of X-ray radiation damage in biological systems is of prime interest in medicine (radioprotection, X-ray therapy…). Study of low-energy rays, such as soft-X rays and light ions, points to attribute their lethal effect to clusters of energy deposition by low-energy electrons. The first step, at the atomic or molecular level, is often the ionization of inner-shell electrons followed by Auger decay in an aqueous environment. We have developed an experimental set-up to perform electron coincidence spectroscopy on molecules in a water micro-jet. We present here the first results obtained on sodium benzoate solutions, irradiated at the oxygen and carbon K-edges.
1 Introduction
The interaction of high-energy ionizing radiation with matter remains a very interesting and challenging question in many fields, including nuclear industry and medicine. Indeed, radiation damage is a complex multi-scale problem, not only in the spatial domain but also in the temporal domain. While interactions begin at the atomic level (on a time scale of atto- to femtoseconds) and impact the molecular level (on a time scale of femto- to pico-second), they can ultimately affect the behavior of a cell over hours or days, and, in the worst case, lead to a complete breakdown of a living organism over months to years. The events of the energy deposition can be difficult to disentangle but a proper description is of prime importance to understand radiation damage on biological systems.The early stages of energy deposition processes have been shown to be critical in terms of radiobiological damage because they initiate electron emission processes.1 Similarly, soft X-ray photons, interacting mostly with K-shell electrons via a photo-electric effect, are known to cause complex damage to biological samples.2 In addition, their possible chemical selectivity can lead to the specific ejection of core electrons from a target molecule. In the gas phase, the ejection of this photoelectron is followed by re-organization/relaxation of the electronic structure, leading, via the Auger effect, to the ejection of one or more additional Auger electrons. In the liquid phase, all these electrons can be seen as new projectiles with a defined velocity injected in the medium and can induce potential new damage.3 In addition to the Auger local de-excitation, new types of non-local de-excitation pathways can occur in an aqueous environment (protonation, interatomic/intermolecular coulombic decay, electron-transfer-mediated decay).4 As for Auger decay, these ultrafast dynamical processes lead to energy and charge redistribution on the ionized molecules, creating highly localized and highly concentrated production of oxidizing radicals, if the neighboring molecules are water molecules.5 Moreover, such decays can lead to the emission of low-kinetic energy electrons (<20 eV), which can induce severe damage in a biological sample through dissociative attachments.6
As the photoelectrons and Auger electrons carry out the excess energy and as different de-excitation channels are possible, it is often difficult to disentangle the Auger spectra.7,8 Therefore, it is of prime importance to be able to identify the different electronic final states of the di-cations reached after a K-shell ionization, especially to guide ab initio molecular dynamics simulations, and to understand the stages of bond breakage, radical formation, or subsequent solvent effects. Since biological systems are surrounded by water molecules most of the time, it is mandatory to be able to investigate these processes in the liquid phase. Unfortunately, the liquid phase is usually not considered to be “vacuum friendly” due to the high vapor pressure of water, making the application of electron spectroscopy techniques to liquids difficult. In addition to the incompatibility of usual electron spectrometers to high-pressure environments, the low penetration of soft X-ray photons (few micrometers) and the very short propagation lengths of sub keV electrons in condensed matter (few nanometers) make such studies challenging. If in the 70's, electron spectroscopy studies were already performed on liquids with a low vapor pressure,9 it is only at the end of the 20th century that Faubel et al. used a liquid micro-jet to study liquid interfaces.10 Since then, many developments have taken place and electron spectroscopy experiments using liquid micro-jets are now available in many synchrotron facilities.11–14
In this paper, we have coupled a liquid micro-jet to a magnetic bottle-type electron time-of-flight spectrometer (MB-TOF). This type of analyzer is perfectly suited to study multi-electronic processes. Due to its very high electron collection efficiency, nearly 4π solid angle, it is well adapted to study inner-shell photoionization by detection in coincidence of the photoelectron with the subsequent Auger electrons. In a previous study15 we have investigated a local chemical environment effect on Auger spectra of ethyl trifluoroacetate (CF3COOCH2CH3, the so-called “Siegbahn molecule”16) in the gas phase using multi-electron coincidence spectroscopy and have shown that it is possible to obtain site-specific Auger spectra for each carbon atoms. Despite our filtering data method, those Auger spectra remain complex. X-ray Photoelectron Spectroscopy (XPS) will give information on the energies of the emitted electrons, or on the energy dissipation in the solvent (via coulombic de-excitation or electron transfer phenomena) while coincidences will allow a correlation with the Auger electrons and will provide information on the different relaxation pathways of biomolecules in an aqueous medium. It will thus allow us to filter out and identify different structures of the Auger spectra, and to better understand the effects of the solvent during the de-excitation processes following core-ionization. Different set-ups have coupled a MB-TOF with a liquid jet [for instance ref. 17 and 18], mainly using low repetition rate lasers as ionization sources that could not apply coincidence techniques. Recently, Hergenhahn and co-workers were the first to study electron transfer-mediated decay in a lithium chloride solution via coincidences with a MB-TOF using the temporal structure of synchrotron emission.19
We will describe here a new MB-TOF coupled with a recycling liquid microjet source specifically designed for coincidences measurements with soft X-ray synchrotron radiation. Different chemical solutes were studied. These first results will show how it is possible to clearly disentangle, above the oxygen K-edge, the liquid phase signal from the one of the surrounding water molecules in the gas phase. Other examples above the C-edge will be used to illustrate how to track the different electronic final states.
Our studies were conducted on sodium benzoate solutions and their hydroxylation derivatives as they are center targets of radiolysis studies, especially for their ability to be good producers of OH radicals.20 Sodium benzoate is particularly suitable as it is readily available and harmless. Moreover, the team recently performed a complete non-coincidence spectroscopic study that will be published soon.
2 Experimental method
The apparatus we have used is a specially designed magnetic bottle electron spectrometer.19,21,22 In a few words, we have built a new electron time-of-flight magnetic bottle spectrometer dedicated to the studies of liquid micro-jet. In such experiments, the major limitation is the vacuum. The detector side and the electron TOF tube should remain at a very good vacuum (<10−6 mBar) while the micro-jet chamber can reach 10−3–10−4 mBar due to the liquid vapor pressure despite a big 1200 L s−1 turbo pump. For this purpose, we developed a special head for the magnetic bottle with a small entrance aperture. Let's start with the description of the setup which is shown in Fig. 1.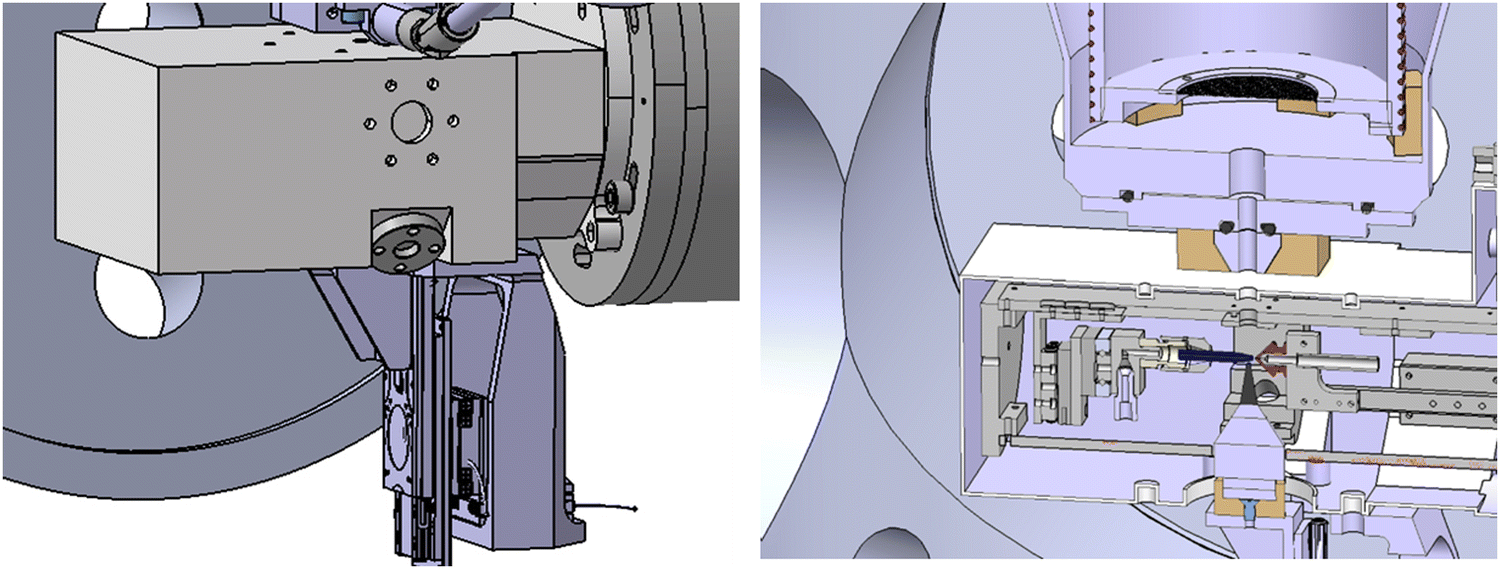 | ||
| Fig. 1 Sketch of the set-up coupling the liquid micro-jet and the MB-TOF spectrometer: on the left, the liquid box presenting the magnet support and motors. On the right, a cut of the liquid box and entrance of the spectrometer. | ||
A cut of the liquid microjet is given in Fig. 2.
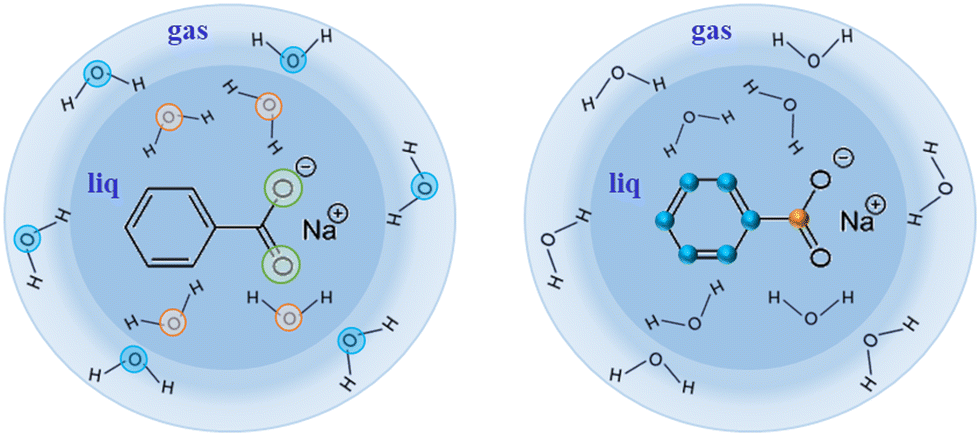 | ||
| Fig. 2 Sodium benzoate in its liquid (water) micro-jet environment. Left part of the figure depicts the O 1s available in this study, whereas the right part shows off the C 1s available. | ||
2.1 Modifications of the PLEIADES micro-jet source chamber
The source chamber of the PLEIADES liquid jet has already been described elsewhere.23 The liquid jet source is based on a Microliquids© design, which is enclosed in the source chamber pumped by an 800 L s−1 turbomolecular pump with a 100 m3 h−1 dry multistage root backing pump. The source chamber is also equipped with a liquid nitrogen trap (8400 L s−1 pumping speed for water). The source chamber head is an approximately 7 × 8 × 15 cm3 aluminum box that contains the liquid jet. A high-pressure liquid chromatography (HPLC) pump pushes the liquid through a 40 μm diameter glass capillary, with a flow rate of around 1.5 ml min−1. The micro-jet flies on about 5 mm in vacuum and is then collected, through a 300 μm aperture, by a copper-beryllium catcher (heated at 80 °C to avoid evaporation-freezing of the liquid and connected to a primary pump to suck the liquid). This box has two 1 mm diameter holes for the synchrotron light to enter and exit, on its top one 5 mm hole in a titanium piece through which the emitted electrons pass on their way to the MB-TOF, and on its bottom a 38 mm hole for the magnet that generates a strong and inhomogeneous magnetic field.24 It plays the role of a magnetic mirror that repels the electrons toward the TOF tube and parallelizes their trajectories. Compared to a previous design with a 90° conical magnet,22 a small soft iron cone (Dbase = 5 mm, L = 22.5 mm) was fixed, by the magnetic force, onto a cone trunk permanent magnet (similar to the original one). This geometry permits to approach the tip of the magnet at approximately 1 mm to the micro-jet. In this configuration, the soft iron cone concentrates the magnetic field lines of the permanent magnet and we obtain 0.8 T at the tip of the soft iron cone. The magnet assembly is mounted on a XYZ translation stage, controlled by three under-vacuum nano motion motors (AXMO) allowing accurate and reproducible alignment of the magnet under vacuum. This translation stage is attached to the source chamber head, so that the magnet assembly follows its movements during the initial light alignment. The magnet assembly can also be moved down by 40 mm, in order to remove the micro-jet device (for maintenance outside vacuum) without changing the magnet position in the two other directions. Typical concentrations of the studied solutions range between 0.5 to 2 M. For non-ionic species solutions, a small concentration of salt (50 mM of NaCl) is also added in order to avoid charging of the liquid jet, to keep the potential well defined, and also to reduce electro-hydrodynamic perturbation. A small gold-coated metallic connector located 20 cm up-stream, before injection into vacuum, is used to either electrically ground the jet, or to apply a bias voltage. The jet and catcher always stay at the same potential. The bias is applied using a highly stable voltage supply.2.2 The main chamber
The source chamber and the MB-TOF spectrometer are connected to the beamline via the main chamber, which is pumped with a 1300 L s−1 turbomolecular pump with a 45 m3 h−1 dry backing pump, and a liquid nitrogen trap (8400 L s−1 pumping speed for liquid water). The pressure in the source and the main chambers reaches 10−3 to 10−4 mBar. The light, the liquid jet, and the electron detection axis are perpendicular to each other.2.3 The MB-TOF spectrometer
At the entrance of the spectrometer, a hole of 5 mm is located just above the 5 mm titanium hole of the source chamber, at approximately 4 cm from the micro-jet axis. In the case of liquid jet maintenance, a manual valve was added (similar to the set-up of U. Hergenhahn and co-worker19) to isolate the vacuum of the spectrometer from the atmospheric pressure prevailing in the source and main chambers. Therefore, the detector always remains under high vacuum conditions, and the return-to-service time for measuring is tremendously reduced. A scheme of the magnetic bottle head is shown in Fig. 1. After passing through the entrance hole of the magnetic bottle, the electrons fly in the drift tube of the spectrometer, which is 120 cm long. The body of this tube is made of three layers. The vacuum chamber is a CF100 stainless steel tube. Inside this tube and under vacuum, a titanium tube (to avoid magnetic patches, which cannot be excluded when welding a stainless-steel tube) is inserted. It is threaded at a 3 mm pitch to host the solenoid (Kapton® isolated copper wire installed in those threads) that creates the homogenous magnetic field (∼10 Gauss with a current of ∼3 A) required. This titanium tube (D = 90 mm) is isolated and can be polarized to accelerate/decelerate the electrons by applying an appropriate electric potential. A double-layer mu-metal shielding is added around the stainless-steel drift tube as well as in the interaction chamber. This avoids earth and external magnetic field perturbations. Finally, two turbomolecular pumps of 300 L s−1 are added (one at the entrance of the spectrometer and one at the end, near the MCP-based detector) to reach the necessary high vacuum on the side of the MCPs, of 10−6 mBar with the liquid jet in operation. The primary vacuum is ensured by a 40 m3 h−1 dry pump. A general scheme of the coupling of the micro-jet device with the MB-TOF spectrometer is presented in Fig. 1.Since we are performing electron time-of-flight experiments, we need the single electron bunch operating mode provided by the SOLEIL synchrotron. The SOLEIL single bunch period is 1.18 μs, which is long enough for our purpose. In this configuration, photons hit the sample every 1.2 μs and electrons are also created with this period. To avoid overlaps between spectra (i.e. fast electrons from one bunch arriving before slow electrons produced by the previous bunch), special care in the photon energy is taken (1.2 μs corresponds to the time of flight of an electron of ∼3 eV in a 120 cm tube).
2.4 Detection and beamline parameters
With our coincidence experiment, we are able to collect all the electrons emitted from a single atom/molecule produced by one photon and coming from the illuminated part of the liquid micro-jet, as well as the ones coming from the surrounding gas phase.In our case, we are considering inner shell ionization followed by Auger decay. The photoelectron and the Auger electron are produced following this simplified scheme: M + hν → M+* + e−ph → M2+ + e−A + e−ph, where e−ph and e−A represent the photoelectron and the Auger electron, respectively. The detection efficiency for one electron is mainly limited by the MCP's detection efficiency (since the permanent magnet pushes all the electrons escaping from the liquid towards the drift tube). We are using a position-sensitive detector, composed of specially designed funneled MCPs25 from Roentdek® company (to increase their efficiency to ∼90%) and their standard delay line system, including their detection electronics. The time of flight of the electrons and their positions are recorded with a time-to-digital conversion card, with a resolution of 25 ps. For the present study, we only use the time of arrival of the electrons.
Photon energy was calibrated by scanning the well-known 2p → ns,nd resonances in Argon, since it was also possible to introduce gas through the micro-jet device. To obtain an accurate conversion of time-of-flight to energy, a large set of argon 2p spectra (recorded at different photon energies) was used. These “gas phase” results were checked using well-established O 1s thresholds (of both gas and liquid phases) and the C 1s threshold.
The set-up was connected to the user's open port from the C branch of the PLEIADES beamline. For the measurements around the C and O 1s thresholds, we used the APPLE II type undulator (permanent magnet) and the 600 l mm−1 grating of the beamline. The photon energy resolutions were set to 30 meV and 150 meV for 335 eV and 580 eV photon energies, respectively for exit slits fixed at 10 μm and 40 μm. By closing the exit slit, we also reduce the count rates below 20k electrons persecond (we cannot reduce the target density as in the gas phase), and, at this count rate with the synchrotron light at 850 kHz in a single bunch, we can neglect random coincidences. The light polarization was kept parallel -linear vertical polarization- to the spectrometer axis. The spot size of the photon beam is typically 100 μm × 50 μm (vertical × horizontal), according to the exit slit of the monochromator. Particular attention is taken to the alignment (liquid micro-jet – photon beam – permanent magnet) to optimize the signal from the liquid jet and the resolution of the spectrometer. This complex alignment is facilitated due to the design, which decouples the movements of each component.
3 First results
3.1 Filtering the gas phase from the liquid phase: O 1s example
As a first example of the possibilities of our coincidence measurements method, we show how we can filter the events, taking into account whether the photoelectron is produced in the gas phase or the liquid phase (see Fig. 2). For this, we have chosen a photon energy of 580 eV (∼40 eV above O 1s threshold) and we decelerated the electrons by 20 V to reduce the background of low-energy electrons. This also allows us to avoid recording all the electrons below 20 eV. All the spectra presented here have been reset to their correct energies (to be sure that there is no perturbation of the energies with retardation voltage, we recorded spectra with and without – not shown here – this retardation). The size of the file is reduced. The retardation permits also to improve energy resolution. In this experiment, we were considering sodium benzoate molecules in water but here we focus only on the O 1s edge.Fig. 3 shows the electron kinetic energy spectrum (all electrons are shown). The layout depicts a zoom of the O 1s photoelectron zone. The two peaks correspond to the O 1s of the gaseous water (main peak at a kinetic energy of 40 eV) and the O 1s of the liquid water (at KE of 42 eV). To understand the respective ratio of those peaks, we can remind that at these photon energies (300–500 eV) the photons can enter only by a few μm in the liquid. Moreover, the electron's mean free path is the limiting factor (also depending on the overlap of the micro-jet and the photon beam, their sizes, and temperatures).26 In such conditions, the gas phase peak is dominant. Varying the scale, a tiny bump due to the oxygens from the benzoate molecules (at a KE of 44 eV) can also be observed (not visible here). This first result can be followed by data filtering, i.e. we can plot Auger electrons produced after a given photoelectron. An example of this type of data selection is given in ref. 27 and this method will be detailed in the following section dedicated to the C 1s case. Nevertheless, a methodical treatment of the data, including quantification and subtraction of false coincidences in the 2D map, is required before we filter (cut, project) the data. On the other hand, we made preliminary measurements with a time- and position-sensitive detector to record and monitor the arrival positions of electrons on the detector. If a “hot spot” appears on the image of the detector, which can be associated with the liquid part of the jet, the subtraction of the gas phase contribution will become easier and will provide an additional filtering possibility to our coincidence method.
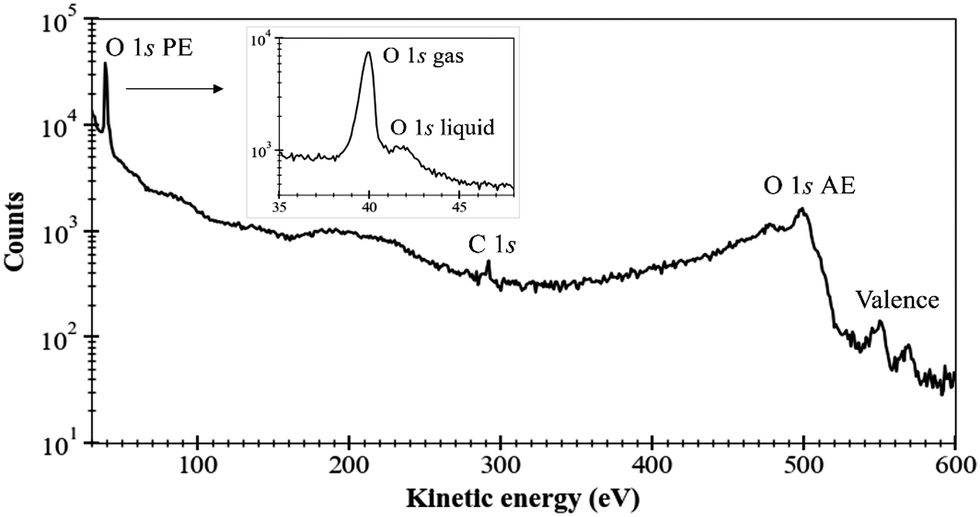 | ||
| Fig. 3 Total electron spectrum measured on a 1 M sodium benzoate solution with photon energy hν = 580 eV, an energy step 1 eV (0.1 eV in the layout), and a count rate of 13k–17k e− s−1 during a recording time of about 1 h, count-rate is given in logarithmic scale. Energy calibration was performed on the O 1s gas signal and Ar 2p resonances. | ||
3.2 Different molecules at C 1s threshold: different XPS spectra and different Auger spectra
In this section, we will consider the C 1s ionization case in different molecules (sodium benzoate, benzoic acid, and sodium 2-hydroxybenzoate) solvated in water. The first observation is that the solvated molecules do not escape from the liquid micro-jet in the gas phase (unlike the solvent as seen in the previous section). In Fig. 4 we present the photoelectron spectra of these three molecules. We performed those measurements at a photon energy of 335 eV and the electrons were decelerated by 20 V (thanks to the polarized titanium tube). As for the O 1s case, special care was taken for energy calibration and time to energy transformation. Here the results are plotted in kinetic energy.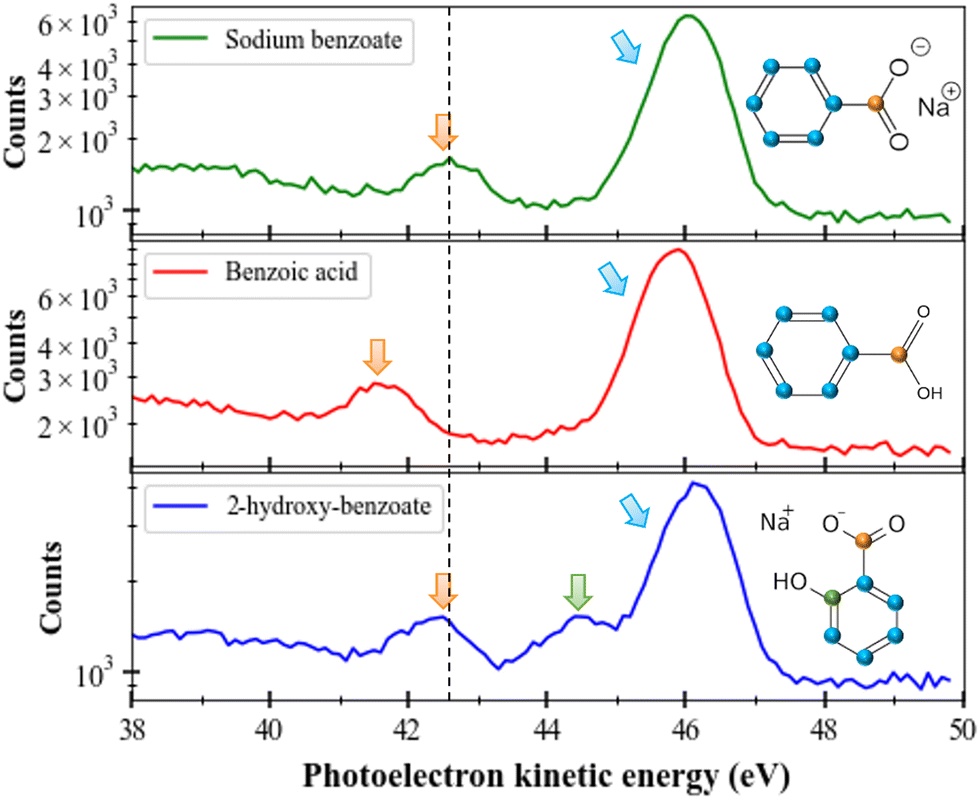 | ||
| Fig. 4 Photoelectron spectra (kinetic energy) of C 1s for sodium benzoate (upper part, green spectrum), benzoic acid (middle part, red spectrum), and 2-hydroxy-benzoate (lower part, blue spectrum) molecules. Color arrows are associated with each type of carbon. Energy step is 0.1 eV. | ||
To compare the performance of the magnetic bottle with a conventional hemispherical Scienta® analyzer available on the PLEIADES beamline, we recorded the photoelectron spectrum of sodium benzoate using both systems. It is worth noting that the spectrum recorded with the hemispherical analyser was recorded in the multi-bunch mode of the SOLEIL storage ring (450 mA), while the magnetic bottle spectrometer was operated in the single-bunch mode (16 mA), with the beamline exit slit nearly closed to limit the count rates for coincidence measurement. This clearly shows that the spectra obtained with the magnetic bottle analyser and the hemispherical analyser are similar in terms of intensity and resolution for the same acquisition time. This highlights the higher efficiency of the magnetic bottle analyser (>450/16 = 28 times) compared to the conventional hemispherical analyser. Moreover, this result confirms that the resolution in the liquid experiment is not limited by the resolution of our spectrometer, since the interaction with the environment broadens the observed spectra.28 This highlights the power and potential of using magnetic bottle spectrometers for this type of measurement.
If we consider these three molecules ((sodium benzoate, benzoic acid, and sodium 2-hydroxybenzoate) with different (but also similar) functional groups, we can identify the different peaks since the available carbons have different chemical environments. For instance, at a kinetic energy of 46 eV, we can recognize the contribution of the carbons of the benzenic ring. At a kinetic energy of 42.5 eV, we can identify the carbon from the COOH group (confirmed by the sodium formate spectrum which is not shown here). A shift of 1.1 eV to lower kinetic energies is seen for the C 1s photoelectron peak of the carboxyl group of benzoic acid (red), compared to the same photoelectron peak of sodium benzoate. All those values (kinetic energies and chemical shifts) are in good agreement with the literature.29 Between those two main peaks, for sodium 2-hydroxybenzoate we can identify a last peak corresponding to the carbon linked to the OH group. We can notice that the relative areas of the peaks follow the number of carbons considered: in sodium benzoate and benzoic acid a ratio of 6![[thin space (1/6-em)]](https://www.rsc.org/images/entities/char_2009.gif) :1 is found between the 6 carbons of the benzene ring and the carboxyl carbon; whereas a ratio of 5:1:1 is found for sodium 2-hydroxybenzoate (ring/OH/COOH). The dashed black line in the figure helps to illustrate this difference. This same trend has been visualized in previous studies in the literature of sodium benzoate and benzoic acid conducted with a liquid jet device as well.30 This shift can be explained by the presence of a negative charge on the carboxyl moiety, not present in the carboxylic acid moiety and which can induce additional electronic interactions in the molecule.30
:1 is found between the 6 carbons of the benzene ring and the carboxyl carbon; whereas a ratio of 5:1:1 is found for sodium 2-hydroxybenzoate (ring/OH/COOH). The dashed black line in the figure helps to illustrate this difference. This same trend has been visualized in previous studies in the literature of sodium benzoate and benzoic acid conducted with a liquid jet device as well.30 This shift can be explained by the presence of a negative charge on the carboxyl moiety, not present in the carboxylic acid moiety and which can induce additional electronic interactions in the molecule.30
Fig. 5 presents the two-dimensional coincidence map between the photoelectron kinetic energy (y-axis) and the Auger electron kinetic energy (x-axis) for the sodium benzoate molecule in water. The photoelectron spectrum is given on the left part of Fig. 5. The total (unfiltered) Auger spectrum (in black) is given below the 2D map. We can identify the Auger electrons between 150 and 270 eV.31 We should note here that the Auger spectrum may also contain contributions from the non-local processes mentioned in the introduction. In the present case, these non-local processes are not expected to yield energies with kinetic energies significantly different from regular Auger electrons. Without further theoretical support it is not possible to make further attributions. Additional structures are also visible as the peak at 130 eV which correspond to the photoelectron of O 1s from second-order photons, as detailed: hν (2 × 335 eV) + M (O 1s@540 eV) → M+* (O 1s−1) + e−ph (130 eV). Structures between 290 and 330 eV are the signature of the carbon valence shells ionization. Those electrons result from false coincidences since only the Auger electrons in coincidence with a photoelectron should appear in this type of 2D map. In other words, those electrons are not correlated with inner-shell photoelectrons. They are due to the relatively high count rates used during the experiment. The filtered Auger spectra, for the carbons of the benzene ring (in blue) and the carboxyl group (in orange), shows a difference in the Auger electrons zone: for the carbons of the ring, a more intense plateau is visible between 220 and 270 eV. This difference indicates a dependence on the initial K-shell ionized carbon (and in its chemical environment). It means that the dication electronic final states are populated differently or that few of those dications electronic states are populated preferentially.
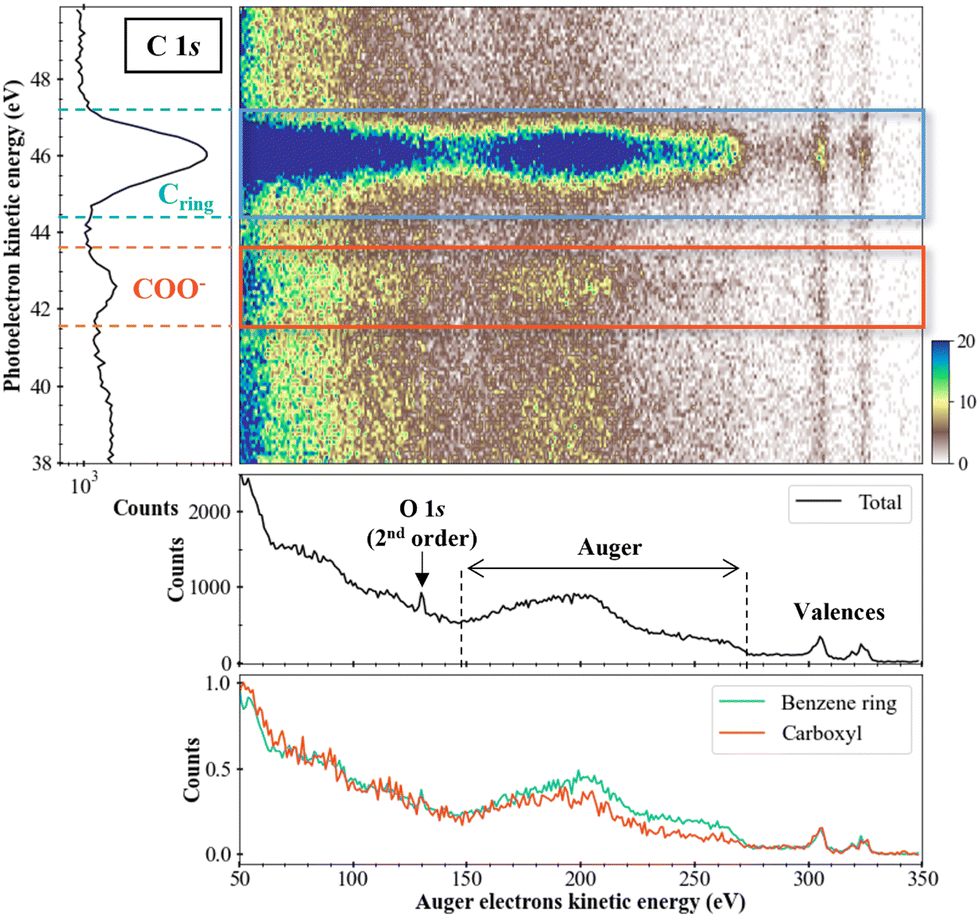 | ||
| Fig. 5 Two-dimensional map « Auger electrons kinetic energy/photoelectrons kinetic energy » (middle part) in the sodium benzoate case. z-axis was cut at z = 20 counts (with zmax = 71 coincidence counts). Photoelectron spectrum is given on the left, with a step of 0.1 eV. Total (unfiltered) Auger electron spectrum (lower part, in black) is represented with a step of 1 eV. Filtered Auger spectra after photoelectrons emission from carbons of the benzene ring (in blue) and carboxyl group (in orange) are also given. For easier comparison, those spectra are normalized to their maximum. | ||
After those first observations, we can also look if differences are also visible in Auger spectra of the other molecules with sodium benzoate-like structures: the benzoic acid and the 2-hydroxy-benzoate (like in Fig. 4). Fig. 6 depicts the resulting data treatments.
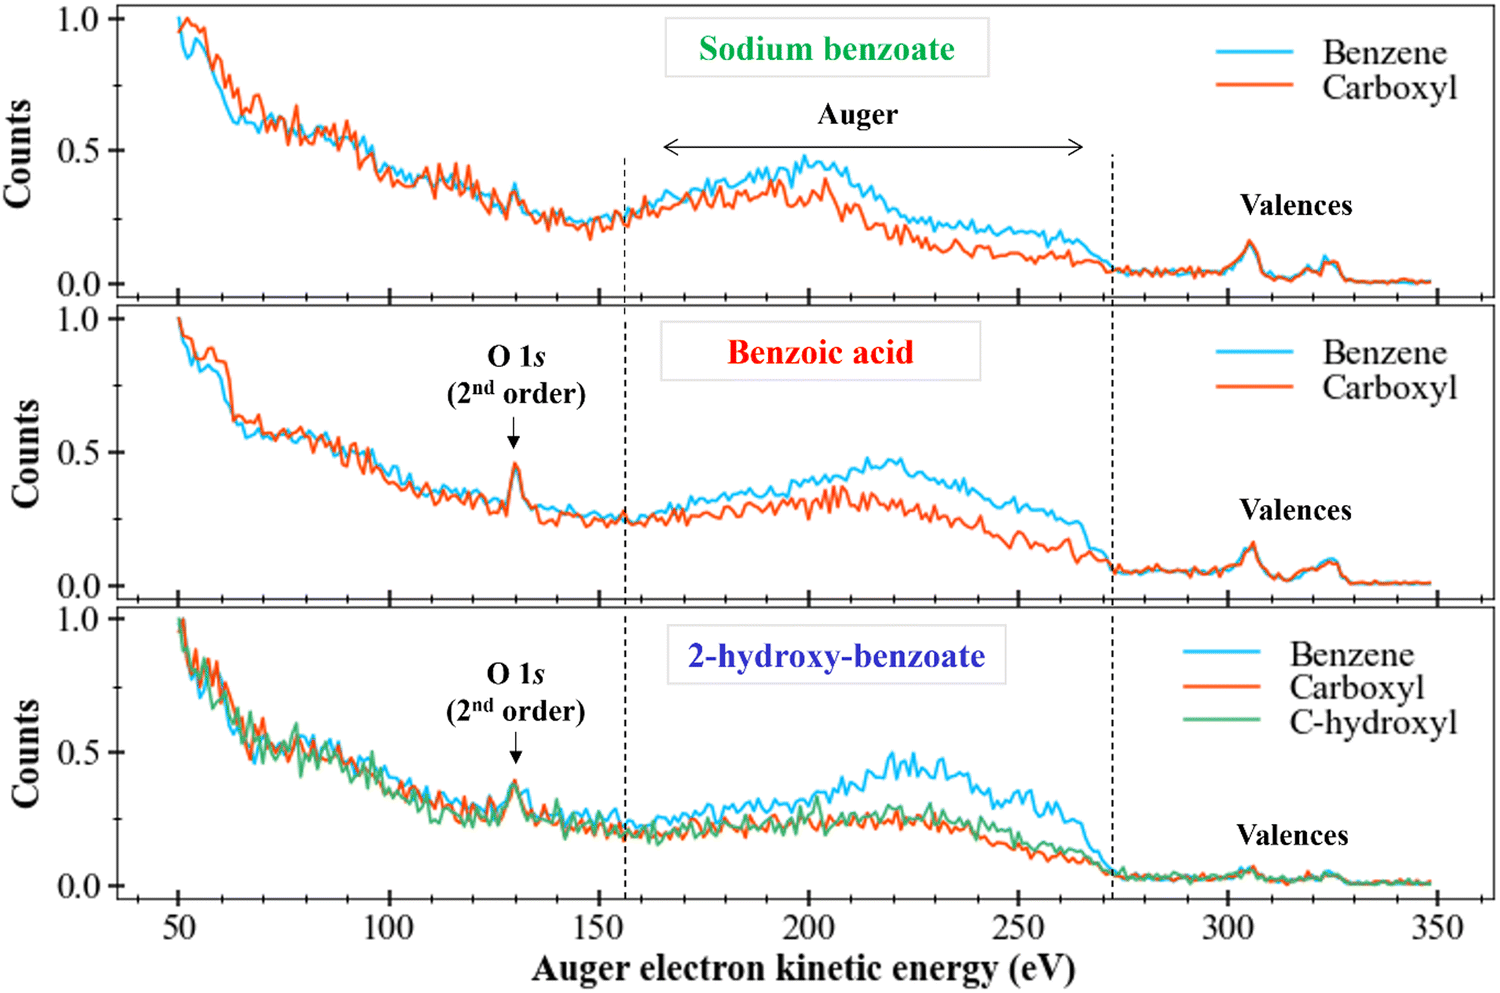 | ||
| Fig. 6 Comparison of the filtered Auger electron spectra (kinetic energy) of sodium benzoate (top), benzoic acid (middle), and 2-hydroxy-benzoate (bottom). The spectra were normalized to the maximum value of the number of counts. Energy step of 1 eV. | ||
We locate the O 1s photoelectron peak at about 130 eV as well as the valence electron bands between 290 eV and 330 eV. We are interested in the Auger electrons region between 155 eV and 270 eV, delimited by vertical dotted lines in Fig. 6. We first compare the Auger bands of the ring carbons to the Auger bands of the carboxyl carbon (and of the carbon bound to the hydroxyl group for the 2-hydroxy-benzoate). For benzoic acid and 2-hydroxy-benzoate, the Auger bands seem to follow the same trend However, the benzoate spectrum presents a less clear plateau between 220 and 270 eV.
Different intensities between each spectrum are visible, as seen for sodium benzoate in the previous section. This difference in intensity can be explained by the number of different carbons for each chemical environment. However, a plateau also appears to be present between 220 and 270 eV for the ring carbons.
We now consider the Auger bands of carbon with similar chemical environments but from different molecules. No significant difference is observed in the Auger bands of carboxyl group (orange spectra), perceptible. On the contrary, we observe a clear difference between the Auger bands of the ring carbons (blue spectra) of sodium benzoate and those of benzoic acid and 2-hydroxy-benzoate. Indeed, we observe a main band between 170 eV and 220 eV for sodium benzoate. This main band is located between 220 and 270 eV for benzoic acid and 2-hydroxy-benzoate. This difference suggests tha t the Auger electrons generated for the ring carbon atoms in sodium benzoate do not come from the same electron layers as those generated for benzoic acid and 2-hydroxy-benzoate. Therefore, there is a population difference in the electronic states of the dication resulting from the Auger relaxation process.
These spectra remain strongly different. The assignment is impossible without strong theoretical support. Without this theoretical support, we can only assume that the final states of the dications populated after C 1s ionization and Auger relaxation are completely different between these two molecules.
4 Conclusion
We report here the first results of a new magnetic bottle time of flight spectrometer dedicated to electron spectroscopy of solvated molecules in liquid micro-jet using the electron-electron coincidence technique. We have shown the possibilities of filtering the events depending on the state (gaseous or liquid) of the considered molecules. We have also shown the chemical selectivity at the C 1s threshold and that Auger decay remains different for different solvated molecules. We need accurate theoretical support to disentangle the different spectra we can obtain. After inner-shell ionization, several de-excitation pathways can occur such as ICD, ETMD and Auger decays. Within the “normal” Auger decay, additional cascade processes can also occur where multiple secondary electrons are emitted. Interaction between the molecules and the solvent must be studied in detail and “basic” effects such as concentration, solvent dependence, etc. can also be considered. Several molecules of biological interest could be studied by our coincidence method to obtain cross-sections that will be very useful as benchmarks for theoretical studies.Author contributions
C. N. and J. P. designed the research. All authors performed research. L. H., M. F., P. L. I. I., and J. P. analyzed the data. L. H., F. P., I. I., C. N. M. F., R. D. and J. P. wrote the paper.Conflicts of interest
There are no conflicts to declare.Acknowledgements
Experiments were carried out on PLEIADES with the approval of Synchrotron SOLEIL (proposal 20190766). We thank the SOLEIL biology and chemistry laboratories for their helpful support, as well as E. Robert from PLEIADES beamline for his technical support. This work was supported by the ANR project HighEneCh (ANR-17-CE30-0017), the NanoTheRad Strategic Research Initiatives from Paris Saclay University, and the IraSolubiox project from Labex PALM (ANR-10-LABX-0039-PALM). J. P. and R. V. especially thank H. Ringuenet from the LCP-MR mechanical workshop. J. P., F. P., and C.N. acknowledge U. Hergenhahn for fruitful discussions and advice.References
- A. Tilikidis and A. Brahme, Microdosimetric Description of Beam Quality and Biological Effectiveness in Radiation Therapy, Acta Oncol., 1994, 33, 457–469 CrossRef CAS PubMed.
- R. Cox, J. Thacker, D. T. Goodhead, W. K. Masson and R. E. Wilkinson, Inactivation and Mutation of Cultured Mammalian Cells by Aluminium Characteristic Ultrasoft X-rays: II. Dose-responses of Chinese Hamster and Human Diploid Cells to Aluminium X-rays and Radiations of Different LET, Int. J. Radiat. Biol. Relat. Stud. Phys., Chem. Med., 1977, 31, 561–576 CrossRef CAS PubMed.
- E. Alizadeh, T. M. Orlando and L. Sanche, Biomolecular Damage Induced by Ionizing Radiation: The Direct and Indirect Effects of Low-Energy Electrons on DNA, Annu. Rev. Phys. Chem., 2015, 66, 379–398 CrossRef CAS PubMed.
- T. Jahnke, J. Phys. B: At., Mol. Opt. Phys., 2015, 48(8), 082001 CrossRef.
- I. Unger, R. Seidel, S. Thürmer, M. N. Pohl, E. F. Aziz, L. S. Cederbaum, E. Muchová, P. Slavíček, B. Winter and N. V. Kryzhevoi, Observation of electron-transfer-mediated decay in aqueous solution, Nat. Chem., 2017, 9, 708–714 CrossRef CAS PubMed.
- Y. Dong, Y. Gao, W. Liu, T. Gao, Y. Zheng and L. Sanche, Clustered DNA Damage Induced by 2–20 eV Electrons and Transient Anions: General Mechanism and Correlation to Cell Death, J. Phys. Chem. Lett., 2019, 10, 2985–2990 CrossRef CAS PubMed.
- A. Hans, P. Schmidt, C. Küstner-Wetekam, F. Trinter, S. Deinert, D. Bloß, J. H. Viehmann, R. Schaf, M. Gerstel, C. M. Saak, J. Buck, S. Klumpp, G. Hartmann, L. S. Cederbaum, N. V. Kryzhevoi and A. Knie, Suppression of X-ray-Induced Radiation Damage to Biomolecules in Aqueous Environments by Immediate Intermolecular Decay of Inner-Shell Vacancies, J. Phys. Chem. Lett., 2021, 12, 7146–7150 CrossRef CAS PubMed.
- W. Pokapanich, N. V. Kryzhevoi, N. Ottosson, S. Svensson, L. S. Cederbaum, G. Öhrwall and O. Björneholm, Ionic-Charge Dependence of the Intermolecular Coulombic Decay Time Scale for Aqueous Ions Probed by the Core-Hole Clock, J. Am. Chem. Soc., 2011, 133, 13430–13436 CrossRef CAS PubMed.
- H. Siegbahn and K. Siegbahn, ESCA applied to liquids, J. Electron Spectrosc. Relat. Phenom., 1973, 2, 319–325 CrossRef CAS.
- B. Winter and M. Faubel, Photoemission from Liquid Aqueous Solutions, Chem. Rev., 2006, 106, 1176–1211 CrossRef CAS.
- R. Dupuy, C. Richter, B. Winter, G. Meijer, R. Schlögl and H. Bluhm, Core level photoelectron spectroscopy of heterogeneous reactions at liquid–vapor interfaces: Current status, challenges, and prospects, J. Chem. Phys., 2021, 154, 060901 CrossRef CAS PubMed.
- M. Ammann, L. Artiglia and T. Bartels-Rausch, Physical Chemistry of Gas-Liquid Interfaces, Elsevier, 2018, pp. 135–166 Search PubMed.
- M. A. Brown, M. Faubel and B. Winter, X-Ray photo- and resonant Auger-electron spectroscopy studies of liquid water and aqueous solutions, Annu. Rep. Prog. Chem., Sect. C: Phys. Chem., 2009, 105, 174 RSC.
- R. Signorell and B. Winter, Photoionization of the aqueous phase: clusters, droplets and liquid jets, Phys. Chem. Chem. Phys., 2022, 24, 13438–13460 RSC.
- H. Iwayama, N. Sisourat, P. Lablanquie, F. Penent, J. Palaudoux, L. Andric, J. H. D. Eland, K. Bučar, M. Žitnik, Y. Velkov, Y. Hikosaka, M. Nakano and E. Shigemasa, A local chemical environment effect in site-specific Auger spectra of ethyl trifluoroacetate, J. Chem. Phys., 2013, 138, 024306 CrossRef CAS PubMed.
- K. Siegbahn, ESCA applied to free molecules, North-Holland Publishing Company, Amsterdam, North-Holland, 1971 Search PubMed.
- N. Kurahashi, S. Thürmer, S. Y. Liu, Y. Yamamoto, S. Karashima, A. Bhattacharya, Y. Ogi, T. Horio and T. Suzuki, Design and characterization of a magnetic bottle electron spectrometer for time-resolved extreme UV and X-ray photoemission spectroscopy of liquid microjets, Struct. Dyn., 2021, 8, 034303 CrossRef CAS PubMed.
- I. Jordan, A. Jain, T. Gaumnitz, J. Ma and H. J. Wörner, Photoelectron spectrometer for liquid and gas-phase attosecond spectroscopy with field-free and magnetic bottle operation modes, Rev. Sci. Instrum., 2018, 89, 053103 CrossRef PubMed.
- M. N. Pohl, C. Richter, E. Lugovoy, R. Seidel, P. Slavíček, E. F. Aziz, B. Abel, B. Winter and U. Hergenhahn, Sensitivity of Electron Transfer Mediated Decay to Ion Pairing, J. Phys. Chem. B, 2017, 121, 7709–7714 CrossRef CAS PubMed.
- W. A. Armstrong, B. A. Black and D. W. Grant, THE RADIOLYSIS OF AQUEOUS CALCIUM BENZOATE AND BENZOIC ACID SOLUTIONS, J. Phys. Chem., 1960, 64, 1415–1419 CrossRef CAS.
- J. H. D. Eland, O. Vieuxmaire, T. Kinugawa, P. Lablanquie, R. I. Hall and F. Penent, Complete Two-Electron Spectra in Double Photoionization: The Rare Gases Ar, Kr, and Xe, Phys. Rev. Lett., 2003, 90, 053003 CrossRef CAS PubMed.
- F. Penent, J. Palaudoux, P. Lablanquie, L. Andric, R. Feifel and J. H. D. Eland, Multielectron Spectroscopy: The Xenon 4 d Hole Double Auger Decay, Phys. Rev. Lett., 2005, 95, 083002 CrossRef CAS PubMed.
- S. Malerz, F. Trinter, U. Hergenhahn, A. Ghrist, H. Ali, C. Nicolas, C.-M. Saak, C. Richter, S. Hartweg, L. Nahon, C. Lee, C. Goy, D. M. Neumark, G. Meijer, I. Wilkinson, B. Winter and S. Thürmer, Low-energy constraints on photoelectron spectra measured from liquid water and aqueous solutions, Phys. Chem. Chem. Phys., 2021, 23, 8246–8260 RSC.
- P. Kruit and F. H. Read, Magnetic field paralleliser for 2π electron-spectrometer and electron-image magnifier, J. Phys. E: Sci. Instrum., 1983, 16, 313–324 CrossRef CAS.
- K. Fehre, D. Trojanowskaja, J. Gatzke, M. Kunitski, F. Trinter, S. Zeller, L. Ph, H. Schmidt, J. Stohner, R. Berger, A. Czasch, O. Jagutzki, T. Jahnke, R. Dörner and M. S. Schöffler, Absolute ion detection efficiencies of microchannel plates and funnel microchannel plates for multi-coincidence detection, Rev. Sci. Instrum., 2018, 89, 045112 CrossRef CAS PubMed.
- H. Shinotsuka, B. Da, S. Tanuma, H. Yoshikawa, C. J. Powell and D. R. Penn, Calculations of electron inelastic mean free paths. XI. Data for liquid water for energies from 50 eV to 30 keV: Calculations of electron inelastic mean free paths, Surf. Interface Anal., 2017, 49, 238–252 CrossRef CAS PubMed.
- M. Fournier, L. Huart, C. Nicolas and J. Palaudoux, Study of molecules of biological interest solvated in liquid micro-jet by coincidence electron spectroscopy, accepted to EPJ.
- L. Huart, Sorbonne University, 2022.
- N. Ottosson, A. O. Romanova, J. Söderström, O. Björneholm, G. Öhrwall and M. V. Fedorov, Molecular Sinkers: X-ray Photoemission and Atomistic Simulations of Benzoic Acid and Benzoate at the Aqueous Solution/Vapor Interface, J. Phys. Chem. B, 2012, 116, 13017–13023 CrossRef CAS PubMed.
- N. Ottosson, E. Wernersson, J. Söderström, W. Pokapanich, S. Kaufmann, S. Svensson, I. Persson, G. Öhrwall and O. Björneholm, The protonation state of small carboxylic acids at the water surface from photoelectron spectroscopy, Phys. Chem. Chem. Phys., 2011, 13, 12261 RSC.
- E. E. Rennie, B. Kempgens, H. M. Köppe, U. Hergenhahn, J. Feldhaus, B. S. Itchkawitz, A. L. D. Kilcoyne, A. Kivimäki, K. Maier, M. N. Piancastelli, M. Polcik, A. Rüdel and A. M. Bradshaw, A comprehensive photoabsorption, photoionization, and shake-up excitation study of the C 1s cross section of benzene, J. Chem. Phys., 2000, 113, 7362–7375 CrossRef CAS.
| This journal is © the Owner Societies 2023 |