 Open Access Article
An experimental and computational investigation of the elusive anhydrous form of Oxyma-B†
Rafel
Prohens
 *ag,
Rafael
Barbas
 a,
Beatriz G.
de la Torre
d,
Fernando
Albericio
 *bce and
Antonio
Frontera
 *f
*f
aUnitat de Polimorfisme i Calorimetria, Centres Científics i Tecnològics, Universitat de Barcelona, Baldiri Reixac 10, 08028 Barcelona, Spain. E-mail: rafel_prohens@ub.edu
bCIBER-BBN, Networking Centre on Bioengineering, Biomaterials and Nanomedicine, and Department of Organic Chemistry, University of Barcelona, Martí i Franqués 1-11, 08028 Barcelona, Spain
cInstitute for Advanced Chemistry of Catalonia (IQAC-CSIC), 08034 Barcelona, Spain
dKwaZulu-Natal Research Innovation and Sequencing Platform (KRISP), School of Laboratory Medicine and Medical Sciences, College of Health Sciences, University of KwaZulu-Natal, Durban, KwaZulu-Natal 4041, South Africa
ePeptide Science Laboratory, School of Chemistry and Physics, University of KwaZulu-Natal, Westville, KwaZulu-Natal 4000, South Africa
fDepartament de Química, Universitat de les Illes Balears, Crta. de Valldemossa km 7.5, 07122 Palma, Spain
gLaboratory of Organic Chemistry, Faculty of Pharmacy and Food Sciences, University of Barcelona, Avda. Joan XXIII, 08028 Barcelona, Spain
First published on 20th September 2023
Abstract
We report the crystal structure of the anhydrous form of Oxyma-B, a relevant racemization suppressor for peptide synthesis, solved by direct space methodologies with X-Ray Powder Diffraction data. The structure had remained elusive since only monohydrate crystals are readily obtained from slow crystal growth experiments. An extensive combined experimental and computational study has allowed us to obtain deeper insight into the solid-state landscape of Oxyma-B and its tendency for hydration. The singular network of H-bonds and energetically relevant O⋯π interactions formed by the two symmetrically independent molecules of anhydrous Oxyma-B has been analysed by using the quantum theory of “atoms-in-molecules” (QTAIM) and the noncovalent interaction plot (NCIplot).
1. Introduction
There is an significant increase in the number of peptide-based drugs.1 Thus, from 2016, the US Food and Drug Administration (FDA) has approved approximately 350 new drugs, of which 29 are peptides, which represents 8% of the total drug market.2 Most of the corresponding peptide-based active pharmaceutical ingredients (APIs) are prepared chemically. The key step in the synthesis of a peptide is the formation of a peptide bond.3,4 The most used strategy for doing that is the use of carbodiimides in the presence of N-hydroxy derivatives as coupling additives, which leads to the corresponding active species of the protected amino acids and modulates the high reactivity of the carbodiimides.5 OxymaPure and its derivatives are the coupling additives of choice, because their active esters show high reactivity and low tendency for racemization.6 In terms of racemization, Oxyma-B, a cyclic version of OxymaPure based on the barbituric acid, has been demonstrated to be the best in reducing racemization.7,8 Some of us reported previously the crystal structure of the monohydrate form of Oxyma-B and analyzed relevant hydrogen bonding and aromatic interactions present in the structure.7,9 However, the polymorphism landscape of Oxyma-B remains incomplete, a fact that combined with the presence of a diversity of donor and acceptor functional groups in its structure motivated the solid-state investigation reported in this work.In the context of polymorphism, hydrogen bonding (HB)10 can be considered the most studied interaction, but it has been demonstrated that lone-pair⋯π (LP⋯π) interactions, defined as non-covalent interactions between a neutral electron-rich molecule and an electron-poor aromatic ring, can play a major role as a cohesive force of organic compounds in the solid-state. Since Egli and Gessner11 suggested that LP(O)⋯π interactions play a relevant role in the stabilization of Z-DNA, there has been evidence in many other biological systems of the interaction stabilizing DNA and protein structures, and participating in the formation of DNA–protein complexes.12
Moreover, some studies describing O⋯π interactions in pharmaceutical cocrystals like caffeine with citric acid13 and bosentan with succinic acid14 have been recently reported.
Oxyma-B contains an interesting combination of an electron-poor π ring surrounded by very good hydrogen bond donor and acceptor groups, which provides a versatile scaffold potentially able of a variety of aromatic interactions.
Herein, we report experimental evidence for the polymorphism of the anhydrous Oxyma-B deduced from alternating thermal analysis and the crystal structure solved by direct space approaches with the X-Ray Powder Diffraction data of its only isolable polymorph under normal conditions. The strong tendency to hydrate formation of Oxyma-B has been studied experimentally, and a computational analysis of the intermolecular interactions shown by both the monohydrate and the anhydrous forms provides a rationalization based on DFT calculations, the quantum theory of atoms-in-molecules (QTAIM), molecular electrostatic potential (MEP) surfaces and the noncovalent interaction plot (NCIPlot) computational tools.
2. Materials and methods
2.1. Materials
Oxyma-B used in this study was provided by Luxembourg Bio Technologies (Ness Ziona, Israel), and was prepared by following the previously described procedures by our group.72.2. Differential scanning calorimetry (DSC)
Differential Scanning Calorimetry analysis was carried out by means of a Mettler-Toledo DSC-822e calorimeter (experimental conditions: aluminum crucibles of 40 μL volume, an atmosphere of dry nitrogen with a 50 mL min−1 flow rate, heating rates of 1 and 10 °C min−1). The calorimeter was calibrated with indium of 99.99% purity (m.p.: 156.8 °C, ΔH: 28.59 J g−1).2.3. Alternating differential scanning calorimetry (ADSC)
ADSC allows distinguishing between overlapping thermal events by separating the heat flow into reversing and non-reversing heat flow components. A Mettler-Toledo DSC 822e calorimeter was used to collect the data and ADSC evaluations were performed using STARe software version 16.10. The underlying heating rate used was 1 °C min−1, and the modulation period and the amplitude were 60 s and 1 °C respectively, using nitrogen as the purge gas. For sinusoidal temperature modulation (ADSC), the temperature T is given by eqn (1):15T = T0 + βt + AT![[thin space (1/6-em)]](https://www.rsc.org/images/entities/char_2009.gif) sin(ωt) sin(ωt) | (1) |
2.4. Thermogravimetric analysis (TGA)
Thermogravimetric analysis was performed on a Mettler-Toledo TGA-851e thermobalance (experimental conditions: alumina crucibles of 70 μL volume, an atmosphere of dry nitrogen with a 50 mL min−1 flow rate, heating rate of 10 °C min−1).2.5. Dynamic vapor sorption (DVS)
The water sorption and desorption processes were measured on a DVS-1000 instrument from Surface Measurement Systems. The samples were mounted on a balance and studied over a humidity range from 0% to 90% RH, and then decreased to 0% RH at 25 °C using a two-cycle method. The equilibrium conditions for each step were set to a mass constancy of ±0.001% over 60 min and a maximum time limit of 1440 min.2.6. X-ray powder diffraction analysis (XRPD)
X-ray powder diffraction patterns of Oxyma-B were obtained on a PANalytical X'Pert PRO MPD diffractometer in transmission configuration using Cu Kα radiation (λ = 1.5418 Å) with a focusing elliptical mirror and a PIXcel detector working at a maximum detector's active length of 3.347°. Configuration of convergent beam with a focalizing mirror and a transmission geometry with flat sample sandwiched between low absorbing films measuring from 2 to 70° in 2θ, with a step size of 0.013° 2θ and a total measuring time of 2 hours at room temperature (298 K).2.7. Computational details
The best solution for the Oxyma-B anhydrous form by the direct space methodology conducted with the FOX software was subjected to geometry optimization by DFT16,17 periodic calculations performed within the generalized gradient approximation (GGA),18 as provided by the module CASTEP19 in Materials Studio software,20 using a basis set cutoff energy of 520 eV, ultrasoft pseudopotentials,21 PBE functional,18 semi-empirical dispersion corrections (Grimme),22 fixed unit cell and periodic boundary conditions. The validation of the structure23,24 was conducted through a second calculation starting from the optimized structure obtained in the previous step by using the same DFT parameters but setting the unit cell parameters free. Atomic displacement RMSD values were calculated to assess the reliability of the optimization.For the DFT calculations of the supramolecular assemblies, we have used the PBE0-D3/def2-TZVP level of theory and the Gaussian-16 program.25–27 This combination of functional and basis set has been used successfully in previous studies of noncovalent interactions in the solid state, including π-stacking and lone pair–π interactions.28 The binding energies were computed as the difference between the energy of the assembly and the sum of the energies of the isolated monomers. The energies have been corrected for the basis set superposition error.29 The MEP surfaces were generated using the 0.001 isosurface to emulate the van der Waals envelope. The QTAIM30 and NCIPlot31 analyses were performed and represented at the same level using the AIMAll program.32 The NCIplot method31 is convenient to use for revealing interactions in real space. It uses the reduced density gradient isosurfaces and a colour code (based on the sign of the second eigenvalue of ρ, λ2) to identify the attractive or repulsive nature of the interactions. Blue and green colours are used here to identify the strongly and moderately attractive interactions, respectively.
3. Results and discussion
3.1. Thermal and hydration behavior of anhydrous Oxyma-B
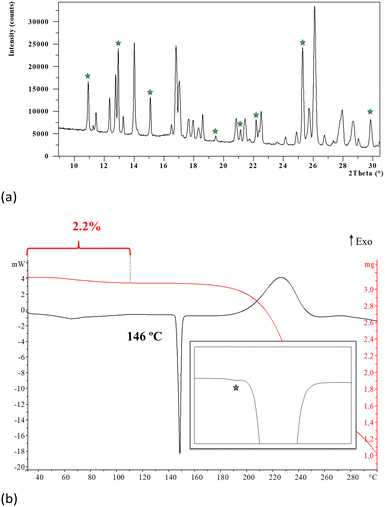
The analysis of the synthesis product by XRPD revealed that it is obtained as a mixture of phases since most of the characteristic peaks of the monohydrate of Oxyma-B were readily detected together with other non-identified diffraction peaks. The monohydrate of Oxyma-B had been previously reported and its structure can be found in the CCDC with WOWFUL refcode, (see the ESI† for further details, Fig. S4).On the other hand, thermogravimetric analysis of the synthesis product showed a weight loss between 30 and 112 °C of 2.2%, which is lower than the calculated amount of water of the pure monohydrate (8.9%), which suggested that the synthesis product is a mixture of the monohydrate and an anhydrous phase. The DSC analysis shows the expected endotherm corresponding to the evaporation of the crystallization water followed by the melting of the anhydrous form at 146 °C, (see the ESI† for further details, Fig. S1 and S2). When analyzed in detail, an additional and small endothermic phenomenon was observed (Fig. 1b), suggesting the presence of polymorphism in the anhydrous form.
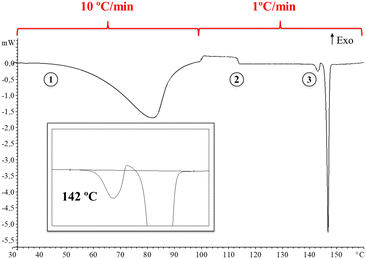
Thus, in order to obtain deeper insight into it, a DSC analysis of the synthesis product was carried out at a heating rate of 10 °C min−1 until 100 °C followed by a heating rate of 1 °C min−1 until 160 °C. Fig. 2 shows the DSC thermogram displaying a change in heat capacity process at 113 °C (ΔCp: 4.9 J g−1 K−1) followed by melting-crystallization-melting overlapped and consecutive phenomena at 142 °C (see ESI† for further details, Fig. S5).
Moreover, a modulated DSC experiment was performed with the ADSC method implemented in the Mettler STARe software. Modulation of the temperature program generates periodic curves, which allows the separation of superimposed effects and the discrimination between reversing and non-reversing heat flows. Fig. 3 shows the total, reversing and non-reversing curves at an underlying heating rate of 1 °C min−1. Interestingly, the change in heat capacity at 107 °C is observed in the non-reversing component of the heat flow (point 1, Fig. 3) and no cold crystallization is observed prior to the first melting point, which suggests that a thermal solid phase rearrangement occurs after the material is dehydrated (the same phenomenon observed in conventional DSC at a heating rate of 1 °C min−1). Moreover, the melting phenomenon can be seen now as a consecutive collection of endotherms, which confirms the presence of polymorphism. It is accepted that when running ADSC experiments at low mean heating rates, close events can be better separated as it is the case.
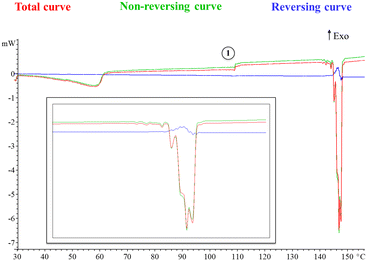 | ||
| Fig. 3 Different curves that can be derived from the ADSC modulated heat flow curve (see the ESI† for further details, Fig. S6). Enlargement is also included for clarity. | ||
However, attempts for the isolation of the non-identified solid form by means of a battery of crystallizations in 30 solvents at 25 °C were unsuccessful (a list of tested solvents can be found in the ESI†), yielding in all cases either single crystals of the monohydrate form or polycrystalline mixtures.
DVS was used to obtain additional data about the dehydration process. Fig. 4 shows the two cycles of sorption and desorption at 25 °C conducted with the synthesis product. They revealed on one hand that the fully dehydrated sample at 0% RH absorbed the required amount of water to transform into the monohydrate form just by increasing the relative humidity from 0 to 60%, and on the other hand, a postulated dihydrate is produced when the relative humidity is increased up to 90%. Both hydration processes are reversible, (Fig. 4) and this phenomenon provides an explanation for why all the crystallization experiments always produced the monohydrate form in our laboratory. A closer look at the first sorption curve revealed that first a small amount of water (∼1%) is absorbed between 0 and 30% (step 1, Fig. 4) and then the remaining humidity required to form the monohydrate is absorbed between 40 and 60% RH (step 2). This is consistent with the fact that the synthesis product is a mixture of the monohydrate and anhydrous forms and with the TGA analysis, which showed only 2.2% weight loss and suggests that the monohydrate is converted into an amorphous form upon dehydration at 0% RH and then it is readily converted again into the monohydrate at low relative humidity values. This is followed by the hydration of the remaining anhydrous crystalline form at higher relative humidity. Finally, a dihydrate is presumably formed between 70 and 90% RH (step 3). The first desorption curve shows the conversion back into the monohydrate (step 4) and subsequently into the amorphous form (step 5). Finally, the second sorption curve shows the full formation into the monohydrate in one single step between 10 and 30% RH (step 6), confirming our initial hypothesis.
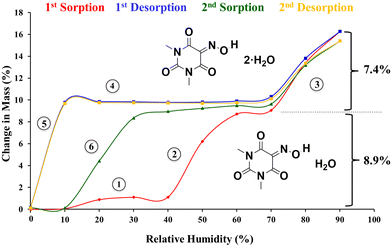 | ||
| Fig. 4 DVS isotherms of Oxyma-B (synthesis product) showing the formation of the monohydrate form (theoretical water sorption: 8.9%) and dihydrate form (theoretical water sorption: 16.3%). | ||
Thus, since no decomposition was observed we heated up the synthesis product in a TGA furnace under a nitrogen flow until 125 °C for 10 minutes and cooled down to 30 °C. Then, the sample was removed from the alumina crucible and transferred quickly to a vial, purged intensively with dry nitrogen to avoid hydration and immediately measured by XRPD in transmission configuration with the sample isolated from air during measurement.
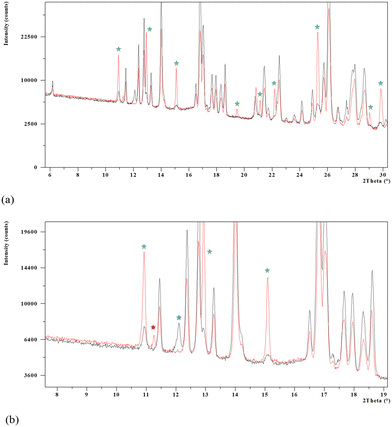
The XRPD analysis and subsequent indexation of the diffractogram allowed us to determine that a single solid form, although impurified by traces of the monohydrate and other crystalline forms, was obtained. Fig. 5a shows comparative diffractograms of the new solid form and the synthesis product showing the characteristic peaks of monohydrate Oxyma-B (green stars). An enlargement from 6 to 19° in 2θ (Fig. 5b) shows peaks assigned to postulated form B (blue star) and form C (red star) initially present in the synthesis product powder that disappeared after heating in the TGA furnace.
3.2. Structure determination by direct space methods
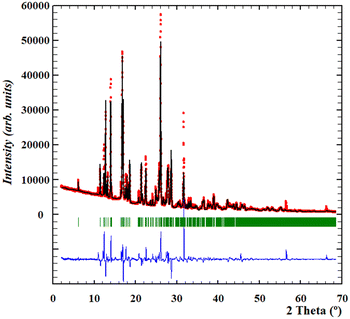
Thus, since a high quality diffractogram of the anhydrous form had been obtained, we focused on the resolution of its crystal structure by means of direct-space methodologies.33The structure determination of anhydrous Oxyma-B from powder X-ray diffraction data was carried out using high statistics and good resolution transmission powder diffraction data. Since the presence of some impurities in the diffractogram could potentially hinder the indexing procedure, the powder diffractogram was indexed out without selecting the impurity peaks mentioned above to a monoclinic cell of about 1554 Å3 by means of Dicvol04,34,35 (figures of merit: M = 62, F = 179) and validated with a Le Bail fit of the data using FullProf36 (goodness of fit: Rwp: 6.89, Rexp: 1.69; χ2 = 16.6) (see the ESI† for further details, Fig. S9). The space group was deduced as P21/c from the systematic absences and confirmed with the SGAid program of the DAJUST37 software. According to the estimated density value (1.51 Mg m−3) (the value reported in WOWFUL), the asymmetric unit was assumed to contain two molecules of Oxyma-B (Z = 8). The structure solution was carried out by direct space methodologies starting from a molecular model optimized by DFT with SPARTAN38 by means of the program FOX39 with the parallel tempering algorithm. The used background (estimated from a set of experimentally read points and interpolated) and the resulting cell, zero error and shape parameters of the Le Bail fit were used in the structure solution procedure with FOX. Several trials of 20 million runs were performed. The best solution (based on the Rwp value) was refined by the Rietveld method using FullProf,36 in combination with DFT calculations (see the ESI† for further details, Fig. S10 and S11) in order to improve through geometry optimization of the planarity of the aromatic rings and to locate the hydrogen atomic coordinates. Fig. 6 depicts the final Rietveld plot. A summary of the crystal data with relevant refinement parameters is given in Table 1. Finally, the atomic coordinates (together with the cell parameters) were subjected to optimization by DFT calculations, aiming to validate the crystal structure (see the ESI† for RMSD values).
| Crystal form | Anhydrous Oxyma-B |
|---|---|
| T (K) | 298 |
| System | Monoclinic |
| Space group | P21/c |
| a (Å), b (Å), c (Å) | 15.9305(5), 7.0439(2), 15.4405(6) |
| α (°), β (°), γ (°) | 90, 116.292(3), 90 |
| Volume (Å3) | 1553.37(10) |
| Z | 8 |
| R (%) | 11.9 |
3.3. Structural description of the anhydrous Oxyma-B crystal structure
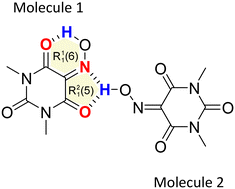
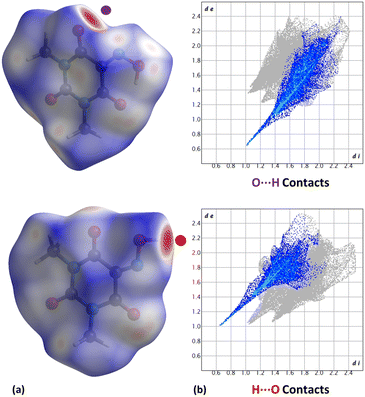
Anhydrous Oxyma-B crystallizes in the monoclinic P21/c space group and the crystal structure has two independent molecules in the asymmetric unit (Z' = 2; Z = 8). Interestingly, molecule 1 establishes a strong intramolecular hydrogen bond between the hydroxamic and the carbonyl groups, forming a R11(6) motif in the graph-set assignments, while molecule 2 establishes an intermolecular hydrogen bond with both the hydroxamic nitrogen and the carbonylic oxygen, forming a R21(5) supramolecular synthon (Fig. 7).We have analyzed the most relevant intermolecular interactions in the structure by means of the Hirshfeld surface calculation40 and the associated fingerprint plot41,42 by using the CrystalExplorer software.43Fig. 8 highlights the intermolecular hydrogen bonds for each symmetrically independent molecule on the Hirshfeld surface as red areas, together with the reciprocal H⋯O and O⋯H contacts as sharp spikes on the fingerprint plots. Weaker interactions are shaded in the figure but they reveal a very different packing environment for each molecule.
A search of structures related to Oxyma-B in the Cambridge Structural Database (Version 5.43, 2022) revealed that only 8 structures show the R11(6) interaction motif and 6 structures show the R21(5) supramolecular synthon out of the 28 crystal structures found (see ESI,† Table S1 for search details and CCDC refcodes). Thus, the crystal structure was subjected to a specific computational analysis of intermolecular interactions of both synthons as described in the following sections.
3.4. DFT calculations
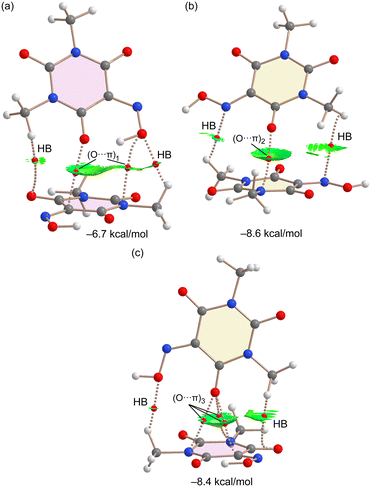
As said before, the anhydrous form of Oxyma-B presents two symmetrically independent molecules in the asymmetric unit, one with intramolecular OH⋯O and another one where the OH group points to an adjacent molecule. In addition, the acidic six-membered ring of Oxyma-B concurrently participates in O⋯π interactions involving the carbonyl O-atoms, as presented in Fig. 9, with short O⋯π distances (<3 Å). Although the ring is not aromatic and the six bonds are, in principle, single bonds, we have used O⋯π to denote this type of bonding due to the participation of the π-system of the carbonyl group and also the partial conjugation of the N-atoms of the ring with the carbonyl groups. Three different interaction modes are observed, as indicated in Fig. 9. The first one is denoted as (O⋯π)1 and it is formed between symmetrically equivalent (highlighted in pale pink) molecules (both with the intramolecular H-bond). The interacting O-atom (O4A) is also involved in the intramolecular H-bond. (O⋯π)2 is also established between symmetrically equivalent molecules (highlighted in beige colour, both lacking the intramolecular H-bond). In this case, the O2B-atom establishes the O⋯π interaction. Finally, the (O⋯π)3 binding mode is established between both symmetrically independent molecules and it is the O4B-atom that participates in the O⋯π interaction. This is the binding mode that presents the shortest distance (2.679 Å), whilst the longest interaction corresponds to the (O⋯π)1 binding mode, likely due to the intramolecular H-bond that reduces the nucleophilicity of this O-atom, as further analyzed below.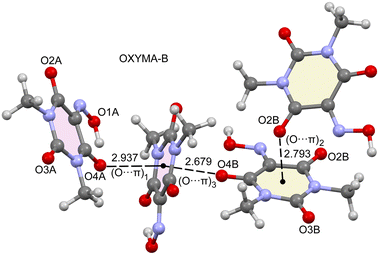 | ||
| Fig. 9 Partial view of the X-ray structure of Oxyma-B with the indication of the different O⋯π binding modes. Distances are in Å. | ||
At this point, it seems to be convenient to compare the structure of Oxyma-B to those of the hydrated forms available in the CCDC (refcodes LEFLIV and WOWFUL). Fig. 10 shows partial views of the X-ray structures of LEFLIV (oxonium salt) and WOWFUL (hydrated) forms. In case of LEFLIV, 1D infinite supramolecular assemblies are formed in the solid state where the rings are stacked in a displaced parallel manner, where the O-atom of the deprotonated oxime group is located over one C-atom of the ring (3.211 Å). In LEFLIV, likely due to the anionic nature of the ring, the propensity to establish O⋯π interactions is reduced in comparison to the one reported herein. In the case of the monohydrated form WOWFUL, each ring establishes two concurrent O⋯π interactions, one with the O-atom of the water molecule and the other one with a carbonyl O-atom of an adjacent Oxyma-B ring, at the opposite site. The distances of the O⋯π contacts in WOWFUL are very similar to those found in the one reported herein. This confirms the ability of the ring to participate in this type of interaction. A more comprehensive analysis of the O⋯π interactions in WOWFUL can be found in the original publication.9
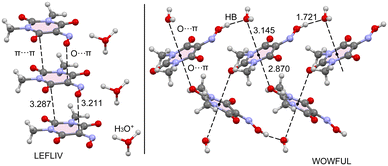 | ||
| Fig. 10 Partial views of the X-ray structures of CSD refcodes LEFLIV (left) and WOWFUL (right). Distances are given in Å. | ||
The MEP surfaces of both optimized molecules of Oxyma-B (molecule 1 and molecule 2) have been initially determined, to investigate how the H-bond influences the acidity of the ring and the nucleophilicity of the O-atoms. The MEP plots are shown in Fig. 11, evidencing that the MEP value over the center of the ring is more positive for molecule 1 likely due to the electron transfer from the O-atom to the H-atom. In fact, the MEP maximum in molecule 1 is located over the ring center (33.9 kcal mol−1). In the molecule where the intramolecular H-bond is not formed, the MEP maximum is obviously located at the H-atom of the oxime group (59 kcal mol−1). The MEP minimum is located in both molecules at O2 due to the presence of an adjacent N-atom (both N and O lone pairs converge to the same spatial region). The MEP value at O4 is very different in both molecules (−12.5 and −33.3 kcal mol−1) due to the presence/absence of the intramolecular H-bonding interaction. The MEP value at O3 is also similar in both molecules. This analysis agrees well with the long O⋯π distance observed in (O⋯π)1 due to the poor nucleophilicity of the O4A atom. The energy difference between both conformers is also indicated (7.1 kcal mol−1), which can be understood as the energetic contribution of the intramolecular OH⋯O H-bond.
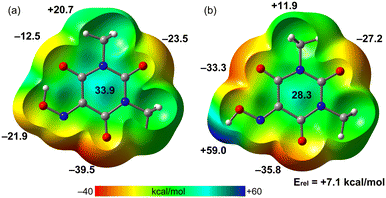 | ||
| Fig. 11 MEP surfaces of molecule 1 (a) and molecule 2 (b) of Oxyma-B at the PBE0-D3/def2-TZVP level of theory. The values are indicated in kcal mol−1. | ||
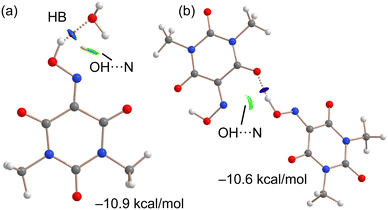
As indicated above, the anhydrous form of Oxyma-B is very difficult to obtain in pure form by crystallization. To rationalize this issue, we have optimized the intermolecular complex formed with Oxyma-B and water to compare the strength of the intermolecular OH⋯OH2 H-bond with the intramolecular one (estimated by the energy difference between both conformers). The result is indicated in Fig. 12a along with the QTAIM and NCIplot analyses. It can be observed the presence of a strong OH⋯O H-bond characterized by a bond critical point, a bond path and dark blue reduced density gradient (RDG) isosurface. In this work, green and blue are used for attractive (weak and strong, respectively) interactions and red and yellow for repulsive. The NCIPlot analysis also reveals a secondary H⋯N interaction between one H-atom of water and the N-atom of the oxime group, characterized by a green RDG isosurface. Moreover, some O⋯N repulsion is also evidenced by the color of the RDG isosurface. The interaction energy is −10.9 kcal mol−1, which is lower than that of the intramolecular H-bond (−7.1 kcal mol−1) and can be related with the tendency of Oxyma-B to hydrate. Moreover, we have also computed, using the X-ray geometry, the intermolecular OH⋯O H-bonding complex that is formed between both symmetrically independent molecules (see Fig. 12b). Interestingly, the H-bonding energy is slightly smaller (−10.6 kcal mol−1) than that of the water complex. The combined QTAIM/NCIplot analysis confirms the strong nature of the OH⋯O H-bond (dark blue RDG isosurface) and also the existence of a secondary (weak) OH⋯N interaction characterized by a green RDG isosurface.
The three O⋯π binding modes have been evaluated using dimeric models of the assemblies and characterized using a combination of QTAIM and NCIplot computational tools. The results are shown in Fig. 13, showing the dimerization energies ranging from −6.7 kcal mol−1 for (O⋯π)1 to −8.6 kcal mol−1 for (O⋯π)2. Moreover, the energetic results show that (O⋯π)2 and (O⋯π)3 binding modes are almost isoenergetic. The combined QTAIM/NCIPlot analysis confirms the existence of the O⋯π(C![[double bond, length as m-dash]](https://www.rsc.org/images/entities/char_e001.gif) O) interactions in the three dimers, characterized by one bond critical point (BCP) and bond path (dashed bonds) connecting the carbonyl O-atom to one C/N atom of the six membered ring in (O⋯π)1 and (O⋯π)2 binding modes. For the (O⋯π)3 binding mode, the O-atom is connected to three C/N-atoms of the ring by BCPs and bond paths. The reduced density gradient (RDG) isosurfaces are useful for revealing the interactions in real space. In all cases, green (attractive) RDG isosurfaces exist, embracing most of the region between the ring and the interacting O-atom. This type of isosurface is typical in π-based interactions like ion–π, CH⋯π, π⋯π, etc. The QTAIM/NCIPlot analysis also discloses the presence of ancillary contacts in all dimers. Most of them are weak CH⋯O/N contacts involving the H-atoms of the methyl groups and characterized by the corresponding BCPs, bond paths and green RDG isosurfaces connecting the H atoms to the heteroatoms. In the case of the (O⋯π)1 dimer, an additional BCP and bond path connect the hydroxyl O-atom to the N-atom of the ring, thus revealing the formation of an extra O⋯π contact.
O) interactions in the three dimers, characterized by one bond critical point (BCP) and bond path (dashed bonds) connecting the carbonyl O-atom to one C/N atom of the six membered ring in (O⋯π)1 and (O⋯π)2 binding modes. For the (O⋯π)3 binding mode, the O-atom is connected to three C/N-atoms of the ring by BCPs and bond paths. The reduced density gradient (RDG) isosurfaces are useful for revealing the interactions in real space. In all cases, green (attractive) RDG isosurfaces exist, embracing most of the region between the ring and the interacting O-atom. This type of isosurface is typical in π-based interactions like ion–π, CH⋯π, π⋯π, etc. The QTAIM/NCIPlot analysis also discloses the presence of ancillary contacts in all dimers. Most of them are weak CH⋯O/N contacts involving the H-atoms of the methyl groups and characterized by the corresponding BCPs, bond paths and green RDG isosurfaces connecting the H atoms to the heteroatoms. In the case of the (O⋯π)1 dimer, an additional BCP and bond path connect the hydroxyl O-atom to the N-atom of the ring, thus revealing the formation of an extra O⋯π contact.
4. Conclusions
We have studied the polymorph landscape of Oxyma-B by combining Thermal Analysis, Dynamic Vapour Sorption and X-ray Powder Diffraction techniques and evidenced the high tendency of the compound to hydration. This makes the preparation of its elusive anhydrous phase in pure form very difficult and its crystal structure had to be solved by direct space methods from high quality diffractograms containing traces of the monohydrate. This has allowed us to provide for the first time the crystal structure of the anhydrous form of Oxyma-B. Additional DFT calculations evidence the ability of Oxyma-B to form O⋯π interactions in the solid state, even in the absence of a real π-system (non-aromatic ring). The MEP surface analysis confirms the existence of a region of positive electrostatic potential located above and below the center of the ring, which is common in electron-deficient aromatic rings, allowing the interaction with electron-rich atoms and dictating the 3D solid state architecture of this compound in cooperation with HBs. The energetic analysis of intermolecular interactions confirms the strong nature of the O⋯π interaction and also agrees with the tendency of Oxyma-B to readily form hydrates.Conflicts of interest
There are no conflicts to declare.Acknowledgements
We thank the MICIU/AEI of Spain (projects PID2020-115637GB-I00, TED2021-130946B-100, FEDER funds) for funding and also the CTI (UIB) for computational facilities. We thank Yoav Luxembourg (Luxembourg Bio Technologies, Ness Ziona, Israel) for encouraging this kind of research.Notes and references
- V. D'Aloisio, P. Dognini, G. A. Hutcheon and G. A. Coxon, Drug Discovery Today, 2021, 26, 1409–1419 CrossRef PubMed.
- O. Al Musaimi, D. Al Shaer, F. Albericio and B. G. de la Torre, Pharmaceuticals, 2023, 16, 336 CrossRef PubMed.
- I. Abdelmoty, F. Albericio, L. A. Carpino, B. F. Foxman and S. A. Kates, Lett. Pept. Sci., 1994, 1, 57–67 CrossRef CAS.
- F. Albericio and A. El-Faham, Org. Process Res. Dev., 2018, 22, 760–772 CrossRef CAS.
- S. R. Manne, D. C. Akintayo, O. Luna, A. El-Faham, B. G. de la Torre and F. Albericio, Org. Process Res. Dev., 2022, 26, 2894–2899 CrossRef CAS.
- R. Subirós-Funosas, R. Prohens, R. Barbas, A. El-Faham and F. Albericio, Chem. – Eur. J., 2009, 15, 9394–9403 CrossRef PubMed.
- Y. E. Jad, S. N. Khattab, B. G. de la Torre, T. Govender, H. G. Kruger, A. El-Faham and F. Albericio, Org. Biomol. Chem., 2014, 12, 8379–8385 RSC.
- A. Orlandin, I. Guryanov, L. Ferrazzano, B. Biondi, F. Biscaglia, C. Storti, M. Rancan, F. Formaggio, A. Ricci and W. Cabri, Molecules, 2022, 27, 4235 CrossRef CAS PubMed.
- R. Banik, S. Roy, A. Bauza, A. Frontera and S. Das, RSC Adv., 2015, 5, 10826–10836 RSC.
- T. Steiner, Angew. Chem., Int. Ed., 2002, 41, 48–76 CrossRef CAS.
- M. Egli and R. Gessner, Proc. Natl. Acad. Sci. U. S. A., 1995, 92, 180–184 CrossRef CAS PubMed.
- J. Novotný, S. Bazzi, R. Marek and J. Kozelka, Phys. Chem. Chem. Phys., 2016, 18, 19472–19481 RSC.
- P. Verma, A. Srivastava, K. Srivastava, P. Tandon and M. R. Shimpi, Front. Chem., 2021, 9, 708538 CrossRef CAS PubMed.
- R. Barbas, A. Portell, C. A. Hunter, R. Prohens and A. Frontera, CrystEngComm, 2022, 24, 5105–5111 RSC.
- Z. Jiang, J. M. Hutchinson and C. T. Imrie, Polym. Int., 1998, 47, 72–75 CrossRef CAS.
- P. Hohenberg and W. Kohn, Phys. Rev. A, 1964, 136, B864 CrossRef.
- W. Kohn and L. J. Sham, Phys. Rev. A, 1965, 140, A1133 CrossRef.
- J. P. Perdew, K. Burke and M. Ernzerhof, Phys. Rev. Lett., 1997, 78, 1396 CrossRef CAS.
- S. J. Clark, M. D. Segall, C. J. Pickard, P. J. Hasnip, M. J. Probert, K. Refson and M. C. Payne, Z. Kristallogr., 2005, 220, 567–570 CAS.
- Materials Studio, version 7.0, Accelrys Software, Inc., San Diego, CA, USA, 2013 Search PubMed.
- D. Vanderbilt, Phys. Rev. B: Condens. Matter Mater. Phys., 1990, 41, 7892–7895 CrossRef PubMed.
- S. Grimme, J. Comput. Chem., 2006, 27, 1787–1799 CrossRef CAS PubMed.
- J. van de Streek and M. A. Neumann, Acta Crystallogr., Sect. B: Struct. Sci., Cryst. Eng. Mater., 2014, 70, 1020–1032 CrossRef CAS.
- J. van de Streek and M. A. Neumann, Acta Crystallogr., Sect. B: Struct. Sci., 2010, 66, 544–558 CrossRef CAS PubMed.
- (a) C. Adamo and V. Barone, J. Chem. Phys., 1999, 110, 6158–6170 CrossRef CAS; (b) S. Grimme, J. Antony, S. Ehrlich and H. Krieg, J. Chem. Phys., 2010, 132, 154104–154118 CrossRef PubMed.
- F. Weigend and R. Ahlrichs, Phys. Chem. Chem. Phys., 2005, 7, 3297–3305 RSC.
- M. J. Frisch, G. W. Trucks, H. B. Schlegel, G. E. Scuseria, M. A. Robb, J. R. Cheeseman, G. Scalmani, V. Barone, G. A. Petersson, H. Nakatsuji, X. Li, M. Caricato, A. V. Marenich, J. Bloino, B. G. Janesko, R. Gomperts, B. Mennucci, H. P. Hratchian, J. V. Ortiz, A. F. Izmaylov, J. L. Sonnenberg, D. Williams-Young, F. Ding, F. Lipparini, F. Egidi, J. Goings, B. Peng, A. Petrone, T. Henderson, D. Ranasinghe, V. G. Zakrzewski, J. Gao, N. Rega, G. Zheng, W. Liang, M. Hada, M. Ehara, K. Toyota, R. Fukuda, J. Hasegawa, M. Ishida, T. Nakajima, Y. Honda, O. Kitao, H. Nakai, T. Vreven, K. Throssell, J. A. Montgomery, Jr., J. E. Peralta, F. Ogliaro, M. J. Bearpark, J. J. Heyd, E. N. Brothers, K. N. Kudin, V. N. Staroverov, T. A. Keith, R. Kobayashi, J. Normand, K. Raghavachari, A. P. Rendell, J. C. Burant, S. S. Iyengar, J. Tomasi, M. Cossi, J. M. Millam, M. Klene, C. Adamo, R. Cammi, J. W. Ochterski, R. L. Martin, K. Morokuma, O. Farkas, J. B. Foresman and D. J. Fox, Gaussian 16, Revision C.01, Gaussian, Inc., Wallingford CT, 2016 Search PubMed.
- (a) P. Borlido, T. Aull, A. W. Huran, F. Tran, M. A. L. Marques and S. Botti, J. Chem. Theory Comput., 2019, 15, 5069–5079 CrossRef CAS PubMed; (b) A. Giordana, R. M. Gomila, R. Rabezzana, E. Laurenti, E. Priola, B. Eftekhari-Sis, G. Mahmoudi and A. Frontera, ChemPlusChem, 2023, 88, e202300052 CrossRef CAS PubMed; (c) P. Sarma, R. M. Gomila, A. Frontera, M. Barcelo-Oliver and M. K. Bhattacharyya, Crystals, 2023, 13, 517 CrossRef CAS.
- S. F. Boys and F. Bernardi, Mol. Phys., 1970, 19, 553–566 CrossRef CAS.
- R. F. W. Bader, Chem. Rev., 1991, 91, 893–928 CrossRef CAS.
- J. Contreras-Garcia, E. R. Johnson, S. Keinan, R. Chaudret, J.-P. Piquemal, D. N. Beratan and W. Yang, J. Chem. Theory Comput., 2011, 7, 625–632 CrossRef CAS PubMed.
- T. A. Keith, AIMAll (Version 13.05.06), TK Gristmill Software, Overland Park, KS, 2013 Search PubMed.
- S. Ghosh, S. Islam, S. Pramanik and S. Kumar Seth, J. Mol. Struct., 2022, 1268, 133697 CrossRef CAS.
- A. Boultif and D. Louër, J. Appl. Crystallogr., 1991, 24, 987–993 CrossRef CAS.
- A. Boultif and D. Louër, J. Appl. Crystallogr., 2004, 37, 724–731 CrossRef CAS.
- J. Rodriguez-Carvajal, Phys. B, 1993, 192, 55–69 CrossRef CAS.
- O. Vallcorba, J. Rius, C. Frontera, I. Peral and C. Miravitlles, J. Appl. Crystallogr., 2012, 45, 844–848 CrossRef CAS.
- Spartan’10, Wavefunction Inc., Irvin, CA, USA, 2014 Search PubMed.
- V. Favre-Nicolin and R. Cerný, J. Appl. Crystallogr., 2002, 35, 734–743 CrossRef CAS.
- M. A. Spackman and D. Jayatilaka, CrystEngComm, 2009, 11, 19–32 RSC.
- M. A. Spackman and J. J. Mckinnon, CrystEngComm, 2002, 4, 378–392 RSC.
- J. J. Mckinnon, D. Jayatilaka and M. A. Spackman, Chem. Commun., 2007, 3814–3816 RSC.
- M. J. Turner, J. J. McKinnon, S. K. Wolff, D. J. Grimwood, P. R. Spackman, D. Jayatilaka and M. A. Spackman, CrystalExplorer17, University of Western Australia, 2017 (https://hirshfeldsurface.net) Search PubMed.
Footnote |
| † Electronic supplementary information (ESI) available: Characterization of the synthesis product of Oxyma-B, structure determination by direct space methods and CCDC search. CCDC 2271338. For ESI and crystallographic data in CIF or other electronic format see DOI: https://doi.org/10.1039/d3ce00741c |
| This journal is © The Royal Society of Chemistry 2023 |

