DOI:
10.1039/D3CE00626C
(Paper)
CrystEngComm, 2023,
25, 4834-4847
Cr-doped Al2O3–YAG binary and Al2O3–YAG–ZrO2 ternary eutectic materials crystallized by the micro pulling down technique and their characterization
Received
22nd June 2023
, Accepted 11th July 2023
First published on 21st July 2023
Abstract
Cr-doped Al2O3–YAG and Al2O3–YAG–ZrO2 eutectic ceramics rods of 3 mm in diameter were solidified from the melt by a micro-pulling down (μ-PD) technique. The Cr dopant affects the microstructure, morphology, and lattice parameters of the as-grown eutectics. As a function of the dopant, the coloration, morphology, microstructure, and luminescence were investigated. Whatever the Cr-dopant concentration, mainly two phases (Al2O3–YAG) in the case of the binary system and three phases (Al2O3–YAG–ZrO2) in the case of the ternary system were observed. The Chinese script microstructure and colony boundaries are observed in ternary eutectics. Al2O3 and YAG phases show faceted morphologies, but for the ZrO2 phase, growth tends to a weakly faceted manner and forms rods or lamellae. The hydrostatic stress of binary eutectics is less than that of ternary eutectics with same Cr dopant concentration due to the distribution of ZrO2 particles in the microstructure affected by residual stresses. The spectroscopic properties of the Cr-doped binary and ternary eutectic show that Cr3+ ions exist in both Al2O3 and YAG phases in octahedral sites.
1. Introduction
Color eutectic ceramic materials have aroused great attention in the innovation applications of light-emitting diodes (LEDs), watch pointers, and jewelry decoration; it is required to be produced in higher quantities with better economic attributes.1–4 The colored (red, blue, yellow, etc.) ceramics can be used in jewelry and luxury items and can substitute some specific crystals such as ruby.
The eutectic ceramic materials offer technical characteristics in the quality of hard material and not only scratch resistance, biocompatibility, insensitivity to any chemical attack, resistance to friction and abrasion but also aesthetic advantages intended for dressing applications.5–7 The Al2O3–YAG binary and Al2O3–YAG–ZrO2 ternary systems8–11 are among the eutectic ceramic materials that are identified to be the most important composite materials due to directional and rapid solidification from the melt.12,13 The high melting temperature >1500 °C allows them to work stably in an oxidizing environment due to inherent chemical–physical properties.14 They present excellent mechanical properties that are heavily dependent on the microstructure, morphology, and crystallographic orientations15,16 and are considered potential engineering materials. It is evident that controlling the uniform microstructure of the eutectic ceramics in the binary or ternary systems is related to the directional solidification behavior that depends on the solidification methods and specific composition in the equilibrium diagram.17–21
Chromium oxides can be used in ceramics because they are characterized by a large variety of colors. Therefore, chromium is an element of choice for obtaining colored minerals since it colors many compounds in red, purple, or green. It is, in most cases, in the form of Cr3+ in octahedral symmetry. Chromium is a transition metal of electronic configuration Cr0 [Ar] 4s2 3d4, which gives it a wide variety of possible degrees of oxidation from 0 to +6.22 However, oxidation states +3 and +6 are the most commonly encountered in minerals and glasses. Cr3+ gives rise to many colors; it is mainly found in octahedral geometry in minerals and is notably not only responsible for the green color of the emerald and red color of ruby but can also give purple as in stichtite.23,24 The presence of Cr3+ in a more or less distorted octahedral geometry results in the presence of two main absorption bands in the visible range of its optical spectrum. The observed energy shifts of the absorption bands of Cr3+ between the different minerals explain different colorations since the transmission window in the visible range is modified with these displacements. By the analysis of ruby and the emerald, Vauquelin et al.25 discovered that chromium is responsible for the respective red and green colors of these two minerals.
The synthesis of colored eutectic ceramic compounds is not well controlled. For example, despite all efforts, it has never before been possible to produce eutectic ceramics bright red color used for jewelry and watch pivot. The aim of this paper is, in particular, to propose red colored Cr-doped Al2O3–YAG and Al2O3–YAG–ZrO2 eutectic ceramic materials solidified by the micro-pulling down (μ-PD) technique, allowing significant expansion of the range of possible colors in the production of colored eutectic ceramic materials.
2. Experimental procedure
2.1 Crystal growth conditions
The starting materials were made from commercial high-purity (>99.99%), Cr2O3, Al2O3, Y2O3 and ZrO2 powders. The powders were mixed in agate mortar at eutectic proportion according to the binary (80 mol% Al2O3/20 mol% Y2O3) and the ternary (65 mol% Al2O3 /16 mol% Y2O3 /19 mol% ZrO2) eutectic composition. The detailed compositions of different prepared materials and references are shown in Table 1. The mixture was sintered at 1500 °C for 24 h in an air atmosphere. Eutectic ceramic rods were solidified from the melt using the micro-pulling down technique presented in previous work.11,13,15,21 An iridium crucible is used, and it is tapped in its lower part with a capillary die of 3 mm in diameter. The crucible is enclosed in a chamber swept with an oxygen-free argon stream and is charged with eutectic ceramic raw materials. The crucible is brought to a temperature of 1750 °C ± 2 °C using a high frequency generator operating at 11 kHz and having a continuous power output of 25 kW. When a pendant drop forms at the bottom of the capillary channel (Fig. 1), it is connected with a rod of eutectic ceramic of selected composition with a diameter of 2 mm to serve as the seed. When the drops weld to the seed, the seed is pulled down at a rate of 0.3 mm min−1. A CCD camera was used to take inset a live picture through a small circular window (Fig. 1). High-purity flowing argon was used to prevent oxidation of the iridium crucible and after heater crucible support.
Table 1 The different compositions used for melt solidification
| Binary eutectic (Al2O3 (80%)/Y2O3 (20%)) |
| Sample (reference) |
Cr BE1 |
Cr BE2 |
Cr BE3 |
Cr BE4 |
| Dopant |
1.9 at% |
1.5 at% |
0.7 at% |
0.4 at% |
| Ternary eutectic (Al2O3 (65%)/Y2O3 (16%)/ZrO2 (19%)) |
| Sample (reference) |
Cr TE1 |
Cr TE2 |
Cr TE3 |
Cr TE4 |
| Dopant |
1.9 at% |
1.5 at% |
0.7 at% |
0.4 at% |
 |
| | Fig. 1 Schematic illustration of the drop at the bottom of the capillary die (left), CCD camera vision of the growth initiation through the crucible and after heater (right). | |
2.2 Characterization methods
2.2.1. XRD phase analysis and scanning electron microscopy.
Room-temperature X-ray diffraction patterns were obtained using a Bruker D8 advanced diffractometer with Cu-Kα1 and Cu-Kα2 X-rays (λ = 0.15406 and 0.15444 nm). The diffraction diagram is scanned over a 2θ range from 15° to 70° in steps of 0.02° with a counting time of 1 s per step and continuous rotation (20 rpm) for measurement. In order to investigate the formation and evolution of microstructures, the eutectic samples were cut and polished along the longitudinal and transversal, and the pieces of about 2 to 10 mm in length were embedded in organic resin. SEM observations of the polished samples were performed with a Phenom desktop scanning electron microscope (SEM) at 5 kV.
2.2.2. Spectroscopic characterizations.
The fluorescence lines of ruby single crystals are used to evaluate the residual stresses in the solidified rods and the displacement of the fluorescence line of chromium (Cr3+) is measured. A 473 nm laser wavelength has been used as an excitation source and focused on the surface of the polished samples through a 50× Olympus MIR plan objective with 0.25 NA in order to cover a larger sample area. For each sample, 121 points of measurement are taken on different areas of the polished transversal and longitudinal section. All the measured spectra are fitted using a Gaussian profile in order to determine the exact peak positions of Cr3+ fluorescence lines.
The emission spectra were registered at room (RT) and liquid nitrogen temperatures by exciting the crystals with an EKSPLA NT342B tunable OPO (Optical Parametric Oscillator) pumped by a pulsed and frequency-tripled Nd:YAG laser delivering 7 ns laser pulses. Emission signals were dispersed and detected in the visible range with the aid of a SHAMROCK 350 monochromator equipped with both 300 line per mm and 1200 line per mm gratings, and an ANDOR ICCD gated detector. The high temperature measurements were performed using a LINKAM SCIENTIFIC cell DSC600 with an analogous photo-luminescence set-up.
The fluorescence decay measurements were performed by using the same laser excitation sources and a Jobin-Yvon HRS1 monochromator and by analyzing the signals with the help of R928 AsGa (RESEARCH Inc.) photomultiplier tubes coupled with a Wave Runner 64Xi LECROY digital scope, for the visible and NIR spectral ranges, respectively. The excitation spectra of Cr-doped Al2O3–YAG (binary system) and Al2O3–YAG–ZrO2 (ternary system) eutectics in the range from 285 to 680 nm are recorded at room temperature with the help of an EDINBURGH Instruments FS5 spectrofluorimeter.
3. Result and discussion
3.1 Eutectic solidification and phase's characterization
As a function of the composition, the Cr doped binary (Al2O3–YAG) and ternary (Al2O3–YAG–ZrO2) eutectic ceramic rods solidified from the melt are shown in Fig. 2. They were crystallized under the stationary stable regime. Except for the CrTE4 (0.4% Cr) sample, the Cr doped eutectic ceramic rods have a stable diameter of 3 mm. Whatever the system (binary or ternary), the red color contrast increases with increasing Cr concentration. The variation in color coordinates (x, y) as presented in the CIE-1931 chromaticity diagram (Fig. 3) shows that various red colors can be obtained by varying Cr concentration in the eutectic ceramics. The ceramics eutectics rods corresponding to high Cr concentration (1.9% Cr) have a strong red color close to the blood color. The surface of the samples is smooth without any visible macroscopic defects such as cracks or bubbles. Fig. 4a and b show the XRD diagram of the eutectic ceramics as a function of Cr concentration for the binary and the ternary systems. The grinding of the material makes it possible to overcome the phenomena of texturing and distortion of cells due to the internal stresses of the material at room temperature. The YAG is identified as the majority phase in both systems. In the case of the Cr-doped Al2O3–YAG binary system, only Al2O3 and YAG phases are observed. Additional cubic ZrO2 phase was crystallized in the case of the Cr-doped Al2O3–YAG–ZrO2 ternary system. We did not register the presence of YAlO3 perovskite phase or inclusions belonging to the Al2O3, Y2O3, and Cr2O3 oxides, indicating that Cr ion doping did not create impurity phases or induce significant changes in the structure architecture. Table 2 presents the lattice parameters as a function of the Cr concentration. In the case of the YAG phase, whatever the system (binary or ternary), we registered a slight increase in the lattice parameter (a). The YAG has a garnet structure with Y3+ occupying a dodecahedral site and Al3+ ions occupying octahedral and tetrahedral sites, respectively.26 The cells containing eight groups form Y3Al2Al3O12(X3Y2Z3O12). The X, Y, and Z sites cations respectively occupy positions 24c, 16a, and 24d, and the anions are located at the positions 96 h. The chromium (located on the Y sites) is, therefore, at oxidation state 3 and has a punctual symmetry 3− or C3i in Schönflies notation. The Cr3+ substitutes A13+ in a small trigonally distorted octahedral site with Cj symmetry.27 The structure of Al2O3 is the same as that of Cr2O3. These two compounds form a complete solid solution, Al2−xCrxO3, by substitution of aluminum by chromium in the octahedral site. The solid solution changes color with the chromium concentration. The introduction of a few tens of ppm of chromium replacing aluminum produces a characteristic pink color. The color intensifies with increasing chromium concentration, and as soon as the latter exceeds a few 0.7 at% for both binary and ternary systems, the compounds acquire a strong red component. The color change of compounds is mainly due to changes in the parameter of the crystal field Δ0.28,29 Chromium dopant involved in the coloration is essentially in the form of Cr3+ in more or less distorted octahedral symmetry. In addition, the broad absorption band peaking at 560 nm in the visible range is increasing with the Cr concentration, then for the highest Cr concentration, the absorption at the edge of this band for wavelength higher than 600 nm is also increasing, giving the sample a deep red color. Both binary and ternary eutectic ceramic rods contained the Cr-doped α-Al2O3 phase belonging to the solid solution Al2−xCrxO3. Whatever the Cr concentration and the systems, all the solidified eutectic ceramics showed an increasing a and c-lattices parameters in the Cr-doped α-Al2O3 phase. This is principally due to the difference in the Cr3+ (61.5 pm) size, which is considerably greater than the size of Al3+ (53.3 pm).30 The pics characteristics of Al2−xCrxO3 are therefore progressively shifted towards the lowest values of 2θ with Cr content (Fig. 4). In the case of the Cr-doped Al2O3–YAG–ZrO2 system, we have not observed a variation of lattice parameter a in ZrO2 phase. But the X-ray peaks of the cubic zirconia phase were shifted slightly because some amount of Y2O3 was dissolved. On the basis of qualitative results under EDS, some amount of Y2O3 was contained in the ZrO2 phase.
 |
| | Fig. 2 Cr-doped eutectic ceramics solidified from the melt by μ-PD (pulling rate 0.3 mm min−1). CrBE1: Al2O3–YAG binary (Cr = 1.9 at%) CrBE2: Al2O3–YAG binary (Cr = 1.5 at%). CrBE3: Al2O3–YAG binary (Cr = 0.7 at%) CrBE4: Al2O3–YAG binary (Cr = 0.4 at%). CrTE1: Al2O3–YAG–ZrO2 ternary (Cr = 1.9 at%) CrTE2: Al2O3–YAG–ZrO2 ternary (Cr = 1.5 at%) CrTE3: Al2O3–YAG–ZrO2 ternary (Cr = 0.7 at%) CrTE4: Al2O3–YAG–ZrO2 ternary (Cr = 0.4 at%). | |
 |
| | Fig. 3 CIE-1931 chromaticity diagram as a function of Cr concentration in the binary and the ternary eutectics. | |
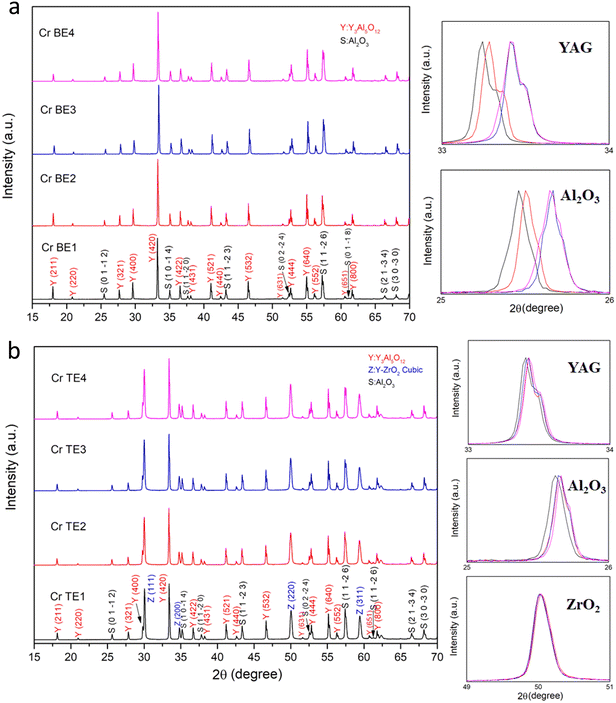 |
| | Fig. 4 X-ray diffraction evolution as a function of Cr dopant concentration, (a) Al2O3–YAG binary system and (b) Al2O3–YAG–ZrO2 ternary system. | |
Table 2 Lattice parameters of Cr doped Al2O3–YAG/Al2O3–YAG–ZrO2 as a function of the dopant concentration
|
|
Al2O3R![[3 with combining macron]](https://www.rsc.org/images/entities/char_0033_0304.gif) c (Å) c (Å) |
Y3Al5O12Iad (Å) |
ZrO2Fmm (Å) |
| PDF files |
a = 4.7585, c = 12.9906 |
a = 12.0020 |
|
| Cr BE1 |
a = 4.7648, c = 13.0074 |
a = 12.0139 |
|
| Cr BE2 |
a = 4.7624, c = 12.9999 |
a = 12.0110 |
|
| Cr BE3 |
a = 4.7624, c = 13.0017 |
a = 12.0130 |
|
| Cr BE4 |
a = 4.7608, c = 12.9935 |
a = 12.0094 |
|
| Cr TE1 |
a = 4.7650, c = 13.0072 |
a = 12.0123 |
a = 5.1605 |
| Cr TE2 |
a = 4.7642, c = 13.0037 |
a = 12.0135 |
a = 5.1619 |
| Cr TE3 |
a = 4.7611, c = 12.9957 |
a = 12.0093 |
a = 5.1625 |
| Cr TE4 |
a = 4.7602, c = 12.9955 |
a = 12.0084 |
a = 5.1628 |
Fig. 5 and 6 show the SEM images of the transverse and the longitudinal sections cut from the Cr-doped Al2O3–YAG binary and Al2O3–YAG–ZrO2 ternary eutectic ceramic rods. The precise knowledge of the solidification conditions, namely solidification rate and initial composition, makes it possible to study the influence of these different parameters on the morphology. The addition of Cr in the binary Al2O3–YAG system does not strongly affect the architecture morphology of this system.
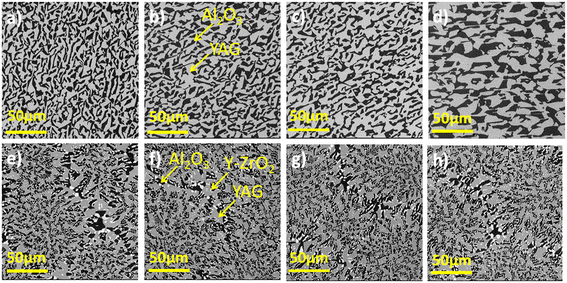 |
| | Fig. 5 Transversal microstructure evolution as a function of concentration. (a) Binary eutectic Cr 0.4 at%, (b) binary eutectic Cr 0.7 at%, (c) binary eutectic Cr 1.5 at%, (d) binary eutectic Cr 1.9 at%, (e) ternary eutectic Cr 0.4 at%, (f) ternary eutectic Cr 0.7 at%, (g) ternary eutectic Cr 1.5 at%, (h) ternary eutectic Cr 1.9 at%. | |
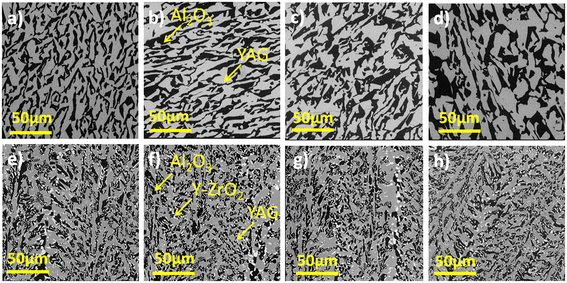 |
| | Fig. 6 Longitudinal microstructure evolution as a function of concentration. (a) Binary eutectic Cr 0.4 at%, (b) binary eutectic Cr 0.7 at%, (c) binary eutectic Cr 1.5 at%, (d) binary eutectic Cr 1.9 at%, (e) ternary eutectic Cr 0.4 at%, (f) ternary eutectic Cr 0.7 at%, (g) ternary eutectic Cr 1.5 at%, (h) ternary eutectic Cr 1.9 at%. | |
Unlike the ternary system, the binary eutectic presents a homogeneous microstructure for all the Cr concentrations.
It is composed of two phases distinguished by their different shapes and colors; the black regions correspond to the α-Al2O3 phase and the grey regions correspond to YAG (Y3Al5O12) phase. The Al2O3 is the matrix and the YAG phases are disconnected on transverse sections to the solidification direction. The shape and size of the YAG phase are irregular. The longitudinal sections (Fig. 6) show that the microstructure is irregular lamellar and corresponds to the Chinese script microstructure. The lamellae are elongated along the solidification direction. The YAG size increases with increasing Cr concentration and reaches a maximum average of around 40 μm for 1.9 at% Cr (Fig. 6d). The coarsening as a function of Cr concentration is quite homogeneous and the microstructure remained unchanged. In the binary system, the dimension, homogeneity, and morphology of the microstructure are modified by varying the Cr concentration. A high Cr concentration promotes the contribution of diffusion, leading to an increase in the size of the microstructure. Increasing the Cr concentration is similar to decreasing the pulling rate in the Al2O3–YAG system.26 The microstructure corresponding to the lower Cr concentration (0.4 at%) is much finer. In eutectic solidified with low Cr concentration and smaller phase sizes, the diffusion was enhanced. A significant coarsening of the fine microstructure is registered. It seems that the coarsening process is Cr3+ diffusion through Y3Al5O12 and Al2O3.
For the Cr-doped Al2O3–YAG–ZrO2 system, the microstructure is composed of three phases, Al2O3, YAG, and ZrO2. The main phases are YAG and alumina, which respectively have volume fractions of 42 vol% and 40 vol% (Fig. 6). The zirconia phase is distributed mainly at the interface of the alumina and YAG phases or in the alumina phase with 1–5 μm. Intragranular ZrO2 with a very small (0.1–0.8 μm) size surrounded the YAG phase. The longitudinal sections of the solidified samples show a “broken” or irregular lamellar microstructure. The lamellae are elongated along the solidification direction. In the ternary system, as a function of Cr concentration from 0.4 to 1.9 at%, we did not register an increase of YAG grains and magnification of the microstructure as observed in the Al2O3–YAG binary system. The microstructure of the ternary system is finer and with more curved interfaces than that of the Cr-doped Al2O3–YAG eutectic system solidified at the same rate. Whatever the Cr concentration (0.4–1.9 at%), the homogeneous character disappears, giving way to a colonies apparition but the microstructures are interconnected. Both YAG and ZrO2 phases in the Cr-doped ternary eutectics showed a different morphology than in their respective Al2O3-based binary eutectic systems,31–33 but Cr addition does not affect the shape of ZrO2 particle, and the script size of the YAG phase was found to be uniform for each cross-section investigated. The SEM observations show that the Cr doping in the ternary system leads, in our case, to an excess of YAG (in grey) marked by the formation of large primary crystals. The Al2O3 phase (black) is also slightly in excess compared to the garnet phase (grey).
3.2 Residual stress
The thermal elastic residual stresses of eutectics in the solidification process is caused by different thermal expansion mismatches between the α-Al2O3, YAG, and ZrO2:Y phase.26,34 The fluorescence of ruby single crystal is taken as a reference to measure the residual stresses due to the electronic Cr3+ levels characterized by R1 and R2 luminescence lines; in most instances, the R2-line shift could be used to calculate approximate values of the hydrostatic stress σh, the relation follows:35,36
where Δν2 refers to the peak shift of the R2-line (expressed in units of cm−1) and σh presents the hydrostatic stress given in units of GPa. Fig. 7 and 8 show the fluorescence spectra of Cr3+ present in the alumina phase of Cr-doped Al2O3–YAG/Al2O3–YAG–ZrO2 solidified eutectic. The evolution of the average hydrostatic stress measured on the transversal and longitudinal section of the samples is shown in Fig. 7 and 8; the negative values of the hydrostatic stress indicate that the alumina phase is under compression, which is observed in references.7,37 Whatever the transversal and longitudinal microstructure, the hydrostatic stress of binary eutectics id less than that of ternary eutectics with the same doped concentration due to the distribution of ZrO2 particles in the microstructure affected by the residual stresses. The higher concentration of Cr-doped eutectic of Chinese script morphology is less compressed than that of at lower concentration. In a word, the variation of the residual stresses of Cr doped Al2O3–YAG/Al2O3–YAG–ZrO2 solidified eutectics, which not only depends on the cooling rate and time but also affected by the dopant and the concentration (Fig. 9).
 |
| | Fig. 7 Ruby fluorescence (R1 and R2 bands) excited with a 473 nm laser in transversal sections of the eutectics as a function of concentration. | |
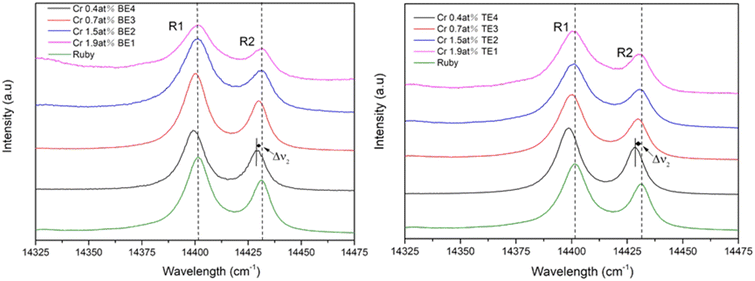 |
| | Fig. 8 Ruby fluorescence (R1 and R2 bands) excited with a 473 nm laser in longitudinal sections of the eutectics as a function of concentration. | |
 |
| | Fig. 9 Variation of the residual stresses (transversal and longitudinal sections) as a function of concentration according to Cr-doped binary and ternary eutectics. | |
3.3 Emission and excitation spectra
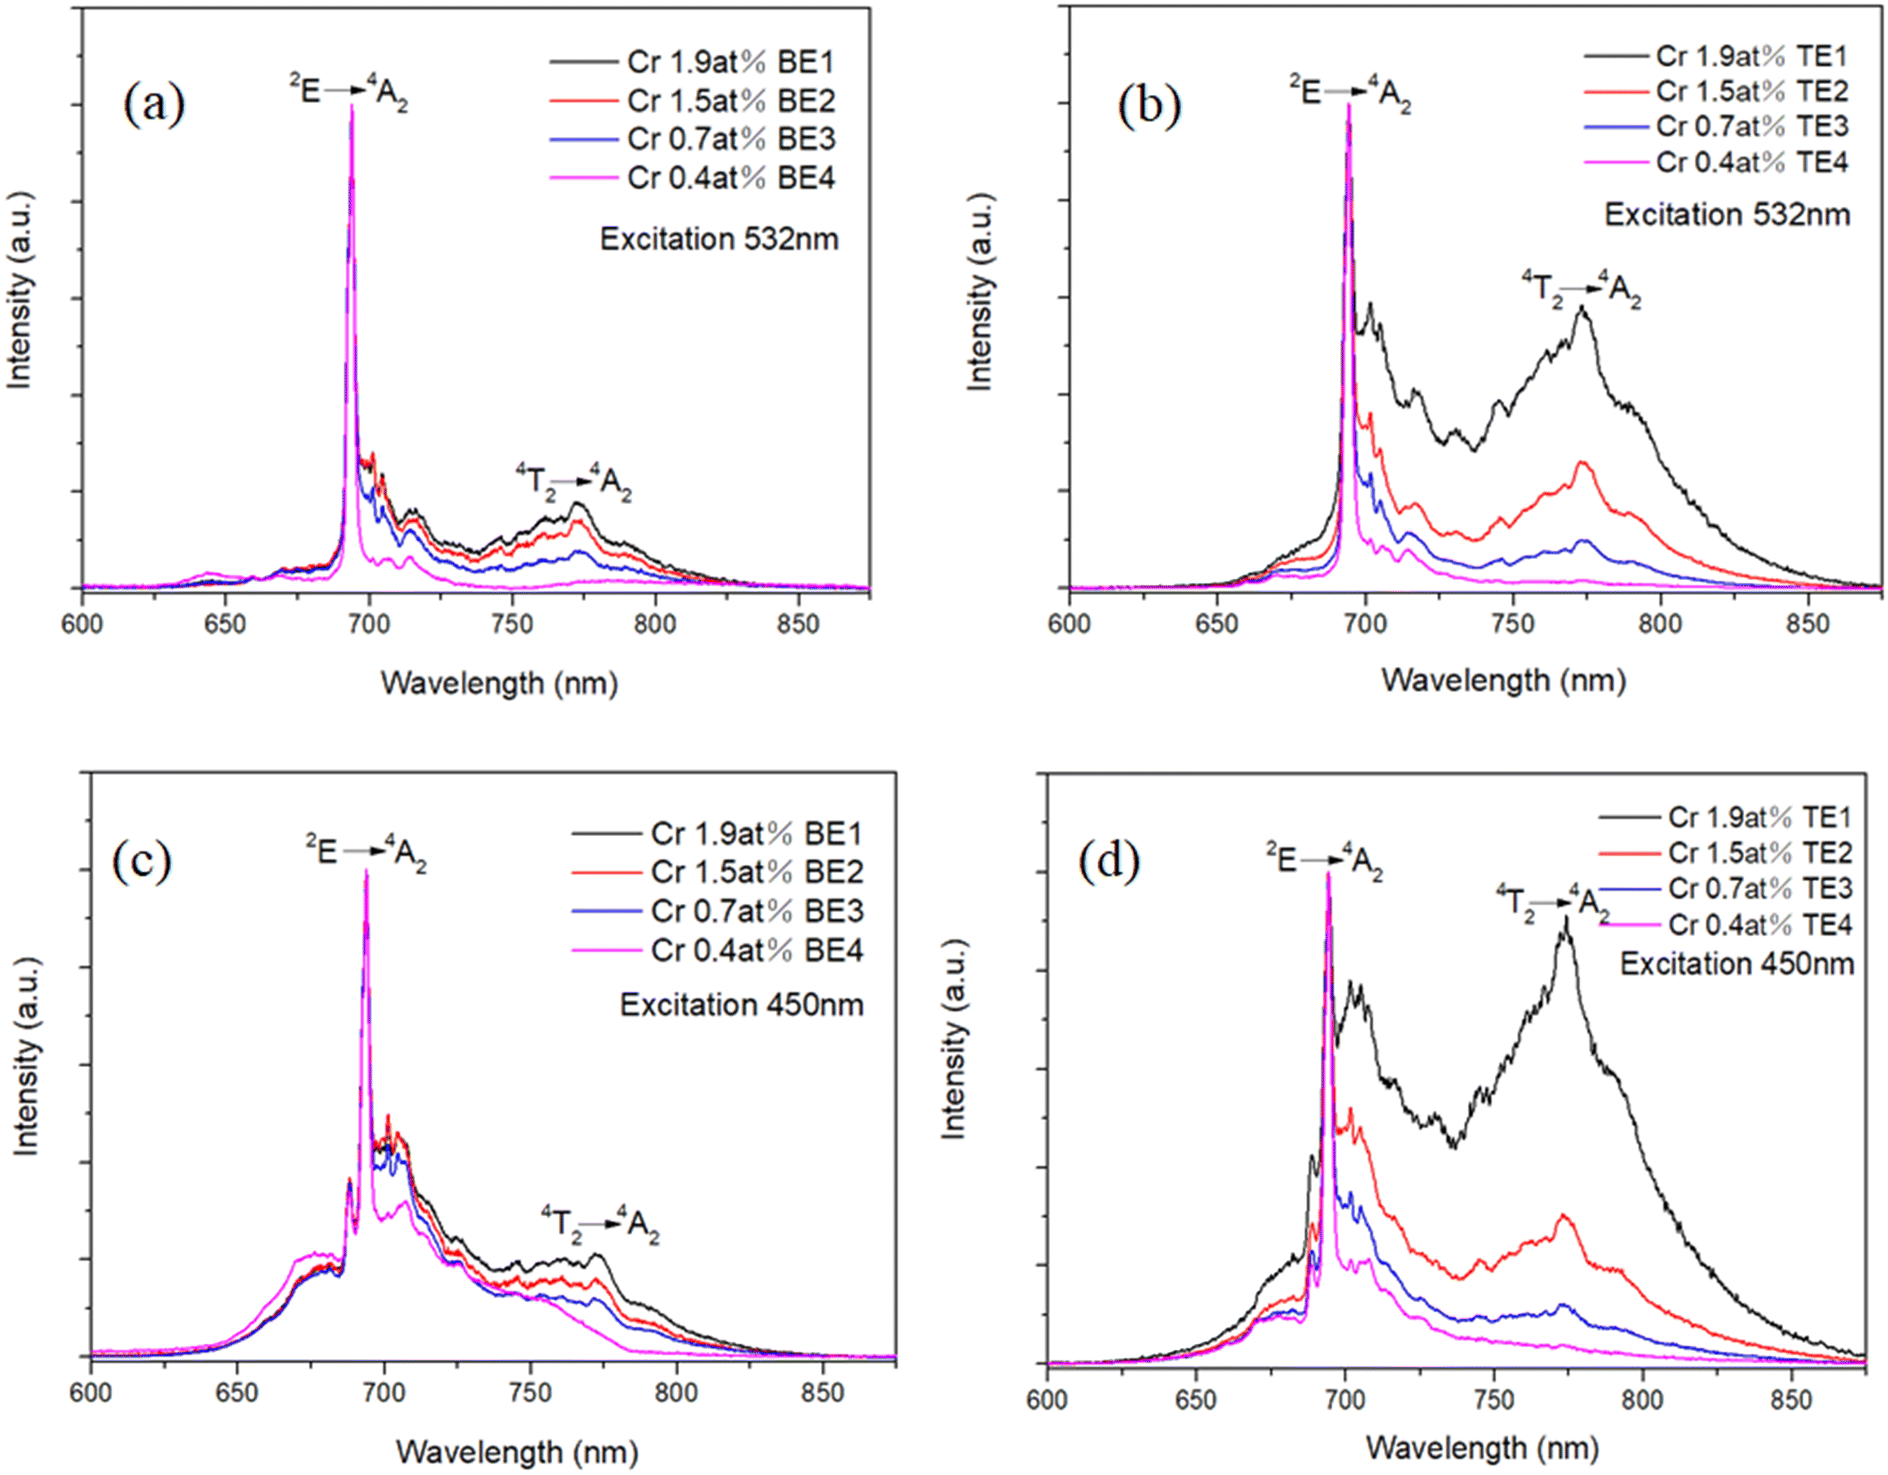
The room temperature (300 K) emission spectra of Cr-doped Al2O3–YAG/Al2O3–YAG–ZrO2 eutectics in the wavelength range of 600–900 nm recorded under green (532 nm) and blue excitation light (450 nm) are shown in Fig. 10. Under the green excitation, Cr-doped Al2O3 is clearly identified.38 The sharp line centered at 694 nm corresponds to the forbidden spin transitions from 2E to 4A2 level, referred to as R-line, and the broad band centered at 774 nm is due to the phonon-assisted 4T2 to ground state 4A2. This last transition was mostly observed when Cr-doped Al2O3 was higher than 0.5 at%. Indeed, the relative intensity of the broad band centered at 774 nm is increasing with the concentrations.38 This effect is magnified in Cr-doped ternary eutectics. Moreover, under the blue excitation, an additional sharp line around 688 nm appears, attributed to the 2E → 4A2 transition of the Cr-doped YAG phase.39
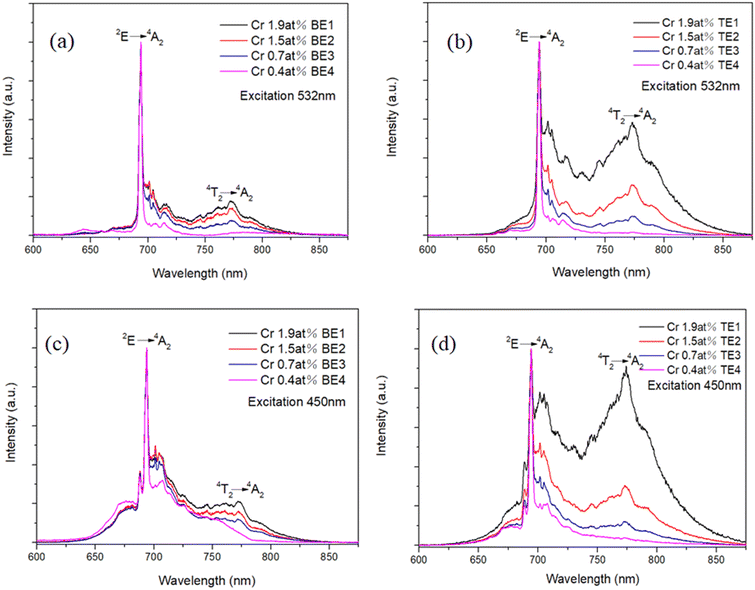 |
| | Fig. 10 The room temperature (300 K) emission spectra of eutectics (a) Cr-doped binary eutectics under excitation at 532 nm. (b) Cr-doped ternary eutectics under excitation at 532 nm. (c) Cr-doped binary eutectics under excitation at 450 nm. (d) Cr-doped ternary eutectics under excitation at 450 nm. | |
The low temperature (77 K) emission spectra of Cr-doped binary and ternary eutectics in the wavelength range of 680–850 nm were also recorded under excitation at 532 and 450 nm as shown in Fig. 11. The broad emission band with peaks at 774 nm is observed due to 4T2 → 4A2 transition, in good agreement with R. C. Powell et al.40 At low temperatures, the 4T2 emission band is more structured but remains as large as at RT, however, the effect of decreasing temperature strongly affects the structure of the spectra in the 690–710 nm range; splitting of the Cr:Al2O3 R lines and magnification of the doublet is observed in its edge around 700 nm.
 |
| | Fig. 11 The low temperature (77 K) emission spectrum of eutectics (a) Cr-doped binary eutectics under excitation at 532 nm. (b) Cr-doped ternary eutectics under excitation at 532 nm. (c) Cr-doped binary eutectics under excitation at 450 nm. (d) Cr-doped ternary eutectics under excitation at 450 nm. | |
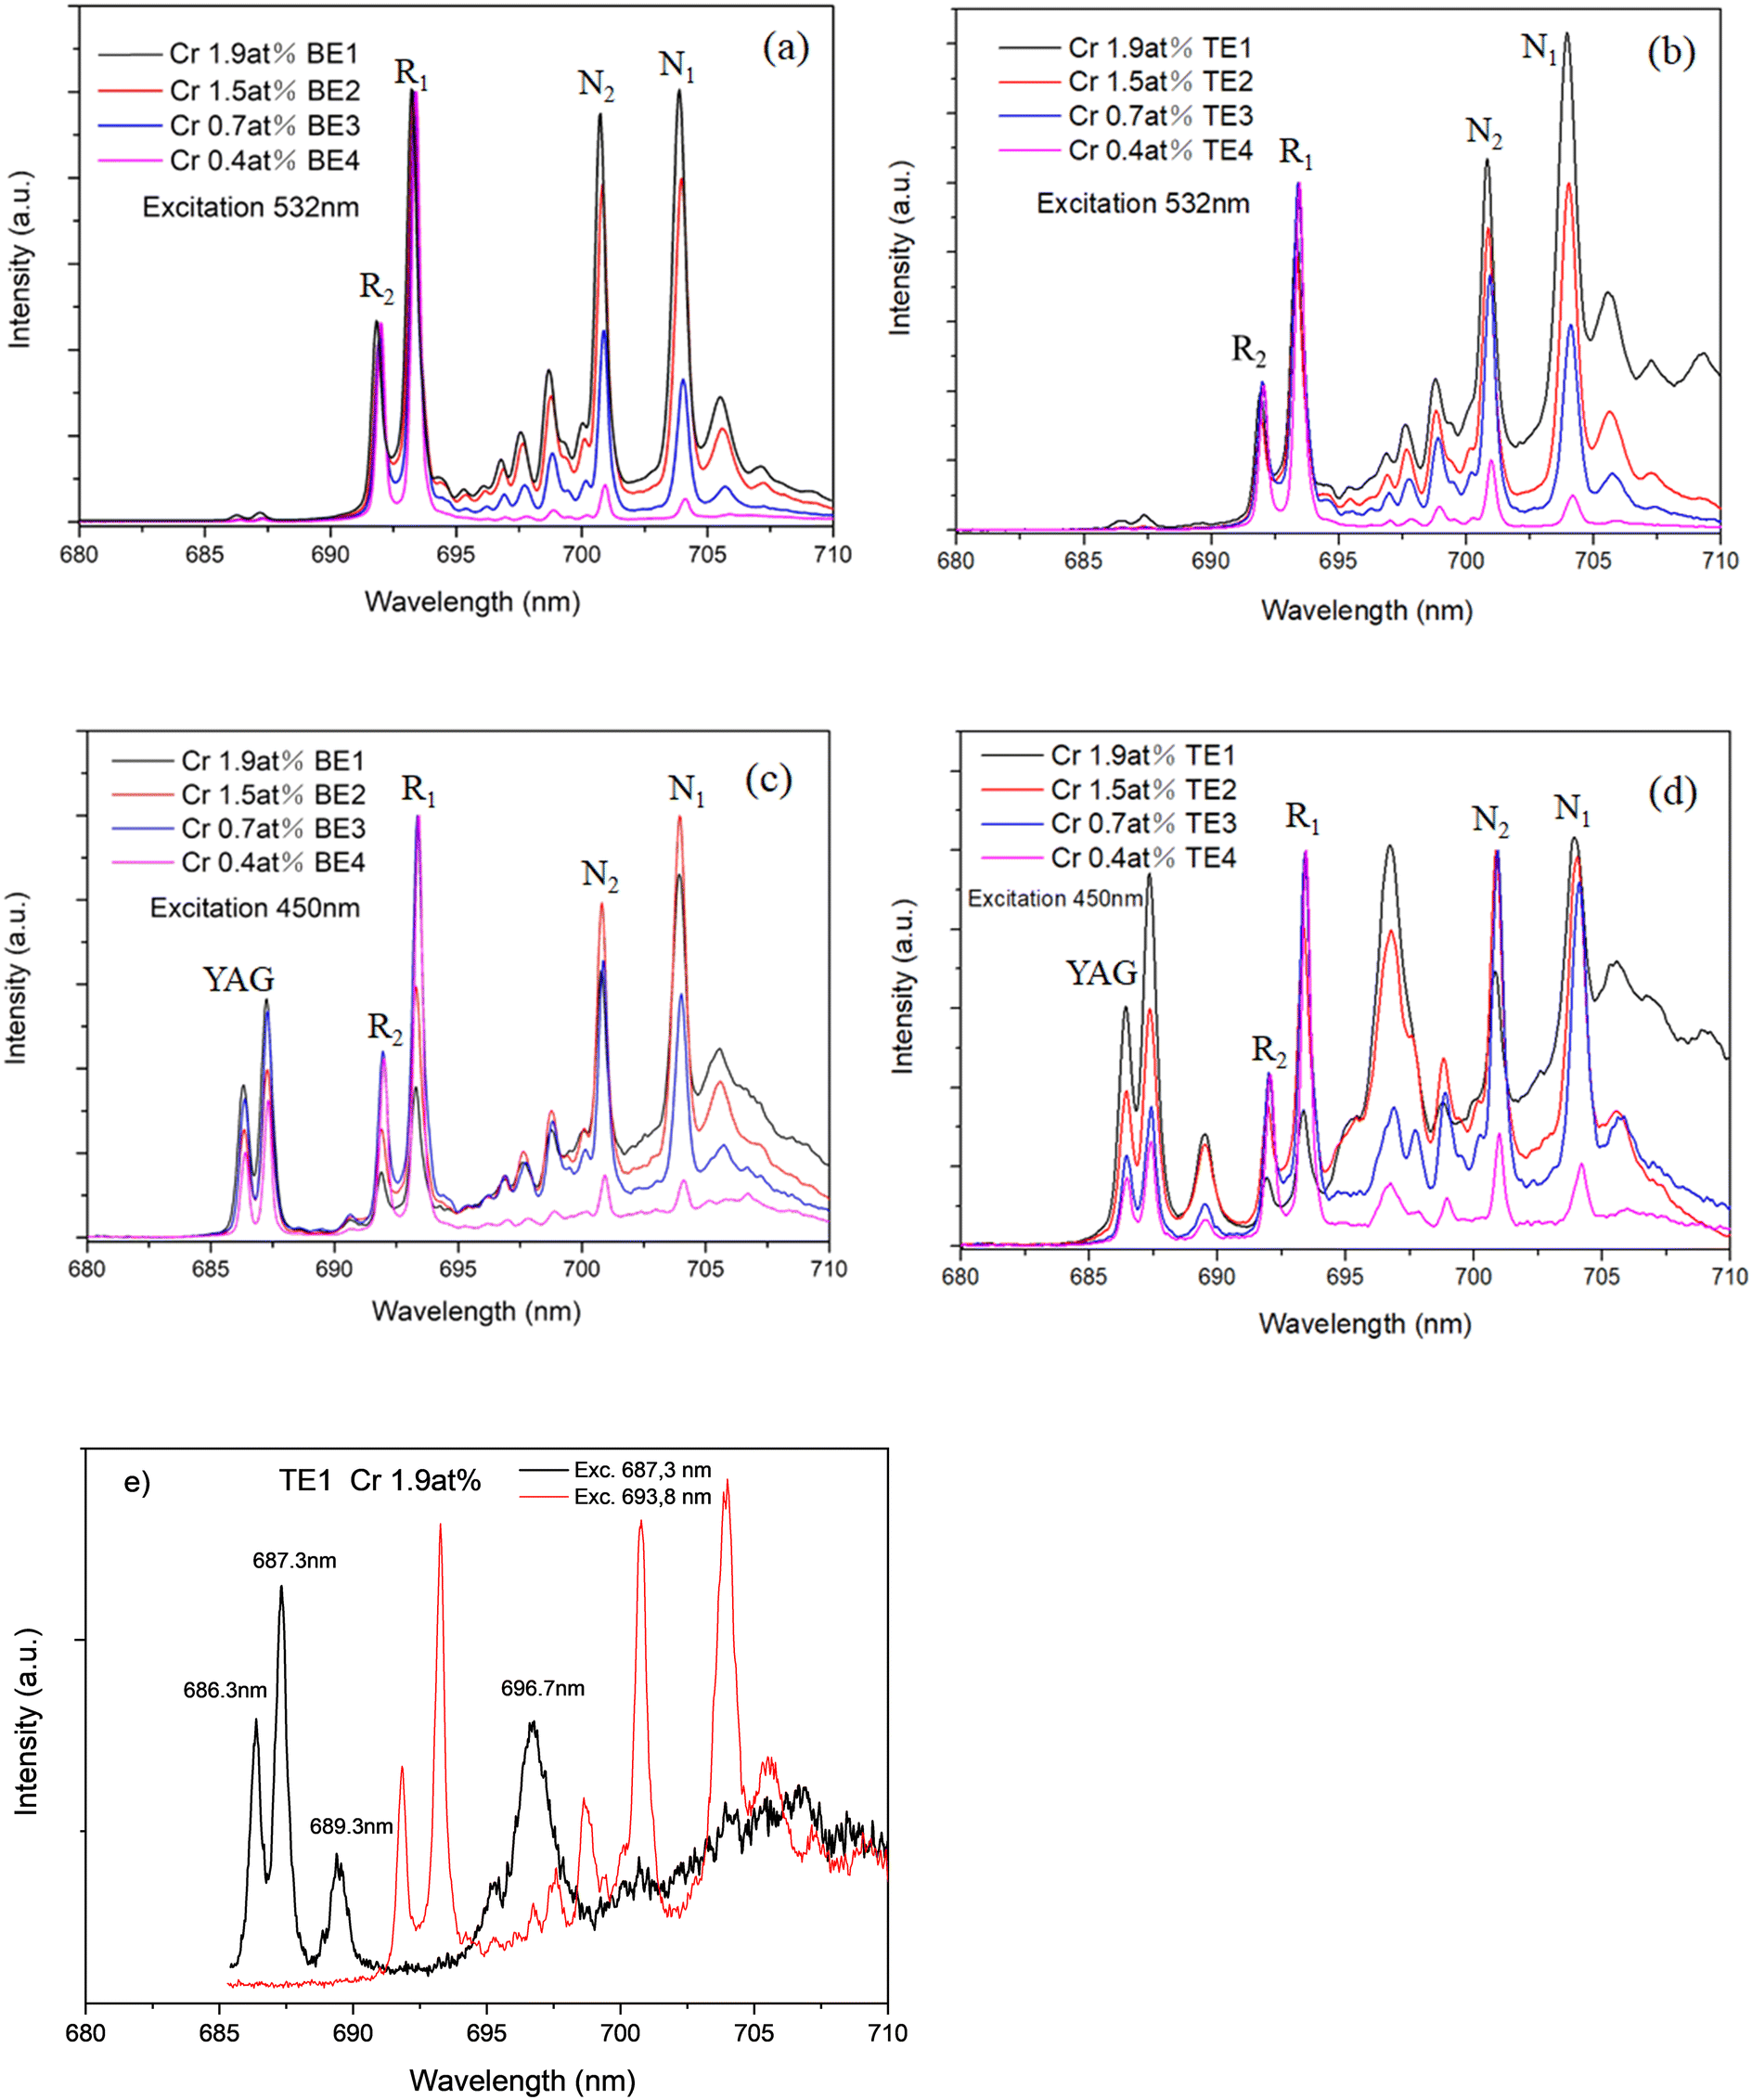
In order to analyse the rich luminescence spectrum in this range, the emission covering the spectral range from 680 nm to 710 nm is shown Fig. 12. Under green excitation at 532 nm, the first sharp lines lying at 693.4 nm and 692.0 nm are assigned to R1 Ē → 4A2 and R2 Ā → 4A2 lines, respectively, due to the spin–orbit coupling and then, the splitting of the radiative transition 2E → 4A2 in Cr3+ ions in octahedral crystal field.41,42 Whereas the second doublet of sharp lines at 704.0 nm and 700.9 nm corresponds to Cr3+–Cr3+ pair lines, which are designated as N1 and N2 in Al2O3, respectively.40 The ratio between the N and R-line intensity slightly increases in the ternary eutectics.
 |
| | Fig. 12 The low temperature (77 K) emission spectrum of eutectics ranges from 680 nm to 710 nm under excitation at 532 nm a) and b); 450 nm c) and d) and selective excitations at 694.2 and 687.3 nm e). | |
In addition, under blue excitation (450 nm), a third doublet of sharp lines appears at 686.3 nm and 687.3 nm, corresponding to the splitting of the Cr R line in YAG. The relative intensity of N lines and R lines increases with the Cr concentration, as expected. Under 532 nm excitation, no difference between ternary and binary eutectic emission spectra is observed, whereas, under 450 nm excitation, at least two additional lines appear at 689.5 nm and 696.7 nm in the ternary compound coming from Cr-doped YAG phase. Indeed, under selective excitation in the 685–700 nm range, these additional lines only appear when excited in the two 687.3 and 686.0 nm Cr–YAG R lines.
The high temperature emission spectra of eutectics from 315 to 673 K are shown in Fig. 13. Under 532 nm excitation of the Cr in the alumina phase when the temperature is increasing, the 4T2 level becomes more and more thermally populated, and then the intensity of the broadband increases relatively to the line (694 nm) corresponding to the 2E → 4A2 emission. Under the excitation of 450 nm, the line at 688 nm, 2E → 4A2 of Cr in YAG-phase, rapidly disappears (at already 100 °C). Indeed when the temperature increases, both 4A2 → 4T2 and 4A2 → 4T1 absorption or excitation bands, shown in Fig. 14, become much broader, and then, at 450 nm, the excitation of Cr in the alumina phase is enhanced. This result points out that the high temperature measurements corroborate that the majority of Cr3+ ions entered favorably in the Al2O3 phase than in the YAG phase. This behavior is observed in both ternary and binary eutectics.
 |
| | Fig. 13 High temperature emission spectrum, using a long-pass filter at 650 nm, of eutectics from 373 to 673 K (a) Cr-doped binary eutectic under excitation at 532 nm. (b) Cr-doped ternary eutectic under excitation at 532 nm. (c) Cr-doped binary eutectic under excitation at 450 nm. (d) Cr-doped ternary eutectic under excitation at 450 nm. | |
 |
| | Fig. 14 Excitation spectrum of eutectics at room temperature (a) Cr-doped binary eutectics by monitoring the emission at 694 nm. (b) Cr-doped ternary eutectics by monitoring the emission at 694 nm. (c) Cr-doped binary eutectics by monitoring the emission at 688 nm. (d) Cr-doped ternary eutectics by monitoring the emission at 688 nm. | |
The room temperature excitation spectra of Cr-doped Al2O3–YAG (binary system) and Al2O3–YAG–ZrO2 (ternary system) eutectics in the range from 285 to 680 nm are shown in Fig. 14. The excitation spectrum consists of two broad bands assigned to the 4A2 → 4T1 (Y-band) as well as 4A2 → 4T2 (U-band) spin-allowed transitions.43 By monitoring the emission at 694 nm of Cr in the Al2O3 phase, the excitation bands are centered around 400 nm and 560 nm, while by monitoring the emission at 688 nm of Cr in the YAG phase, these bands are both red-shifted and centered around 450 nm and 610 nm, respectively. In addition, sharp excitation bands centered around 660 nm correspond to transitions from the 4A2 ground state to 2T1 level above 2E. In Fig. 14c, the asymmetrical shape of the excitation band is due to the overlap of the high energy part of the 4T2 → 4A2 emission transition of Cr in the Al2O3 phase; then it is not possible to select only the Cr luminescence in the YAG phase, this observation being more noticeable in Fig. 11d in the case of the ternary eutectics.
3.4 Fluorescence decay times
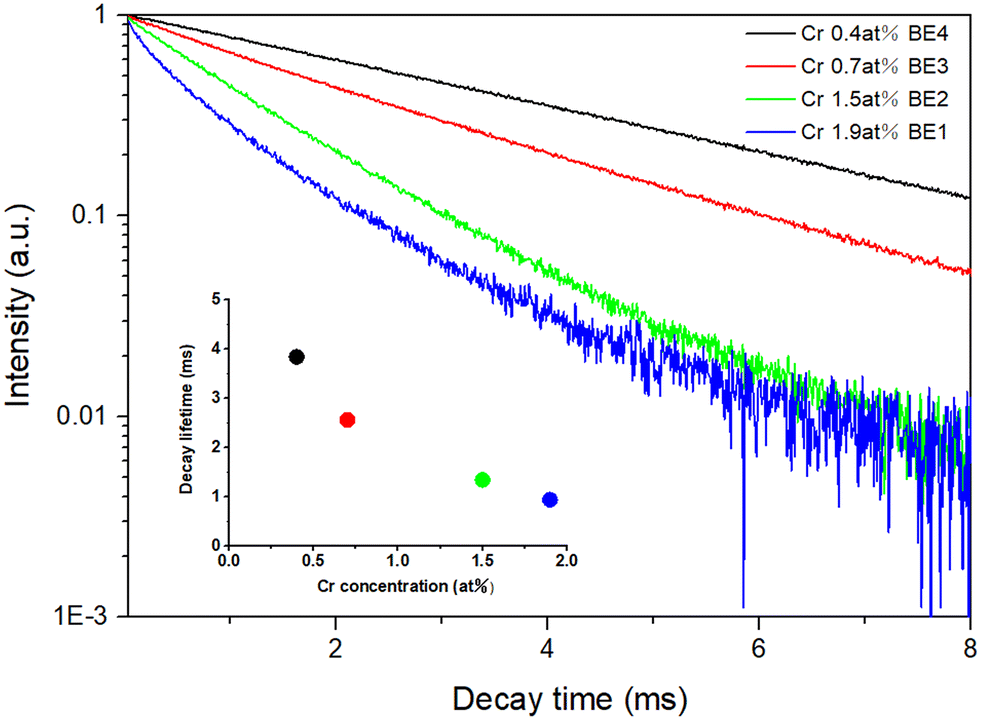
The fluorescence decay curves of the chromium luminescence as a function of the Cr concentration were recorded under 532 and 450 nm excitation at 300 K and 77 K, and the lifetime constants are gathered in Tables 3 and 4, respectively. As the decay curves become non-exponential for the two highest concentrations, as shown in Fig. 15, we calculated the integrated lifetime. As expected, at RT, the long lifetimes of the Cr3+ R-line 2E → 4A2 spin forbidden transition at 694.3 nm in the Al2O3 phase decreases from 3.84 ms to 0.94 ms when the concentration increases from 0.4 to 1.9 at% Cr-doped for the binary eutectics. The concentration quenching effect is more pronounced in Cr-doped ternary, with the lifetime being as short as 0.21 ms for 1.9 Cr at%. This behavior is also noticeable when comparing luminescence decays of the broad band centered at 774.3 nm in the binary and ternary systems. For this wavelength, the decay curves are particularly non-exponential due to the competition of the relaxation process from the excited level to the emitting 4T2 level and the partial thermal equilibrium with the 2E levels. However, this thermal coupling being less efficient at a low temperature (77 K), it is observed that the values of decay times of the 4T2 → 4A2 allowed transition measured at 773.0 nm becomes shorter than at 300 K. Finally, the decay time of Cr-doped binary eutectics is in good agreement with Cr3+:Al2O3 powder,38 and ruby bulk crystals40 especially considering the lifetime of about 1 ms for 2 at% of the Cr–Cr pair emission of the N-lines measured at 704 nm under 532 nm at low temperature. It is interesting to note that the lifetime of the emission of Cr pairs is much shorter in the ternary 0.3 ms than in the binary eutectics 0.8 ms.
Table 3 The decay times (in ms) of various emissions under 450 nm and 532 nm excitation at 77 K
| Sample |
Excitation 532 nm |
Excitation 450 nm |
| 694.3 nm |
774.3 nm |
688.7 nm |
| Cr BE1 |
0.94 |
0.55 |
1.30 |
| Cr BE2 |
1.34 |
1.24 |
0.95 |
| Cr BE3 |
2.56 |
1.60 |
1.63 |
| Cr BE4 |
3.84 |
— |
1.78 |
| Cr TE1 |
0.21 |
0.09 |
0.33 |
| Cr TE2 |
0.63 |
0.97 |
0.64 |
| Cr TE3 |
1.29 |
0.92 |
1.33 |
| Cr TE4 |
3.30 |
1.08 |
1.77 |
Table 4 The decay times (in ms) of various emissions under 450 nm and 532 nm excitation at 77 K
| Sample |
Excitation 532 nm |
Excitation 450 nm |
| 694.3 nm |
704.0 nm |
773.0 nm |
687.3 nm |
| Cr BE1 |
0.74 |
0.81 |
0.61 |
4.80 |
| Cr BE2 |
0.56 |
0.81 |
0.72 |
3.10 |
| Cr BE3 |
2.10 |
1.87 |
1.08 |
6.27 |
| Cr BE4 |
6.13 |
4.37 |
0.97 |
7.28 |
| Cr TE1 |
0.30 |
0.26 |
0.30 |
1.67 |
| Cr TE2 |
0.19 |
0.28 |
0.54 |
2.04 |
| Cr TE3 |
0.77 |
0.80 |
0.62 |
5.54 |
| Cr TE4 |
3.92 |
3.81 |
1.34 |
6.21 |
 |
| | Fig. 15 Fluorescence decay curves of the 694.3 nm emission under 532 nm excitation in Cr-doped binary eutectics at RT. | |
Considering the luminescence decay time of the Cr-doped YAG phase at 687.3 nm recorded under 450 nm excitation, the lifetime at 77 K binary eutectic is measured to be about 7.28 ms for 0.4 at% Cr-doped, which is slightly smaller than the 8.8 ms measured in 0.05% at 7 K (ref. 39 and 44) but is slightly longer than that measured here in the Al2O3 phase in the same sample. It can be explained by a lower intermediate ligand crystal field strength Dq/Bp < 2.1 in YAG45 than in Al2O3 (Dq/B > 2.33),46 while the Cr3+ octahedral sites are slightly distorted27 in YAG. At room temperature, the lifetime of 1.77 ms in both binary and ternary eutectics is in total agreement with the value given by Bray et al.39,45 From Tables 2 and 3, one can note that the temperature quenching effect is stronger for the YAG phase than in the ruby-phase while the phonon energy cutoff is rather the same, 865 cm−1 and 910 cm−1,47 respectively. In the contrary, the concentration quenching is larger in Al2O3 than in the YAG phase; the lifetime decreases ten times between the highest and the lowest concentration at 77 K in Al2O3 and only three times in YAG. It suggests that the concentration of Cr in the YAG phase should be lower than in Al2O3-phase due to a lower segregation coefficient in YAG. Finally, as for Cr in the Al2O3 phase, the decay becomes also shorter in the ternary compound for Cr in the YAG phase, possibly because of the higher Cr concentration in ternary eutectics as already suggested from the analysis of the emission spectra or by the decay curves of the N-line emission of pairs. Finally, the dynamics of the new emission lines at 689 and 696 nm are the same as the Cr luminescence in the YAG phase.
4. Conclusion
In this work, Cr-doped Al2O3–YAG binary and Al2O3–YAG–ZrO2 ternary systems of eutectic ceramics were solidified from the melt by using the μ-PD technique. The coloration, morphology, microstructure, residual stress, and luminescence have been investigated. As a function of Cr-dopant concentration and the binary or ternary system, the relationship between the microstructure and the optical properties, and as a result, solidified eutectic ceramics with optimized microstructures have been elaborated. The Cr-doped eutectics present a red color. Whatever the dopant concentration, mainly two phases (Al2O3–YAG) in the binary system and three phases (Al2O3–YAG–ZrO2) in the ternary system are observed. The Chinese script microstructure, colonies and colony boundaries are observed in ternary eutectics. From the different sizes of YAG grains, the microstructure formation of binary eutectics depends on the chromium dopant concentration. Moreover, Al2O3 and YAG phases show faceted morphologies, but for the ZrO2 phase, growth tends to a weakly faceted manner and forms rods or lamellae. Whatever the Cr dopant concentration, the hydrostatic stress of the binary eutectics is less than that of ternary eutectics.
The spectroscopic properties of the Cr-doped eutectic clearly show that Cr3+ ions enter Al2O3 and YAG phases in octahedral sites. The increase in the intensity of the 4T2 → 4A2 emission band relative to the 2E → 4A2 lines, on the one hand, and the intensity ratio between the N-lines and R-lines recorded at 77 K, on the other hand, shows that the Cr concentration in Al2O3 phase should be higher in the ternary eutectic that in the binary eutectic. The analysis of the emission lifetime in both compounds corroborates this observation: the luminescence quenching by concentration is emphasised in the ternary eutectics. Furthermore, the concentration of Cr in the YAG phase is smaller than in the Al2O3 phase. Finally, new lines, which are coupled to the YAG phase, appear at low temperatures in the highest concentrated ternary eutectics.
Finally, the luminescence and spectroscopy of the doped Al2O3–YAG and Al2O3–YAG–ZrO2 systems are still in the early stages in comparison with chemical and mechanical properties, and research efforts in this field are still very recent. However, from the literature, it can be observed that the combination of the oxide eutectic compositions for optics has not yet been explored completely, and we are probably still in the early stages of research in this field.
Conflicts of interest
There are no conflicts to declare.
References
- Q. L. Sai, Z. W. Zhao, C. T. Xia, X. D. Xu, F. Wu, J. Q. Ji and L. L. Wang, Ce-doped Al2O3-YAG eutectic and its application for white LEDs, Opt. Mater., 2013, 35(12), 2155–2159 CrossRef CAS.
- S. Q. Song, X. D. Xu, J. Liu, X. S. Bu, D. Z. Li, P. Liu, Y. Z. Wang, J. Xu and K. Lebbou, Structure and white LED properties of Ce-doped YAG-Al2O3 eutectics grown by the micro-pulling-down method, CrystEngComm, 2019, 21, 4545–4550 RSC.
- H. T. Rocha, L. P. Ferreira and F. J. G. Silva, Analysis and Improvement of Processes in the Jewelry Industry, Procedia Manuf., 2018, 17, 640–644 CrossRef.
- F. Bertacchini, E. Bilotta, F. Demarco, P. Pantano and C. Scuro, Multi-objective optimization and rapid prototyping for jewelry industry: methodologies and case studies, Int. J. Adv. Manuf. Technol., 2021, 112(9), 2943–2959 CrossRef.
- W. J. Minford, R. C. Bradt and V. S. Stubican, Crystallography and microstructure of directionally solidified oxide eutectics, J. Am. Ceram. Soc., 1979, 62(3–4), 154 CrossRef CAS.
- O. Benamara and K. Lebbou, Orientations and seed type effect on Al2O3-YAG-ZrO2 eutectic microstructure solidified from the melt by the micro-pulling down technique, J. Eur. Ceram. Soc., 2021, 41(11), 5613–5623 CrossRef CAS.
- O. Benamara, M. Cherif, T. Duffar and K. Lebbou, Microstructure and crystallography of Al2O3–Y3Al5O12–ZrO2 ternary eutectic oxide grown by the micropulling down technique, J. Cryst. Growth, 2015, 429, 27–34 CrossRef CAS.
- O. Benamara and K. Lebbou, The impact of the composition and solidification rate on the microstructure and the crystallographic orientations of Al2O3–YAG–ZrO2 eutectic solidified by the micro-pulling down technique, RSC Adv., 2021, 11(22), 13602–13614 RSC.
- V. S. Stubican and R. C. Bradt, Eutectic Solidification in Ceramic Systems, Annu. Rev. Mater. Sci., 1981, 11, 267–297 CrossRef CAS.
- J. C. Wang, X. Y. Tang, P. Zheng, S. X. Li, T. L. Zhou and R. J. Xie, Self-thermal management YAG:Ce-Al2O3 color converters enabling high-brightness laser-driven solid state lighting in a transmissive configuration, J. Mater. Chem. C, 2019, 7, 3901–3908 RSC.
- T. Kang, S. Lee, J. Kim and J. Park, Thermal durability of YAG: Ce ceramic with containing Al2O3 and its Raman analysis, J. Lumin., 2020, 222, 117077 CrossRef CAS.
- Y. Waku, N. Nakagawa, T. Wakamoto, H. Ohtsubo, K. Shimizu and Y. Kohtoku, High-temperature strength and thermal stability of a unidirectionally solidified Al2O3/YAG eutectic composite, J. Mater. Sci., 1998, 33(5), 1217–1225 CrossRef CAS.
- L. Carroz and T. Duffar, Tuning the sapphire EFG process to the growth of Al2O3/YAG/ZrO2: Y eutectic, J. Cryst. Growth, 2018, 489, 5–10 CrossRef CAS.
- L. Mazerolles, L. Perriere, S. Lartigue-Korinek, N. Piquet and M. Parlier, Microstructures, crystallography of interfaces, and creep behavior of melt-growth composites, J. Eur. Ceram. Soc., 2008, 28(12), 2301–2308 CrossRef CAS.
- A. Laidoune, K. Lebbou, D. Bahloul, M. Smadi and M. Zereg, Yttria stabilized Al2O3–ZrO2 eutectic crystal fibers grown by the laser heated pedestal growth (LHPG) method, Opt. Mater., 2010, 32(7), 731–734 CrossRef CAS.
- M. C. Mesa, S. Serrano-Zabaleta, P. B. Oliete and A. Larrea, Microstructural stability and orientation relationships of directionally solidified Al2O3-Er3Al5O12-ZrO2 eutectic ceramics up to 1600° C, J. Eur. Ceram. Soc., 2014, 34(9), 2071–2080 CrossRef CAS.
- O. Benamara and K. Lebbou, Shaped ceramic eutectic plates grown from the melt and their properties, J. Cryst. Growth, 2016, 449, 67–74 CrossRef CAS.
- R. P. Ingel and D. Lewis III, Lattice parameters and density for Y2O3-stabilized ZrO2, J. Am. Ceram. Soc., 1986, 69(4), 325–332 CrossRef CAS.
- J. A. Krogstad, M. Lepple, Y. Gao, D. M. Lipkin and C. G. Levi, Effect of yttria content on the zirconia unit cell parameters, J. Am. Ceram. Soc., 2011, 94(12), 4548–4555 CrossRef CAS.
- J. H. Lee, A. Yoshikawa, T. Fukuda and Y. Waku, Growth and characterization of Al2O3/Y3Al5O12/ZrO2 ternary eutectic fibers, J. Cryst. Growth, 2001, 231(1–2), 115–120 CrossRef CAS.
- J. H. Lee, A. Yoshikawa, H. Kaiden, K. Lebbou, T. Fukuda, D. H. Yoon and Y. Waku, Microstructure of Y2O3 doped Al2O3/ZrO2 eutectic fibers grown by the micro-pulling-down method, J. Cryst. Growth, 2001, 231(1–2), 179–185 CrossRef CAS.
- F. J. Ester, A. Larrea and R. I. Merino, Processing and microstructural study of surface laser remelted Al2O3–YSZ–YAG eutectic plates, J. Eur. Ceram. Soc., 2011, 31(7), 1257–1268 CrossRef CAS.
- X. Wang, Y. J. Zhong, Q. Sun, Y. R. Li, W. Zhang, D. Q. Qi, D. Wang and B. L. Jiang, Crystallography and interfacial structure in a directionally solidified Al2O3/Y3Al5O12/ZrO2 eutectic crystal, Scr. Mater., 2018, 145, 23–27 CrossRef CAS.
- X. S. Fu, G. Q. Chen, Y. F. Zu, J. T. Luo and W. L. Zhou, Microstructure refinement approaches of melt-grown Al2O3/YAG/ZrO2 eutectic bulk, Ceram. Int., 2013, 39(7), 7445–7452 CrossRef CAS.
-
N. L. Vauquelin, Mémoire sur la découverte d'un nouveau métal à l'état d'acide et d'oxide dans le plomb rouge de Sibérie, le rubis et l'émeraude, et d'une nouvelle terre dans l'émeraude et le béril, in Journal de la Société des pharmaciens de Paris, 1797, 126, pp. 174–176 Search PubMed.
- J. LLorca and V. M. Orera, Directionally solidified eutectic ceramic oxides, Prog. Mater. Sci., 2006, 51(6), 711–809 CrossRef CAS.
- H. J. Su, J. Zhang, C. J. Cui, L. Liu and H. Z. Fu, Rapid solidification of Al2O3/Y3Al5O12/ZrO2 eutectic in situ composites by laser zone remelting, J. Cryst. Growth, 2007, 307(2), 448–456 CrossRef CAS.
- D. Reinen, Ligand-field spectroscopy and chemical bonding in Cr3+−containing oxidic solids, Struct. Bonding, 1969, 6, 30–51 CrossRef CAS.
-
R. G. Burns, Mineralogical applications of crystal field theory, Cambridge University Press, 1993, vol. 5 Search PubMed.
- J. I. Pena, M. Larsson, R. I. Merino, I. de Francisco, V. M. Orera, J. LLorca, J. Y. Pastor, A. Martin and J. Segurado, Processing, microstructure and mechanical properties of directionally-solidified Al2O3–Y3Al5O12–ZrO2 ternary eutectics, J. Eur. Ceram. Soc., 2006, 26(15), 3113–3121 CrossRef CAS.
- B. M. Epelbaum, A. Yoshikawa, K. Shimamura, T. Fukuda, K. Suzuki and Y. Waku, J. Cryst. Growth, 1999, 198–199, 471–475 CrossRef.
- J. H. Lee, A. Yoshikawa, S. D. Durbin, D. H. Yoon, T. Fukuda and Y. Waku, J. Cryst. Growth, 2001, 222, 791–796 CrossRef CAS.
- J. H. Lee, A. Yoshikawa, H. Kaiden, T. Fukuda, D. H. Yoon and Y. Waku, J. Cryst. Growth, 2001, 231, 179–185 CrossRef CAS.
- L. Mazerolles, N. Piquet, M. F. Trichet, L. Perrière, D. Boivin and M. Parlier, New microstructures in ceramic materials from the melt for
high temperature applications, Aerosp. Sci. Technol., 2008, 12(7), 499–505 CrossRef CAS.
- J. He and D. R. Clarke, Polarization Dependence of the Cr3+ R-Line Fluorescence from Sapphire and Its Application to Crystal Orientation and Piezospectroscopic Measurement, J. Am. Ceram. Soc., 1997, 80(1), 69–78 CrossRef CAS.
- A. J. Pardo, R. I. Merino, V. M. Orera and J. I. Pena, Piezospectroscopic study of residual stresses in Al2O3–ZrO2 directionally solidified eutectics, J. Am. Ceram. Soc., 2000, 83(11), 2745–2752 CrossRef.
- A. Sayir and S. C. Farmer, The effect of the microstructure on mechanical properties of directionally solidified Al2O3/ZrO2 (Y2O3) eutectic, Acta Mater., 2000, 48(18–19), 4691–4697 CrossRef CAS.
- O. A. Capeloto, N. E. de Souza and I. A. Santos,
et al., Preparation, structural and spectroscopic study of sol-gel-synthesized Cr3+:Al2O3 powder, SN Appl. Sci., 2019, 1(12), 1–7 Search PubMed.
- P. R. Wamsley and K. L. Bray, The effect of pressure on the luminescence of Cr3+: YAG, J. Lumin., 1994, 59(1–2), 11–17 CrossRef CAS.
- R. C. Powell, B. DiBartolo and B. Birang,
et al., Fluorescence studies of energy transfer between single and pair Cr3+ systems in Al2O3, Phys. Rev., 1967, 155(2), 296 CrossRef CAS.
- S. Geller, Crystal chemistry of the garnets, Z. Kristallogr. Cryst. Mater., 1967, 125(1–6), 1–47 CAS.
- T. H. Maiman, R. H. Hoskins and I. J. D'Haenens,
et al., Stimulated optical emission in fluorescent solids. II. Spectroscopy and stimulated emission in ruby, Phys. Rev., 1961, 123(4), 1151 CrossRef CAS.
- V. Mykhaylyk, H. Kraus and Y. Zhydachevskyy,
et al., Multimodal non-contact luminescence thermometry with Cr-doped oxides, Sensors, 2020, 20(18), 5259 CrossRef CAS PubMed.
- A. P. Vink and A. Meijerink, Electron-phonon coupling of Cr3+ in YAG and YGG, J. Lumin., 2000, 87–89, 601–604 CrossRef CAS.
- Y. R. Shen and K. L. Bray, Effect of pressure and temperature on the lifetime of Cr3+ in yttrium aluminum garnet, Phys. Rev. B: Condens. Matter Mater. Phys., 1997, 56, 10882 CrossRef CAS.
- S. Agachi, Luminescence spectroscopy of Cr3+ in Al2O3 polymorphs, Opt. Mater., 2021, 114, 111000 CrossRef.
- R. Wannemacher and J. Heber, Cooperative Emission of Photons by Weakly Coupled Chromium Ions in A12O3, Z. Phys. B: Condens. Matter, 1987, 65, 491–501 CrossRef CAS.
|
| This journal is © The Royal Society of Chemistry 2023 |
Click here to see how this site uses Cookies. View our privacy policy here. 
 Open Access Article
 This Open Access Article is licensed under a Creative Commons Attribution-Non Commercial 3.0 Unported Licence
 a,
G.
Ledoux
a,
G.
Ledoux