
 Open Access Article
 This Open Access Article is licensed under a
 Creative Commons Attribution 3.0 Unported Licence
Phase stability studies on transition metal phosphates aided by an automated synthesis†
Stephanos
Karafiludis
 *ab,
Tom William
Ryll
ab,
Ana G.
Buzanich
a,
Franziska
Emmerling
ab and
Tomasz M.
Stawski
*a
*ab,
Tom William
Ryll
ab,
Ana G.
Buzanich
a,
Franziska
Emmerling
ab and
Tomasz M.
Stawski
*a
aFederal Institute for Materials Research and Testing, Richard Willstätter Str, 11 10249 Berlin, Germany. E-mail: tomasz.stawski@bam.de; stephanos.karafiludis@bam.de
bDepartment of Chemistry, Humboldt-Universität zu Berlin, Brook-Taylor-Straße 2, 12489 Berlin, Germany
First published on 12th July 2023
Abstract
Transition metal phosphates (TMPs) have attracted interest as materials for (electro-) catalysis, and electrochemistry due to their low-cost, stability, and tunability. In this work, an automated synthesis platform was used for the preparation of transition metal phosphate crystals to efficiently explore the multidimensional parameter space, determining the phase selection, crystal sizes, shapes. By using X-ray diffraction and spectroscopy-based methods and electron microscopy imaging, a complete characterization of the phase stability fields, phase transitions, and crystal morphology/sizes was achieved. In an automated three-reactant synthesis, the individual effect of each reactant species NH4+, M2+, and PO43− on the formation of transition metal phosphate phases: M-struvite NH4MPO4·6H2O, M–phosphate octahydrate M3(PO4)2·8H2O with M = Ni, Co and an amorphous phase, was investigated. The NH4+ concentration dictates the phase composition, morphology, and particle size in the Ni-system (crystalline Ni-struvite versus amorphous Ni–PO4 phase), whereas in the Co-system all reactant species – NH4+, Co2+, and PO43− – influence the reaction outcome equivalently (Co-struvite vs. Co–phosphate octahydrate). The coordination environment for all crystalline compounds and of the amorphous Ni–PO4 phase was resolved by X-ray absorption spectroscopy, revealing matching characteristics to its crystalline analogue, Ni3(PO4)2·8H2O. The automated synthesis turned out to be significantly advantageous for the exploration of phase diagrams due to its simple modularity, facile traceability, and enhanced reproducibility compared to a typical manual synthesis.
Introduction
The systematic experimental exploration of phase diagrams and the associated evaluation of various reaction conditions are the essence of solution-based crystallization of inorganic materials and mineral phases.1–5 Typically, multidimensional correlations among physicochemical conditions must be considered, implying high requirements for reproducibility, accuracy, and handling of multiple reactants at the same time.Automated synthesis is an effective way to streamline processes, manage many potentially repetitive experiments and improve accuracy and reproducibility. Self-driving laboratories,6,7 material acceleration platforms8 or modular stages9 thereof allow the exploration of different conditions quickly while maintaining control over key physicochemical parameters. In a classical laboratory approach, a manual synthesis procedure is prone to errors and biases. They may reduce reproducibility, and contribute to increased uncertainties of the reaction volumes, and contamination of the products/reactants. In contrast, in an automated approach, by storing protocol metadata, such as pumping rates, addition times, stirring rates, etc., it is possible to fine-tune each automated procedure of a given synthesis. This leads to a high level of control and traceability and may reveal non-obvious correlations in a crystallization process. In addition, automated syntheses coupled with e.g., Bayesian optimization methods10–12 allow for more targeted exploration of physicochemical properties. Thereby a faster convergence on desired properties is reached, without the need for “raster scanning” the entirety of potentially multidimensional combinations.11,13
The aim of this work was to use an automated synthesis platform, the Chemputer,9,14–16 to synthesize two transition metal phosphate compounds, M-struvite NH4MPO4·6H2O and M–phosphate octahydrate M3(PO4)2·8H2O, where M = Ni2+, Co2+.17–19 Transition metal phosphates (TMPs) have attracted considerable attention as functional materials for electro-, photo- or organic catalysis, and proton exchange membranes.20–26 For example, TMPs are known as cost-effective cathode materials in lithium/sodium battery technologies,27–30 for their adequate catalytical performance in the oxygen evolution reaction31–33 or in organic reactions34–36 such as the selective oxidation of methane.37
Subsequently, the design of a functional molecular solid is fundamental to obtain an optimal customized material for a certain applicational use. This so-called “crystal engineering”, the understanding of intermolecular interactions on a desired compound, includes among other parameters the influence of the reactant concentration on phase stability and morphology.
In a previous study,2 we showed how to precipitate TMPs from aqueous solutions at concentrations analogous to those found in wastewaters. In a typical manual synthesis reaction M-struvite or M-octahydrate precipitated by mixing two aqueous solutions, a phosphate, and a metal-salt bearing solution. In general, the considered precipitation reaction of M-struvite, upon which we also relied in our automated synthesis, is described according to the following mass-balance equation (eqn (1)):
| M2+(aq) + NH4+(aq) + HxPO43−x(aq) + 6H2O → NH4MPO4·6H2O(s) + xH+(aq) | (1) |
| 2HxPO43−x(aq) + 3M2+(aq) + 8H2O → M3(PO4)2·8H2O(s) + 2xH+(aq) | (2) |
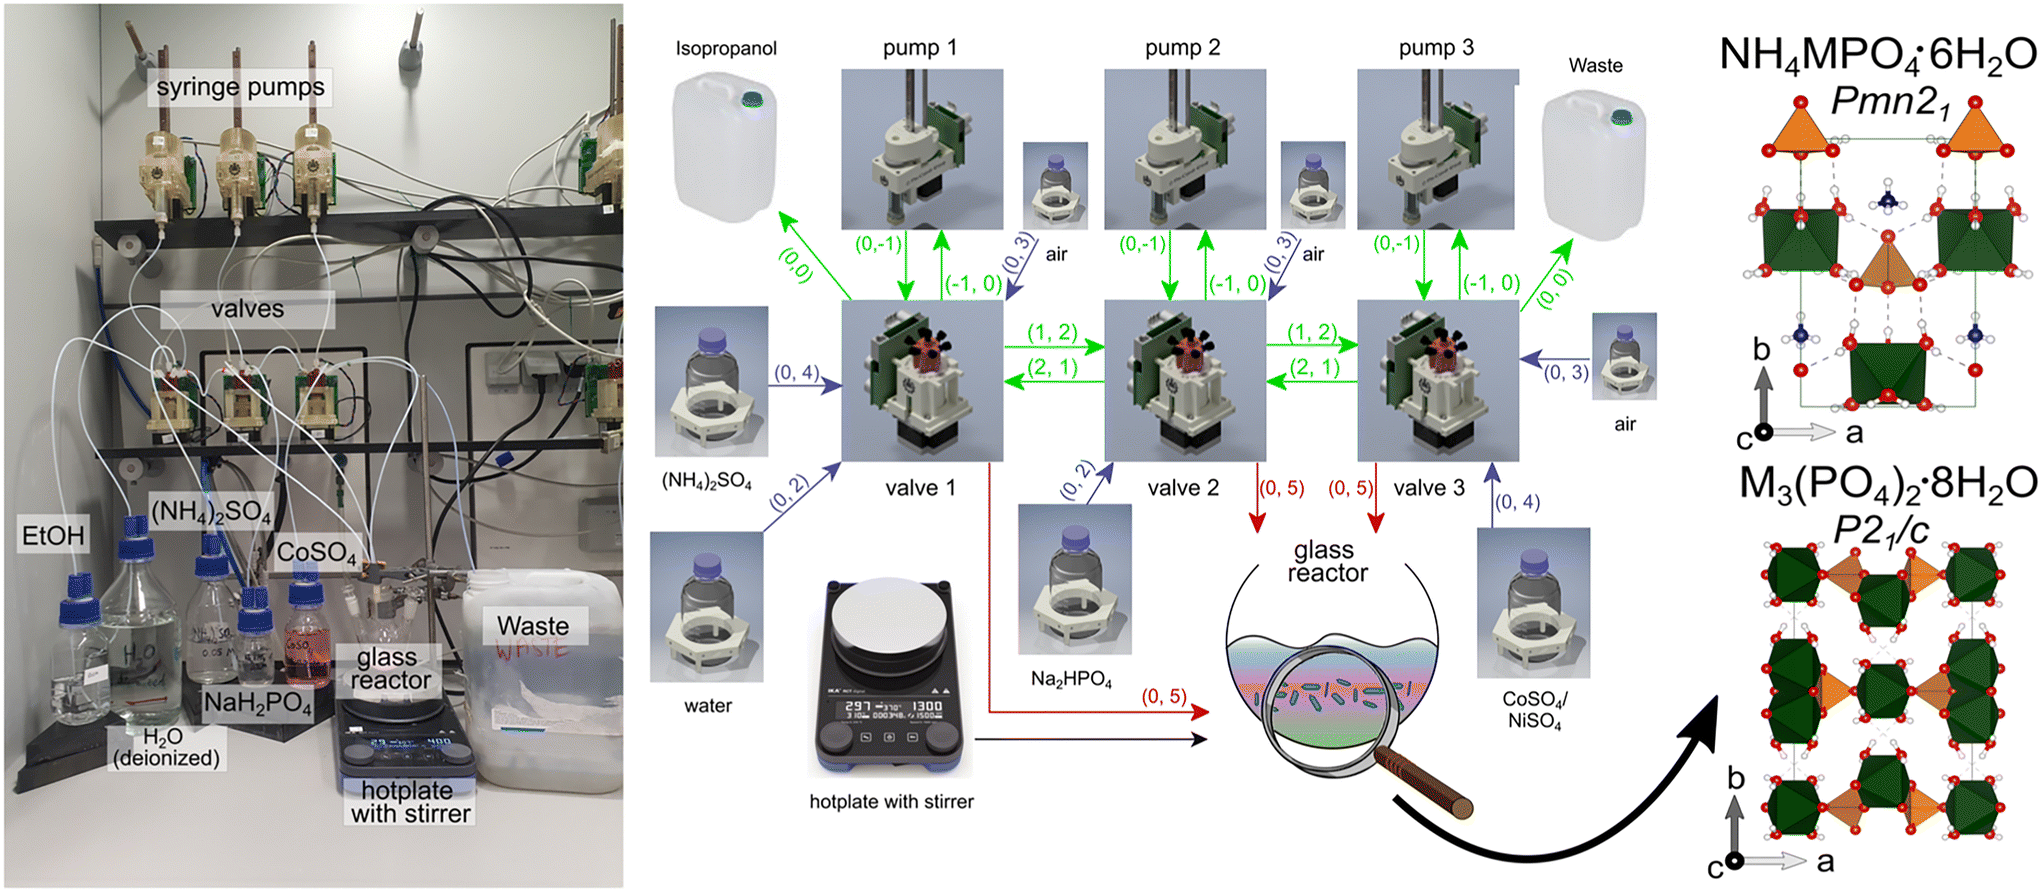 | ||
| Fig. 1 Photograph and scheme rendered from a GraphML file39 of the Chemputer platform employed for transition metal phosphate synthesis (ESI:† reaction_graph_TMP_synthesis.graphml). Scheme: icons represent each part of the Chemputer (valves, flasks, reactor) as graph nodes containing metadata for the computer control. All this metadata is required by the software API.16 Each arrow explains a unilateral directing dependency and mechanical linkage through the tubing of one to another component, except for the black arrow (stirring plate for reactor). For example, “(0, 4)” encodes a connection originating from port 0 (default for storage vessels) and links to port 4 on a valve (liquid flows from flask to storage vessel). For clarity, the colours of the arrows encode their function: green arrows = tubing in the Chemputer backbone, blue arrows = tubing to storage flasks, and red arrows = tubing to the reactor. The as-obtained mainly crystalline phases were further analysed: M-struvite space group: Pmn21, M–phosphate octahydrate P21/c. | ||
By using separate sources for metal (M) (metal sulfate), ammonium (N) (ammonium sulfate), and phosphate (P) (sodium hydrogen phosphate) in the automated synthesis, the M![[thin space (1/6-em)]](https://www.rsc.org/images/entities/char_2009.gif) :N:P ratio could be varied in the precipitation. In this study, we show that transition metal phosphates (TMPs) are a suitable material class to be synthesized in an automated manner because of their fast reaction kinetics and facile precipitation. In this work, we preformed automated synthesis of TMPs within a pre-defined window of reaction conditions known from a previous manual synthesis10 to investigate in detail the phase boundaries and stabilities of the as-obtained materials. By performing such automated synthesis, we further refine and extend the knowledge of Ni and Co TMPs' phase stabilities, boundaries, and crystallization depending on the physicochemical reaction conditions, i.e. the concentration of the individual reactants c(NH4+, PO43−, M2+) or pH. Thereby, the effects of each reactant on the phase stability, crystal morphology, and size were investigated individually. In this way, we could separate each influence factor in contrast to previous studies which used ammonium and phosphate in a combined DAP (NH4)2HPO4 reactant with a fixed N:P ratio of two.2,38
:N:P ratio could be varied in the precipitation. In this study, we show that transition metal phosphates (TMPs) are a suitable material class to be synthesized in an automated manner because of their fast reaction kinetics and facile precipitation. In this work, we preformed automated synthesis of TMPs within a pre-defined window of reaction conditions known from a previous manual synthesis10 to investigate in detail the phase boundaries and stabilities of the as-obtained materials. By performing such automated synthesis, we further refine and extend the knowledge of Ni and Co TMPs' phase stabilities, boundaries, and crystallization depending on the physicochemical reaction conditions, i.e. the concentration of the individual reactants c(NH4+, PO43−, M2+) or pH. Thereby, the effects of each reactant on the phase stability, crystal morphology, and size were investigated individually. In this way, we could separate each influence factor in contrast to previous studies which used ammonium and phosphate in a combined DAP (NH4)2HPO4 reactant with a fixed N:P ratio of two.2,38
Methods
Synthesis
Diammonium sulfate (NH4)2SO4 (DAS) (ChemSolute, 99%), NiSO4·6H2O (ChemSolute, 99%), CoSO4·7H2O (Alfa Aesar, 98%), disodium hydrogen phosphate Na2HPO4 (ChemSolute, 99%) (DSP) and diammonium hydrogen phosphate (NH4)2HPO4 (ChemSolute, 99%) (DAP) were used to synthesize transition metal phosphate phases of Ni and Co.The actual synthesis of transition metal phosphates was performed using the Chemputer platform.14 The specific hardware and software considerations are described in the next section. At first 1 M stock solutions of DAS, DSP, DAP, and metal salts were prepared freshly prior to each synthesis. The aqueous solutions were prepared by dissolving the calculated amount of salt in double ionized water (>18 MΩ cm−1) and filtering them with a hydrophilic filter (pore size = 0.45 μm, CHROMAFIL®). The stock solutions were further diluted to the concentration required by pumping with the Chemputer different amounts of stock solution and deionized water.
Unless stated otherwise, all steps were conducted in a fully automated manner using the Chemputer (Fig. 1). Before the start of the synthesis, the elements of the platform backbone (syringes, valves, and tubing) had been cleaned with nitric acid (30% wt) by pumping the solution, followed by six transfers of deionized water to remove any remaining acid. The transfer paths were subsequently dried by pumping ethanol and acetone three times, followed by pumping air to remove both solvents. After attaching the reactants' stock solutions to the device, prior to and after each synthesis, 3 ml of the solutions were flushed through the system to prevent any contamination and to eliminate the dead volume of the tubes. The synthesis was conducted by running the control Python script using the Chempiler API.16 Finally, before each synthesis, 3 ml of each solution used was flushed through the system to avoid any contamination and to eliminate the dead volume of the tubes.
The Chemputer pumped the reactant solutions, 10 ml of MSO4, (NH4)2SO4, Na2HPO4, and (NH4)2HPO4 at different concentrations (1–10−4 M) into a glass reactor with a magnetic stirrer (400 rpm) at room temperature (25 °C). To characterize the reaction conditions and the corresponding samples, the N (ammonium):M (metal):P (phosphate) ratio is introduced. The upwards or downwards pointing arrows indicate an increase (↑) or decrease (↓) in concentration, respectively. An extended discussion considering the propagation of uncertainties, among others because of dead volumes, pumping inaccuracies, and dilution errors can be found in the ESI† (Note S1). The described automated synthesis is depicted in a diagram in Fig. 1. Before the analyses, the solid phases precipitated from the mixed solutions were collected onto a cellulose filter (pore size 1 μm, LABSOLUTE) by using a vacuum filtration kit (i.e. Büchner funnel). Afterwards, the powders were washed with deionized water and left to dry in air at room temperature for 2 hours.
In the Ni system, amorphous phases formed at low concentrations of ammonium. For comparison of the coordination environment of these amorphous phases, crystalline nickel(II)phosphate octahydrate was synthesized additionally with the Chemputer through a hot wet synthesis (ESI:† Fig. S1C). Here, 10 ml of 0.1 M of phosphate-bearing solutions (DAP and DSP were tested) and 10 ml of a 0.1 M nickel sulfate solution were heated at 80 °C. Then, the metal-bearing solution is pumped into the glass reactor containing the hot phosphate solution, while the mixture is stirred by a magnet (400 rpm) and continuously heated at 80 °C. After extended reaction times of several hours, the mixed solution was allowed to cool to room temperature. At the end, the same procedure to extract solids was performed, as with the other samples.
The as-obtained transition metal phosphates were further characterized by X-ray diffraction (XRD), scanning electron microscope (SEM), and X-ray absorption spectroscopy (XAS).
X-ray diffraction
Powder X-ray diffraction (PXRD, XRD) data from the precipitated powders were collected on a D8 Bruker Diffractometer equipped with an LYNXEYE XE-T detector. Diffraction was measured with Cu Kα radiation (1.5406 Å, 40 kV, and 40 mA) from 5–60° using a step size of 0.015° (2θ) and a scanning time of 0.5 s per step.SEM
The scanning electron microscopy (SEM) characterization was conducted on an FEI XL 30 tungsten cathode scanning electron microscope operating at 20 keV and using a secondary electron detector. Before the analysis, all samples were sputter coated with a 30 nm thick layer of gold.Infrared spectroscopy
FT-IR analysis was performed to characterize the chemical composition of the amorphous Ni–PO4 phase in comparison to the crystalline phases. For this purpose, we used a Nicolet Nexus 670 FT-IP machine (Thermo Fischer Scientific) in an attenuated total reflection (ATR) mode with a “Golden Gate” sample holder. Before each measurement, the sample holder was cleaned with ethanol and acetone. Air was measured, as a background spectrum. 32 scans were taken with a resolution of 4 cm−1 per measurement. The spectral range was set to 4000–570 cm−1 and the spectra were recorded in an absorption mode. All spectra were acquired using the Omnic software v9.2 and exported as a CSV file format.X-ray absorption spectroscopy (XAS)
To evaluate and compare the metal coordination environments in different phases obtained through synthesis, XANES (near-edge X-ray absorption fine structure) and EXAFS (extended X-ray absorption fine-structure) spectroscopy measurements were performed at the BAMline (BESSY-II, Helmholtz Centre Berlin for Materials and Energy Berlin, Germany).40The beam was monochromatized using a silicon double-crystal monochromator (DCM) with a crystallographic orientation of [111]. The size of the beam was 3 mm (l) × 1 mm (h). The measurements were performed at the Co-K edge (7709 eV) and Ni-K edge (8333 eV) in transmission geometry, with two ionization chambers as detectors. The excitation energy was varied from 7606 eV to 8678 eV for Co and 8230 eV to 9302 eV for Ni, with varying energy steps. For the pre-edge region, the energy was varied in 10 eV steps; for the region around the edge, the energy was tuned first in 0.5 eV steps, then in 1 eV steps, and in the EXAFS region with a constant step in the k-space of 0.04 Å−1. The associated uncertainties were experimentally determined by measuring cobalt and nickel metal foils, 10 times each. A value of ±0.3 eV was obtained for both systems. The measurements were performed in transmission. The samples were mixed with boron nitride, placed in polycarbonate hole plates with a thickness of 1 mm, and sealed with a polyimide tape (Kapton) on both sides. Before collecting the sample spectra, a cobalt or nickel foil was used as a reference for the respective K edges. The relative energies of the spectra were calibrated to the first inflection point from the first derivative of the cobalt/nickel metal absorption edge.
The resulting EXAFS data were processed by using ATHENA and ARTEMIS. Both programs belong to the main package IFEFFIT (v. 1.2.11).41 All crystallographic structures were visualized with VESTA (v. 3.5).42
Results & discussion
Exploration of phase compositions, boundaries, and stability fields
In all diagrams, we refer exclusively to the concentration of the significant ions c(NH4+), c(PO43−), or c(M2+) rather than to one of the used reactants ((NH4)2SO4, Na2HPO4, MSO4, Fig. 2 and 3). For studying the effect of each reactant species on the phase stability, each parameter (c(NH4+), c(PO43−), and c(M2+)) was independently varied (Fig. 2 and 3). Therefore, the remaining reaction parameters were kept constant. By evaluating the phase composition at given reaction conditions, the phase stability fields can be visualized and approximated (black dotted lines in Fig. 3). Ni-struvite NH4NiPO4·6H2O is stable in most tested reaction conditions visible in the diffractograms, as we elucidate further (Fig. 2). The amount of crystalline phases decreased with decreasing ammonia concentrations (Fig. 2A) while the proportion of amorphous phases rises simultaneously (ESI:† Fig. S1B). Below 0.06 M of ammonium NH4+ and N:M:P ratio of 1:10:10, amorphous phases formed beside crystalline Ni-struvite. At very low concentrations of NH4+ below 0.002 M (<1:50:50), the amorphous phase is the only stable phase. The low ammonium concentration restricted most likely the formation of an ammonium containing phase such as Ni-struvite. In all the analysed samples with varied Ni2+ or phosphate PO43− concentrations, only Ni-struvite precipitated as a single phase, regardless of concentrations of both components (Fig. 2B and C). In the three-dimensional reactant diagram, this dependency of the phase composition on the reactant concentration is visualized (Fig. 3). In the Co-system, several crystalline phases were observed. At high ammonium concentration of c(NH4+) = 2 M and low M/P ratios <0.4, Co-struvite (COS) precipitated as a single phase. At medium metal concentrations of c(M2+) = 0.08 M and high M/P ratios >0.6, Co–phosphate octahydrate (CPO) replaced Co-struvite as the stable phase. For all concentrations and the M/P ratio in between, both Co–phosphate phases formed. Since Co-struvite has a N:M:P ratio of 1:1:1 and CPO an N:M:P ratio of 0:3:2 it is ambiguous whether Co-struvite formation is driven by high c(NH4+), c(PO43−) and low c(M2+) [N↑P↑M↓], while the CPO formation is promoted by low c(NH4+), c(PO43−) and high c(M2+) [N↓P↓M↑]. Visible in the Co–[PO43−] and [Co2+]-series, CPO forms as a single phase in both systems at a given c(NH4+) = 0.15 M above an M/P ratio of >0.6. A significant finding of our syntheses from three independent components was the strong dependency of the M/P ratio and the ammonium NH4+ concentration on the associated phase stabilities. High ammonium concentrations shifted the phase stability to COS, while low concentrations stabilized CPO. Hence, by varying the ammonium content, a single, or binary phase composition of COS, CPO, or both could be obtained for a constant M/P ratio of 0.6, which otherwise for a two-component synthesis2,43 would always yield CPO. Two reasons could be considered to explain the change in phase composition as a function of ammonium concentration: the effect of NH4+/NH3 on the reaction kinetics/stability of the phases, or the indirect pH drop by dissociation of the ammonium to ammonia. To verify this hypothesis, we performed the same synthesis but neutralized the pH to around 7 of ammonium sulfate by adding the equivalent amount of 0.1 M NaOH(aq) (ESI:† Fig. S1A). Thus, adding a neutral ammonium sulfate solution, the pH effect is neglected. In both pH synthesis of CPO and COS ([NH4+] = 0.1 M vs. [NH4+] = 1.0 M), the phase composition remained similar compared to the non-pH adjusted samples. This result proves the significant role of NH4+ in the phase stability and precipitation reaction.
 | ||
| Fig. 2 Diffractograms of Ni–phosphates [(A) NH4+-series, (B) PO43−-series and (C) Ni2+-series] and of Co–phosphates (D–F) [(D) NH4+-series, (E) PO43−-series and (F) Co2+-series] synthesized for different reaction conditions; Ni-struvite (NIS) reference database ICSD 403058; Co-struvite reference ICSD 170042; Co–phosphate octahydrate reference COD 2020362. | ||
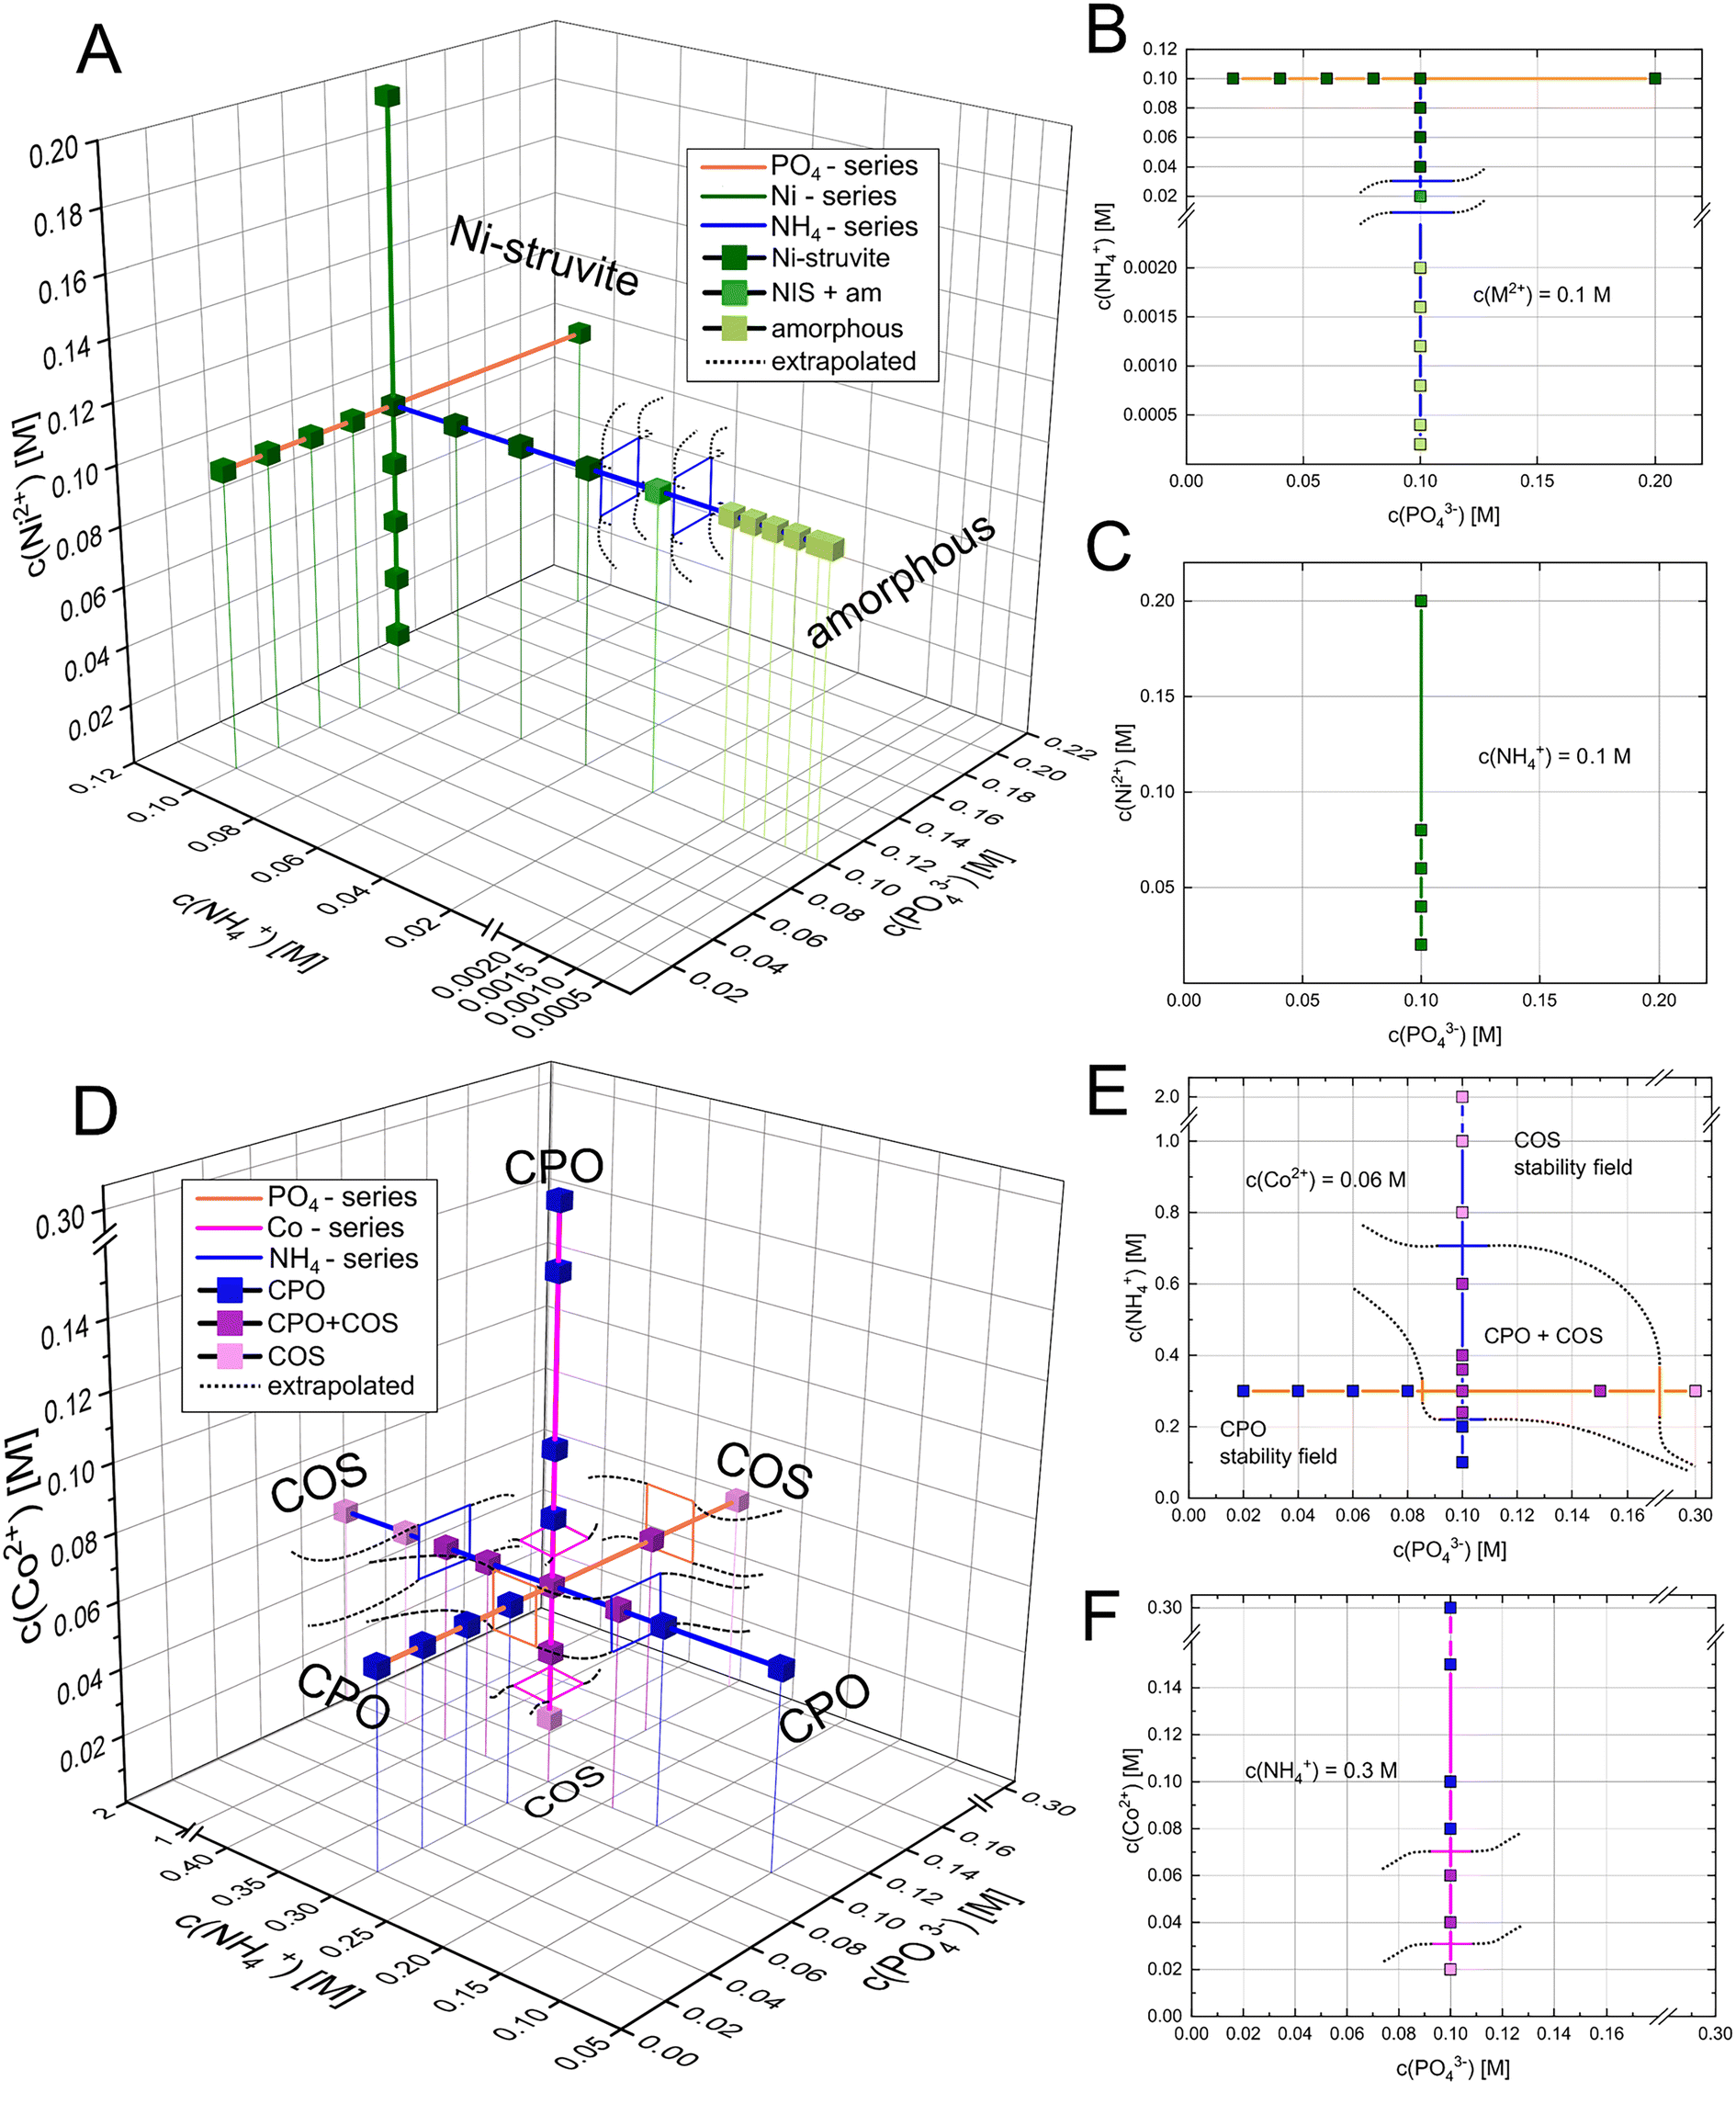 | ||
| Fig. 3 Three-dimensional phase stability diagram of Ni– (A) and (D) Co–phosphate phases with 2D projections of the (B and E) PO43−–NH4+-plane and the PO43−–M2+ plane with M = Ni (C) or Co (F). Coloured lines represent the varying concentration of each ionic species (orange-PO43−, pink-Co2+, and blue-NH4+) while the colour of the cubes marks the distinct phase composition (blue-CPO, purple-CPO + COS, pink-COS). Black dotted lines indicate the boundaries of the phase stability field (approximated). | ||
If we plot the phase composition in three-dimensional reactant space and extrapolate the assumed phase boundaries, the potential phase stability fields can be visualized. An intersection of two-phase stability fields represents the field of a binary phase mixture (note that extrapolated phase boundaries may significantly differ from the real boundary). In the Ni-system, the phase stability field of Ni-struvite is relatively broad. For instance, at concentrations of 0.1 M NH4+, a varying metal or phosphate concentration just limited the amount of precipitated solid but not the phase composition. It is only restricted in the NH4+ direction, as it is substituted by the amorphous phase as a stable phase below concentrations of 0.02 M NH4+. Looking at the Co-system, the stability fields of Co-struvite at [N↑P↑M↓], and CPO at [N↓P↓M↑] intersect in a field of binary phase mixture between 0.04 M NH4+:0.06 M Co2+:0.1 M PO43− [2:3:5], 0.24 M NH4+:0.06 M Co2+:0.1 M PO43 [12:3:5], 0.3 M NH4+:0.04 M Co2+:0.1 M PO43 [15:2:5], 0.3 M NH4+:0.06 M Co2+:0.15 M PO43 [10:2:5] (in brackets the corresponding N:M:P ratio).
Phase morphology and transitions
As each phase exhibits an individual morphology depending starkly on the concentrations of the reactants, the crystal habit gives hints about the phase composition and reaction conditions. Therefore, we wanted to look more at the μm-sized crystal surfaces and sizes with SEM. Based on SEM images, the lengths of intact crystals and amorphous particles were measured. Exemplary size distribution histograms of the different Ni– and Co–phosphate samples can be found in the ESI† (Fig. S2 and S3).In the Ni system, the crystal habit of Ni-struvite and the occurrence of an amorphous phase is majorly influenced by the different concentrations of the reactants. Raising the ammonium concentration leads to a more elongated crystal habit and a slightly increased average size and more unimodal size distribution of the Ni-struvite crystals (NH4+ = 0.2 mM with μ ± σ = 15 ± 11 μm, NH4+ = 0.1 M with μ ± σ = 17 ± 5 μm, Fig. 4 and S4†). The amorphous phases, which form at a low concentration of c(NH4+) ≤ 0.02 M with an N:M:P ratio < 1:10:10 show large agglomerates with a more oblate/rounded form and a flaky morphology. Primitive, roughly ordered facets are visible, imitating a crystalline front. The agglomerated grains (>20 μm) are composed of flaky particles of nm-size comprising the incrustation of the surfaces. In addition, the size of the agglomerated particles changes significantly in length, resulting in a multimodal size distribution (ESI:† Fig. S2A and B). Increasing nickel (Ni2+ = 0.02 M with μ ± σ = 11 ± 4 μm, Ni2+ = 0.2 M with μ ± σ = 24 ± 16 μm, ESI:† Fig. S4) or phosphate (PO43− = 0.02 M with μ ± σ = 11 ± 3 μm, PO43− = 0.2 M with μ ± σ = 17 ± 6 μm, ESI:† Fig. S4) concentrations led to a slight increase in the crystallite size. Simultaneously, the crystal developed clear facets without incrustation of tiny particles in the samples with high M:P ratio samples (0.1 M NH4+:0.1 M Ni2+:0.02 M PO43 [10:10:2] and 0.1 M NH4+:0.2 M Ni2+:0.1 M PO43 [1:2:1]) (Fig. 4, S2 and S4†). Ni-struvite crystals growing in high metal compared to low phosphate concentrations, thus in a high M:P ratio, developed ideally in their elongated prismatic shape compared to samples with a low M:P ratio. Interestingly, this finding from our automated synthesis, which reveals the optimal growth conditions in the N↑P↓M↑ range, is at first sight contradictory to our previous results.2 As we reported, the use of a single-compound solution of ammonia and phosphate, such as (NH4)2HPO4 leads to well-developed crystal facets in the low M/P region. We explain this discrepancy most likely by the concentration of ammonium, which dominates as the most important factor for promoting the crystal growth and elongation of Ni-struvite crystals. Its effect on the crystal surfaces can compensate for the influence of lowered metal or enhanced phosphate concentration. These results are in agreement with the literature,43–45 as similar trends were found in the much more investigated Mg-struvite system.38,46,47
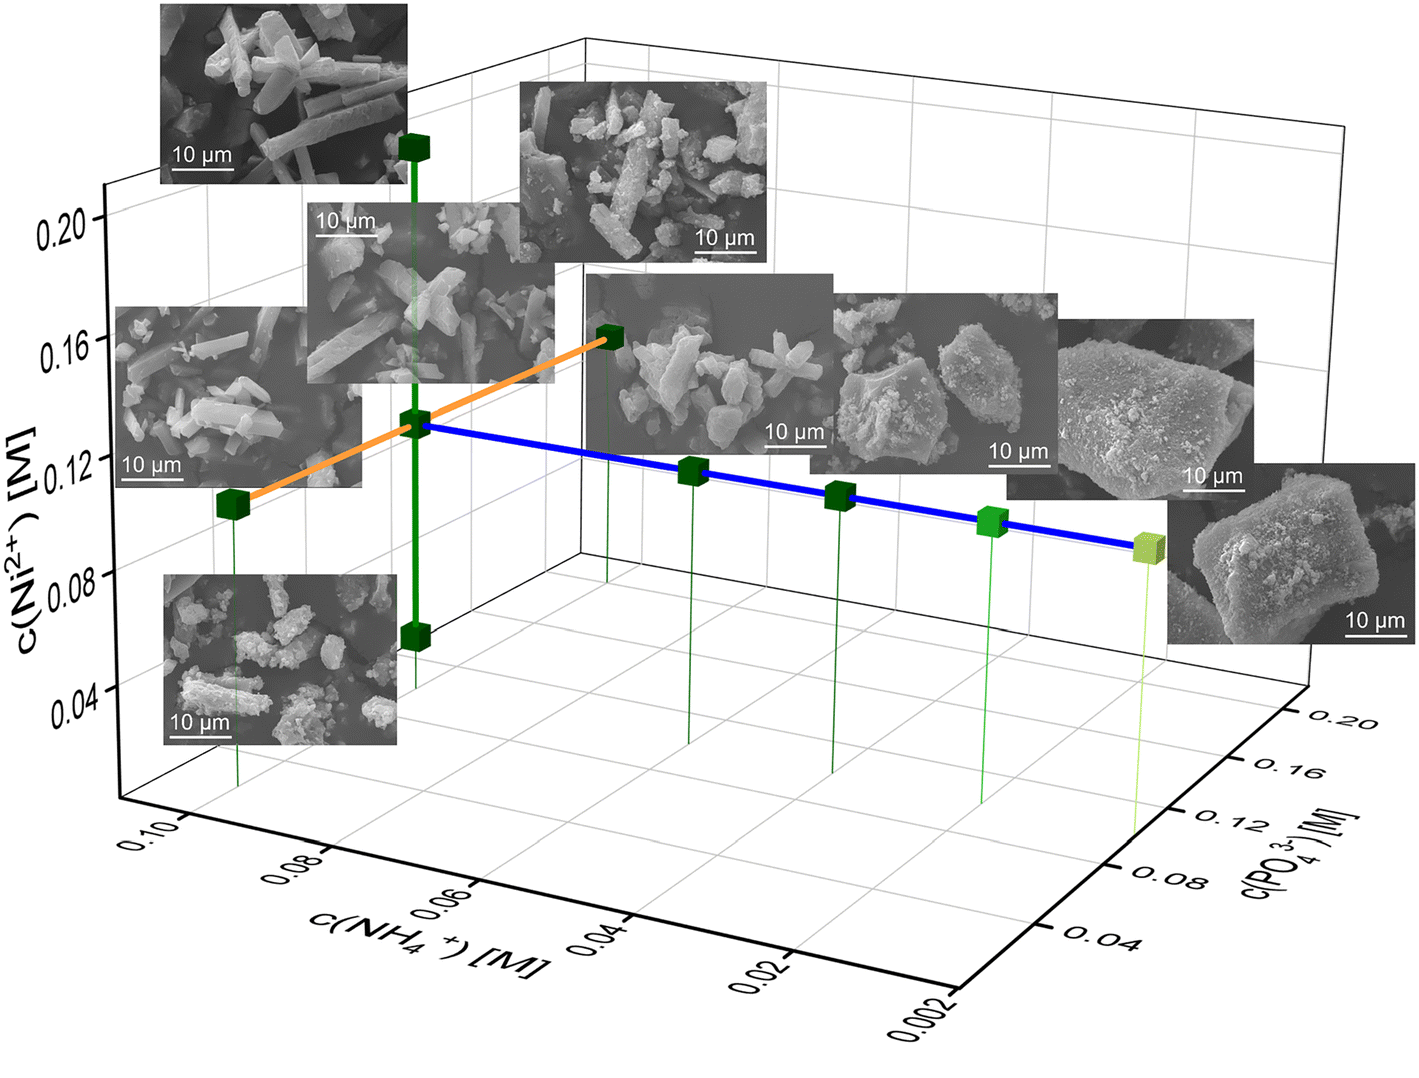 | ||
| Fig. 4 Three-dimensional phase stability diagram of Ni–phosphate phases in the c(NH4+), c(PO43−), and c(Co2+) space with SE images of the corresponding sample. Note the morphology change simultaneously with the change in phase composition. | ||
In the Co-system, as two crystalline phases may occur, Co-struvite NH4CoPO4·6H2O and Co–phosphate octahydrate (CPO) Co3(PO4)2·8H2O, which either contain ammonium ion or not, the crystallization trends are, in general, more complex than in the Ni system (Fig. 5). As mentioned before, Co-struvite forms in the [N↑P↑M↓] region, while CPO replaces it as the stable phase in the [N↓P↓M↑] region. Crystals of both phases agglomerate extensively, and in those agglomerates, CPO exhibits more of a flaky granular shape compared to more regular tabular-prismatic Co-struvite crystals. Higher ammonium concentrations promote an increase in the thickness and elongation of the struvite crystals, as we also observed in the Ni system (NH4+ = 0.1 M with μ ± σ = 4 ± 1 μm [CPO], NH4+ = 1.0 M with μ ± σ = 17 ± 5 μm [Co-struvite], ESI:† Fig. S5). At a low M/P ratio regardless of lowered phosphate or metal concentration, Co-struvite developed an anhedral shape (at various Co2+ and PO43− with μ ± σ = 4 ± 2 μm, ESI:† Fig. S5). At high Co2+ concentrations, the CPO crystals seem to develop euhedrally while at low phosphate and ammonium concentrations, the crystals exhibit a more rounded flaky shape.
 | ||
| Fig. 5 Three-dimensional phase stability diagram of Co–phosphate phases in the c(NH4+), c(PO43−), and c(Co2+) space. Morphology and phase composition changes of crystalline materials are depicted in SE images as a function of the concentration of reactant. Coloured lines represent the varying concentration of each ionic species: blue = c(NH4+), orange = c(PO43−), pink = c(Co2+), cubes of different colour encode phases: blue = CPO, purple = CPO + COS, pink = COS. | ||
From the point of view of the crystal formation nucleation and growth theory, in general, a higher supersaturation promotes a higher nucleation rate due to an enhanced thermodynamic driving force, i.e. the ion activity product resulting in numerous crystal nuclei with smaller crystallite size. In contrast, at low supersaturation a lower number of crystal nuclei forms, which can potentially grow larger. Overall, higher metal and phosphate concentrations N:M↑:P↑ regulate the reaction kinetics and nucleation rate due to their effect on supersaturation in the case of Co–phosphate octahydrate. In addition, for the M-struvite samples, higher ammonium concentration N↑:M:P promotes the elongation and thickness of the crystal (Fig. 3). Interestingly, in the N↑:M↑:P↓ region, the crystals grew optimally in size and shape without incrustations of other particles. In a less pronounced trend, higher Co-concentrations N:M↑:P also led to more idiomorph-grown CPO crystals with more developed facets.
Importantly, pH changes related to a different chemical character and concentrations of the reactants influence the development of the observed crystal surfaces. While the ammonium and metal reactants have an acidic character (pH 5.5 and 4.5 at concentrations of 0.1 M respectively), the phosphate solution acts as a weak base (pH 8.0 at concentrations of 0.1 M). Increasing a reactant concentration will consequently change, among other things, the pH of the solution and therefore could affect the crystal growth of the TMP compounds.
The formation of aqueous metal ammonia complexes M2+(H2O)x(NH3)1−x could be an additional influence factor on the crystallisation, which can effectively reduce the concentration of free available Co2+ or NH4+. Earlier studies showed43,46–48 that in common isostructural Mg-struvite, higher concentrations of ammonium favored the exclusive growth of the surfaces (00i) with i = 1−4 perpendicular to the positive c-axis due to a higher density of these electropositive groups (NH4+) on this facet. PO43− and M(H2O)62+ favor the crystal growth of the (00i) facets with i = ![[1 with combining macron]](https://www.rsc.org/images/entities/char_0031_0304.gif) −
−![[4 with combining macron]](https://www.rsc.org/images/entities/char_0034_0304.gif) along the negative c-direction.46,47,49 Similar trends can be observed in the transition metal struvites. For Co–phosphate octahydrate, no preferential growth of a certain crystal plane could be observed. The solubility products of transition metal phosphates (Ksp of M-struvite NH4MPO4·6H2O: KspMg = 10−13.36 > KspNi,Co,44Ksp of anhydrous M3(PO4)2 only known:50KspNi = 10−31.32, KspCo = 10−34.69) differ among each other significantly.
along the negative c-direction.46,47,49 Similar trends can be observed in the transition metal struvites. For Co–phosphate octahydrate, no preferential growth of a certain crystal plane could be observed. The solubility products of transition metal phosphates (Ksp of M-struvite NH4MPO4·6H2O: KspMg = 10−13.36 > KspNi,Co,44Ksp of anhydrous M3(PO4)2 only known:50KspNi = 10−31.32, KspCo = 10−34.69) differ among each other significantly.
The formation of the amorphous nanophases preceding the crystallization could be another important factor. Phosphate compounds are known to follow a non-classical crystallization path in their crystallization from aqueous solutions.2,51–53 While in the Ni-system, these nanophases seem to be short-living and the agglomeration/densification to crystalline solids occurs within several minutes, in the Co-system they are stable for hours.2,54,55 Most likely, they could also interact with the dissolved ammonium NH4+ resulting in a potential positive or negative feedback loop on agglomeration and stabilization/destabilization of proto-crystalline units. In such a way, they could majorly interfere with the reaction kinetics, but could as well either disturb or enhance the crystal growth of particular facets.
Local molecule structure and associated stability of occurring TMP phases
The question arose what the local structure the of an amorphous phase is in the Ni-system, what chemical composition it has, and what oxidation state the transition metal exhibits in the different compounds. As it formed at low ammonium concentrations, it could show structural features of Ni-struvite, Ni–phosphate octahydrate, or a significantly different coordination environment.Therefore, we analysed the crystalline Ni– and Co–phosphates and especially the amorphous phase with infrared spectroscopy (IR) to identify the changes in the chemical composition, mainly in NH4/H2O/PO4. The phosphate environment is depicted in the IR-spectra at 800–550 cm−1 for δ(O–P–O), bending modes of the phosphate tetrahedron; and 1200–850 cm−1 for ν(O–P–O), symmetric stretching of the phosphate tetrahedron; followed by two discrete bands at 1434 cm−1 and 1464 cm−1 of the stretching mode of ν(NH4+) (ESI:† Fig. S6). Multiple water and ammonium vibrations occur in the final range of 3800–1500 cm−1 (ESI:† Fig. S6).
In similar spectra, crystalline Ni- and Co-struvites exhibit three strong phosphate vibrations at around 970–700 cm−1, two bending ammonium bands at 1434 and 1464 cm−1, and multiple broad water and ammonia modes in the range from 3800–1500 cm−1 (ESI:† Fig. S6). In contrast, Ni– and Co–phosphate octahydrates show multiple, sharp phosphate bands at 1070–680 cm−1 and discrete water bands at around 1600 cm−1, 2990 cm−1 and 3430 cm−1 without any H–N–H vibrations. The amorphous Ni–PO4 phase exhibits an IR spectrum comparable to the one of Ni3(PO4)2·8H2O, but slight differences can be observed. For example, as for an amorphous phase, the phosphate, and water bands are generally broader compared to the crystalline analogue due to the lack of a long-range order. The phosphate bands in the amorphous phase are shifted to higher wave numbers compared to crystalline NPO indicating an overall shorter bond length of the O–P–O bond. The absence of any H–N–H and the presence of H–O–H vibrations proves that the amorphous phase contains water in its structure but no significant content of ammonium (ESI:† Fig. S6).
For further investigation of the stability and local structure of the obtained TMP phases, we looked at the changes/distortion in the metal coordination environment based on X-ray absorption spectroscopy (XAS). Here, the pre-peak region is sensitive to 1s–3d orbital transitions and reveals changes in the extent of deviation from centrosymmetry of the first metal coordination sphere. As only 3d–4p hybridization enables parity-allowed transitions, the intensity of the pre-peak is starkly correlated with the coordination geometry. Due to the presence of an inversion centre, ideal octahedral coordination shows lower pre-peak intensities compared to slightly higher intensities in distorted ones. The signal beyond the absorption edge in the EXAFS region is characterized by the interactions of the excited photoelectron with the next neighbour atoms in the compound. The constructive or destructive interference between the forward-propagating and backscattered electron waves carries information about the local structure, such as coordination number and interatomic distances. Considering similar spectra quality and consistency in the processing parameters to perform Fourier transformation, we observe a direct influence of the degree of crystallinity in terms of ordering on the full-width half maximum of the peak. This effect is also observed in the FT-IR spectra.
In general, highly crystalline phases demonstrate narrower and more intense peaks in the R-space compared to amorphous phases, as more ions have similar bond distances to the metal cation due to a regular three-dimensional periodic structure. An established long-range order is absent in amorphous phases, resulting in broader, less intense, and defined peaks, mostly in the low R region <4 Å, due to an irregular arrangement of lattice ions.
The XAS spectra in Fig. 6 show the exclusive presence of the bivalent ion of Ni2+ and Co2+. As indicated in comparison with multiple standards (not shown for clarity). Quantitative pre-peak integration results reveal the degrees of distortion in the compounds (ESI:† Fig. S4, Table S1). All materials have comparable pre-peak intensities, M-struvite shows a slightly more centrosymmetric (ordered) coordination than NPO, CPO, or the amorphous phase (more distorted, higher pre-peak intensities). After applying a Fourier transformation of χ(k) (k-space), we obtain R-space radial distances of scatterers around the absorber atom (Fig. 6C). By quantitatively fitting the radial distribution function in real-space, actual bond distances in the first coordination environment around the metal cation are calculated and linked to the local structure (ESI:† Fig. S7, Table S2–S6).
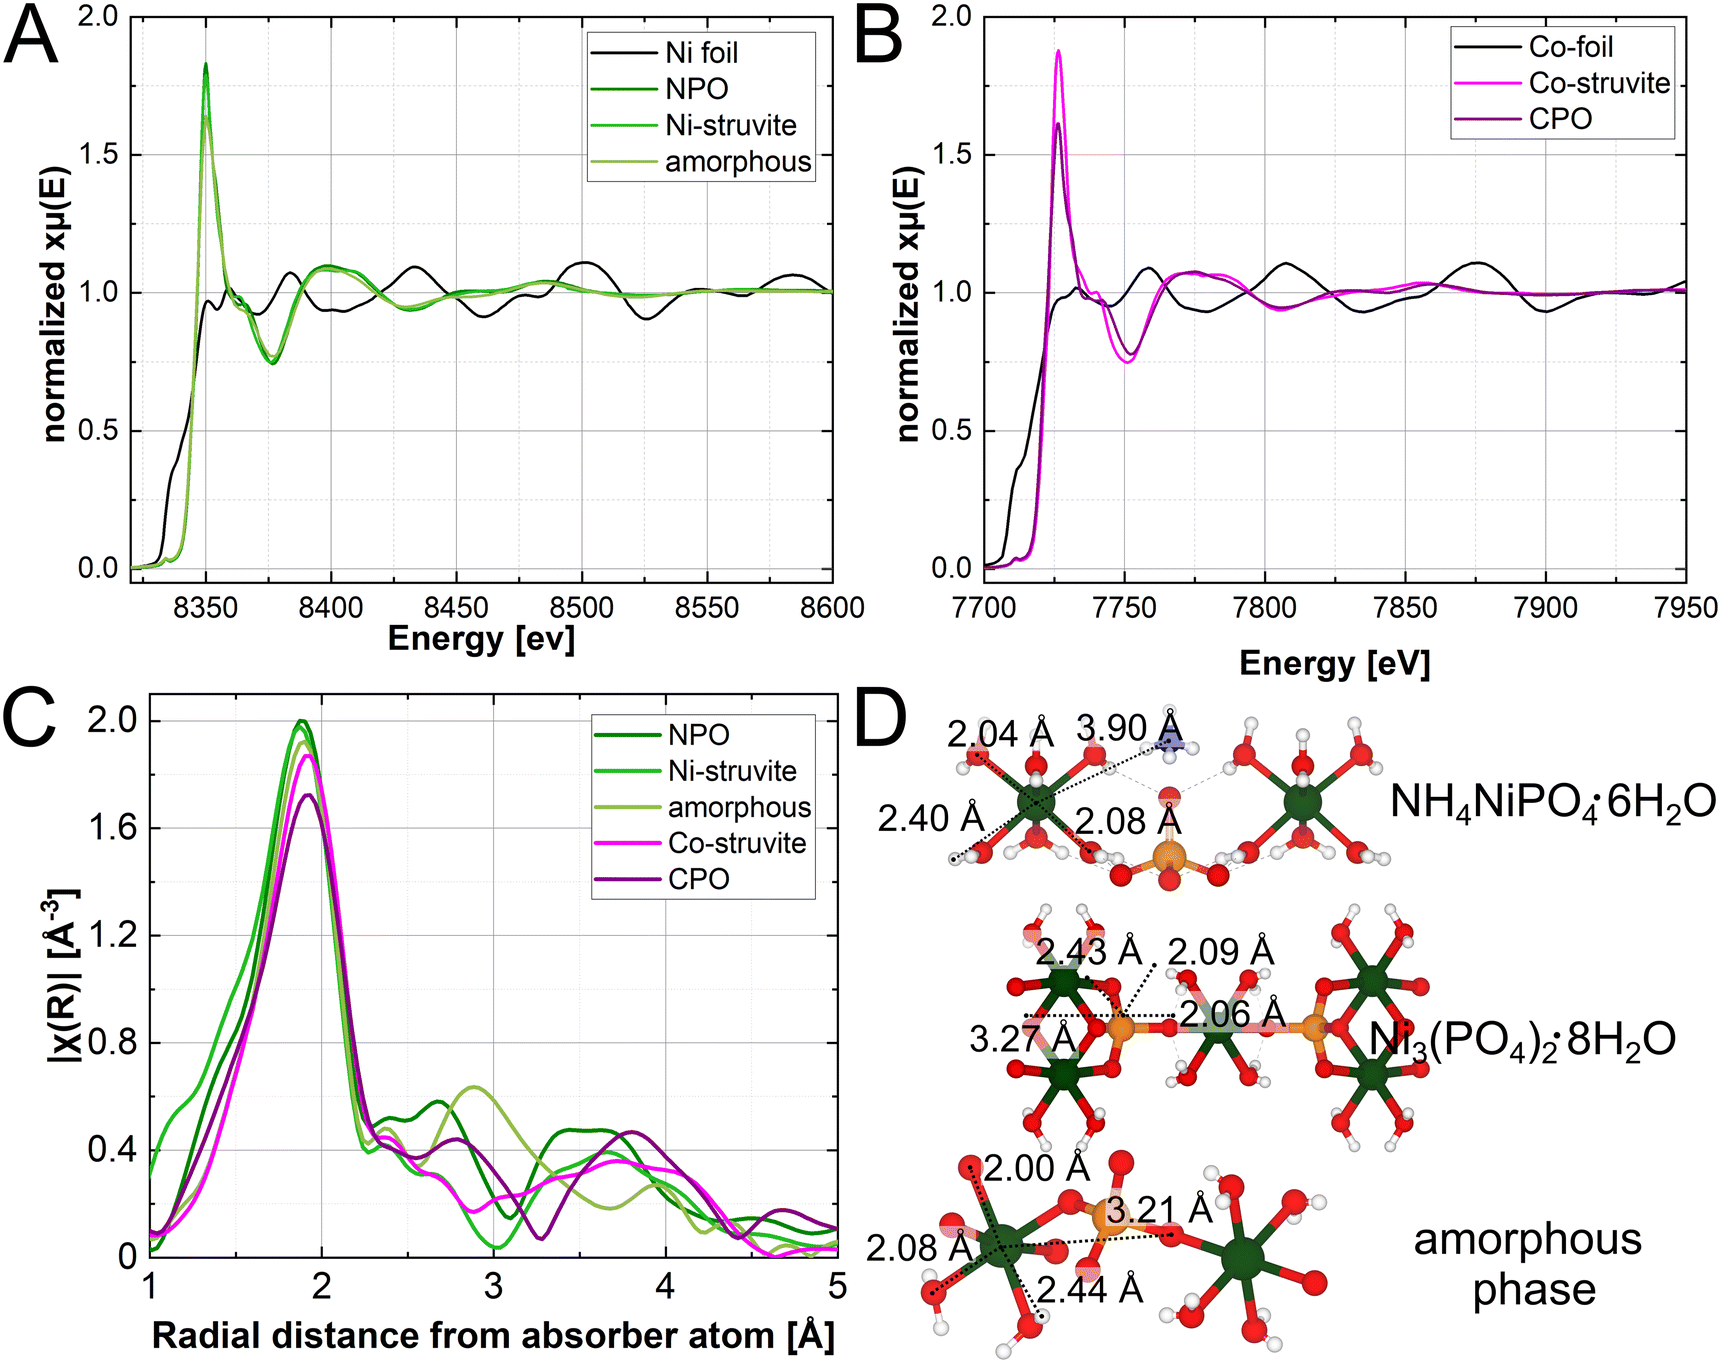 | ||
| Fig. 6 XAS spectra of (A) Ni– and (B) Co–phosphates; (C) Fourier-transformed Ni- and Co spectra plotted in R-space; (D) local structure of Ni- and Co-struvite Pmn21 Ni– and Co–phosphate octahydrate P21/c and the local structure of the amorphous phase with significant distances appearing in the R-space plot (Ni–O1, Ni–O2, Ni–H, Ni–P). | ||
At around R ≈ 2.0 Å all compounds exhibit amplitudes directly related to the first coordination sphere of NiO6 or CoO6 around the metal ion. Here, single coordinating oxygens, are slightly closer to the metal centre than oxygens, shared in water molecules. The hydrogens in the water ligands scatter weakly at distances around 2.5 Å and therefore hardly contribute to the spectra. The peak at around R ≈ 3.0 Å, is specifically related to the M–P distance, present in NPO, CPO, and the amorphous phase but absent in the struvite compounds (Fig. 6). Uniquely, the M–P distance occurs due to a the linkage of the NiO6 octahedron unit with the PO4 tetrahedron unit through a bridging oxygen. Therefore, M-struvite as a structure composed of isolated NH4, MO6, and PO4 units does not show this structural feature. The significant signal of this peak in the amorphous phase reflects a high degree of condensation in such a structure. Beyond R ≈ 3.8 Å various single and multiple scattering paths such as M–N, M–M, M–P–O, or M–O–O appear, which makes it difficult to assign the peak to a specific scatterer. The spectra of Ni-, Co-struvite, and Ni–, Co–phosphate octahydrate are congruent with each other in R-space with similar peak positions as Ni and Co share nearly the same local structure in these compounds. Interestingly, the deviation between the spectra of M-struvite is smaller than between NPO and CPO, most likely due to a facile structure of isolated metal, phosphate, and ammonium units in M-struvite compared to a layered condensed structure of NPO and CPO (Ni-struvite: Ni–O1 = 2.04(1) Å, Ni–O2 = 2.09(1) Å, Ni–H1 = 2.35(5) Å; Co-struvite: Co–O1 = 2.05(1) Å, Co–O2 = 2.08(1) Å, Co–O3 = 2.12(1) Å, Co–H1 = 2.52(5) Å). The amorphous Ni–PO4 phase shows structural similarities of the (Ni, Co)3(PO4)2·8H2O compounds visible in matching peaks but shifted in positions. Compared to NPO, slight differences can be observed in the near coordination environment i.e. first and second neighboring ions evidenced by variations in the Ni–O and Ni–P bond distances (amorphous Ni–PO4: Ni–O1 = 2.00(3) Å, Ni–O2 = 2.08(3) Å, Ni–P1 = 3.21(3) Å and NPO: Ni–O1 = 2.04(1) Å, Ni–O2 = 2.09(1) Å, Ni–P1 = 3.27(5) Å, CPO: Co–O1 = 2.07(1) Å, Co–O2 = 2.20(1) Å, Co–P1 = 3.22(5) Å). This points to its less defined degree of order, as one would expect from an amorphous phase (ESI:† Fig. S4). Interestingly, bond distances at R ≥ 4 Å appear in the amorphous phases but are starkly less pronounced than in the crystalline materials, due to a lack of a long-range order. Here, in the outer coordination sphere, Ni–O distance, Ni–N distance or multiple scattering paths occur in the spectra reflecting the long-range order of the crystalline compounds.
The local amorphous structure can be determined using spectroscopic techniques (FT-IR and XAS), and it substantially resembles the crystal structure of Ni–phosphate octahydrate despite lacking long-range ordering. Here, the degree of condensation between the NiO6 and the PO4 units is comparable while, similarly, NH4+ is absent in both compounds. As NPO forms only at T = 80 °C and the amorphous phase at room temperature, it is most likely that these elevated temperatures are necessary to overcome the activation energy for the crystallization of these compounds. Interestingly, the condensation of the metal and phosphate units could take place already at room temperature in the amorphous phase. Looking at the structural differences of Ni and Co in the crystalline compounds, Co2+ tends to form more distorted coordination environments as a d7 ion, resulting in larger bond distances in the same structure due to more unpaired electrons in the d-orbital (Jahn–Teller effect). As H2O acts as a weak-field ligand for most of the bivalent transition metal ions, the high spin configuration is realized in their complexes. Agreeing with our findings, electron spin resonance spectroscopy studies on Co-doped Ni-struvite reported a distorted non-centrosymmetric octahedral coordination of Co2+ as a d7 ion while Ni2+ as a d8 ion displayed a near ideal octahedral coordination.56
Conclusion
By using an automated synthesis platform, we studied the phase stability, phase transitions and crystal morphology of different Ni and Co phosphate phases as a function of the three independent reactant species: NH4+, PO43− and M2+, where M = Ni or Co. The as-obtained transition metal phosphate phases were studied with XRD, SEM, and XAS. While the phase composition, morphology, and particle size in the Ni-system is exclusively dominated by the NH4+ reactant (crystalline Ni-struvite versus an amorphous Ni–PO4 phase), in the Co-system all reactant species NH4+, Co2+, PO43− influence in a similar degree these parameters (Co-struvite vs. Co–phosphate octahydrate). In the Ni-system, Ni-struvite covers a broad range of reaction conditions resulting in a wide three-dimensional phase stability field in the three-reactant (NH4+, M2+, PO43−) species space only confined by the NH4+ concentration. In the Co-system, the phase stability fields of crystalline Co-struvite and Co–phosphate octahydrate overlap strongly at c(Co2+) = 0.06 M with an M:N:P ratio of 15:3:5. The narrow co-stability field of Ni-struvite and the amorphous phase lies at 0.02 M NH4+ with an N:M:P ratio of 1:10:10 while the amount of NH4+ ions had a major impact on phase transitions, crystal morphology and size compared to the metal and phosphate ionic species. The local structure of the amorphous Ni–PO4 phase was revealed as a highly condensed framework of NiO6 and PO4 units mimicking the structure of Ni–phosphate octahydrate, but with a less-pronounced long-range order.
Conflicts of interest
There are no conflicts to declare.Acknowledgements
We thank BAM and Helmholtz-Zentrum Berlin (HZB) for providing us with the beamtime at BESSY II. We thank Ines Feldmann for the electron microscopy measurements.References
- M. Ossorio, A. E. S. Van Driessche, P. Pérez and J. M. García-Ruiz, Chem. Geol., 2014, 386, 16–21 CrossRef CAS.
- S. Karafiludis, A. G. Buzanich, Z. Kochovski, I. Feldmann, F. Emmerling and T. M. Stawski, Cryst. Growth Des., 2022, 22, 4305–4315 CrossRef CAS.
- R. Katsube, K. Terayama, R. Tamura and Y. Nose, ACS Mater. Lett., 2020, 2, 571–575 CrossRef CAS.
- I. Weimann, J. Feller and Z. Žák, Z. Anorg. Allg. Chem., 2017, 643, 299–305 CrossRef CAS.
- F. Tesfaye, D. Lindberg, M. Moroz and L. Hupa, Energies, 2020, 13, 5366 CrossRef CAS.
- G. Crabtree, Joule, 2020, 4, 2538–2541 CrossRef CAS.
- F. Häse, L. M. Roch and A. Aspuru-Guzik, Trends Chem., 2019, 1, 282–291 CrossRef.
- M. M. Flores-Leonar, L. M. Mejía-Mendoza, A. Aguilar-Granda, B. Sanchez-Lengeling, H. Tribukait, C. Amador-Bedolla and A. Aspuru-Guzik, Curr. Opin. Green Sustainable Chem., 2020, 25, 100370 CrossRef.
- J. B. Wolf, T. M. Stawski, G. J. Smales, A. F. Thünemann and F. Emmerling, Sci. Rep., 2022, 12, 5769 CrossRef CAS PubMed.
- J. Schmidt, M. R. G. Marques, S. Botti and M. A. L. Marques, npj Comput. Mater., 2019, 5, 83 CrossRef.
- C. Völker, Sequential Learning App for Materials Discovery (“SLAMD”), https://github.com/BAMresearch/WEBSLAMD Search PubMed.
- Y. Xie, C. Zhang, H. Deng, B. Zheng, J.-W. Su, K. Shutt and J. Lin, ACS Appl. Mater. Interfaces, 2021, 13, 53485–53491 CrossRef CAS PubMed.
- L. Velasco, J. S. Castillo, M. V. Kante, J. J. Olaya, P. Friederich and H. Hahn, Adv. Mater., 2021, 33, 2102301 CrossRef CAS PubMed.
- P. S. Gromski, J. M. Granda and L. Cronin, Trends Chem., 2020, 2, 4–12 CrossRef CAS.
- S. Steiner, J. Wolf, S. Glatzel, A. Andreou, J. M. Granda, G. Keenan, T. Hinkley, G. Aragon-Camarasa, P. J. Kitson, D. Angelone and L. Cronin, Science, 2019, 363, 6423 CrossRef PubMed.
- H. Mehr, M. Craven, S. Steiner, G. Keenan, J. Wolf and J. Granda, The Chempiler, https://github.com/croningp/ChemputerSoftware Search PubMed.
- K. S. Le Corre, E. Valsami-Jones, P. Hobbs and S. A. Parsons, Crit. Rev. Environ. Sci. Technol., 2009, 39, 433–477 CrossRef CAS.
- A. Uysal, Y. D. Yilmazel and G. N. Demirer, J. Hazard. Mater., 2010, 181, 248–254 CrossRef CAS PubMed.
- X. Hao, C. Wang, M. C. van Loosdrecht and Y. Hu, Environ. Sci. Technol., 2013, 47(10), 4965–4966 CrossRef CAS PubMed.
- Y. Zhao, Z. Chen, D. B. Xiong, Y. Qiao, Y. Tang and F. Gao, Sci. Rep., 2016, 6, 17613 CrossRef CAS PubMed.
- W.-X. Lu, B. Wang, W.-J. Chen, J.-L. Xie, Z.-Q. Huang, W. Jin and J.-L. Song, ACS Sustainable Chem. Eng., 2019, 7, 3083–3091 CrossRef CAS.
- J. Zhang, Y. Yang, Z. Zhang, X. Xu and X. Wang, J. Mater. Chem. A, 2014, 2, 20182–20188 RSC.
- X. Li, P. Xu, M. Chen, G. Zeng, D. Wang, F. Chen, W. Tang, C. Chen, C. Zhang and X. Tan, Chem. Eng. J., 2019, 366, 339–357 CrossRef CAS.
- W. Zhang, P. Oulego, S. K. Sharma, X. L. Yang, L. J. Li, G. Rothenberg and N. R. Shiju, ACS Catal., 2020, 10, 3958–3967 CrossRef CAS PubMed.
- D. Zhang, H. Qiu, L. Jiang, F. Lv, C. Ma and W. Hu, Angew. Chem., Int. Ed., 2013, 52, 13356–13360 CrossRef CAS PubMed.
- M. Chen, X. Fu, Z. Chen, J. Liu and W. H. Zhong, Adv. Funct. Mater., 2020, 31, 2006744 CrossRef.
- N. Omar, M. A. Monem, Y. Firouz, J. Salminen, J. Smekens, O. Hegazy, H. Gaulous, G. Mulder, P. Van den Bossche, T. Coosemans and J. Van Mierlo, Appl. Energy, 2014, 113, 1575–1585 CrossRef CAS.
- B. Senthilkumar, Z. Khan, S. Park, I. Seo, H. Ko and Y. Kim, J. Power Sources, 2016, 311, 29–34 CrossRef CAS.
- Q. Liu, L. Zhou, D. Zhao, C. Wan, P. Sun, X. Lv, X. Sun and L. Fang, J. Power Sources, 2022, 533, 231344 CrossRef CAS.
- J. Hassoun, F. Bonaccorso, M. Agostini, M. Angelucci, M. G. Betti, R. Cingolani, M. Gemmi, C. Mariani, S. Panero, V. Pellegrini and B. Scrosati, Nano Lett., 2014, 14, 4901–4906 CrossRef CAS PubMed.
- N. L. W. Septiani, Y. V. Kaneti, K. B. Fathoni, K. Kani, A. E. Allah, B. Yuliarto, H. K. D. Nugraha, H. K. Dipojono, Z. A. Alothman, D. Golberg and Y. Yamauchi, Chem. Mater., 2020, 32, 7005–7018 CrossRef CAS.
- L. Xie, R. Zhang, L. Cui, D. Liu, S. Hao, Y. Ma, G. Du, A. M. Asiri and X. Sun, Angew. Chem., Int. Ed., 2017, 56, 1064–1068 CrossRef CAS PubMed.
- M. Pramanik, C. Li, M. Imura, V. Malgras, Y. M. Kang and Y. Yamauchi, Small, 2016, 12, 1709–1715 CrossRef CAS PubMed.
- K. Otsuka and Y. Wang, Appl. Catal., A, 2001, 222, 145–161 CrossRef CAS.
- N. Brodt and J. Niemeyer, Org. Chem. Front., 2023, 10(12), 3080–3109 RSC.
- J. De Maron, L. Bellotti, A. Baldelli, A. Fasolini, N. Schiaroli, C. Lucarelli, F. Cavani and T. Tabanelli, Sustainable Chem., 2022, 3(1), 58–75 CrossRef CAS.
- A. Matsuda, H. Tateno, K. Kamata and M. Hara, Catal. Sci. Technol., 2021, 11, 6987–6998 RSC.
- J. Hövelmann, T. M. Stawski, R. Besselink, H. M. Freeman, K. M. Dietmann, S. Mayanna, B. R. Pauw and L. G. Benning, Nanoscale, 2019, 11, 6939–6951 RSC.
- U. Brandes, M. Eiglsperger, J. Lerner and C. Pich, Graph Markup Language (GraphML), CRC Press, London, 2014 Search PubMed.
- A. Guilherme Buzanich, M. Radtke, K. V. Yusenko, T. M. Stawski, A. Kulow, C. T. Cakir, B. Röder, C. Naese, R. Britzke, M. Sintschuk and F. Emmerling, BAMline-A real-life sample materials research beamline, J. Chem. Phys., 2023, 158(24), 244202 CrossRef CAS PubMed.
- B. Ravel and M. Newville, J. Synchrotron Radiat., 2005, 12, 537–541 CrossRef CAS PubMed.
- K. Momma and F. Izumi, J. Appl. Crystallogr., 2008, 41, 653–658 CrossRef CAS.
- J. Hövelmann, T. M. Stawski, H. M. Freeman, R. Besselink, S. Mayanna, J. P. H. Perez, N. S. Hondow and L. G. Benning, Minerals, 2019, 9(9), 503 CrossRef.
- H. E. L. Madsen, Adv. Chem. Eng. Sci., 2017, 07, 206–214 CrossRef CAS.
- F. Abbona, M. Angela-Frachini, C. C. Bono and H. E. L. Madsen, J. Cryst. Growth, 1994, 143, 256–260 CrossRef CAS.
- S. Shaddel, S. Ucar, J. P. Andreassen and S. W. Osterhus, Water Sci. Technol., 2019, 79, 1777–1789 CrossRef CAS PubMed.
- S. Shaddel, S. Ucar, J. P. Andreassen and S. W. Osterhus, J. Environ. Chem. Eng., 2019, 7, 102918 CrossRef CAS.
- D. Kim, C. Olympiou, C. P. McCoy, N. J. Irwin and J. D. Rimer, Chemistry, 2020, 26, 3555–3563 CrossRef CAS PubMed.
- D. Crutchik and J. M. Garrido, Water Sci. Technol., 2011, 64(12), 2460–2467 CrossRef CAS PubMed.
- J. R. Rumble, CRC Handbook of Chemistry and Physics, O. Cleveland, 101st edn, 1977 Search PubMed.
- D. Gebauer and S. E. Wolf, J. Am. Chem. Soc., 2019, 141, 4490–4504 CrossRef CAS PubMed.
- W. J. Habraken, J. Tao, L. J. Brylka, H. Friedrich, L. Bertinetti, A. S. Schenk, A. Verch, V. Dmitrovic, P. H. Bomans, P. M. Frederik, J. Laven, P. van der Schoot, B. Aichmayer, G. de With, J. J. DeYoreo and N. A. Sommerdijk, Nat. Commun., 2013, 4, 1507 CrossRef PubMed.
- T. J. Lin and C. C. Chiu, Phys. Chem. Chem. Phys., 2017, 20, 345–356 RSC.
- S. Bach, M. Panthöfer, R. Bienert, A. G. Buzanich, F. Emmerling and W. Tremel, Cryst. Growth Des., 2016, 16, 4232–4239 CrossRef CAS.
- S. Bach, E. Visnow, M. Panthöfer, T. Gorelik, A. G. Buzanich, A. Gurlo, U. Kolb, F. Emmerling, C. Lind and W. Tremel, Eur. J. Inorg. Chem., 2016, 2016, 2072–2081 CrossRef CAS.
- M. Foglio and G. Barberis, Braz. J. Phys., 2005, 36, 40–54 Search PubMed.
Footnote |
| † Electronic supplementary information (ESI) available: A detailed description of potential error sources and Note S1: evaluation of automated synthesis and experimental error propagation, Fig. S1: additional diffractograms of Ni– and Co–phosphates, Fig. S2: SE images of Ni samples, Fig. S3: SE images of Co samples, Fig. S4: exemplary size distribution histograms from selected Ni-samples, Fig. S5: exemplary size distribution histograms from selected Co-samples, Fig. S6: FT-IR spectra of selective Ni– and Co–phosphates, Fig. S7: XAS spectra with detailed view on the pre-peak region, Fig. S8: Ni- and Co-K-edge EXAFS data and quantitative fits, Table S1: calculated integration results from the pre-peak region of the thermal treated Ni– and Co–phosphate samples, Table S2: fit parameter for the amorphous Ni–PO4 phase, R-factor = 0.018, Table S3: fit parameter for Ni–phosphate octahydrate Ni3(PO4)2·8H2O, R-factor = 0.014, Table S4: fit parameter for Co–phosphate octahydrate Co3(PO4)2·8H2O, R-factor = 0.013, Table S5: fit parameter for Ni-struvite NH4NiPO4·6H2O, R-factor = 0.014, Table S6: fit parameter for Co-struvite NH4CoPO4·6H2O, R-factor = 0.014. In addition, the graphml file39 form the Chemputer's API is included (reaction_graph_TMP_synthesis.graphml). This file can be opened and modified with standard software. See DOI: https://doi.org/10.1039/d3ce00386h |
| This journal is © The Royal Society of Chemistry 2023 |