 Open Access Article
Creative Commons Attribution 3.0 Unported Licence
High-pressure induced switching between halogen and hydrogen bonding regimes in 1,4-dioxane iodine monochloride†
Richard H.
Jones
 *a,
Craig L.
Bull
 bc,
Kevin S.
Knight
 de and
William G.
Marshall‡
b
aSchool of Chemical and Physical Sciences Lennard-Jones Building, Keele University, Staffs, ST5 5BG, Keele, UK. E-mail: richard.jones@keele.ac.uk
bRutherford Appleton Laboratory, ISIS Neutron and Muon Source, Didcot, Oxon OX11 7XN, UK
cSchool of Chemistry, University of Edinburgh, David Brewster Road, Edinburgh EH9 3FJ, Scotland, UK
dDepartment of Earth Sciences, University College London, Gower Street, London WC1E 6BT, UK
eDepartment of Earth Sciences, The Natural History Museum, Cromwell Road, SW7 5BD, London, UK
First published on 3rd July 2023
Abstract
The structure of the complex formed between 1,4-dioxane and iodine monochloride has been studied as a function of pressure using neutron powder diffraction. Initial compression was accompanied by a decrease in the O⋯I halogen bond length together with an increase in the intramolecular I–Cl bond length. Two phase transitions were observed at ∼2.8 and ∼4.5 GPa. The transient intermediate phase coexists with the ambient pressure phase during the initial phase transition and with the final high-pressure phase at the second phase transition, before its disappearance. The driving force for the first phase transition is a shearing motion of the complex causing a reduction in the dipolar interaction of two I–Cl moieties. The formation of the highest pressure phase is accompanied by a net reduction of 2 C–H⋯Cl hydrogen bonds per formula unit. From these changes we conclude that Cl⋯Cl halogen bonds are favoured over C–H⋯Cl hydrogen bonds at high pressures.
1 Introduction
Interest in halogen bonding shows no signs of diminished fundamental research activity, with several published reviews.1–6 Materials based on halogen bonds find diverse applications, for example as catalysts7,8 and as liquid crystals,9,10 however, despite extensive experimental11–16 and computational studies17–20 there continues to be a lively debate as to the nature of the halogen bond.21,22 Whilst some of this disagreement derives from the different methodologies and approaches used the most widely accepted theory of halogen bonding makes use of the so-called sigma hole as described below.23–25 The sigma-hole which is located on the halogen is formed by the depletion of electron density along the inter-nuclear axis of the bond between the halogen and the atom that it is attached to. The sigma hole, then is involved in an electrostatic attraction with an area of negative charge on the acceptor species e.g. a lone pair on an amine.2,26 At the other extreme the theory used in explaining the occurrence of halogen bonds focuses instead on charge transfer and covalency effects. This in part originates from the original categorisation of a halogen bond,27 as a charge-transfer interaction.28,29 This theory qualitatively explained both the spectral and structural properties of complexes formed between halogens and donor species30 most notably by Hassel and his co-workers.31 Many such interactions were noted encompassing both inorganic, e.g. in ferroelectric ammonium iodate32,33 and organic examples, including the thyroxine molecule (T3), which is used in the treatment of hypothyroidism, where an extremely close I⋯O contact was observed.34 These interactions were generally subsumed under the title of secondary interactions and have been extensively reviewed by Alcock.35 Since the adoption of the term halogen bond it is clear that many of the interactions described by Alcock are halogen bonds or bonds that are now recognised as chalcogen,36 pnicogen,37 or tetrel bonds.38 However, one feature that all these studies emphasise is the directional nature of the bonding which has been recognised by the IUPAC definition of a halogen bond.39 Even before the term halogen bonding was adopted, it was apparent that halogen bonds could compete with secondary interactions in defining the crystal structure.40–43The other intramolecular force that exhibits strong directionality is the hydrogen bond and similarities between the hydrogen bond and halogen bond have been noted.21 The existence of the hydrogen bond has long been established, but it has also undergone reinterpretation and had its definition broadened considerably. This is particularly the case for so-called unconventional or weak hydrogen bonds,44 where interactions involving C–H donors are now widely recognised. Crucial to the establishment of the existence of weak hydrogen bonds were detailed neutron diffraction studies leading to the pioneering database study of Taylor and Kennard which unequivocally showed the existence of C–H⋯A bonds, where A is N, O or Cl.45 In the field of hydrogen bonding one area that has proved particularly beneficial to our understanding of hydrogen bonds has been the use of high-pressure techniques,46–50 and in particular high-pressure neutron powder-diffraction measurements51–53 where development of the Paris-Edinburgh press has played a key role.54,55 By contrast fewer high-pressure studies have been performed on halogen bonded systems.30 Whilst some of these high-pressure X-ray studies have investigated the competition between hydrogen and halogen bonds,56–58 there have been to the best of our knowledge none using neutron diffraction to study the competition between weak hydrogen bonds involving hydrogen bonds and halogen bonds. The best neutron powder diffraction measurements have been shown to produce results that are comparable to single-crystal X-ray methods.59–62 In addition neutron diffraction provides the ability to determine the accurate crystallographic positions of atoms with a low atomic number in the presence of heavier atoms which is not so readily possible using X-ray diffraction techniques. The scattering factor of an individual atom by neutron radiation is independent of the atomic number of the element and is pseudo random across the periodic table. In the system that we are studying the lighter elements (deuterium, carbon and oxygen) have scattering lengths (b) that are comparable to those of the heavier elements, (iodine and chlorine) iodine (b = 5.28 fm), chlorine (b = 9.36 fm), oxygen (b = 5.803 fm), carbon (b = 6.646 fm), and deuterium (b = 6.671 fm), which enables accurate positions for the latter elements to be determined.63 We have previously shown that the application of this technique can give useful information both with regard to the existence of unconventional hydrogen bonds that coexist in halogen bonded systems and evidence of the structural changes that are a consequence of the formation of a halogen bond64,65 and how they can influence physical properties such as thermal expansion.66,67
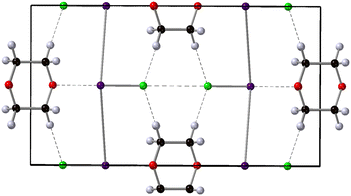
In this current work our goal was to investigate the influence of pressure on both the halogen bond itself and associated unconventional hydrogen bonds formed in the complex 1,4-dioxane iodine monochloride (C4H8O2·2(ICl)2).68 1,4-Dioxane iodine monochloride (1/2) crystallises in a monoclinic symmetry with space group C2/m. The unit cell contains four molecules of iodine monochloride and two molecules of 1,4-dioxane and is shows pictorially in Fig. 1. At ambient pressure the complex comprises of dioxane molecules halogen bonded to iodine molecules via a I⋯O bond of 2.53 Å. There are also weak long hydrogen bonds via a Cl⋯H bond of distance ∼2.90 Å. It is this mix of interactions which make the complex of interest to study. In this current investigation we have used neutron powder diffraction to investigate the response of the halogen and hydrogen bonds with increasing hydrostatic pressure. In the course of this study two phase changes were observed. The origin of these phase changes lies in the reduction of “end-on-end” unfavourable I–Cl⋯Cl–I interactions, and are accompanied by the loss of C–H⋯Cl hydrogen bonds and the strengthening of type-I Cl⋯Cl halogen bonds. In the lowest pressure phase correlated changes occur in the O⋯I and I–Cl distances as a function of pressure.
2 Experimental
2.1 Sample synthesis and characterisation
The 1,4-dioxane iodine monochloride complex was prepared by mixing stoichiometric quantities of commercial perdeuterated 1,4-dioxane and a solution of ICl in dichloromethane. The dichloromethane solvent was removed by blowing dried nitrogen into the solution, which was kept cold by using an acetone/dry ice mixture. The resulting orange/red precipitate was filtered and stored at −20 °C prior to use. The value and sharpness of melting point 102–103 °C (literature 103 °C hydrogenous) was used to confirm sample purity prior to measurement on the neutron diffraction measurement.2.2 High pressure neutron diffraction
High-pressure time-of-flight neutron powder diffraction measurements were performed using PEARL the high-pressure instrument which is located at the ISIS Neutron and Muon Facility, Rutherford Appleton Laboratory, UK.69 The PEARL diffractometer is a high-flux, medium-resolution instrument which is optimized for data collection using a Paris-Edinburgh (P-E) press.54 The sample of 1,4-dioxane iodine monochloride was gently ground in an agate mortar (250 K) and then loaded into a null-scattering Ti–Zr alloy capsule gasket.55 Together a small lead sphere of approximately 0.4 mm radius and a mixture of perdeuterated pentane and methyl-butane (isopentane). The lead acts as a pressure calibrant and the mixture of pentanes provides hydrostatic conditions upon compression. In this arrangement hydrostatic conditions can be maintained until 6 GPa.70 The loading operations were performed under a dry nitrogen atmosphere at 283 K in order to minimise the loss of the volatile hydrocarbon mix, and the condensation of atmospheric water containing hydrogen (a strong incoherent scatterer) on the gasket and sample. The loaded gasket was then sealed within the P-E press at an applied load of 6 tonnes. The anvils used were a standard toroidal profile machined from zirconia-toughened alumina (ZTA) anvils, having a high neutron transparency which permits an increase in the rate of data acquisition and enhanced data quality.69A series of diffraction patterns were collected with increasing hydrostatic pressure up to an applied load of 27 tonnes in approximately 1.5 tonne increments. The load increments were then increased to 3 tonnes until a maximum applied load of 73 tonnes was obtained. The data collections comprised of a series of long runs (2 hours) and shorter runs (1 hour) which permitted determination of both structure and lattice parameters in the former and lattice parameters in the latter. Upon a phase transition being observed data collection times were increased to ∼4 h. These higher statistical quality data permitted structure refinement by Rietveld analysis.
In-house software was used to normalise and correct the time-of-flight data.71 A beamline-developed correction for the wavelength and scattering-angle dependence of the neutron attenuation by the ZTA anvils and Ti–Zr gasket materials was applied to the normalised pattern.69 Rietveld refinement was performed using the GSAS suite of programmes.72 Restraints were applied to conserve the geometry of the dioxane molecule for the lowest pressure phase whilst a rigid body was used for the 2 higher pressure phases. The equation of state and compressibilities were determined using the PASCal program.73
3 Results & discussion
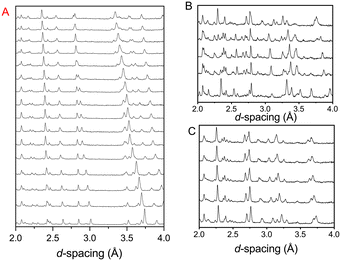
Fig. 2 shows the diffraction pattern and associated Rietveld refinement of the 1,4-dioxane iodine monochloride complex at an applied load of 6 tonnes corresponding to a pressure of ∼0.05 GPa. The refined crystal structure is comparable to that determined previously by X-ray diffraction and results of refinement from the current experiment are detailed in Table 1. With further increases in pressure all the reflections move predominantly to lower d-spacing as expected with increasing pressure (see Fig. 3) as the unit cell volume decreases. However, at 2.9(1) GPa a change in the diffraction pattern was observed indicating the commencement of a phase transition and appears to be complete by 3.5(1) GPa (Fig. 3). The phase transition can be clearly seen by the development of an intense peak at approximately 3.1 Å which is concurrent with the initial decrease and final disappearance of a peak occurring at 3.7 Å. This second phase has only a limited stability as just an increase of an additional ∼0.43 GPa was found to produce another new phase which coexists with phase 2 until 5.1(1) GPa. Once again the diffraction pattern clearly show this phase transition with a new peak being seen at approximately 3.6 Å, and the loss of peaks at 2.7 Å, and 3.1 Å. Upon further compression a change in diffraction pattern was observed at 3.9(1) GPa, which appeared to be complete by 5.1(1) GPa (Fig. 3). Unit cells for the two higher pressure phases were obtained by standard indexing procedures making use of longer d-spacing reflections obtained from the longer 40 ms frame of ISIS TS1 instruments.69 Both high pressure phases indexed in P![[1 with combining macron]](https://www.rsc.org/images/entities/char_0031_0304.gif) symmetry and results of the refinement and representative determined structures are given in Table 1.
symmetry and results of the refinement and representative determined structures are given in Table 1.
| Parameter | Phase I | Phase II | Phase III |
|---|---|---|---|
| Pressure (GPa) | 0.05 | 3.5 | 5.13 |
| Symmetry | Monoclinic | Triclinic | Triclinic |
| Space group | C2/m |
P![[1 with combining macron]](https://www.rsc.org/images/entities/char_0031_0304.gif) |
P![[1 with combining macron]](https://www.rsc.org/images/entities/char_0031_0304.gif) |
| a (Å) | 14.6721(7) | 7.7483(9) | 8.5610(6) |
| b (Å) | 8.0720(4) | 7.5293(8) | 6.4162(6) |
| c (Å) | 4.5800(3) | 3.8632(3) | 3.8268(7) |
| α (°) | 90 | 91.598(9) | 91.769(7) |
| β (°) | 95.535(6) | 91.492(7) | 78.002(6) |
| γ (°) | 90 | 107.613(6) | 101.453(5) |
| Volume (Å3) | 539.90(4) | 214.59(2) | 201.464(17) |
| Z | 4 | 2 | 2 |
| I x | 0.2412(8) | 0.2655(15) | 0.7211(12) |
| y | 0.5 | 0.4835(16) | 0.5259(16) |
| z | 0.722(3) | −0.317(4) | 0.522(3) |
| Cl x | 0.3884(5) | 0.4168(10) | 0.5613(6) |
| y | 0.5 | 0.7904(10) | 0.2061(8) |
| z | 0.557(2) | −0.471(2) | 0.8000(16) |
| O x | 0.0760(8) | 0.0975(4) | 0.0958(3) |
| y | 0.5 | 0.1658(3) | 0.1464(3) |
| z | −0.160(2) | −0.1493(12) | −0.2595(6) |
| C1 x | 0.0504(2) | −0.0741(4) | −0.0431(3) |
| y | 0.6456(7) | 0.1499(3) | 0.20057(18) |
| z | −0.0164(12) | 0.0079(13) | −0.0131(8) |
| C2 x | — | 0.19091(2) | 0.16825(6) |
| y | — | 0.0505(4) | −0.0006(4) |
| z | — | 0.0226(10) | −0.0946(8) |
| D1 x | 0.0867(5) | −0.0483(6) | −0.0018(4) |
| y | 0.06535(13) | 0.1994(6) | 0.2794(3) |
| z | 0.2017(18) | 0.2798(15) | 0.2195(10) |
| D3 x | — | 0.2188(4) | 0.2111(3) |
| y | — | 0.0983(7) | 0.0755(6) |
| z | — | 0.2951(12) | 0.1381(12) |
| D2 x | 0.0559(6) | −0.1372(6) | −0.0916(5) |
| y | 0.7499(9) | 0.2400(5) | 0.3117(4) |
| z | −0.138(2) | −0.131(2) | −0.1518(13) |
| D4 x | — | 0.3168(2) | 0.2702(2) |
| y | — | 0.0693(7) | −0.0338(6) |
| z | — | −0.1095(17) | −0.2946(13) |
| χ 2 | 1.9 | 3.9 | 1.4 |
| wRp, Rp | 2.7, 3.1 | 3.1 3.6 | 2.4, 2.8 |
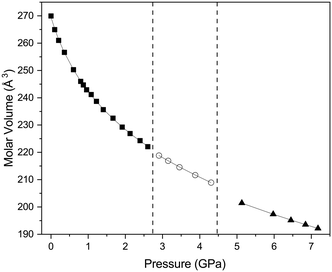
The first phase transition is accompanied by a relatively small change in the molecular volume with ΔV/V of 0.22%, as can be seen from Fig. 4, the rate of change in molecular volume with increasing pressure tracks closely with what might have been expected in the absence of a phase transition. The second phase transition is accompanied by a much larger change in ΔV/V (1.26%). We have been able to obtain equations of state for both phases I, II and III using a Birch–Murnaghan equation of state (EoS) as detailed in Table 2 and the results indicate that phase III is significantly more incompressible than phase I. Whilst we have been able to obtain a numeric value for the bulk modulus of phase II, it should be noted that the number of data points does limit the validity of the determined EoS.
| Phase I | Phase II | Phase III | |
|---|---|---|---|
| a A second order formulism is used and hence the first derivative of the bulk modulus B′ is implied as 4. The median compressibilities of each of the principal axis (X1, X2 and X3) are shown as is the approximate directions relative to the crystallographic axis.73 | |||
| V 0 (Å3) | 538.9(7) | 249.6(4) | 239.5(5) |
| B 0 (GPa) | 5.8(2) | 16.1(2) | 21.0(3) |
| B′ | 9.6(4) | 4a | 4a |
| X1 | 40(1) ≈ c | 16.6(8) ≈ 0.2a − 0.2b + c | 11.3(5) ≈ 0.1a + 0.4b + 0.9c |
| X2 | 12.3(1) = b | 10.8(1) ≈ −0.4a + 0.5b + 0.8c | 7.1(2) ≈ 0.4a − 0.8b + 0.4c |
| X3 | 9.1(1) −a + 0.25c | 3(1) ≈ 0.7a + 0.7b | 2.7(3) ≈ 0.5a + 0.4b − 0.7c |
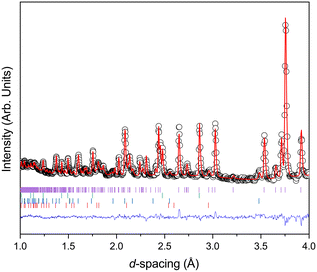
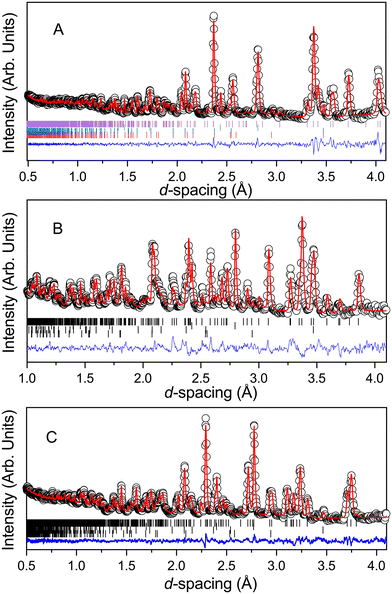
Structure refinement was carried out by the Rietveld method74,75 for phase I in the space group C2/m using the GSAS suite of programs through the EXPGUI graphical interface,72 for the low pressure monoclinic phase, and in space group P![[1 with combining macron]](https://www.rsc.org/images/entities/char_0031_0304.gif) for the high pressure phases. For refinement of the ambient pressure phase initial atomic coordinates for the non-hydrogen atoms and unit-cell dimensions were taken from the literature68 and difference Fourier maps calculated in order to locate the deuterium atoms. For each successive high-pressure data set, starting structural and profile parameters were taken from the results of the previous lower pressure structure refinement. The contribution to the diffraction pattern from the lead pressure calibrant and the anvil materials (alumina and tetragonal zirconia) was modelled by the inclusion of additional crystalline phases in the Rietveld refinements. The final fit to the data collected at 2.4(1) GPa is shown in (Fig. 5). During the course of the refinement it proved necessary to use restraints to maintain a chemically reasonable geometry for the 1,4-dioxane molecule. Initial atomic coordinates for the two high-pressure phases were obtained by model building making use of the imposed crystallographic inversion symmetry. These structures were also refined using GSAS, with the 1,4-dioxane molecule being treated as a rigid body. Final fits, for the data collected at 3.5(1) GPa, and 5.1(1) GPa, are also shown in Fig. 5 and results detailed in Table 1. It can be seen that what we originally believed to be a pure phase at 3.4(1) GPa, contains a small residual quantity of the low pressure phase as can be seen by the discrepancy in the difference plot at approximately 2.25 Å (Fig. 5).
for the high pressure phases. For refinement of the ambient pressure phase initial atomic coordinates for the non-hydrogen atoms and unit-cell dimensions were taken from the literature68 and difference Fourier maps calculated in order to locate the deuterium atoms. For each successive high-pressure data set, starting structural and profile parameters were taken from the results of the previous lower pressure structure refinement. The contribution to the diffraction pattern from the lead pressure calibrant and the anvil materials (alumina and tetragonal zirconia) was modelled by the inclusion of additional crystalline phases in the Rietveld refinements. The final fit to the data collected at 2.4(1) GPa is shown in (Fig. 5). During the course of the refinement it proved necessary to use restraints to maintain a chemically reasonable geometry for the 1,4-dioxane molecule. Initial atomic coordinates for the two high-pressure phases were obtained by model building making use of the imposed crystallographic inversion symmetry. These structures were also refined using GSAS, with the 1,4-dioxane molecule being treated as a rigid body. Final fits, for the data collected at 3.5(1) GPa, and 5.1(1) GPa, are also shown in Fig. 5 and results detailed in Table 1. It can be seen that what we originally believed to be a pure phase at 3.4(1) GPa, contains a small residual quantity of the low pressure phase as can be seen by the discrepancy in the difference plot at approximately 2.25 Å (Fig. 5).
We now turn our attention to the atomic arrangements of the individual phases. The structure of the complex at low pressure (phase I) corresponds to that originally reported.68 The dioxane molecule possesses exact 2/m crystallographic symmetry, with each oxygen atom, forming a short intramolecular contact with the iodine of the iodine monochloride of 2.533(18) Å which is markedly shorter to that seen in the complex formed between dioxane and iodine of 2.799(3) Å at 81 K.67 The shortest D⋯Cl contact is 2.90(1) Å, and involves the deuterium atoms in the equatorial position. This distance is just greater than the sum of the van der Waals radii 2.83 Å76 and can thus only represent at most a very weak C–D⋯Cl hydrogen bond, however, it should be noted that the spatial arrangement of the carbon deuterium and chlorine is such that the possibility of strengthening the hydrogen bond with increasing pressure is extremely favourable as the C–D⋯Cl angle 170.5(7)° and the D⋯Cl–I angle is 119.0(3)° which are comparable to that seen in the neutron diffraction study on trimethylamine iodine monochloride complex.64
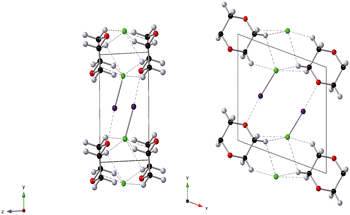
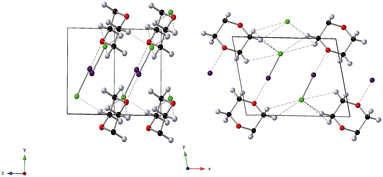
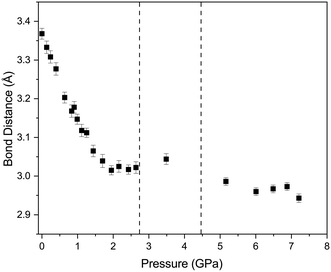
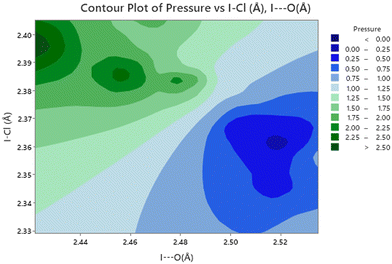
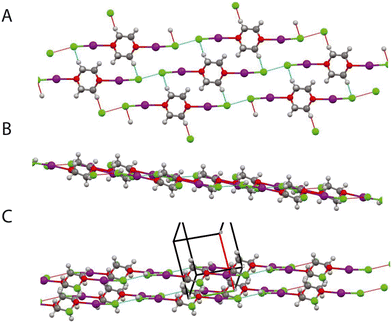
The effect of applying pressure on the I⋯O and I–Cl bond lengths can be seen in Fig. 6. Initially there is little change in the I⋯O distances as the pressure is raised, but at approximately 1 GPa there is a decrease in the I⋯O distances with increasing pressure which levels off above ∼2 GPa, i.e. as the applied pressure approaches the first phase transition to phase II. The changes in the I–Cl bond lengths exhibit much weaker changes with increasing pressure, with a small increase in bond length which mirrors the changes in oxygen iodine distances. Examination of a 3-dimensional graph expressed as a contour map shows this mirroring more clearly, with the shortest I–O associated with the longest I–Cl bond lengths (Fig. 7). At the highest pressure in phase III the changes within for the O⋯I and I–Cl distances are the reverse of those seen at low pressure, where the O⋯I. increase in length with increasing pressure and I–Cl bond distances decrease with increasing pressure. The resulting crystallographic structures are shown in Fig. 8 and 9 for phases II and III respectively.
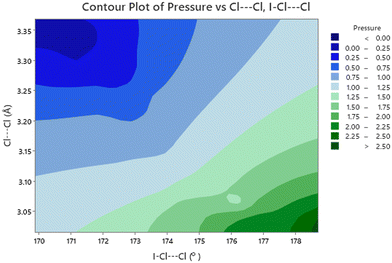 | ||
| Fig. 7 Contour plot of I⋯O distance versus I–Cl as a function of pressure. Note that the shorter I⋯O distances are associated with longer I–Cl distances and occur at higher pressures. | ||
The changes in the Cl⋯Cl bond distances display a much larger variation with increasing pressure (Fig. 10). During the initial increase in pressure there is a large decrease in the Cl⋯Cl distance. When the pressure again approaches 2 GPa the rate of change decreases markedly and eventually levels off, with the Cl⋯Cl distances remaining approximately constant, for both the remainder of the existence of phase I and that of phase II. In phase III the Cl⋯Cl distances are shorter and only decrease slightly with pressure.
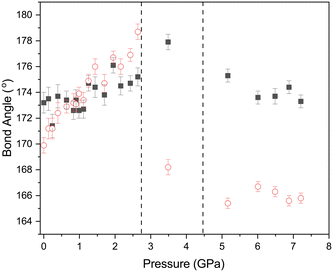
Accompanying these changes there is an increase in both the O⋯I–Cl and I–Cl⋯Cl angles (Fig. 11). The effect of making the O⋯I–Cl angle closer to 180° will enhance the interaction between the lone pair of the oxygen atom and the sigma hole on the iodine. Conversely the approach to 180° for the and I–Cl⋯Cl angle will lead to an unfavourable alignment of the two relatively positive areas of electron density at the sigma holes on the chlorine atoms, this coupled with the decrease in the Cl⋯Cl distance will lead to an energetically unfavourable situation. This is offset to some extent by the polar flattening observed along the internuclear axis leading to effectively a smaller van der Waals radii in this direction.77 As we have previously commented from about ∼2 GPa there is no significant change in the Cl⋯Cl distance of approximately 3.02 Å. Any further contraction should it occur would be clearly energetically unfavourable. This is relieved by a shearing of motion of the molecules forming the complex during the phase transition, this not only increases the Cl⋯Cl distance but more importantly the I–Cl⋯Cl angle changes from 178.7(6)° at 2.6(1) GPa to 168.2(6)° in phase 2. 3.5(1) GPa (Fig. 11). This on simple electrostatic consideration would reduce the unfavourable dipole–dipole interaction by ∼12% compared to a ∼2% reduction in the dipolar interaction due to the increase in Cl⋯Cl distance from 3.022(15) Å to 3.044(14) Å.
In an attempt to ascertain if there are any significant correlation amongst the metrics of the structure we have discussed we have carried out a correlation analysis using SPSS,78 because we are unable to include the errors associated with these metrics, the significance levels are likely to be overestimated i.e. we more likely to state that something is significant when it is really not significant i.e. we will be more prone to committing a type 1 error.79 The results of this analysis are given in Table 3. With this caveat some conclusions can be put forward. There are unsurprisingly statistically significant correlations between these metrics, however relating them to chemically intuitive concepts is more challenging. The most straightforward explanation for the negative correlation between I⋯O and I–Cl distances, would seem to favour early theories of halogen bonding relying upon donation of an oxygen lone pair into an anti-bonding orbital in an I–Cl bond. The most clearly demonstrated correlations involve the effect of pressure on the Cl⋯Cl distance and I–Cl⋯Cl angle (Fig. 12). There is a strong negative correlation between pressure and Cl⋯Cl distance, these would seem to be associated with polar flattening at the Cl atoms, and associated with this is approach to 180° of the I–C⋯Cl angle which drives it away from the typical angle seen for a type 1 halogen bond of 160 ± 10°.80 The ultimate consequence this motion being the first phase transition which restores the I–Cl⋯Cl to 168.3(6)° which is more typical of a type I halogen bond, which is maintained upon further increase in pressure. The second phase transition is not accompanied by a further small reduction in the I–Cl⋯Cl angle and a reduction in the Cl⋯Cl distance. Raising the pressure to 7.2(1) GPa does not produce any appreciable changes in these parameters.
| P | I–Cl | I⋯O | Cl⋯Cl | O⋯I–Cl | I–Cl⋯Cl | ||
|---|---|---|---|---|---|---|---|
| a Correlation is significant at the 0.01 level (2-tailed). b Correlation is significant at the 0.05 level (2-tailed). | |||||||
| P | Pearson correlation | 1 | 0.657a | −0.857a | −0.947a | 0.715a | 0.965a |
| σ | 0.006 | 0.000 | 0.000 | 0.002 | 0.000 | ||
| N | 16 | 16 | 16 | 16 | 16 | 16 | |
| I–Cl | Pearson correlation | 0.657a | 1 | −0.802a | −0.689a | 0.569b | 0.682a |
| σ (2-tailed) | 0.006 | 0.000 | 0.003 | 0.021 | 0.004 | ||
| N | 16 | 16 | 16 | 16 | 16 | 16 | |
| I⋯O | Pearson correlation | −0.857a | −0.802a | 1 | 0.740a | −0.733a | −0.859a |
| σ (2-tailed) | 0.000 | 0.000 | 0.001 | 0.001 | 0.000 | ||
| N | 16 | 16 | 16 | 16 | 16 | 16 | |
| Cl⋯Cl | Pearson correlation | −0.947a | −0.689a | 0.0740a | 1 | −0.0657a | −0.936a |
| σ (2-tailed) | 0.000 | 0.003 | 0.001 | 0.006 | 0.000 | ||
| N | 16 | 16 16 | 16 | 16 | 16 | ||
| O⋯I–Cl | Pearson correlation | 0.715a | 0.569b | −0.733a | −0.657a | 1 | 0.760a |
| σ (2-tailed) | 0.002 | 0.021 | 0.001 | 0.006 | 0.001 | ||
| N | 16 | 16 | 16 | 16 | 16 | 16 | |
| I–Cl⋯Cl | Pearson correlation | 0.965a | 0.682a | −0.859a | −0.936a | 0.760a | 1 |
| σ (2-tailed) | 0.000 | 0.004 | 0.000 | 0.000 | 0.001 | ||
| N | 16 | 16 | 16 | 16 | 16 | 16 | |
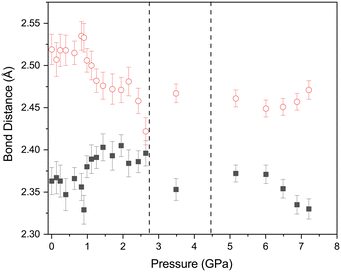
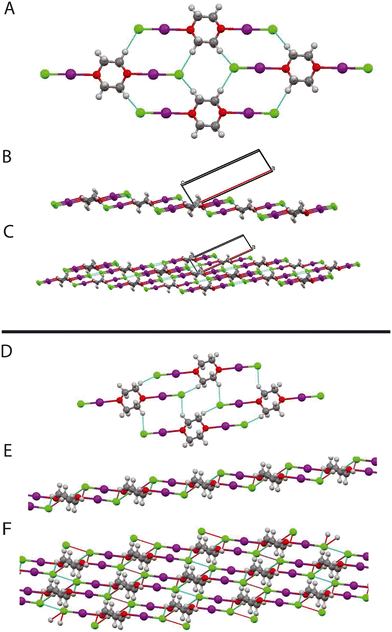
Concurrent with the changes described above there is also a decrease in the D⋯Cl distances of the C–D⋯Cl hydrogen bonds which involve both of the crystallographically independent deuterium atoms (Fig. 13). Once again these changes appear to stop at approximately 2 GPa, with the D⋯Cl distances have decreased from 2.90(1) Å and 3.20(1) Å to 2.62(1) Å and 2.81(1) Å (2.2 GPa). for D(2) and D(1) respectively. We have previously commented we believe that the contacts involving D(2) constitute a genuine hydrogen bond as the C–D⋯Cl angle is 170.5(7)°, whilst the corresponding angle involving D(1) is 115.0(7)° and thus deviates from values typically encountered in C–H⋯Cl hydrogen bonds (119.3–169.2° with an average value of 146.4°).45 If we consider only the contacts involving D(2) there are two distinct hydrogen bond motifs. In order to describe the arrangement of the intramolecular forces interactions occurring in the different phases we have adopted the scheme proposed by Etter MacDonald and Bernstein81 for hydrogen bonded systems but adapted it slightly to take account of the halogen bonds, by adding a postscript indicating the number of halogen bonds involved (HB) The first motif can the designated as R2210 2HB and involves the O⋯I–Cl moiety, and contains 2 C–D⋯Cl hydrogen bonds and 2 O⋯I–Cl interactions. These rings share a common edge and are also linked via Cl⋯Cl interactions. Fig. 14. The second motif can be designated as R4410 and this unit only consists of 4 C–D⋯Cl hydrogen bonds (Fig. 14). The net result is to produce a sheet structure. These sheets are then linked via the Cl⋯Cl interactions to complete the structure (Fig. 14).
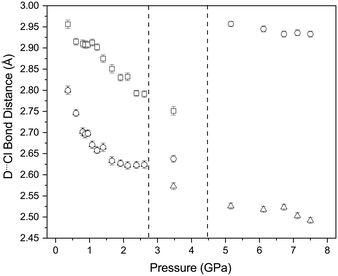 | ||
| Fig. 13 Variation in hydrogen bond distance in with increasing pressure. The vertical dashed lines indicate the phase transitions from PI to PII at ∼2.8 GPa and PII–PIII at ∼4.45 GPa. | ||
In the intermediate phase the R2210 2HB and R4410 rings, are maintained, however whereas in the ambient phase all the H⋯Cl distances are the same this is not the case in the intermediate phase Cl⋯H 2.567(8) and 2.638(8) Å (Fig. 14). The Cl⋯Cl interactions again link the layers together however this accompanied by a short interlayer C–H⋯Cl interaction of 2.799(10) Å. In the highest pressure phase only one ring remains involving C–H⋯Cl interactions and is part of a R2210 2HB ring (Fig. 15). Cl⋯Cl reductions are still present but now lie within the sheets in the structure. There are also relatively short transannular H⋯I distances of 3.12(1) and 3.17(1) Å which are not attractive in nature but rather minimise transannular repulsions Finally returning to Fig. 6 we see that with increasing pressure the O⋯I distance increases whilst the I–Cl decreases which implies that the O⋯I interaction decreases at the highest pressures.
These observations are consistent with the changes we have commented on unit-cell volumes previously, in which the first phase transition if accompanied by only a small change in volume whilst there is an abrupt changes in volume for the second phase transition. The first phase transition maintains the sheet structure with Cl⋯Cl interactions linking the sheets, whilst in the second there is a change in the number of hydrogen bonds present and a new sheet structure is formed in which there Cl⋯Cl interactions and only van der Waals forces between the layers. Drawing these results together it appears that initially the C–H⋯Cl interactions are favoured on increasing the pressure and the Cl⋯Cl interactions become destabilising, until after the first phase transition the shearing motion between the sheets containing the molecules once again leads to favourable interactions between the chlorine atoms. Raising the pressure still further leads to the elimination of one of the C–H⋯Cl hydrogen bonds and the Cl⋯Cl interactions being favoured.
4 Conclusions
In conclusion we have shown that the effect of pressure on 1,4-dioxane iodine monochloride complex is to produce a series of phase transitions, which are accompanied by changes within both the inter and intra-molecular bonds. During the application of pressure to phase 1 there is a decrease in both the Cl⋯Cl and D⋯Cl distances, but also an in the I–Cl⋯Cl angles which creates an energetically unfavourable repulsion between the sigma holes on the chlorine atoms. At the first phase transition there is a significant decrease in the I–Cl⋯Cl, angle to decrease this repulsion combined with a strengthening of the Cl⋯D hydrogen bonds. At the second phase transition, one of the Cl⋯D hydrogen bonds is replaced by a short I⋯H contact. As the pressure is further raised, both the Cl⋯Cl and remaining Cl⋯hydrogen bond distances decrease, but this is also accompanied by an increase in the I⋯O distance coupled with a decrease in the I–Cl bond length. These changes at the highest pressures, indicate that intermolecular, Cl⋯Cl and C–D⋯Cl interactions are favoured at the expense of the intramolecular O⋯I interactions.Conflicts of interest
There are no conflicts to declare.Acknowledgements
The authors wish to acknowledge the significant involvement of the late William (Bill) Marshall, both to this work and also his major contributions to the study of halogen and hydrogen bonding using neutron diffraction. We also acknowledge the support provided by the ISIS Neutron and Muon Source (STFC) for beam time awarded on the PEARL instrument.69,82Notes and references
- G. Cavallo, P. Metrangolo, R. Milani, T. Pilati, A. Priimagi, G. Resnati and G. Terraneo, Chem. Rev., 2016, 116, 2478–2601 CrossRef CAS PubMed.
- P. Politzer, J. S. Murray and T. Clark, Phys. Chem. Chem. Phys., 2010, 12, 7748–7757 RSC.
- T. M. Beale, M. G. Chudzinski, M. G. Sarwar and M. S. Taylor, Chem. Soc. Rev., 2013, 42, 1667–1680 RSC.
- M. Erdélyi, Chem. Soc. Rev., 2012, 41, 3547–3557 RSC.
- L. C. Gilday, S. W. Robinson, T. A. Barendt, M. J. Langton, B. R. Mullaney and P. D. Beer, Chem. Rev., 2015, 115, 7118–7195 CrossRef CAS PubMed.
- H. Wang, W. Wang and W. J. Jin, Chem. Rev., 2016, 116, 5072–5104 CrossRef CAS PubMed.
- M. Saito, Y. Kobayashi, S. Tsuzuki and Y. Takemoto, Angew. Chem., Int. Ed., 2017, 56, 7653–7657 CrossRef CAS PubMed.
- M. D. Perera and C. B. Aakeröy, New J. Chem., 2019, 43, 8311–8314 RSC.
- F. Fernandez-Palacio, M. Poutanen, M. Saccone, A. Siiskonen, G. Terraneo, G. Resnati, O. Ikkala, P. Metrangolo and A. Priimagi, Chem. Mater., 2016, 28, 8314–8321 CrossRef CAS PubMed.
- L. J. McAllister, C. Präsang, J. P.-W. Wong, R. J. Thatcher, A. C. Whitwood, B. Donnio, P. O'Brien, P. B. Karadakov and D. W. Bruce, Chem. Commun., 2013, 49, 3946–3948 RSC.
- T. Apih, A. Gregorovič, V. Žagar and J. Seliger, Chem. Phys., 2019, 523, 12–17 CrossRef CAS.
- P. M. J. Szell, L. Grébert and D. L. Bryce, Angew. Chem., Int. Ed., 2019, 58, 13479–13485 CrossRef CAS PubMed.
- M. Erakovič, D. Cinčić, K. Molčanov and V. Stilinović, Angew. Chem., Int. Ed., 2019, 58, 15702–15706 CrossRef PubMed.
- J. Viger-Gravel, S. Leclerc, I. Korobkov and D. L. Bryce, J. Am. Chem. Soc., 2014, 136, 6929–6942 CrossRef CAS PubMed.
- Y. Xu, B. Gabidullin and D. L. Bryce, J. Phys. Chem. A, 2019, 123, 6194–6209 CrossRef CAS PubMed.
- V. Oliveira, E. Kraka and D. Cremer, Inorg. Chem., 2017, 56, 488–502 CrossRef CAS PubMed.
- M. H. Kolář and P. Hobza, Chem. Rev., 2016, 116, 5155–5187 CrossRef PubMed.
- C. Bannwarth, S. Ehlert and S. Grimme, J. Chem. Theory Comput., 2019, 15, 1652–1671 CrossRef CAS PubMed.
- R. Wang, D. Hartnick and U. Englert, Z. Kristallogr. – Cryst. Mater., 2018, 233, 733–744 CrossRef CAS.
- J. Řezáč and A. de la Lande, Phys. Chem. Chem. Phys., 2017, 19, 791–803 RSC.
- R. H. Crabtree, Chem. Soc. Rev., 2017, 46, 1720–1729 RSC.
- P. R. Varadwaj, A. Varadwaj and H. M. Marques, Inorganics, 2019, 7(3), 40 CrossRef CAS.
- P. Politzer, J. S. Murray, T. Clark and G. Resnati, Phys. Chem. Chem. Phys., 2017, 19, 32166–32178 RSC.
- T. Clark, M. Hennemann, J. S. Murray and P. Politzer, J. Mol. Model., 2007, 13, 291–296 CrossRef CAS PubMed.
- T. Brinck, J. S. Murray and P. Politzer, Int. J. Quantum Chem., 1992, 44, 57–64 CrossRef.
- P. Politzer, K. E. Riley, F. A. Bulat and J. S. Murray, Comput. Theor. Chem., 2012, 998, 2–8 CrossRef CAS.
- O. Hassel, Science, 1970, 170, 497–502 CrossRef CAS PubMed.
- R. S. Mulliken, J. Am. Chem. Soc., 1952, 74, 811–824 CrossRef CAS.
- R. S. Mulliken, J. Phys. Chem., 1952, 56, 801–822 CrossRef CAS.
- N. Giordano, S. Afanasjevs, C. M. Beavers, C. L. Hobday, K. V. Kamenev, E. F. O'Bannon, J. Ruiz-Fuertes, S. J. Teat, R. Valiente and S. Parsons, Molecules, 2019, 24(10) CrossRef CAS PubMed.
- O. Hassel and C. Rømming, Q. Rev., Chem. Soc., 1962, 16, 1–18 RSC.
- E. T. Keve, S. C. Abrahams and J. L. Bernstein, J. Chem. Phys., 1971, 54, 2556–2563 CrossRef CAS.
- W. G. Marshall, R. H. Jones, K. S. Knight, C. R. Pulham and R. I. Smith, Acta Crystallogr., Sect. B: Struct. Sci., Cryst. Eng. Mater., 2019, 75, 152–159 CrossRef CAS PubMed.
- V. Cody, J. Am. Chem. Soc., 1974, 96, 6720–6725 CrossRef CAS PubMed.
- N. Alcock, Adv. Inorg. Chem. Radiochem., 1972, 15, 1–58 CrossRef CAS.
- L. Vogel, P. Wonner and S. M. Huber, Angew. Chem., Int. Ed., 2019, 58, 1880–1891 CrossRef CAS PubMed.
- S. Scheiner, Acc. Chem. Res., 2013, 46, 280–288 CrossRef CAS PubMed.
- A. Bauzá, S. K. Seth and A. Frontera, Coord. Chem. Rev., 2019, 384, 107–125 CrossRef.
- G. R. Desiraju, P. S. Ho, L. Kloo, A. C. Legon, R. Marquardt, P. Metrangolo, P. Politzer, G. Resnati and K. Rissanen, Pure Appl. Chem., 2013, 85, 1711–1713 CrossRef CAS.
- R. H. Jones and T. A. Hamor, J. Organomet. Chem., 1984, 262, 151–155 CrossRef CAS.
- A. K. Chauhan, A. Kumar, R. C. Srivastava, J. Beckmann, A. Duthie and R. J. Butcher, J. Organomet. Chem., 2004, 689, 345–351 CrossRef CAS.
- T. Dahl and O. Hassel, Acta Chem. Scand., 1968, 22, 2036–2037 CrossRef CAS.
- M. Boucher, D. Macikenas, T. Ren and J. D. Protasiewicz, J. Am. Chem. Soc., 1997, 119, 9366–9376 CrossRef CAS.
- G. Desiraju and T. Steiner, The Weak Hydrogen Bond: In Structural Chemistry and Biology, Oxford University Press, 2001 Search PubMed.
- R. Taylor and O. Kennard, J. Am. Chem. Soc., 1982, 104, 5063–5070 CrossRef CAS.
- K. F. Dziubek, D. Jeęczmiński and A. Katrusiak, J. Phys. Chem. Lett., 2010, 1, 844–849 CrossRef CAS.
- A. Dawson, D. R. Allan, S. A. Belmonte, S. J. Clark, W. I. F. David, P. A. McGregor, S. Parsons, C. R. Pulham and L. Sawyer, Cryst. Growth Des., 2005, 5, 1415–1427 CrossRef CAS.
- E. V. Boldyreva, Acta Crystallogr., Sect. A: Found. Crystallogr., 2008, 64, 218–231 CrossRef CAS PubMed.
- G. Resnati, E. Boldyreva, P. Bombicz and M. Kawano, IUCrJ, 2015, 2, 675–690 CrossRef CAS PubMed.
- S. Sikka and S. M. Sharma, Phase Transitions, 2008, 81, 907–934 CrossRef CAS.
- A. D. Fortes, I. G. Wood, M. Alfredsson, L. Vočadlo, K. S. Knight, W. G. Marshall, M. G. Tucker and F. Fernandez-Alonso, High Pressure Res., 2007, 27, 201–212 CrossRef CAS.
- C. G. Salzmann, P. G. Radaelli, A. Hallbrucker, E. Mayer and J. L. Finney, Science, 2006, 311, 1758–1761 CrossRef CAS PubMed.
- J. S. Loveday, R. J. Nelmes, W. G. Marshall, J. M. Besson, S. Klotz and G. Hamel, Phys. Rev. Lett., 1996, 76, 74–77 CrossRef CAS PubMed.
- J. M. Besson, R. J. Nelmes, G. Hamel, J. S. Loveday, G. Weill and S. Hull, Phys. B, 1992, 180, 907–910 CrossRef.
- W. G. Marshall and D. J. Francis, J. Appl. Crystallogr., 2002, 35, 122–125 CrossRef CAS.
- M. Podsiadło, A. Olejniczak and A. Katrusiak, CrystEngComm, 2014, 16, 8279–8285 RSC.
- M. Bujak, M. Podsiadło and A. Katrusiak, CrystEngComm, 2016, 18, 5393–5397 RSC.
- G. Mínguez Espallargas, L. Brammer, D. R. Allan, C. R. Pulham, N. Robertson and J. E. Warren, J. Am. Chem. Soc., 2008, 130, 9058–9071 CrossRef PubMed.
- S. Crawford, M. Kirchner, D. Bläser, R. Boese, W. David, A. Dawson, A. Gehrke, R. Ibberson, W. Marshall, S. Parsons and O. Yamamuro, Angew. Chem., Int. Ed., 2009, 48, 755–757 CrossRef CAS PubMed.
- M. Prager, W. I. F. David and R. M. Ibberson, J. Chem. Phys., 1991, 95, 2473–2480 CrossRef CAS.
- D. R. Allan, S. J. Clark, R. M. Ibberson, S. Parsons, C. R. Pulham and L. Sawyer, Chem. Commun., 1999, 751–752 RSC.
- W. I. F. David and R. M. Ibberson, Acta Crystallogr., Sect. C: Cryst. Struct. Commun., 1992, 48, 301–303 CrossRef.
- V. F. Sears, Neutron News, 1992, 3, 26–37 CrossRef.
- W. G. Marshall, R. H. Jones, K. S. Knight, J. Clews, R. J. Darton, W. Miller, S. J. Coles and M. B. Pitak, CrystEngComm, 2017, 19, 5194–5201 RSC.
- W. G. Marshall, R. H. Jones and K. S. Knight, CrystEngComm, 2018, 20, 3246–3250 RSC.
- R. H. Jones, K. S. Knight, W. G. Marshall, J. Clews, R. J. Darton, D. Pyatt, S. J. Coles and P. N. Horton, CrystEngComm, 2014, 16, 237–243 RSC.
- W. G. Marshall, R. H. Jones and K. S. Knight, CrystEngComm, 2019, 21, 5269–5277 RSC.
- O. Hassel and J. Hvoslef, Acta Chem. Scand., 1956, 10, 138–139 CrossRef CAS.
- C. L. Bull, N. P. Funnell, M. G. Tucker, S. Hull, D. J. Francis and W. G. Marshall, High Pressure Res., 2016, 36, 493–511 CrossRef.
- S. Klotz, J. C. Chervin, P. Munsch and G. L. Marchand, J. Phys. D: Appl. Phys., 2009, 42, 075413 CrossRef.
- O. Arnold, J. C. Bilheux, J. M. Borreguero, A. Buts, S. I. Campbell, L. Chapon, M. Doucet, N. Draper, R. Ferraz Leal, M. A. Gigg, V. E. Lynch, A. Markvardsen, D. J. Mikkelson, R. L. Mikkelson, R. Miller, K. Palmen, P. Parker, G. Passos, T. G. Perring, P. F. Peterson, S. Ren, M. A. Reuter, A. T. Savici, J. W. Taylor, R. J. Taylor, R. Tolchenov, W. Zhou and J. Zikovsky, Nucl. Instrum. Methods Phys. Res., Sect. A, 2014, 764, 156–166 CrossRef CAS.
- B. H. Toby, J. Appl. Crystallogr., 2001, 34, 210–213 CrossRef CAS.
- M. J. Cliffe and A. L. Goodwin, J. Appl. Crystallogr., 2012, 45, 1321–1329 CrossRef CAS.
- H. M. Rietveld, J. Appl. Crystallogr., 1969, 2, 65–71 CrossRef CAS.
- B. van Laar and H. Schenk, Acta Crystallogr., Sect. A: Found. Adv., 2018, 74, 88–92 CrossRef PubMed.
- R. S. Rowland and R. Taylor, J. Phys. Chem., 1996, 100, 7384–7391 CrossRef CAS.
- S. C. Nyburg and C. H. Faerman, Acta Crystallogr., Sect. B: Struct. Sci., 1985, 41, 274–279 CrossRef.
- IBM, IBM SPSS Statistics for Windows, Version 27.0, Armonk, NY, 2020 Search PubMed.
- D. Rowntree, Statistics without Tears, 1981, Penguin Search PubMed.
- A. Mukherjee and G. R. Desiraju, IUCrJ, 2014, 1, 49–60 CrossRef CAS PubMed.
- M. C. Etter, J. C. MacDonald and J. Bernstein, Acta Crystallogr., Sect. B: Struct. Sci., 1990, 46, 256–262 CrossRef PubMed.
- R. J. Jones, C. L. Bull and K. S. Knight, STFC ISIS Neutron and Muon Source, 2016 DOI:10.5286/ISIS.E.49920213.
Footnotes |
| † CCDC Phase I 2255386–2255389 phase I 2255390–2255393 phase I 2255394–2255397 phase II 2255398 phase III 2255400–2255404 phase I 2255521–2255524. For crystallographic data in CIF or other electronic format see DOI: https://doi.org/10.1039/d3ce00362k |
| ‡ Author deceased. |
| This journal is © The Royal Society of Chemistry 2023 |

