 Open Access Article
Tailoring the physical properties of hybrid magnetic quinuclidine-based plastic compounds via weak interactions†
Palmerina
González-Izquierdo‡
 ab,
Imanol
de Pedro
*a,
Laura
Cañadillas-Delgado
b,
Garikoitz
Beobide
cd,
Oriol
Vallcorba
 e,
Manuel
Sánchez-Andújar
 f,
María Teresa
Fernández-Díaz
b,
Jesús Rodríguez
Fernández
 a and
Oscar
Fabelo
 *b
*b
aCITIMAC, Facultad de Ciencias, Universidad de Cantabria, 39005 Santander, Spain. E-mail: manuel.depedro@unican.es
bInstitut Laue-Langevin, BP 156X, F-38042 Grenoble Cedex, France. E-mail: fabelo@ill.fr
cDepartamento de Química Inorgánica, Facultad de Ciencia y Tecnología, Universidad del País Vasco, Apartado 644, E-48080, Bilbao, Spain
dBasque Ctr Mat Applicat & Nanostruct, BCMat, UPV EHU Sci Pk, Leioa 48940, Spain
eALBA Synchrotron Light Source, Cerdanyola del Vallés, Barcelona, Spain
fQuiMolMat Group, Department of Chemistry, Faculty of Science and Advanced Scientific Research Center (CICA), University of A Coruna, Zapateira, 15071 A Coruna, Spain
First published on 7th December 2022
Abstract
Herein we explore the opportunities arising from combining bicyclic amine cations with halometallate anions to build organic–inorganic hybrid materials. We will use the crystal engineering approach in these materials, focusing on the tuning of the organic cation, which is mainly responsible for obtaining both new plastic states at high temperature and electrical behaviour below the plastic temperature. Precisely, this work explores the influence of the ketonization of the bicyclic quinuclidine molecule (C7H13N)+, which, combined with the tetrachloroferrate(1-) anion, gives the compound (3-oxoquinuclidinium)[FeCl4]. Interestingly, crystallization in the presence of humidity is enough to obtain an isostructural hydrate phase of formula (3-oxoquinuclidinium)[FeCl4]·H2O. Although the organic–inorganic layered structure is the same in both compounds, the three-dimensional magnetic ordering disappears after the intercalation of crystallization water molecules. A heat treatment above 400 K allows the removal of water obtaining the non-hydrate phase. Finally, the temperature evolution of the electric and magnetic behaviour will be compared with other previously reported hybrid organic–inorganic materials built with tetrachloroferrate ions and quinuclidinium-based cations.
Introduction
There is great interest in the academic and industrial research about the development of new multifunctional hybrid materials, which combine organic and inorganic components in the same structure, as they show a broad scope of potential applications (ferroelasticity,1 piezoelectricity,2 ferroelectricity,3 ferromagnetism4 and ferrotoroidicity5) near room temperature (RT). Their functionality is mainly related to structural transitions in the solid phase, associated predominantly with highly symmetric organic cations and have a great degree of freedom of orientation or conformation. Among these materials, those presenting above RT plastic phases are especially desirable and, in particular, those combining plastic and ferroelectric phases, as they could present a small coercive electric field, allowing switchable polarisation with relatively low voltages and high-frequency performance. These plastic phases are generally triggered by temperature-induced motions and they allow the materials to flow under stress, which favours the manufacture of thin-films with the possibility of controlling their properties through the application of strain engineering in conventional and unconventional ways,6 boosting their use in energy harvesting, energy storage,7 catalysis,8 and medicine,9 among others. Even today, it can be challenging to predict which combinations of cations and anions will result in plastic crystalline materials, despite the fact that plastic crystals were first reported in the 1960s.10In these efforts, one of the most successful strategies relies on the use of organic cations with globular structures, which can induce rotator phases, also known as mesophases since they emerge between the solid and liquid states. However, due to the high symmetry of globular molecules, achieving non-centrosymmetric phases below the plastic phase that allow net ferroelectricity is difficult. Taking into consideration the enormous structural diversity and broad physical properties of the potential molecules, to date, there is a lack of targeted design of multifunctional hybrid materials. Currently, the most used molecules are based on alkylammonium and aromatic cation derivatives based on quinuclidine (1-azabicyclo[2.2.2]octane) or DABCO (1,4-diazabicyclo[2.2.2]octane).
A recent phenomenological theory, also known as quasi-spherical theory,11 proposes that a subtle modification of the spherical organic cations induces a local decrease of symmetry. This may favour crystallisation in low-symmetry space groups. Due to the globular nature of the constituents, a second order phase transition from paraelectric to ferroelectric states could be achieved, in accordance with Landau's theory.11 Consequently, the crystal engineering approach proposes several chemical designs based on appealing ideas such as homochirality,12 which induces polar groups by symmetry breaking, and substitution of proton (H) with the heavier deuterium (D)13 or fluorination,14 which usually does not change the polar group but induces minor structural changes in the crystal structure that affect its ferroic properties. That is, the coordination environments play a critical role and are related to the intermolecular interactions.
Focusing on chemical design, the reshaping of the globular molecules by alkylation, nitration, ketonization, acetylation or esterification can lead to the crystallization in low symmetry space groups by lowering the local symmetry. Some literature examples have already reported using this strategy, the most common being the ketonization of quinuclidine molecules, which transforms the [quinuclidinium]ClO4 compound, which crystallizes in the cubic centrosymmetric Pm![[3 with combining macron]](https://www.rsc.org/images/entities/char_0033_0304.gif) m space group, into the (3-oxoquinuclidinium)ClO4 compound,15 which presents an orthorhombic polar Pna21 space group. This change gives rise to a paraelectric-to-ferroelectric first-order phase transition above RT,16 which is related to the symmetry breaking.17 Especially interesting effects are due to homochirality, like in the case of ((R and S)-(+ −)-3-Me–H2dabco)[TFSA]2 (TFSA=bis(trifluoromethylsulfonylammonium)); homochiral ferroelectric compounds which show a large number of crystal phase transitions and a Tc of about 400 K higher than the one detected in (H2dabco)[TFSA]2.18 Other examples are the ((R)-(−)-3-hydroxyquinuclidium)[FeCl4],19 a plastic hybrid compound with chirality, ferroelectricity and long-range magnetic ordering, and ((R and S)-(+ −)-3-C4H9N))[CdCl3] compound, a pyrrolidinium magnetic hybrid material with ferroelectric phase transition from C2221 to P21, with a significantly higher Curie temperature than the parent compound (C4H10N))[CdCl3].20
m space group, into the (3-oxoquinuclidinium)ClO4 compound,15 which presents an orthorhombic polar Pna21 space group. This change gives rise to a paraelectric-to-ferroelectric first-order phase transition above RT,16 which is related to the symmetry breaking.17 Especially interesting effects are due to homochirality, like in the case of ((R and S)-(+ −)-3-Me–H2dabco)[TFSA]2 (TFSA=bis(trifluoromethylsulfonylammonium)); homochiral ferroelectric compounds which show a large number of crystal phase transitions and a Tc of about 400 K higher than the one detected in (H2dabco)[TFSA]2.18 Other examples are the ((R)-(−)-3-hydroxyquinuclidium)[FeCl4],19 a plastic hybrid compound with chirality, ferroelectricity and long-range magnetic ordering, and ((R and S)-(+ −)-3-C4H9N))[CdCl3] compound, a pyrrolidinium magnetic hybrid material with ferroelectric phase transition from C2221 to P21, with a significantly higher Curie temperature than the parent compound (C4H10N))[CdCl3].20
Among these materials, those including paramagnetic ions give rise to magnetic hybrid materials, which are applied as components in many technologies, such as memory storage devices, electro-magnets and sensors.21 These crystalline soft-materials with sufficiently strong intrinsic magnetic properties can facilitate magnetic ordering in the presence of a plastic phase offering unique properties (e.g., multiferroics), which could be tuned by the application of an external stimulus (i.e., magnetic or electric fields) in the plastic phase.22 Recently, several of these compounds showing interesting properties have been reported, such as ((CH3)4N)[FeCl4],23 presenting high temperature plastic-crystal phases with ferroelectricity and piezoelectricity, (choline)[FeCl4],24 a plastic-crystal with 3D magnetic ordering, (quinuclidium)[FeCl4],25 a magnetic hybrid compound with a giant dielectric constant, and ((CH3)3S)[FeCl4],26 with capabilities for both thermal and electric energy storage.
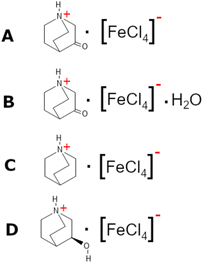
In this work, using the approach described in the quasi-spherical theory, we have reduced the local symmetry of the cation by the ketonization of the quinuclidine molecule, obtaining the 3-oxoquinuclidine molecule (also named 3-quinuclidone). The reaction of the 3-quinuclidonehydrochloride with tetrachloroferrate ions under a dry atmosphere produces the (3-oxoquinuclidinium)[FeCl4] compound (A). Interestingly, the recrystallization at RT and atmospheric ambient gives rise to the isostructural hydrate form of the pristine compound (3-oxoquinuclidinium)[FeCl4]·H2O (B). Herein, we report the crystal structure and the magnetic behaviour of the hydrate and non-hydrate compounds. Although the crystal structures are rather similar, the long-range magnetic ordering observed below 3 K on A is suppressed by the inclusion of crystallization water molecules into the network, demonstrating how even little modifications in the exchange coupling interactions can have a significant impact on magnetic properties. Furthermore, the obtained models have been compared with those previously reported for (quinuclidinium)[FeCl4]25 (C) and ((R)-(−)-3-hydroxyquinuclidium)[FeCl4]19 (D) (see Scheme 1) to study the effect of the ketonization of quinuclidinium. Even though the structures of the four compounds can be described by the stacking of organic–inorganic layers, the attachment of hydrogen acceptor groups to the quinuclidinium cation causes the formation of highly directional hydrogen bonds, as well as variations in the halogen⋯halogen intermolecular interactions, modifying the structural, optical, magnetic and electrical properties. We hope this study contributes to the targeted design and performance optimization strategies for hybrid materials with ferroic properties.
Experimental
Chemicals
All the chemicals were of reagent grade and used as commercially obtained.Synthesis of (3-oxoquinuclidinium)[FeCl4] (A)
One equivalent of 3-quinuclidone hydrochloride (6.18 mmol, 998 mg) was placed in a round bottom flask with a stirring bar and dissolved in 20.0 ml of methanol. After addition of one equivalent of FeCl3 (6.18 mol, 1002 mg), the solvent from the reaction mixture was removed in a rotary evaporator, resulting in a yellow powder, suitable for X-ray and neutron powder diffraction.Single crystals for X-ray and neutron diffraction were obtained by recrystallization in methanol of the previously synthesized yellow powder through a slow evaporation method (approx. 1 month) under a controlled atmosphere by storing the solution in a silica gel-filled desiccator. The obtained yield was of 76.2% based on 3-quinuclidone hydrochloride. The main absorption bands in the IR spectra measured on KBr pellets are 2941(s) cm−1, 2888(m) cm−1, 1718(s) cm−1, 1466(m) cm−1, 1401(s) cm−1, 1120(m) cm−1 and 840(m) cm−1.
Synthesis of (3-oxoquinuclidinium)[FeCl4]·H2O (B)
The synthesis of B is similar to the single-crystal synthesis of compound A but, in this case, under a room atmosphere, allowing the absorption of atmospheric water molecules.The main absorption bands in the IR spectra measured on KBr pellets are 3480(s) cm−1, 2934(s) cm−1, 2882(m) cm−1, 1722(s) cm−1, 1464(m) cm−1, 1400(s) cm−1, 1115(m) cm−1 and 845(m) cm−1.
Infrared spectroscopy (IR)
The IR spectra (KBr pellets) were recorded on an FTIR 8400S Shimadzu spectrometer in the 4000–400 cm−1 spectral region.Differential scanning calorimetry (DSC)
Thermal analyses (TG/DTA) were performed on a Setaram calorimeter (DSC131) under a nitrogen atmosphere at a heating rate of 5 K min−1 up to 470 K. For this experiment, ca. 12 mg of sample were used and blank runs were performed.Magnetic susceptibility and magnetization measurements
Variable-temperature magnetic susceptibility measurements were performed using a standard Quantum Design PPMS magnetometer whilst heating from 2 to 300 K at 1 kOe after cooling in the absence (zero field cooling, ZFC) of the applied field. Magnetization as a function of field (H) was measured using the same magnetometer in −50 ≤ H/kOe ≤ 50 at 2 K after cooling the sample in zero field.Heat capacity measurements (Cp)
Heat capacity measurements of A were performed through a relaxation method using a Quantum design PPMS system. The sample consisted of a plate of 0.3 mm thickness and 4.53 mg weight obtained by compressing the original polycrystalline powder. In order to ensure good thermal contact, the sample was glued to the sample holder using Apiezon-N grease. Data were collected with zero field from 2 to 300 K.Single-crystal X-ray diffraction (SCXRD)
Single-crystal X-ray diffraction (SCXRD) for structure determination of A was performed on a dual-source D8 Venture equipped with a Photon III detector at Institut Laue-Langevin (Grenoble, France). The data were collected using Cu-Kα radiation (1.54178 Å) at 300 K. The structure of A was solved and refined using the Bruker SHELXTL Software Package,27 to the space group P21/m by anisotropic full-matrix least-squares refinement on F2. All the atoms, except the H, were refined with an anisotropic model for the atomic displacement parameters. The H atoms were included at calculated positions and treated as riding atoms with isotropic thermal motion related to that of their parent atom. The crystal structure of B was determined by single crystal X-ray diffraction at 100 K. Data were collected using Mo-Kα radiation (0.71073 Å) in an Agilent Technologies Supernova diffractometer at the University of Basque Country (Leioa, Spain). The data reduction was performed with the CrysAlis PRO program.28 Data were corrected for Lorentz and polarization effects. The structure was solved by direct methods using the SIR92 program29 and refined by full matrix least-squares on F2 including all reflections (SHELXL97).30 All non-hydrogen atoms were refined with an anisotropic model for the atomic displacement parameters. H atoms were included at calculated positions and treated as riding atoms with isotropic thermal motion related to that of their parent atom. The final structural parameters and figures of merit for A and B are summarized in Table 1, and the positional parameters and the most relevant distances are given in the corresponding CIF files and in Tables S1 and S2.†| A | B | |
|---|---|---|
| Formula | C7H12Cl4FeNO | C7H13Cl4FeNO1.5 |
| D calc./g cm−3 | 1.683 | 1.750 |
| μ/mm−1 | 16.981 | 2.014 |
| Formula weight | 323.83 | 332.83 |
| Colour | Yellow | Yellow |
| Shape | Prism | Prism |
| T/K | 300(2) | 100(2) |
| Crystal system | Monoclinic | Monoclinic |
| Space group | P21/m | P21/m |
| a/Å | 6.4885(6) | 6.41310(10) |
| b/Å | 14.7897(14) | 14.5111(2) |
| c/Å | 13.3880(12) | 13.5715(2) |
| α/° | 90 | 90 |
| β/° | 97.518(3) | 90.4150(10) |
| γ/° | 90 | 90 |
| V/Å3 | 1273.7(2) | 1262.95(3) |
| Z | 4 | 4 |
| Z′ | 1 | 1 |
| Wavelength/Å | 1.54178 | 0.71073 |
| Radiation type | CuKa | MoKa |
| θ min/° | 3.330 | 2.055 |
| θ max/° | 70.449 | 27.311 |
| Measured Refls. | 17![[thin space (1/6-em)]](https://www.rsc.org/images/entities/char_2009.gif) 460 460 |
8624 |
| Indept Refls | 2503 | 2720 |
| Refls I ≥ 2s(I) | 2132 | 2515 |
| R int | 0.0802 | 0.0234 |
| Parameters | 136 | 156 |
| Restraints | 0 | 5 |
| Largest peak | 0.530 | 0.322 |
| Deepest hole | −0.399 | −0.280 |
| GooF | 1.300 | 1.052 |
| wR2 (all data) | 0.1773 | 0.0481 |
| wR2 | 0.1632 | 0.0467 |
| R 1 (all data) | 0.0655 | 0.0238 |
| R 1 | 0.0524 | 0.0213 |
Variable temperature synchrotron X-ray powder diffraction (SXPD)
The compound A was introduced into a 0.7 mm glass capillary and measured in transmission at an energy of 22 keV (0.56376 Å determined from a Si NIST-640d reference) using a microstrip Mythen-II detector (six modules, 1280 channels per module, 50 μm per channel, sample-to-detector distance 550 mm). Starting with the structural model derived from single crystal X-ray diffraction, the data obtained with synchrotron X-ray powder diffraction measurements of A at 100, 300 and 420 K were refined using the Rietveld procedure with the FullProf suite program.31 Moreover, patterns were collected every 30 s in a 10 K min−1 ramp from 100 to 420 K in heating and cooling mode, using an Oxford Cryo-systems Series 700, to follow the crystal structure evolution.Single-crystal neutron diffraction (SCND)
An accurate model including all atoms refined anisotropically was derived from single-crystal neutron diffraction data of compound A using the monochromatic four-circle diffractometer D19 at the Institute Laue-Langevin (ILL, Grenoble, France) at 13.0(2) K. An increase of intensity on top of the nuclear reflections was observed in the measurement collected at 2.0(2) K, suggesting the occurrence of a k = 0 propagation vector. The measurements were done on a single crystal with approximate dimensions of 4 × 2 × 2 mm3, which was mounted on a vanadium pin and placed on a close-circuit displex device. The wavelength used was 1.4557 Å, provided by a flat Cu monochromator using the 220 reflection, at 2θM = 69.91° take-off angle. The measurement strategy consisted of several omega (ω) scans with steps of 0.07° at different χ and φ positions.32 These omega scans cover either 79° or 64°, depending on the χ angle, in order to avoid collisions with the sample environment. The NOMAD software from ILL was used for data collection. The unit cell determination was done using PFIND and DIRAX programs, and the raw data were processed using RETREAT and RAFD19 programs.33 The absorption correction was applied using the D19ABS program.34 The structure was refined by full matrix least-squares on F2 including all reflections (SHELXL97).30 All atoms were refined anisotropically, including the hydrogen atoms, which were located by Fourier difference. All the calculations for these structures were performed using the WINGX crystallographic software package. Table S3† gathers the crystal data and structure refinement parameters at 13 K. The most relevant bond distances are given in Table S4.†Variable temperature neutron powder diffraction (NPD)
A high-flux powder neutron diffractometer D1B at ILL operating at λ = 2.525 Å was used to obtain the magnetic structure of A.35 The instrument was equipped with an “orange” helium cryostat reaching a base temperature of 1.5 K. The sample was sealed in a cylindrical vanadium container. Two high counting time neutron diffraction patterns were measured at 10 and 1.5 K in the angular range 1 ≤ 2θ ≤ 128°. The difference pattern (magnetically ordered – paramagnetic) was used to isolate the magnetic contribution. The quality of the collected data allowed us to solve and refine the magnetic structure, even considering that the TN was ca. 3.0 K.Dielectric measurements
The complex dielectric permittivity of a cold-press pelletized sample of A was measured as a function of frequency and temperature building a parallel-plate capacitor coupled to a Solartron1260A impedance/gain-phase analyzer, capable of measurement in the frequency range from 10 Hz up to 1 MHz, using an amplitude of 1 V. The capacitor was mounted in a refrigerated Janis SVT200T cryostat with a Lakeshore 332 incorporated to control the temperature from 295 K up to 390 K. The data were collected on heating and before carrying out the measurement, the pellets were maintained at each temperature for two minutes to achieve thermal equilibrium. The pelletized sample, with an area of approximately 13 mm2 and a thickness of approximately 1 mm, was prepared by cold-press to fit into the capacitor. Gold was sputtered on the surfaces of the pelletized sample to ensure good electrical contact. The dielectric measurements were carried out under a nitrogen atmosphere, performing several purging cycles with nitrogen gas to ensure that the sample chamber was completely free of atmospheric moisture.
Results and discussion
Structural characterization
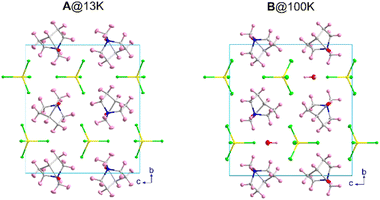
The crystal structure of A was solved by SCXRD at RT and refined including the light atoms using SCND data collected at 13 K. The compound B was solved and refined using SCXRD at 100 K. Compound A presents a monoclinic cell with the space group P21/m with cell parameters a = 6.4567(1) Å, b = 14.6111(2) Å, c = 13.1564(2) Å and β = 97.7818(8)° at 100 K, obtained from the Rietveld refinement of the synchrotron X-ray powder diffraction data.B presents an equivalent organic–inorganic framework but with the presence of crystallization water molecules, associated with the contact of A with the atmospheric humidity during the evaporation-crystallization process. The hydrate phase B remains in the P21/m monoclinic space group, with very similar cell parameters a = 6.4131(1) Å, b = 14.5111(2) Å, c = 13.5715(2) Å and β = 90.415(1)°, the main difference being the variation of more than 7° in the β angle. A comparison of the unit cell of both compounds is shown in Fig. 1. Along this section, we will describe the crystal structures of both compounds and we will compare them with those of the previously reported C and D compounds.As defined by convention, the highest temperature solid phase of A is denoted as phase I, whereas the lower temperature phases are denoted as II and III, the phase III being the magnetic phase, which will be discussed later on.
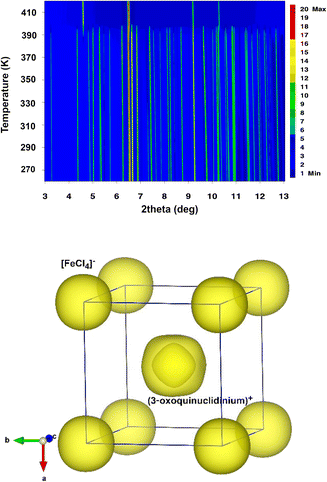
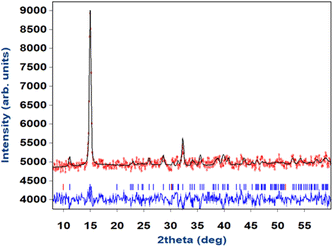
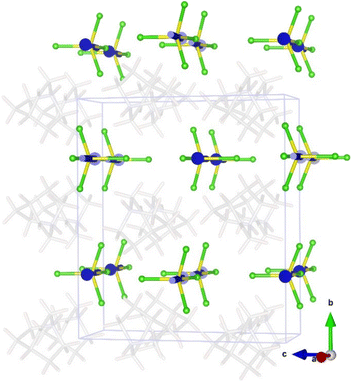
The temperature evolution of SXPD data (see Fig. 2 top) shows that A displays a plastic crystal behaviour (phase I) above 390 K, at similar temperatures to other quinuclidinium-based tetrachloroferrate compounds.19,25 As commented before, high symmetry space groups of organic cations in these hybrid materials often lead to the crystallization of centrosymmetric structures, mainly in cubic or hexagonal crystal systems in their plastic phases, associated with some rotational degrees of freedom depending on the size, shape and non-covalent interactions in the structure.36 In the current case, the synchrotron data can be indexed in the cubic Pm![[3 with combining macron]](https://www.rsc.org/images/entities/char_0033_0304.gif) m space group (see Fig. S1 in the ESI†), similarly to the structural models determined for C and D. In this model, the inorganic anions are located on the origin (0, 0, 0) and symmetry-related positions, and the cations are placed on the (0.5, 0.5, 0.5) position (see Fig. 2, bottom). Both cations and anions are highly disordered, which agrees with the isotropic character of the rotations described in other plastic phases.37 The cell parameters at 420 K are a = b = c = 7.04919(13) Å, V = 350.281(12) Å3, which are slightly smaller than those observed for C (a = b = c = 7.1022(3) Å, V = 350.281(12) Å3) and D (a = b = c = 7.0940(1) Å, V = 357.01(1) Å3) at a similar temperature. Compound B loses its crystallization water molecules before reaching the plastic phase, re-crystallizing back into compound A.
m space group (see Fig. S1 in the ESI†), similarly to the structural models determined for C and D. In this model, the inorganic anions are located on the origin (0, 0, 0) and symmetry-related positions, and the cations are placed on the (0.5, 0.5, 0.5) position (see Fig. 2, bottom). Both cations and anions are highly disordered, which agrees with the isotropic character of the rotations described in other plastic phases.37 The cell parameters at 420 K are a = b = c = 7.04919(13) Å, V = 350.281(12) Å3, which are slightly smaller than those observed for C (a = b = c = 7.1022(3) Å, V = 350.281(12) Å3) and D (a = b = c = 7.0940(1) Å, V = 357.01(1) Å3) at a similar temperature. Compound B loses its crystallization water molecules before reaching the plastic phase, re-crystallizing back into compound A.
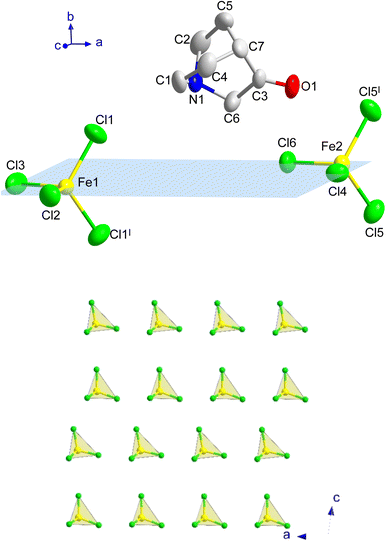
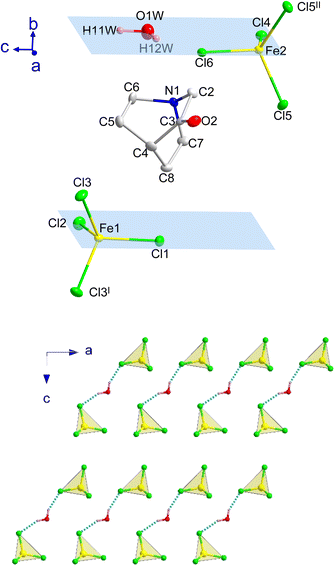
At 390 K a crystal-to-plastic crystal phase transition, from I to II, is detected, in agreement with the signal observed in the DSC and dielectric permittivity measurements (see below), which is stable down to 3 K. The crystal structure of II can be described in the centrosymmetric monoclinic space group P21/m. The SCXD data refined at 300 K display cell parameters a = 6.4885(6) Å, b = 14.7897(14) Å, c = 13.3880(12) Å and β = 97.518(3)°. The asymmetric unit consists of two half [FeCl4]− anions and one (3-oxoquinuclidinium)+ cation, where the iron atoms and two of the surrounding chloride ions lie in a mirror plane. The asymmetric unit and the atoms generated by the application of the mirror plane can be seen in Fig. 3.
The three-dimensional assembly of II can be described as a stacking of organic (3-oxoquinuclidinium)+ and inorganic [FeCl4]− layers extended in the ac-plane and pillared following an ABCD stacking sequence, A and C being the organic layers and B and D being those formed by the inorganic component, along the crystallographic b-axis (see Fig. 1, left). The organic layers are formed by chains extended along the a-axis involving a NH⋯O![[double bond, length as m-dash]](https://www.rsc.org/images/entities/char_e001.gif) C hydrogen bond (with an acceptor⋯donor distance of 2.121(4) Å and NH⋯O angle of 129.8(3)°, from the SCND refinement at 13 K). Electrostatic and van der Waals interactions take place between these parallel chains, resulting in the formation of the final ac-layer. The inorganic layers, which also run in the ac-plane, are built by two different [FeCl4]− units. The layers can be described as an assembly of zig-zag chains that run along the c-axis. These chains are formed by a sequence of Fe(1)Cl4 and Fe(2)Cl4, giving rise to two different Fe(1)⋯Fe(2) distances, 6.339(2) and 6.879(2) Å (see Fig. 3c). The inter-chain distance within the inorganic layer is 6.445(2) Å, corresponding to the dimension of the a component of the unit cell, and the shortest Fe⋯Fe interlayer distance is 7.5402(6) Å.
C hydrogen bond (with an acceptor⋯donor distance of 2.121(4) Å and NH⋯O angle of 129.8(3)°, from the SCND refinement at 13 K). Electrostatic and van der Waals interactions take place between these parallel chains, resulting in the formation of the final ac-layer. The inorganic layers, which also run in the ac-plane, are built by two different [FeCl4]− units. The layers can be described as an assembly of zig-zag chains that run along the c-axis. These chains are formed by a sequence of Fe(1)Cl4 and Fe(2)Cl4, giving rise to two different Fe(1)⋯Fe(2) distances, 6.339(2) and 6.879(2) Å (see Fig. 3c). The inter-chain distance within the inorganic layer is 6.445(2) Å, corresponding to the dimension of the a component of the unit cell, and the shortest Fe⋯Fe interlayer distance is 7.5402(6) Å.
Compound B also crystallizes in the centrosymmetric monoclinic space group P21/m, with the asymmetric unit consisting of two half [FeCl4]− anions, one (3-oxoquinuclidinium)+ cation and one crystallization water molecule (see Fig. 4). Like in compound A, each iron atom and two of the chloride ions of its environment are located in a mirror plane, as well as the water molecule. The tetrahedral environment of the FeCl4 units is completed with one crystallographically independent chloride and its symmetry related position, by the application of the I: x, 1/2 − y, z and II: x, 3/2 − y, z symmetry operations. The asymmetric unit is shown in Fig. 4, top, and symmetry operators have been applied to complete the fragment, for the sake of clarity.
The crystal structure of compound B can be described as the stacking of organic (3-oxoquinuclidinium)+ and inorganic [FeCl4]− layers, extended in the ac-plane and pillared along the crystallographic b-axis (see Fig. 1, right). As in the case of compound A, an ABCD stacking pattern is used to describe the pillaring of the organic and the inorganic layers. A and C are the layers formed by organic molecules, while B and D are those made of inorganic units. Two independent [FeCl4]− units and the crystallization water molecule build the inorganic layers. The layers can be described as a series of zig-zag chains that run along the c-axis. These chains, like in compound A, are made up of a sequence of Fe(1)Cl4 and Fe(2)Cl4 units, resulting in two distinct Fe(1)⋯Fe(2) distances, 6.5355(4) and 7.0518(4) Å, both being slightly larger than the values observed for compound A. However, the interchain distance, along the a-axis, is slightly shorter than in A, with a value of 6.4131(5) Å. It deserves to be noted that the crystallization water molecules are placed between each of these chains. Each hydrogen atom from the crystallisation water molecule forms a hydrogen bond with chlorine ions, which act as acceptors, to join two adjacent chains. The existence of these hydrogen bonds causes slight rotations and shifts in the [FeCl4]− units, altering the exchange coupling between the iron atoms, as well as the interlayer distance, the shortest one being 7.3442(1) Å, which is slightly shorter than the one observed for A.
The organic layers are formed by chains of (3-oxoquinuclidinium)+ connected among them via hydrogen bonds (NH⋯O), forming chains extended along the a-axis. The acceptor⋯donor distance is 2.139(19) Å with an NH⋯O angle of 132.5(15)°, values that are similar to those observed in compound A. These chains interact with the adjacent ones via electrostatic and van der Waals forces, forming the final ac-layer.
The crystal structure of A was studied in the low temperature region, at 13 K, using SCND and from 10 to 1.5 K using NPD, in D19 and D1B, respectively. It was found that phase II is maintained until 3 K, where there is an increase of intensity in a low-angle reflection, corresponding to the establishment of long-range magnetic order, which was confirmed by specific heat and magnetometry measurements (discussed below). A thorough description of the magnetic phase (III) can be found in the magnetic structure determination section. Furthermore, the evolution of the crystal parameters and cell volume of phase II was followed through pattern matching to the SXPD data from 260 to 390 K (Fig. S2†). All parameters follow an almost linear tendency, similarly to compound C, with a, b and c increasing with temperature, contrary to the β angle, which decreases. A summary of the different phases of A is provided in Table 2.
| 470 → 390 K | 390 → 3 K | 3 → 1.5 K |
|---|---|---|
| I | II | III |
Pm![[3 with combining macron]](https://www.rsc.org/images/entities/char_0033_0304.gif) m m |
P21/m | P21/m′ |
| Plastic phase | ||
| a 1 a 1 a 1 | a 2 b 2 c 2 β 2 | a 2 b 2 c 2 β 2 |
| Paramagnetic | Antiferromagnetic | |
Thermal analysis
The differential scanning calorimetry curves of A display a sharp endothermic peak upon heating from 150 K at ca. 390 K (Fig. 5 top), attributed to the plastic phase transition, which is located at a slightly lower temperature in cooling, at ca. 365 K.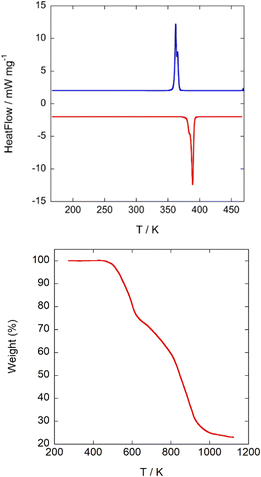 | ||
| Fig. 5 (Top) 2nd cycle DSC-thermogram of A. Blue: cooling; red: heating; heating rate 5 K min−1. (Bottom) TG curve measured under an inert atmosphere. | ||
Phase transitions at similar temperatures were detected in C (390/370 K upon heating/cooling) and D (370/355 K upon heating/cooling), respectively. It is reasonable to assume that a decrease in the symmetry of the globular counterion will lead to an increase of the rotational energy barrier and thus to plastic phases at higher temperatures. However, in this empiric rule we reject the influence of weak interactions among the constituents. For compounds A and D, the globular molecules 3-oxoquinuclidinium and (R)-(−)-3-hydroxyquinuclidium are quite similar (the first one has a = O group attached to the quinuclidinium cation, while, in the second case, it has a hydroxyl group). Nevertheless, there is a decrease of ca. 20 K in the transition to the plastic phase of D compared to A. The highly globular character of the (quinuclidinium)+ cation in C favours crystal packing optimization, giving in this compound a high thermal stability. A drastic change in the plastic phase temperature between A and D compounds is not expected considering only the local symmetry of both molecules. However, if we analyse the possible H-bonds, we can see that in A there is a NH⋯O![[double bond, length as m-dash]](https://www.rsc.org/images/entities/char_e001.gif) C bond, with a N⋯O distance of 2.89(2) Å, a H⋯O distance of 2.121(4) Å and a NH⋯O angle of 129.8(3)°, which connects the 3-oxoquinuclidinium molecules, forming chains along the a-direction. In compound D, the organic molecules are also forming chains extended along the a-direction through hydrogen bonds. The NH⋯O(hydroxyl) hydrogen bonds in D present an acceptor⋯donor distance of N⋯O: 3.28(2) Å; N–H⋯O: 2.46(3) Å, and NH⋯O angle of 137(1)°, which are remarkably longer than those observed on A, suggesting a weaker interaction among ((R)-(−)-3-hydroxyquinuclidium) molecules via hydrogen bonds. As a result, in order to reach the plastic phase, A must overcome a higher energy barrier than D. In the case of C, the (quinuclidinium)+ cation lacks H-bond acceptor groups, preventing these molecules from interacting strongly among them. This accounts for the great difference in latent heat in the transition to the plastic phase in compound A (−48.7/43.8 kJ kg−1 upon heating/cooling) compared to C (−15.0/3.2 kJ kg−1 upon heating/cooling) and D (−14.2/12.1 kJ kg−1 upon heating/cooling). The relatively large latent heat of A (∼48 kJ kg−1) suggests that this compound could be used as a material for storing and releasing thermal energy; however, the operational temperature range between 92 °C and 117 °C is too high for solar thermal energy storage for the domestic application.
C bond, with a N⋯O distance of 2.89(2) Å, a H⋯O distance of 2.121(4) Å and a NH⋯O angle of 129.8(3)°, which connects the 3-oxoquinuclidinium molecules, forming chains along the a-direction. In compound D, the organic molecules are also forming chains extended along the a-direction through hydrogen bonds. The NH⋯O(hydroxyl) hydrogen bonds in D present an acceptor⋯donor distance of N⋯O: 3.28(2) Å; N–H⋯O: 2.46(3) Å, and NH⋯O angle of 137(1)°, which are remarkably longer than those observed on A, suggesting a weaker interaction among ((R)-(−)-3-hydroxyquinuclidium) molecules via hydrogen bonds. As a result, in order to reach the plastic phase, A must overcome a higher energy barrier than D. In the case of C, the (quinuclidinium)+ cation lacks H-bond acceptor groups, preventing these molecules from interacting strongly among them. This accounts for the great difference in latent heat in the transition to the plastic phase in compound A (−48.7/43.8 kJ kg−1 upon heating/cooling) compared to C (−15.0/3.2 kJ kg−1 upon heating/cooling) and D (−14.2/12.1 kJ kg−1 upon heating/cooling). The relatively large latent heat of A (∼48 kJ kg−1) suggests that this compound could be used as a material for storing and releasing thermal energy; however, the operational temperature range between 92 °C and 117 °C is too high for solar thermal energy storage for the domestic application.
According to the Boltzmann equation, ΔS = R![[thin space (1/6-em)]](https://www.rsc.org/images/entities/char_2009.gif) ln
ln![[thin space (1/6-em)]](https://www.rsc.org/images/entities/char_2009.gif) N, where R is the gas constant, the entropy change (ΔS) can be used to calculate the number of geometrically distinguishable orientations (N). The entropy change in the heating process is approximately 40.22 Jmol−1 K−1, giving a N value of 126. This large N value supports the highly disordered model of the [FeCl4]− anions and (3-oxoquinuclidinium)+ cations observed in the plastic crystal phase. Finally, TGA curves show that the title compound starts to decompose at 450 K (Fig. 5bottom ) without forming a liquid phase.
N, where R is the gas constant, the entropy change (ΔS) can be used to calculate the number of geometrically distinguishable orientations (N). The entropy change in the heating process is approximately 40.22 Jmol−1 K−1, giving a N value of 126. This large N value supports the highly disordered model of the [FeCl4]− anions and (3-oxoquinuclidinium)+ cations observed in the plastic crystal phase. Finally, TGA curves show that the title compound starts to decompose at 450 K (Fig. 5bottom ) without forming a liquid phase.
Magnetic characterization
The magnetic properties of A and B compounds were determined over the temperature range 2–300 K at 1 kOe in zero field cooling (ZFC) and field cooling (FC) mode. The product of the magnetic susceptibility and the temperature (χmT) versus T is shown in Fig. 6, top. χm data can be fitted to the Curie–Weiss law, obtaining a Weiss constant θp(A) = −4.58(7) K and θp(B) = −0.62(3) K, indicating antiferromagnetic interactions, and an effective paramagnetic moment μeff(A) = 5.93(1) μB and μeff(B) = 5.81 (1) μB per Fe ion, which agree with the expected value for high spin d5 Fe(III) ions (μeff = 5.92 μB per Fe ion) and with those found for C and D. At room temperature, the χmT value of 4.34 and 4.21 emu K mol−1 Oe−1 of A and B, respectively, is also consistent with the expected one (4.38 emu K mol−1 Oe−1 for Fe(III) ions with a magnetic spin S = 5/2). This value starts to decrease at a higher temperature for A than for B, indicating stronger antiferromagnetic interactions in the former, in agreement with the higher |θp| of compound A. Moreover, below 3.5 K, the molar susceptibility of A (inset of Fig. 6, top) changes the tendency, with a reduction in the growth rate. As it will be discussed below in the specific heat and neutron diffraction sections, this change in tendency responds to an antiferromagnetic long-range ordering.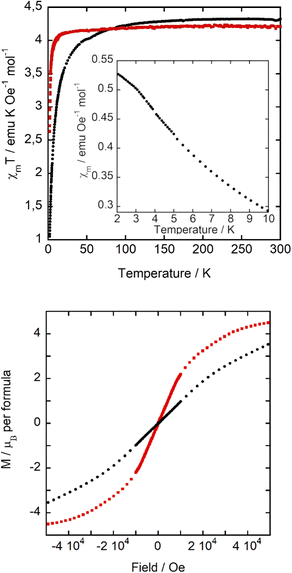 | ||
| Fig. 6 (Top) χmT versus T at 1 kOe, (inset) χmversus T at 1 kOe. (Bottom) Magnetization cycle at 2 K. Compound A: black dots, and B: red squares. | ||
Although the characteristic decrease in χm below the ordering temperature is not observed, the χm behaviour for compound A could be the result of the convolution of antiferromagnetic ordering with a small fraction of paramagnetic impurities. The temperature at which this trend variation occurs is similar to the χm maximum observed in compounds C and D, at ca. 3 and 4 K, respectively. This signal does not split with the effect of applied magnetic field (similarly to D), a characteristic of a ferromagnetic component in its magnetic structure, as observed in C. In contrast, B displays a paramagnetic behaviour in the whole temperature range studied. A possible explanation of the decrease of Weiss constant and loss of three-dimensional ordering in B is related to the change of orientations of the [FeCl4]− units due to the occurrence of FeCl⋯HOH⋯ClFe hydrogen bonds, which slightly modifies the Fe⋯Fe distances, as previously discussed. In hybrid organic–inorganic compounds based on halometallate ions, the super-exchange magnetic interactions are mainly located between the iron metal complex ions bridged by halide–halide interactions. However, other weak interactions, such as CH/CH2⋯halide, OH⋯halide, and halide⋯π⋯halide, as well as dipolar interactions, can play an important role in these systems where there are no direct exchange coupling paths.
In order to study the response of the magnetization to the applied magnetic field, we measured the M(H) curves of A and B within ±50 kOe at 2 K (Fig. 6, bottom). The magnetization at 50 kOe is 3.53 μB for A, which does not show saturation, and 4.49 μB for B, which is not far from the expected value for high spin d5 Fe(III) (5 μB). These results indicate that the antiferromagnetic interactions of A are stronger than in B, as it takes a higher magnetic field to align them ferromagnetically. Once more, this is in agreement with the more negative Weiss temperature for A and the trend change in the molar magnetic susceptibility at about 3.5 K. Finally, the absence of any hysteresis loop rules out the existence of any weak ferromagnetic component.
Specific heat capacity characterization
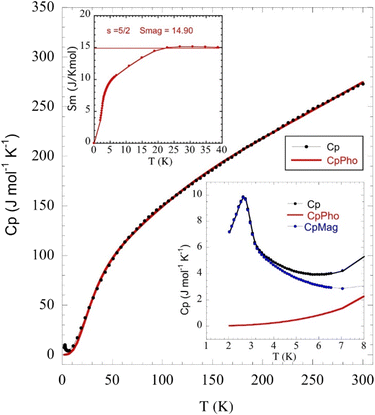
The temperature dependence of the molar heat capacity (CP) at zero magnetic field is presented in Fig. 7, showing a broad maximum (ΔCP = 9.8 J mol−1 K−1) centred at 2.8 K. This peak does not display the typical λ-shape appearance of a second-order transition, but can be related to the establishment of a 3D antiferromagnetic order, in good agreement with the anomaly observed in the magnetic susceptibility and corroborated by neutron diffraction data (see below). Above 80 K, CP increases continuously as a result of the phonon contribution, with CP = 279 J mol−1 K−1 at RT still far from the expected value according to the Dulong and Petit law (624 J mol−1 K−1). This behaviour is mainly attributed to the presence of many hydrogen atoms within the bicyclic quinuclidinium cation (C7H13N)+, which display very high excitation energies. The phonon contribution (Cpho) was determined to extract the magnetic contribution (Cmag) from the specific heat data (Cp) using the Debye model38 and considering three Debye temperatures:39 a lower one (θ1) related to heavy atoms such as Fe and Cl (n1), an intermediate one (θ2) linked to C and N atoms (n2), and a higher one (θ3) associated with H atoms (n3). The best fit to the experimental data from 15 to 300 K is obtained for θ1 =138.7 K, θ2 = 631.2 K, θ3 = 2406.2 K, n1 = 5.3, n2 = 4.6, and n3 = 15.1 atoms. The magnetic entropy variation calculated as is shown in the inset of Fig. 7. This parameter increases with temperature, reaching a value of 15 J K−1 mol−1 around 20 K, which agrees with the calculated magnetic entropy based on the degenerate freedom of S = 5/2, S = R
![[thin space (1/6-em)]](https://www.rsc.org/images/entities/char_2009.gif) ln
ln![[thin space (1/6-em)]](https://www.rsc.org/images/entities/char_2009.gif) (2S + 1) = 14.90 J K−1 mol−1, where R is the gas constant. This result endorses the presence of a long-range antiferromagnetic order below 3 K with a high-spin state for the Fe3+ ions (S = 5/2). Finally, CP measurements were performed under an external field of 50 kOe (Fig. S3 in the ESI†). The maximum peak shifts to lower temperatures (2.1 K), as expected for a long-range antiferromagnetically ordered system.
(2S + 1) = 14.90 J K−1 mol−1, where R is the gas constant. This result endorses the presence of a long-range antiferromagnetic order below 3 K with a high-spin state for the Fe3+ ions (S = 5/2). Finally, CP measurements were performed under an external field of 50 kOe (Fig. S3 in the ESI†). The maximum peak shifts to lower temperatures (2.1 K), as expected for a long-range antiferromagnetically ordered system.
Magnetic structure determination
Powder diffraction patterns from 10 to 1.5 K were collected on a high-flux medium-resolution D1B diffractometer (ILL, Grenoble), operated with a wavelength of λ = 2.52 Å, to solve the magnetic structure of A_III. The main feature between the pattern collected at 10 K and the one collected at 1.5 K is an increase in intensity of the (0 1 1) Bragg reflection, as well as the appearance of a small peak at ca. 32° in the low temperature pattern (see Fig. 8).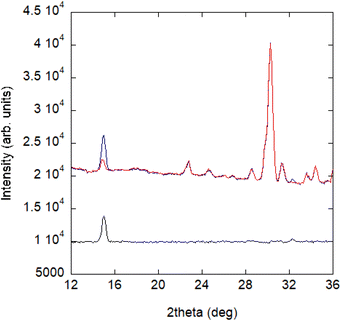 | ||
| Fig. 8 NPD patterns collected at the D1B diffractometer for compound A at 1.5 K (blue) and 10 K (red) and the difference pattern between 1.5 and 10 K (black). | ||
This phenomenon appears at a similar temperature to the anomaly observed in the magnetic susceptibility measurements and can be correlated with the signal observed at ca. 3 K in the specific heat data (see Fig. 7). Consequently, it can be concluded that the intensity increase of the low angle peak at 1.5 K has a magnetic origin and, therefore, provides direct evidence of the existence of long-range magnetic ordering in A.
The difference pattern between 1.5 and 10 K was indexed using the k-search program included in the FullProf suite.31 The best solution corresponds to a magnetic propagation vector k = (0, 0, 0), as expected, as the main magnetic contribution lies on top of the (0 1 1) nuclear reflection. Symmetry analysis was done employing the Bilbao Crystallographic Server (BSC) k-Subgroupsmag utility. Four possible maximal magnetic space groups are compatible with the crystal structure refined at 13 K. P21/m and  Shubnikov space groups do not fit properly the experimental data and can therefore be discarded. The
  Shubnikov space group fits slightly better the experimental data, giving rise to a magnetic structure with the magnetic moments antiferromagnetically coupled along the b-axis and the magnetic moments on the ac-plane being strictly zero by symmetry considerations. However, this model overestimates the magnetic signal on several reflections: (1 0 1), (1 1-1) and (1 1 1) and, thus, it can be discarded too. The last maximal space group corresponds to the P21/m′ Shubnikov space group. As in the parent structure, there are two independent Fe(III) sites, both in the 2e Wyckoff position, and therefore, the magnetic moment of both irons is restricted to be located in the ac-plane, m = (mx, 0, mz). The model does not apply any other restrain to the magnetic moment orientation; therefore, it should be derived from the data fit (see Fig. 9). Based on the susceptibility measurements, the magnetic structure is expected to be antiferromagnetic, so we forced the magnetic moments of each site to have the same value but opposite directions. With this approach, we noted that the main component of the magnetic moment was along the a-axis, with a small component along the c-direction. The refinement was not accurate enough to provide a realistic value of this last component; thus, it was fixed to zero, which is reasonable considering the experimental error in this direction. The value of the magnetic moment obtained from the fit to the difference pattern collected in D1B was 4.00(3) μB for both iron sites, which is slightly low compared to the expected value for a Fe3+ (S = 5/2). This difference can be explained by the proximity between the acquisition temperature (ca. 1.5 K) and the Néel temperature (ca. 3 K), with the magnetic moments probably not completely saturated at 1.5 K.
The magnetic structure of A (phase III) can be described as ferromagnetic layers extended along the ab-plane, which are antiferromagnetically coupled with the adjacent layers (see Fig. 10). The role of the organic cation in the efficiency of the transmission of the magnetic coupling was analysed from the comparison of the magnetostructural correlations with C and D compounds; at 13 K, the shortest Fe⋯Fe distance in A is located inside the layers, forming zig-zag iron chains along the c-direction, with a value of 6.340(2) Å. For C and D, the shortest Fe⋯Fe distance at 10 K is 6.350(3) and 6.323(18) Å, respectively. Along the a-direction, the distance is slightly larger, 6.445(1) Å, forming the ac-plane described in the structural section. The shortest Fe⋯Fe distance between adjacent layers is 7.527(2) Å, whereas for C and D, they are 7.444(2) and 7.346(3) Å, respectively.
The long-range magnetic order in this system is due to the competition of different weak interactions. At present, it is not clear whether there is a dominant magnetic interaction that gives rise to long-range ordering in these systems. However, due to the spin delocalization observed in the [FeCl4]− units,40 one of the most plausible interactions is via Fe–Cl⋯Cl–Fe. The shortest Fe–Cl⋯Cl–Fe distance is located inside the ac-layers, formed in A by Fe(1)–Cl⋯Cl–Fe(2) = 3.700(2) Å, (TA) = 0.0(2)°, a value which is very similar to the shortest interlayer distance, corresponding to a Fe(1)–Cl⋯Cl–Fe(1), with a value of 3.699(6) Å, (TA) = 180(1)°. For C, the shortest exchange couplings within the inorganic layers, extended in the ab-plane, are 3.727(3) Å; (TA) = 162.4(2)° and 3.871(2) Å; (TA) = 127.7(2)°, while the shortest interlayer distance along the c-axis is 3.844(2) Å; (TA) = 173.0(1)°. Although the distances in both compounds are quite similar, in compound C the tetrahedral units present a packing showing well oriented sigma-holes between adjacent units along the b-axis. This might account for the higher order temperature of C compared to A. In the case of D, the inorganic layers are extended along the ab-plane, being the shortest distance along the a-axis, with a value of 3.7052(6) Å; (TA) = 150.255(6)°. In the case of compound C, the tetrahedral units present a packing showing well oriented sigma-holes between adjacent units but, in this case, along the a- and b-directions. When compared to compound A, larger values of the order-temperature are also found. Although the results are quite comparable to those of compound C, the main characteristic of compound D is the broadening of the susceptibility maximum, denoting a predominant two-dimensional behaviour of its magnetic structure, which is built from ferromagnetic layers coupled antiferromagnetically along the c-axis.
In these systems the magnetic ions are not connected among them via direct-exchange or even through super-exchange interactions; moreover considering that for compounds A to D the Cl⋯Cl distances are longer than the standard van der Waals radius, we can rule out the orbital overlap, even with a non-negligible spin delocalization from iron to chlorine. As a result, none of these interactions alone could account for the observed long-range magnetic order. To achieve magnetically ordered phases, a careful balance of very weak interactions is required, such as super-exchange interactions, through the existence of π–d and Cl⋯CH interactions, or the occurrence of a sigma-hole configuration, as well as the effect of dipolar interactions, among others. Therefore, it is not clear that this type of interaction plays the principal role in these compounds. However, those compounds with a well oriented sigma-hole configuration present higher order temperatures and drive ferromagnetic interactions along the sigma-hole direction.
Dielectric properties
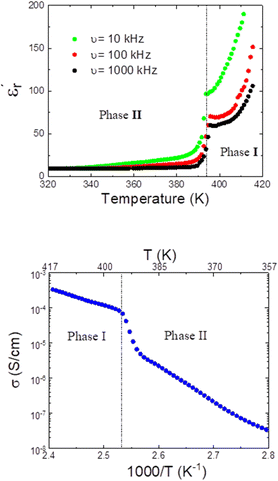
The complex dielectric permittivity of a polycrystalline pellet of A was measured as a function of the temperature and frequency. Fig. 11(top) shows the temperature dependence of the real part of the complex dielectric permittivity at different frequencies. The data show a dielectric anomaly at the
  vs. T associated with the phase transition observed by DSC at ca. 390 K, corresponding to the structural phase transition from I to II. At higher temperatures, the permittivity abruptly increases, reaching a maximum near 200 at 420 K (measured at 10 kHz). This value is considerably lower than that obtained for C at the same temperature (104) but higher than that of D (circa. 120 at 50 kHz). In all cases, this increase in the dielectric permittivity can be attributed to ionic self-diffusion in the plastic crystal phase. For A, the nature of this anomaly cannot be ferroelectricity, as phases I and II correspond to centrosymmetric space groups and, therefore, a net ferroelectric component is forbidden by symmetry.
For compounds A, C and D, an increase of the measurement frequency produces a remarkable decrease of the dielectric permittivity, without showing a shift in temperature with the frequency, discarding the occurrence of the relaxation process.  abruptly increases when the temperature approaches the plastic phase transition. This increase of signal is observed in all frequencies and it is due to the ability of the polar molecules to, first, liberate and, later, in the plastic phase, rotate. Consequently, there is an increase in the degrees of freedom of ionic species related to the phase transition, which accounts for the sharp permittivity increase at the phase transition.
Additionally, the permittivity exhibits a strong frequency dependence, decreasing with increasing frequency. This response is due to the long-range movement of migrating charges. The accumulation of these charges that cannot be freely discharged or replaced at the sample electrodes increases the overall capacitance of the material, resulting in an increase of the permittivity signal. This effect is more pronounced at low frequencies because the charges have time to accumulate at the borders of the conducting regions.
In this context, as we show in Fig. 11 (bottom), the conductivity of compound A experiences a large increase, almost by two orders of magnitude, above the phase transition temperature. It is also worth noting that the conductivity of both phases II and I follows the Arrhenius law and the activation energies could be calculated to be Ea (phase II) = 0.83 eV and Ea (phase I) = 0.41 eV from the linear relationship of log σ versus 1000/T. The lower conductivity of the phase II is attributed to the restricted ionic movement in an ordered crystalline phase. In contrast, the relatively high conductivity of the phase I seems to indicate a substantial degree of self-diffusion of the ionic species within this plastic phase. We suggest that a long-range diffusion of protons seems to be favoured in the disordered phase, as previously reported for other ionic plastic crystal materials.41
Conclusions
In summary, we synthesized a novel hybrid organic–inorganic material based on tetrachloroferrate(−1) ions containing a bicyclic amine: (3-oxoquinuclidinium)[FeCl4] (compound A). The experimental results show that this compound presents a series of structural phase transitions, involving both structural and magnetic transitions, which were determined using single crystal neutron and X-ray, synchrotron and neutron powder diffraction combined with magnetization and dielectric measurements.Moreover, we report the effect of the crystallization processes at room temperature of this compound, which allows for the crystallization of a hydrate phase, (3-oxoquinuclidinium)[FeCl4]·H2O (compound B). Although the organic–inorganic layered structure is similar to that of A, the magnetic behaviours of both compounds are quite different. Compound A presents a long-range magnetic order with a TN of 3.0 K, while compound B does not show 3D magnetic ordering down to 2 K, suggesting that subtle changes in the inorganic layers are enough to drastically change the magnetic behaviour. This finding highlight the importance of the weak interactions, not only super-exchange interaction, as are the hydrogen bonds and Fe–halide⋯halide–Fe interactions, but also other weak interactions such as dipolar, halide⋯CH or sigma-hole interactions, the latter being intimately linked to the electron density and, therefore, could play a direct role in the magnetic exchange coupling. Hence, even though the rational design of these materials is still far from being fully under control, the importance of these weak interactions should not be understated, as even minor modifications can have a significant impact on their physico-chemical properties.
Finally, the obtained experimental results were used to analyse the effect of the spherical ion symmetry breaking of the bicycle quinuclidine molecule, by adding a substituent group to the third position. The selection of a carboxyl group as a substituent, forming a ketone molecule, has a double purpose: it is intended to reduce the molecular symmetry as well as induce a dipole moment. The highly directional character of the N–H⋯O![[double bond, length as m-dash]](https://www.rsc.org/images/entities/char_e001.gif) C hydrogen-bond gives rise to organic chains, which are essential to facilitate the generation of electric polarization. In our situation, the polarization produced by a single chain is balanced between the neighbouring chains because of the crystallization in a centrosymmetric space group. Furthermore, the presence of a carboxyl group with a strong hydrogen acceptor character may be linked to the significant increase in conductivity during the plastic phase transition. The free rotation of the constituents may facilitate the transfer of protons among adjacent molecules. This behaviour could be explained by the Grotthuss mechanism, but given the plastic character of A, we cannot rule out the possibility that molecular diffusion, in addition to the Grotthuss mechanism, is also involved.
C hydrogen-bond gives rise to organic chains, which are essential to facilitate the generation of electric polarization. In our situation, the polarization produced by a single chain is balanced between the neighbouring chains because of the crystallization in a centrosymmetric space group. Furthermore, the presence of a carboxyl group with a strong hydrogen acceptor character may be linked to the significant increase in conductivity during the plastic phase transition. The free rotation of the constituents may facilitate the transfer of protons among adjacent molecules. This behaviour could be explained by the Grotthuss mechanism, but given the plastic character of A, we cannot rule out the possibility that molecular diffusion, in addition to the Grotthuss mechanism, is also involved.
The structure and the magnetic behaviour of A and B were compared with those obtained for the parent quinuclidinium[FeCl4] compound (C) and with ((R)-(−)-3-hydroxyquinuclidium)[FeCl4] (D), which introduces homochirality into organic molecules, forcing it to crystallize in non-centrosymmetric space groups.
Although both strategies have given rise to compounds with plastic transitions at high temperature, from the point of view of ferroelectricity, the increase in polarization due to the attachment of carboxyl groups in the organic molecule, which also favour highly directional bond bridges, is not sufficient to obtain plastic systems combining long-range magnetic order with a net polarization. However, the addition of chiral centres into the organic ligands, as in D, gives rise to crystallization in non-centrosymmetric space groups. Therefore, combining the two approaches may be an appropriate strategy to produce new multiferroic plastic compounds.
Author contributions
P. G. I. synthesized the samples. P. G. I., I. dP., O. F. and O. V. measured and analysed the synchrotron X-ray data. O. F. and G. B. measured and analysed the single crystal X-ray data, and L. C. D., P. G. I., O. F. and M. T. F. D. measured and analysed the single crystal and powder neutron diffraction data. I. dP. and J. R. F. carried out the specific heat measurements. P. G. I., I. dP. and G. B. measured and interpreted the DSC and T. G. M. S. A. was in charge of the dielectric spectroscopy measurements. O. F. and I. dP. conceptualized the project and wrote the paper, with input from all other authors.Conflicts of interest
There are no conflicts to declare.Acknowledgements
Financial support from Universidad de Cantabria (Proyecto Puente convocatoria 2018 funded by SODERCAN_FEDER), Universidad del País Vasco/Euskal Herriko Unibertsitatea (GIU17/50 and PPG17/37) and Ministerio de Economia y Competividad (MAT2017-89239-C2-(1,2)-P, MAT2017-83631-C3-3-R and MAT2017-86453-R) is acknowledged. The authors gratefully acknowledge technical and human support provided by SGIKer (UPV/EHU, MINECO, GV/EJ, ERDF, and ESF). The paper is (partly) based on the results of experiments carried out at the ALBA Synchrotron Light Source in Barcelona and Institute Laue-Langevin (ILL) in Grenoble (Proposals 5-31-2673 and 5-12-358).References
- J. Li, Y. Zhu, P. Z. Huang, D. W. Fu, Q. Q. Jia and H. F. Lu, Chem. – Eur. J., 2022, e202201005 Search PubMed; X. Xiao, J. Zhou, K. Song, J. Zhao, Y. Zhou, P. N. Rudd, Y. Han, J. Li and J. Huang, Nat. Commun., 2021, 12, 1–6 CrossRef CAS PubMed.
- T. Vijayakanth, D. J. Liptrot, E. Gazit, R. Boomishankar and C. R. Bowen, Adv. Funct. Mater., 2022, 32, 2109492 CrossRef CAS.
- P. Nandi, D. Topwal, N. G. Park and H. Shin, J. Phys. D: Appl. Phys., 2020, 53, 493002 CrossRef CAS.
- A. O. Polyakov, A. H. Arkenbout, J. Baas, G. R. Blake, A. Meetsma, A. Caretta, P. H. M. van Loosdrecht and T. M. Palstra, Chem. Mater., 2012, 24, 133–139 CrossRef CAS.
- Y. Ma and Y. Sun, J. Appl. Phys., 2020, 127, 080901 CrossRef CAS.
- (a) L. W. Martin and A. M. Rappe, Nat. Rev. Mater., 2016, 2, 1–14 Search PubMed; (b) A. Fernandez, M. Acharya, H. G. Lee, J. Schimpf, Y. Jiang, D. Lou, Z. Tian and L. W. Martin, Adv. Mater., 2022, 2108841 CrossRef CAS PubMed.
- D. Bain, S. Maity and A. Patra, Phys. Chem. Chem. Phys., 2019, 21, 5863–5881 RSC; E. Coronado, J. R. Galan-Mascaros, C. J. Gomez-Garcia and V. Laukhin, Nature, 2000, 408, 447–449 CrossRef CAS PubMed; D. Gebauer and S. E. Wolf, J. Am. Chem. Soc., 2019, 141, 4490–4504 CrossRef PubMed; R. Gao, M. S. Kodaimati and D. Yan, Chem. Soc. Rev., 2021, 50, 5564–5589 RSC.
- M. Mohammadi, M. Khodamorady, B. Tahmasbi, K. Bahrami and A. Ghorbani-Choghamarani, J. Ind. Eng. Chem., 2021, 97, 1–78 CrossRef CAS; A. Augustin, C. Chuaicham, M. Shanmugam, B. Vellaichamy, S. Rajendran, T. K. Hoang, K. Sasaki and K. Sekar, Nanoscale Adv., 2022, 4, 2561–2582 RSC.
- Q. Wang, M. Unno and H. Liu, ACS Sustainable Chem. Eng., 2022, 10(22), 7309–7320 CrossRef CAS; M. Catauro, Y. D'Errico, A. D'Angelo, R. J. Clarke and I. Blanco, Appl. Sci., 2021, 11, 9311 CrossRef.
- J. Timmermans, J. Phys. Chem. Solids, 1961, 18, 1–8 CrossRef CAS.
- Z. H. Wei, Z. T. Jiang, X. X. Zhang, M. L. Li, Y. Y. Tang, X. G. Chen, H. Cai and R. G. Xiong, J. Am. Chem. Soc., 2020, 14, 1995–2000 CrossRef PubMed.
- H. Y. Zhang, Y. Y. Tang, P. P. Shi and R. G. Xiong, Acc. Chem. Res., 2019, 52(7), 1928–1938 CrossRef CAS PubMed.
- P. P. Shi, S. Q. Lu, X. J. Song, X. G. Chen, W. Q. Liao, P. F. Li, Y. Y. Tang and R. G. Xiong, J. Am. Chem. Soc., 2019, 141(45), 18334–18340 CrossRef CAS PubMed; H. Y. Zhang, X. J. Song, X. G. Chen, Z. X. Zhang, Y. M. You, Y. Y. Tang and R. G. Xiong, J. Am. Chem. Soc., 2020, 142(10), 4925–4931 CrossRef PubMed.
- X. G. Chen, X. J. Song, Z. X. Zhang, H. Y. Zhang, Q. Pan, J. Yao, Y. M. You and R. G. Xiong, J. Am. Chem. Soc., 2020, 142(22), 10212–10218 CrossRef CAS PubMed; T. T. Sha, Y. A. Xiong, Q. Pan, X. G. Chen, X. J. Song, J. Yao, S. R. Miao, Z. Y. Jing, Z. J. Feng, Y. M. You and R. G. Xiong, Adv. Mater., 2019, 31(30), 1901843 CrossRef PubMed.
- H. Liu, H. Y. Zhang, X.-G. Chen and C. Xiong, J. Am. Chem. Soc., 2020, 142, 15205–15218 CrossRef CAS PubMed.
- C. K. Yang, W. N. Chen, Y. T. Ding, J. Wang, Y. Rao, W. Q. Liao, Y. Xie, W. Zou and R. G. Xiong, J. Am. Chem. Soc., 2019, 141, 1781–1787 CrossRef CAS PubMed.
- P. P. Shi, Y. Y. Tang, P. F. Li, W. Q. Liao, Z. X. Wang, Q. Ye and R. G. Xiong, Chem. Soc. Rev., 2016, 45, 3811–3827 RSC.
- D. W. Fu, J. H. Gao, W. H. He, X. Q. Huang, Y. H. Liu and Y. Ai, Am. Ethnol., 2020, 132, 17630–17634 Search PubMed.
- P. González-Izquierdo, O. Fabelo, L. Cañadillas-Delgado, G. Beobide, O. Vallcorba, J. Salgado-Beceiro, J. E. Garcia, M. Sanchéz-Andujar, M. T. Fermandez Diaz and I. de Pedro, J. Mater. Chem. C, 2021, 9, 4453–4465 RSC.
- H. Ye, W. H. Hu, W. J. Xu, Y. Zeng, X. X. Chem, R. K. Huang and X. M. Chen, APL Mater., 2021, 9, 031102 CrossRef CAS.
- T. Mochida, M. Ishida, T. Tominaga, K. Takahashi, T. Sakurai and H. Ohta, Phys. Chem. Chem. Phys., 2018, 20, 3019 RSC; H. Kimata and T. Mochida, J. Organomet. Chem., 2019, 895, 23–27 CrossRef CAS.
- M. H. Phana and S. C. Yu, J. Magn. Magn. Mater., 2007, 308, 325–340 CrossRef CAS; M. Wang, L. He, S. Zorba and Y. Yin, Nano Lett., 2014, 14, 3966–3971 CrossRef PubMed; S. Das, S. Saha, M. Sahu, A. Mondal and C. M. Reddy, Angew. Chem., Int. Ed., 2022, 61, e202115359 Search PubMed; R. Masuda, Y. Kaneko, Y. Tokura and Y. Takahashi, Science, 2021, 372, 496–500 CrossRef PubMed.
- J. Salgado-Beceiro, S. Castro-García, M. Sánchez-Andújar and F. Rivadulla, J. Phys. Chem. C, 2018, 122, 27769–27774 CrossRef CAS; J. Harada, N. Yoneyama, S. Yokokura, Y. Takahashi, A. Miura, N. Kitamura and T. Inabe, J. Am. Chem. Soc., 2018, 140(1), 346–354 CrossRef PubMed.
- I. de Pedro, A. García-Saiz, J. González, I. R. De Larramendi, T. Rojo, C. A. Afonso, P. Svielen, P. Simeonov, J. C. Waerenborgh, J. A. Blanco, B. Ramajo and J. R. Fernández, Phys. Chem. Chem. Phys., 2013, 15, 12724–12733 RSC.
- P. González-Izquierdo, O. Fabelo, L. Canadillas-Delgado, G. Beobide, O. Vallcorba, M. Sanchéz-Andújar, M. T. Fermandez-Diaz and I. de Pedro, J. Mater. Chem. C, 2020, 8, 11389–11398 RSC.
- J. Salgado-Beceiro, J. M. Bermúdez-García, A. L. Llamas-Saiz, S. Castro-García, M. A. Señarís-Rodríguez, F. Rivadulla and M. Sánchez-Andújar, J. Mater. Chem. C, 2020, 8(39), 13686–13694 RSC.
- Bruker, SHELXTL Software Version 6.14, Bruker Analytical X-Ray System, Inc., Madison, WI, USA, 2003 Search PubMed.
- Agilent, CrysAlis PRO Agilent Technologies Ltd, Yarnton, England, 2010 Search PubMed.
- A. Altomare, G. Cascarano, C. Giacovazzo and A. Guagliardi, J. Appl. Crystallogr., 1993, 26, 343–350 CrossRef.
- G. M. Sheldrick, Acta Crystallogr., Sect. A: Found. Crystallogr., 2008, 64, 112–122 CrossRef CAS PubMed.
- J. Rodríguez-Carvajal, Phys. Rev. B: Condens. Matter Mater. Phys., 1993, 192, 55–69 CrossRef.
- P. González-Izquierdo, C. Belloso-Cassuso, M. T. Fernández-Díaz, O. Fabelo, I. de Pedro and L. Cañadillas-Delgado, Crystal structure determination at low temperature of a new polymorphous organic-inorganic halometallate compound:(3-Quinuclidone)[FeCl4], Institut Laue-Langevin (ILL), Grenoble, 2021, DOI:10.5291/ILL-DATA.5-12-358.
- A. J. M. Duisenberg, J. Appl. Crystallogr., 1992, 25, 92–96 CrossRef CAS; G. J. McIntyre and R. F. D. Stansfield, Acta Crystallogr., Sect. A: Found. Crystallogr., 1988, 44, 257–262 CrossRef; C. Wilkinson, H. W. Khamis, R. F. D. Stansfield and G. J. McIntyre, J. Appl. Crystallogr., 1988, 21, 471–478 CrossRef.
- J. C. Matthewman, P. Thompson and P. J. Brown, J. Appl. Crystallogr., 1982, 15, 167–173 CrossRef CAS.
- P. Gonzalez-Izquierdo, G. Beobide, I. de Pedro, O. Fabelo and M. T. Fernández-Díaz, Crystal and Magnetic structure study in 3 novel tetrahaloferrate compounds based on bicycle amines with a long-range magnetic ordering, Institut Laue-Langevin (ILL), 2019, DOI:10.5291/ILL-DATA.5-31-2673.
- L. Jin, K. M. Nairn, C. J. Forsyth, J. A. Seeber, D. R. MacFarlane, P. C. Howlett, M. Forsyth and J. M. Pringle, J. Am. Chem. Soc., 2012, 134, 9688–9697 CrossRef CAS PubMed.
- J. Harada, T. Shimojo, H. Oyamaguchi, H. Hasegawa, Y. Takahashi, K. Satomi, Y. Suzuki, J. Kawamata and T. Inabe, Nat. Chem., 2016, 8, 946–952 CrossRef CAS PubMed; S. Horiuchi and Y. Tokura, Nat. Mater., 2008, 7, 357–366 CrossRef PubMed.
- P. Debye, Ann. Phys., 1912, 344, 789–839 CrossRef.
- I. de Pedro, J. M. Rojo, J. Rodriguez Fernández, M. T. Fernandez-Diaz and T. Rojo, Phys. Rev. B: Condens. Matter Mater. Phys., 2010, 81, 134431 CrossRef.
- A. García-Saiz, I. de Pedro, P. Migowski, O. Vallcorba, J. Junquera, J. A. Blanco, O. Fabelo, D. Sheptyakov, J. C. Waerenborgh, M. T. Fernández-Díaz, J. Rius, J. Dupont, J. Antonio Gonzalez and J. Rodríguez Fernández, Inorg. Chem., 2014, 53(16), 8384–8396 CrossRef PubMed.
- S. Horike, D. Umeyama, M. Inukai, T. Itakura and S. Kitagawa, J. Am. Chem. Soc., 2012, 134(18), 7612–7615 CrossRef CAS PubMed.
Footnotes |
| † Electronic supplementary information (ESI) available: Detail of the Rietveld refinement at 420 K, evolution of the volume and cell parameters of compound A from 260 to 390 K, specific heat measurement under an external magnetic field, relevant crystallographic data and bond-distances for compound A and B, at 300 K, 100 K and 13 K. CCDC The crystallographic and structural parameters in the form of CIF file for A and B have been deposited in the Cambridge Crystallographic Data Center with the deposition numbers: 2219644–2219646. For ESI and crystallographic data in CIF or other electronic format see DOI: https://doi.org/10.1039/d2ce01549h |
| ‡ Present address: CEA, LETI, MINATE Campus, F-38054, Grenoble, France. |
| This journal is © The Royal Society of Chemistry 2023 |

