High-performance Zn-ion batteries constructed by in situ conversion of surface-oxidized vanadium nitride into Zn3(OH)2V2O7·2H2O with oxygen defects†
Di
Li
,
Ningze
Gao
,
Rui
Sheng
,
Feng
Li
,
Lei
Wang
 ,
Yuanxiang
Gu
 * and
Yanhui
Sun

College of Environment and Safety Engineering, Qingdao University of Science and Technology, Qingdao 266042, China. E-mail: gyx0524@126.com
First published on 5th December 2022
Abstract
Herein, surface-oxidized vanadium nitride (O-VN) is synthesized by a one-step hydrothermal method without multi-step reactions, and is applied as a cathode material for aqueous zinc ion batteries. After in situ electrochemical activation, it turns into Zn3(OH)2V2O7·2H2O with copious oxygen vacancies/defects. The electrochemical phase transition and in situ defect induction can provide abundant active sites for the storage of Zn2+, thus increasing the energy storage performance of electrode materials. As expected, Zn3(OH)2V2O7·2H2O with oxygen defects has good structural and morphological stability during cycling, and exhibits excellent specific capacity (510 mA h g−1 at 0.1 A g−1 and 199 mA h g−1 at 10 A g−1) and superior cycle stability (72.6% capacity retention after 3000 cycles at 20 A g−1).
1. Introduction
There is a critical need for safe energy materials to replace lithium-ion batteries because of inconvenient installation, toxic electrolytes, and safety problems of lithium itself.1,2 Aqueous zinc ion batteries (AZIBs) have been a recent research hotspot because of their low cost, environmental friendliness, and excellent safety of aqueous electrolytes, which can make up for the shortcomings of lithium-ion batteries.3–5 Cathode materials have a critical effect on the electrochemical properties of AZIBs. Therefore, a variety of materials have been explored to serve as cathodes for AZIBs, including manganese-based oxides,5,6 vanadium-based oxides,7–9 Prussian blue analogs,10,11 and so on. However, there is still a lack of suitable cathode materials with superior electrochemical properties, which greatly restricts the commercial application of AZIBs. Therefore, it is necessary to develop a new cathode material with excellent properties. Due to its excellent performance, vanadium nitride (VN) has been reported in supercapacitors, lithium-ion batteries, lithium–sulfur batteries, and sodium-ion batteries.12–14 Recently, VN materials have also been confirmed as promising AZIB cathode materials with high electron conductivity, high theoretical capacity and high cycling stability.15,16 In particular, oxygen signals can usually be detected in VN in many related studies. The presence of oxygen in VN will significantly promote the reaction kinetics and improve its electrochemical activity.17,18 However, VN materials in previous studies were prepared by complex synthesis steps combined with calcination treatment under N2/NH3 or NH3 atmospheres. Therefore, it is urgent to explore a simple synthesis method to construct VN nanomaterials for AZIBs. On the other hand, the electrochemical reaction mechanism of the VN materials for AZIBs needs further investigation.In the report, the O-VN nanoparticles were directly synthesized using ammonium metavanadate and thiourea as raw materials by a simple one-step hydrothermal method. The obtained O-VN material was used as a cathode material, and its electrochemical properties were investigated. The obtained O-VN in our work cannot directly serve as a cathode material during the cycling process. However, the O-VN nanoparticles can turn into Zn3(OH)2V2O7·2H2O with abundant oxygen vacancies/defects (labelled Ov-ZVOH). Defect engineering is considered an alternative strategy to improve electrochemical performance by regulating energy band modification and accelerating the reaction kinetics.19–21 Therefore, the transformation of O-VN into ZVOH and the introduction of abundant oxygen vacancies/defects are expected to improve the electrochemical performance. As expected, the electrochemical results showed that the electrochemical performance of the electrode material was significantly improved after electrochemical activation. It has an outstanding specific capacity of 510 mA h g−1 at the current density of 0.1 A g−1, and a specific capacity of 199 mA h g−1 can be obtained at a high current density of 10.0 A g−1. It also shows excellent cycling stability with a maximum capacity retention of 72.6%, even at a high current density of 20.0 A g−1 after 3000 cycles. This is the first report on a simple one-step hydrothermal synthesis of O-VN and its transformation into Ov-ZVOH as a cathode material for AZIBs. This work provides new insights into the straightforward synthesis of O-VN cathode materials for AZIBs and the study of defects introduced by the in situ electrochemical phase evolution.
2. Experimental
2.1 Preparation of O-VN nanoparticles
In a typical hydrothermal process, 2 mmol ammonium metavanadate (NH4VO3) was dissolved in 75 mL of deionized water and stirred for 10 min to obtain a clear yellowish solution at room temperature. And then, 100 mmol thiourea (CH4N2S) was slowly added to the above NH4VO3 solution. The obtained mixture was stirred for 1 h to obtain a uniform light yellow solution. Subsequently, the above solution was transferred into a 100 ml stainless steel autoclave and treated at 180 °C for 24 h. The black precipitate was washed with distilled water and ethanol several times after being cooled to room temperature and then freeze-dried for 15 h.2.2 Material characterization
The crystal structure of cathode materials was investigated using a Bruker D8 diffractometer with Cu Kα radiation (λ = 1.5418 Å). The morphology of materials was characterized using a JSM-7800F type scanning electron microscope. Transmission electron microscopy (TEM) analysis and high-resolution TEM (HRTEM) were conducted using a JEOL JEM-2010F transmission electron microscope. An ESCALAB 250 spectrometer (Perkin-Elmer) with monochromatic Al Ka sources was applied to obtain X-ray photoelectron spectra (XPS). Raman spectrum measurement was performed using a Renishaw RM-1000 laser Raman microscopy system. A Shimadzu-8400S spectrometer using KBr pellets was applied to obtain Fourier transform infrared (FT-IR) spectra.2.3 Electrochemical characterization
The synthesized material, acetylene black and polyvinylidene fluoride (PVDF) were mixed in a ratio of 7![[thin space (1/6-em)]](https://www.rsc.org/images/entities/char_2009.gif) :
:![[thin space (1/6-em)]](https://www.rsc.org/images/entities/char_2009.gif) 2
2![[thin space (1/6-em)]](https://www.rsc.org/images/entities/char_2009.gif) :
:![[thin space (1/6-em)]](https://www.rsc.org/images/entities/char_2009.gif) 1, and the slurry was milled using N-methyl pyrrolidone (NMP) as the solvent and coated on titanium foil. And then, the electrode was dried at 80 °C for 12 h in a vacuum oven. A stainless steel button battery (CR2032) was assembled using zinc foil as a counter/reference electrode, glass fiber filter paper as a separator, and 3 M Zn(CF3SO3)2 solution as an electrolyte. The mass loading of the active material was around 1.5–2.0 mg cm−2. Cyclic voltammetry (CV) and the galvanostatic intermittent titration technique (GITT) measurement were carried out using a CHI760E electrochemical workstation (Shanghai Chenhua Instrument Co., China). The electrochemical performance of the coin battery was measured with a multi-channel battery test system (Land Electronic Co., Ltd, Wuhan, China) in the potential range of 0.2–1.6 V at room temperature.
1, and the slurry was milled using N-methyl pyrrolidone (NMP) as the solvent and coated on titanium foil. And then, the electrode was dried at 80 °C for 12 h in a vacuum oven. A stainless steel button battery (CR2032) was assembled using zinc foil as a counter/reference electrode, glass fiber filter paper as a separator, and 3 M Zn(CF3SO3)2 solution as an electrolyte. The mass loading of the active material was around 1.5–2.0 mg cm−2. Cyclic voltammetry (CV) and the galvanostatic intermittent titration technique (GITT) measurement were carried out using a CHI760E electrochemical workstation (Shanghai Chenhua Instrument Co., China). The electrochemical performance of the coin battery was measured with a multi-channel battery test system (Land Electronic Co., Ltd, Wuhan, China) in the potential range of 0.2–1.6 V at room temperature.
3. Results and discussion
3.1 Morphology and microstructure of the O-VN material
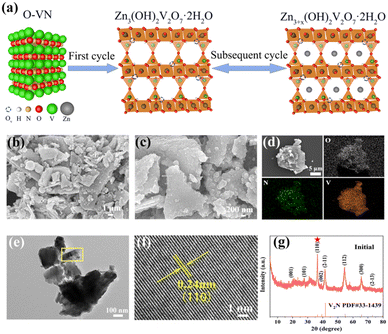
The schematic structure of the conversion of O-VN to ZVOH by electrochemical activation is shown in Fig. 1a. The SEM images of O-VN are shown in Fig. 1b and c. It can be seen that the sample is some sheet-like nanoparticles. The EDS elemental mapping in Fig. 1d shows that V, N, and O elements have uniform distribution throughout the sample. Moreover, the EDS spectrum (Fig. S1†) demonstrates that the molar ratio of N![[thin space (1/6-em)]](https://www.rsc.org/images/entities/char_2009.gif) :
:![[thin space (1/6-em)]](https://www.rsc.org/images/entities/char_2009.gif) V
V![[thin space (1/6-em)]](https://www.rsc.org/images/entities/char_2009.gif) :
:![[thin space (1/6-em)]](https://www.rsc.org/images/entities/char_2009.gif) O is ca. 1
O is ca. 1![[thin space (1/6-em)]](https://www.rsc.org/images/entities/char_2009.gif) :
:![[thin space (1/6-em)]](https://www.rsc.org/images/entities/char_2009.gif) 3
3![[thin space (1/6-em)]](https://www.rsc.org/images/entities/char_2009.gif) :
:![[thin space (1/6-em)]](https://www.rsc.org/images/entities/char_2009.gif) 6. Such a high O content proves that vanadium nitride is oxidized. The HRTEM image of O-VN shown in Fig. 1f indicates a clear lattice fringe with an interspacing of 0.24 nm, which is consistent with the (110) crystal plane of V2N. The X-ray diffraction (XRD) pattern in Fig. 1g shows that all the reflection peaks belong to V2N (JCPDS No. 33-1439), which displays that the inlay of oxygen atoms in the VN lattice cannot change its structure. It's worth noting that the intensity of the (110) peak is stronger than that of the (2−11) peak, which contradicts the reported data (JCPDS No. 33-1439). The strong (110) peak should suggest a strong oriented growth process of sheet-like V2N nanoparticles with large-scale (110) crystallographic planes exposed. A similar phenomenon can be found in the previous literature.22,23 Raman spectrum analysis was performed to further investigate the structural information of the O-VN material and the Raman spectrum is shown in Fig. S2.† It can be seen that the VN vibration modes are scarce. The typical Raman peaks of O-VN can be found around 139 (O–V–O), 286 (V
6. Such a high O content proves that vanadium nitride is oxidized. The HRTEM image of O-VN shown in Fig. 1f indicates a clear lattice fringe with an interspacing of 0.24 nm, which is consistent with the (110) crystal plane of V2N. The X-ray diffraction (XRD) pattern in Fig. 1g shows that all the reflection peaks belong to V2N (JCPDS No. 33-1439), which displays that the inlay of oxygen atoms in the VN lattice cannot change its structure. It's worth noting that the intensity of the (110) peak is stronger than that of the (2−11) peak, which contradicts the reported data (JCPDS No. 33-1439). The strong (110) peak should suggest a strong oriented growth process of sheet-like V2N nanoparticles with large-scale (110) crystallographic planes exposed. A similar phenomenon can be found in the previous literature.22,23 Raman spectrum analysis was performed to further investigate the structural information of the O-VN material and the Raman spectrum is shown in Fig. S2.† It can be seen that the VN vibration modes are scarce. The typical Raman peaks of O-VN can be found around 139 (O–V–O), 286 (V![[double bond, length as m-dash]](https://www.rsc.org/images/entities/char_e001.gif) O), 408 (V
O), 408 (V![[double bond, length as m-dash]](https://www.rsc.org/images/entities/char_e001.gif) O), 523 (V–O–V), 686 (V–O) and 990 (V
O), 523 (V–O–V), 686 (V–O) and 990 (V![[double bond, length as m-dash]](https://www.rsc.org/images/entities/char_e001.gif) O) cm−1, which correspond to the stretching and bending modes of vanadium and oxygen. These phenomena indicate the formation of the oxide layer over the surface of O-VN. The absence of Raman peaks of VN may be due to the stronger affinity of oxide than that of vanadium.24,25
O) cm−1, which correspond to the stretching and bending modes of vanadium and oxygen. These phenomena indicate the formation of the oxide layer over the surface of O-VN. The absence of Raman peaks of VN may be due to the stronger affinity of oxide than that of vanadium.24,25
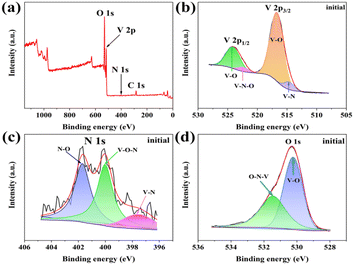
X-ray photoelectron spectroscopy (XPS) analysis is further used to investigate the valence state and surface chemical compositions. The full XPS spectrum of O-VN is shown in Fig. 2a, which shows the existence of V, N, and O elements, in agreement with the result of the EDS elemental mapping. Fig. 2b shows the XPS spectrum of V 2p, and the surface structure analysis of the V 2p region (514.7, 516.7, 522.4, and 524.1 eV) supports the existence of a mixed-valence state of V3+/V4+ and V4+.23,26 Furthermore, the weak V 2p1/2 peak located at 522.4 eV can be associated with the formation of the V–N–O bonds, which represents the presence of O-VN.27,28Fig. 2c shows the XPS spectrum of N 1s. Three N element states can be found on the surface of O-VN particles. The energy band at 397.5 eV is the location where the metal nitride is present, while the other peak centered at 401.7 eV is assigned to the V–N–O bond of O-VN.29,30 In the O 1s spectrum in Fig. 2d, two O states can be seen on the surface of the VN particle. The peak at 530.3 eV is mainly from the V–O bond, and the other one at 531.4 eV is attributed to V–N–O.31,32
3.2 Electrochemical performance of the O-VN cathode material
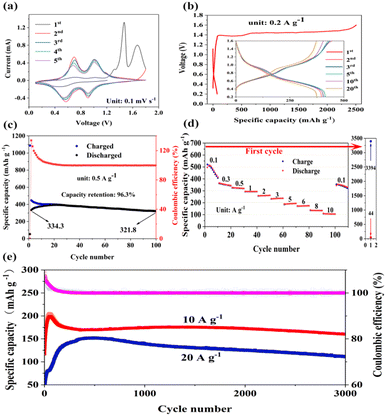
To assess the electrochemical performance of the O-VN material, the cathode was measured by cyclic voltammetry in the voltage range of 0.1–1.8 V at a scan rate of 0.1 mV s−1, and the first five CV curves are shown in Fig. 3a. The CV curve of the first cycle obviously differs from the subsequent cycles, suggesting an irreversible electrochemical reaction of the O-VN material during the Zn-ion insertion and extraction process. After the first scan, two redox peaks can be found in the CV curves, suggesting that the O-VN material experiences a multistep Zn2+ ion intercalation mechanism. During subsequent cycling, two redox peaks retain a similar shape, demonstrating good structural stability and high electrochemical reversibility of the electrode. A similar conclusion can be obtained from the galvanostatic charge–discharge profiles. The charge–discharge curves at a low current density of 0.2 A g−1 are shown in Fig. 3b, and there is a noticeable difference between the charge–discharge curve of the first cycle and those of the subsequent cycles. The O-VN cathode displays a discharge capacity of 73 mA h g−1 with negligible voltage plateaus in the first cycle. However, there are two extra-long voltage plateaus at 1.39 V and 1.45 V in the first charging process, in accordance with the results of the CV curves. The O-VN cathode exhibits an ultrahigh charging capacity of 2506 mA h g−1, which may be attributed to an electrochemical activation during the initial charging process. The cycling performance at a low current density of 0.5 A g−1 is shown in Fig. 3c. After the initial activation process, the electrode material has a charge capacity of 447 mA h g−1 and a discharge capacity of 334 mA h g−1 in the second cycle. After 100 cycles, there is still a specific capacity of 321 mA h g−1 with 100% coulomb efficiency. The rate capability of the O-VN electrode is evaluated at different current densities and given in Fig. 3d. After the first activation process at a low current density of 0.1 A g−1, the O-VN cathode material exhibits superior rate ability with specific capacities of 510, 366, 326, 294, 258, 233, 189, 173, 139, and 110 mA h g−1 at the current densities of 0.1, 0.3, 0.5, 1, 2, 3, 5, 6, 8, and 10 A g−1, respectively. When the current density returns to 0.1 A g−1, a high specific capacity of 344 mA h g−1 is still kept.To further verify the electrochemical stability of the O-VN material, its long cycle performance is tested at the high current densities of 10 and 20 A g−1 (Fig. 3e). At the current density of 10.0 A g−1, the O-VN electrode exhibits a maximum discharge capacity of 198 mA h g−1. After 3000 cycles, a high reversible capacity of 160 mA h g−1 can be kept, delivering a maximum capacity retention rate of 80.8%. Even at the higher current density of 20.0 A g−1, the O-VN electrode exhibits an activated maximum discharge capacity of 152 mA h g−1. After 3000 cycles, the electrode displays a high reversible capacity of 108 mA h g−1 with a maximum capacity retention of 72.6%. Compared with previously reported ZVOH electrode materials prepared by direct synthesis or in situ electrochemical transformations,33–37 Ov-ZVOH exhibits excellent performance, indicating that the prepared material in our report can be a promising cathode for AZIBs.
3.3 Kinetic properties of the O-VN cathode material
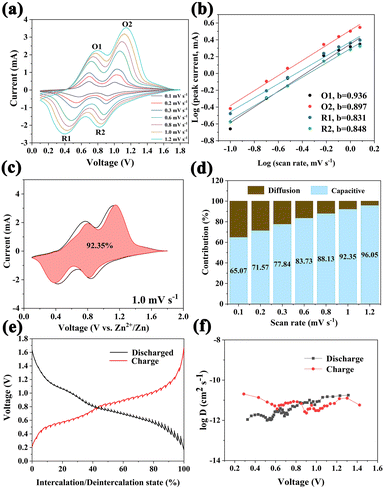
To further study the insertion/extraction performance of Zn2+, the electrochemical reaction kinetics was analyzed using the quantitative calculation of CV curves with different scan rates. Fig. 4a shows the CV curves of the O-VN material at different scanning rates in the range from 0.1 to 1.2 mV s−1. Capacitance and diffusion contributions can be assessed by calculating the b value based on the formula: i = avb, which can be expressed as: log(i) = b![[thin space (1/6-em)]](https://www.rsc.org/images/entities/char_2009.gif) log(v) + log(a). In the equation, a and b are adjustable parameters and b can change between 0.5 and 1.38,39 The b value is close to 0.5, indicating that the electrochemical process is mainly controlled by ion diffusion. In contrast, when the b value is close to 1, it indicates that the electrochemical process is controlled by pseudocapacitance.40,41Fig. 4b shows that the b values are 0.936, 0.897, 0.831, and 0.848, respectively, which indicate that the Zn2+ storage of the cathode material is mainly controlled by pseudocapacitance. The diffusion control and capacitance contribution can be quantitatively calculated by the following equation: i = k1v + k2v1/2, where i represents the current response, and k1v and k2v1/2 represent the capacitance contribution and ion diffusion contribution, respectively.42,43 At the scan rate of 1.0 mV s−1, the pseudocapacitance is about 92.35% of the capacity (Fig. 4c). The pseudocapacitance contribution at different scanning rates is shown in Fig. 4d. It can be seen that the capacitive contribution ratio of the cathode material gradually increased from 65.07% to 96.05% along with the increase of the scan rate. The high capacitive contribution should thank the oxygen deficiency, which ensures fast ion transport in the electrode material, resulting in excellent electrochemical performance.44,45 The galvanostatic intermittent titration technique (GITT) is used to understand the kinetics of the O-VN electrode. Fig. 4e shows the GITT curves at a current density of 0.03 A g−1. The zinc ion diffusion coefficient (DZn) of the O-VN electrode (shown in Fig. 4f) is in the range from 10−10 to 10−12 cm2 s−1, which indicates that Zn2+ has a highly reversible storage mechanism and a fast migration rate.
log(v) + log(a). In the equation, a and b are adjustable parameters and b can change between 0.5 and 1.38,39 The b value is close to 0.5, indicating that the electrochemical process is mainly controlled by ion diffusion. In contrast, when the b value is close to 1, it indicates that the electrochemical process is controlled by pseudocapacitance.40,41Fig. 4b shows that the b values are 0.936, 0.897, 0.831, and 0.848, respectively, which indicate that the Zn2+ storage of the cathode material is mainly controlled by pseudocapacitance. The diffusion control and capacitance contribution can be quantitatively calculated by the following equation: i = k1v + k2v1/2, where i represents the current response, and k1v and k2v1/2 represent the capacitance contribution and ion diffusion contribution, respectively.42,43 At the scan rate of 1.0 mV s−1, the pseudocapacitance is about 92.35% of the capacity (Fig. 4c). The pseudocapacitance contribution at different scanning rates is shown in Fig. 4d. It can be seen that the capacitive contribution ratio of the cathode material gradually increased from 65.07% to 96.05% along with the increase of the scan rate. The high capacitive contribution should thank the oxygen deficiency, which ensures fast ion transport in the electrode material, resulting in excellent electrochemical performance.44,45 The galvanostatic intermittent titration technique (GITT) is used to understand the kinetics of the O-VN electrode. Fig. 4e shows the GITT curves at a current density of 0.03 A g−1. The zinc ion diffusion coefficient (DZn) of the O-VN electrode (shown in Fig. 4f) is in the range from 10−10 to 10−12 cm2 s−1, which indicates that Zn2+ has a highly reversible storage mechanism and a fast migration rate.
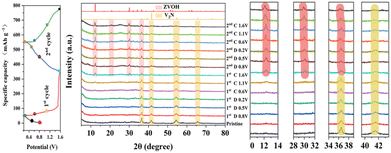
XRD, SEM, HRTEM, and XPS were carried out to clarify the excellent cycle performance of the O-VN electrode material and structural evolution mechanism during the charge–discharge process. Fig. 5 shows the XRD patterns of the O-VN electrodes at different charge–discharge states during the first cycle. During the first discharged state, no significant new peaks can be observed, and all the characteristic peaks are still attributed to V2N, which gradually decrease along with the discharging and charging reaction. When the initial charge reaches 1.6 V, the characteristic peaks of the V2N decrease significantly. At the same time, two new peaks located at 12.2° and 29.9° appear, which are assigned to Zn3(OH)2V2O7·2H2O (JCPDS No. 50-0570). At the second cycling charged to 1.6 V, these two peaks assigned to Zn3(OH)2V2O7·2H2O become further stronger, indicating the continuous transformation of the V2N material into Ov-ZVOH. The XRD results of the electrodes in the 50 and 100 cycles are given in Fig. S3,† and the characteristic peak of V2N has completely disappeared and the produced Ov-ZVOH samples as the main cathode materials maintain good phase stability after continuous charging and discharging reactions. SEM images of the electrode material after cycling were also used to investigate the morphological evolution during the cycling process and are shown in Fig. S4.† The electrode material is still irregular nanoparticles after the first cycle. However, these irregular nanoparticles significantly become smaller and more uniform than the pristine O-VN material. More SEM results indicate that the morphology of the electrode materials is well preserved and does not significantly change even after 100 cycles.
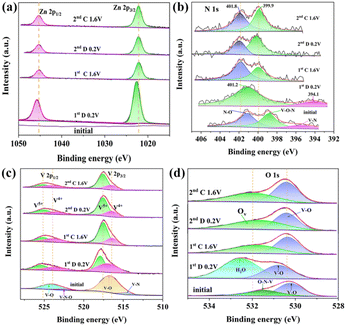
Additionally, XPS analysis was performed to study the chemical states of Zn, N, V, and O in the electrode material. As shown in Fig. 6a, the pristine cathode does not show the signal of Zn. However, two peaks at 1022.5 eV and 1045.3 eV corresponding to Zn 2p1/2 and Zn 2p3/2 can be observed in the fully discharged state (0.2 V), meaning that Zn2+ intercalates into the lattice of the cathode material. After the first cycle, although the release of Zn2+ makes the intensity of Zn 2p decrease, the characteristic peak of Zn 2p still exists due to the formation of Ov-ZVOH. The N 1s spectra are also given in Fig. 6b to investigate the chemical state of the nitrogen element. During the first cycle, the binding energy of the V–O–N and V–N bonds gradually weakens and finally disappears completely. However, two new peaks appear at 401.8 and 399.9 eV, which can be ascribed to ammonia/ammonium species, indicating that the NH4+ ions may exist in the electrode.46,47 During the second cycling process, the two peaks no longer significantly change. The FTIR spectra (Fig. S5†) also confirm the presence of NH4+ on the surface of the electrode during the cycling process. V 2p spectra at various stages are shown in Fig. 6c to identify the chemical state change of the V element during the cycling process. After being discharged to 0.2 V for the first time, the V 2p spectrum is different from that of the precycled electrode materials. The V3+ peak of O-VN is wholly invisible and the high-valence V peaks become prominent. The V 2p3/2 peaks shifting to 516.4 eV and 517.9 eV prove the existence of V4+ and V5+, further indicating a change in the phase structure during electrochemical cycling.48 When the first charge reaches 1.6 V, the intensity of V5+ increases further due to the oxidation of the electrodes. During the second cycle, the position of the V 2p peaks does not significantly change, which indicates that the phase transition mainly occurs in the first cycle. The XPS spectrum of O 1 s during the charge and discharge process is also displayed in Fig. 6d. At the fully discharged state, a new strong peak can be observed at 532.5 eV, which is attributed to the presence of H2O. When the first cycling charged to 1.6 V, the peak at 531.8 eV attributed to oxygen vacancies obviously increases, which indicates the formation of more oxygen defects in the ZVOH cathode after the first cycling.49–51 The existence of oxygen defects in the activated cathode is further proved by the electron paramagnetic resonance (EPR) spectrum of the activated cathode after the first cycle and is shown in Fig. 7a. There is a clear symmetric signal at g = 1.925, indicating the presence of a large number of oxygen vacancies. The HRTEM image of the electrode material after the first full charge further confirms the existence of oxygen defects in the activated cathode. From Fig. 7b, the perfect (110) planes can be clearly observed on the left side of the HRTEM image. However, obvious defects can also be found on the (110) planes on the right side of the HRTEM image. It is considered that it is easier for zinc ions to enter the interlayer between the (110) planes of O-VN compared to other planes. The formation of Ov-ZVOH is attributed to the insertion of Zn2+ into the electrode, which forms stable ZnO6 octahedra by hydrogen bonding with O atoms during the discharge process with VO2 units.52,53 As a result, after the zinc ion is released during the charging process, vanadium atoms are also readily released from the structure with an increase of defective oxygen. The HRTEM image after 2 cycles displays the presence of more obvious defects. The oxygen defects will greatly reduce the energy for the electron transport and charge transfer during the redox reaction, thus improving electrochemical reactivity and reaction kinetics. The superior conductivity and fast electron transfer can be proved by electrochemical impedance spectroscopy (EIS) shown in Fig. S6.† After the first phase transition, the activated cathode material has an obviously lower electrochemical impedance than the original cathode material. Even after 100 cycles, the impedance is still smaller than that of the original cathode material, indicating that the activated electrode has more excellent conductivity, which is related to the oxygen defects in the activated ZVOH. Therefore, oxygen defects endow the electrode material with superior electrochemical performance. Abundant oxygen defects in the electrode can accelerate the transmission of electrons/ions and increase the conductivity. On the other hand, oxygen vacancies/defects make the active cathode gradually exposed to the electrolyte, providing more active sites for the intercalation/deintercalation of Zn2+, and gradually increasing the specific capacity of the electrode.54,55 In addition, the NH4+ cations in the interlayer space coming from the VN material can act as strong “pillars” to stabilize the whole structure and then preserve high reversibility in the Zn2+ insertion/extraction process, thereby improving the electrochemical performance.56,57 During the cycle process, the existence of H2O should play an important role in the electrochemical transformation of electrode materials. Therefore, 0.5 M Zn(CF3SO3)2 solution was prepared using isopropanol as the solvent and the electrochemical properties of the O-VN cathode were characterized using Zn(CF3SO3)2/isopropanol solution as the electrolyte. It can be seen that there are no redox peaks in the CV curve (Fig. S7a†) of the battery and the charge–discharge curve (Fig. S7b†) also has no obvious charging and discharging platform. It is clear that due to H2O, the O-VN electrode has a co-insertion/extraction mechanism of H+ and Zn2+ in the host materials, resulting in excellent electrochemical performance. Combined with the results of XRD, XPS and HRTEM of the electrode after cycling, the activation process can be formulated as below:58,59
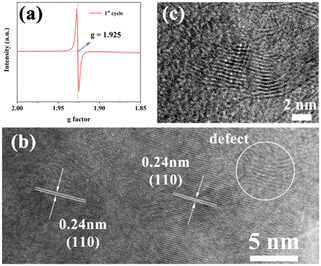 | ||
| Fig. 7 EPR spectrum (a) and the HRTEM images of the O-VN electrode after the first cycle (b) and second cycle (c). | ||
First cycling
| VN + 2H+ + H2O → VO2+ + NH4+ + e− |
| VO2+ + H2O → VO2+ + 2H+ + e− |
| 2VO2+ + 3Zn2+ + 7H2O → Zn3(OH)2V2O7·2H2O + 8H+ |
| Zn3(OH)2V2O7·2H2O + xZn2+ + 2xe− ↔ Zn3+x(OH)2V2O7·2H2O |
4. Conclusions
In summary, a simple one-step hydrothermal method is used to prepare O-VN nanoparticles, which are utilized as a cathode material for high-performance AZIBs. The O-VN cathode undergoes in situ electrochemical conversion in the first cycle, forming a ZVOH-based active cathode with oxygen vacancies/defects. Because there are many vacancies/defects and the NH4+ cations coming from the VN material act as strong “pillars” to stabilize the material structure, the ZVOH-based cathode with favorable kinetics for zinc storage affords both high specific capacity and superior long-term stability during cycling. At the current density of 0.1 A g−1, it can register a high reversible discharge capacity of 510 mA h g−1. At a high current density of 10.0 A g−1, it still delivers a high discharge capacity of 160 mA h g−1 with a maximum capacity retention of 80.8% after 3000 cycles. Even at a higher current density of 20 A g−1, it has a discharge specific capacity of 152 mA h g−1 with a maximum capacity retention of 72.6% after 3000 cycles. Therefore, the Ov-ZVOH active material is a promising candidate for high-performance energy-storage devices. We believe that such an approach to constructing vacancies/defects can be extended to designing a large family of disordered or vacancy-enriched electrode materials for zinc-ion batteries and other multivalent-ion batteries.Author contributions
The manuscript was written through contributions of all the authors. All the authors have given approval to the final version of the manuscript. Di Li managed the experiments and wrote the main manuscript. Ningze Gao managed the experiments and processed the data. Rui Sheng, Feng Li and Yanhui Sun performed the data analyses. Yuanxiang Gu reviewed and edited the manuscript. Lei Wang provided financial support and edited the manuscript.Conflicts of interest
There are no conflicts to declare.Acknowledgements
This work was supported by the National Natural Science Foundation of China (21875126) and the Shandong Provincial Natural Science Foundation (ZR2021MB039).References
- Y. He, P. Zhang, H. Huang, X. Li, X. Zhai, B. Chen and Z. Guo, ACS Appl. Energy Mater., 2020, 3, 3863–3875 CrossRef CAS.
- L. Fan and Z. Li, J. Alloys Compd., 2022, 910, 164872 CrossRef CAS.
- L. Shi, C. Jia, X. Zhang, S. Liang, Y. Fu, Z. Chen, X. Liu, F. Wan and L. Zhang, ACS Sustainable Chem. Eng., 2022, 10, 2441–2449 CrossRef CAS.
- Y. Liu, Q. Li, K. Ma, G. Yang and C. Wang, ACS Nano, 2019, 13, 12081–12089 CrossRef CAS.
- Y. Zhao, P. Zhang, J. Liang, X. Xia, L. Ren, L. Song, W. Liu and X. Sun, Energy Storage Mater., 2022, 47, 424–433 CrossRef.
- H. Tang, W. Chen, N. Li, Z. Hu, L. Xiao, Y. Xie, L. Xi, L. Ni and Y. Zhu, Energy Storage Mater., 2022, 48, 335–343 CrossRef.
- Y. Liu, Y. Zou, M. Guo, Z. Hui and L. Zhao, Chem. Eng. J., 2022, 433, 133528 CrossRef CAS.
- W. G. Kidanu, J. Hur, H. W. Choi, M. I. Kim and I. T. Kim, J. Power Sources, 2022, 523, 231060 CrossRef CAS.
- X. Wang, Z. Zhang, M. Huang, J. Feng, S. Xiong and B. Xi, Nano Lett., 2022, 22, 119–127 CrossRef CAS PubMed.
- Y. Zeng, X. F. Lu, S. L. Zhang, D. Luan, S. Li and X. W. D. Lou, Angew. Chem., Int. Ed., 2021, 60, 22189–22194 CrossRef CAS PubMed.
- W. Deng, Z. Li, Y. Ye, Z. Zhou, Y. Li, M. Zhang, X. Yuan, J. Hu, W. Zhao, Z. Huang, C. Li, H. Chen, J. Zheng and R. Li, Adv. Energy Mater., 2021, 11, 2003639 CrossRef CAS.
- Z. Hou, K. Guo, H. Li and T. Zhai, CrystEngComm, 2016, 18, 3040–3047 RSC.
- R. Saroha, J. H. Oh, Y. H. Seon, Y. C. Kang, J. S. Lee, D. W. Jeong and J. S. Cho, J. Mater. Chem. A, 2021, 9, 11651–11664 RSC.
- H. Cheng, N. Garcia-Araez and A. L. Hector, ACS Appl. Energy Mater., 2020, 3, 4286–4294 CrossRef CAS.
- Y. Rong, H. Chen, J. Wu, Z. Yang, L. Deng and Z. Fu, Ind. Eng. Chem. Res., 2021, 60, 8649–8658 CrossRef CAS.
- J. Ding, Z. Du, B. Li, L. Wang, S. Wang, Y. Gong and S. Yang, Adv. Mater., 2019, 31, e1904369 CrossRef PubMed.
- S. Tan, Y. Dai, Y. Jiang, Q. Wei, G. Zhang, F. Xiong, X. Zhu, Z. Y. Hu, L. Zhou, Y. Jin, K. Kanamura, Q. An and L. Mai, Adv. Funct. Mater., 2020, 31, 2008034 CrossRef.
- G. Fang, S. Liang, Z. Chen, P. Cui, X. Zheng, A. Pan, B. Lu, X. Lu and J. Zhou, Adv. Funct. Mater., 2019, 29, 905267 Search PubMed.
- Z. Wu, C. Lu, F. Ye, L. Zhang, L. Jiang, Q. Liu, H. Dong, Z. Sun and L. Hu, Adv. Funct. Mater., 2021, 31, 2106816 CrossRef.
- Z. Cen, F. Yang, J. Wan and K. Xu, New J. Chem., 2022, 46, 6587–6595 RSC.
- Y. Zhao, Y. Zhu, F. Jiang, Y. Li, Y. Meng, Y. Guo, Q. Li, Z. Huang, S. Zhang, R. Zhang, J. C. Ho, Q. Zhang, W. Liu and C. Zhi, Angew. Chem., Int. Ed., 2022, 61, e202111826 CAS.
- S. Yin, Z. Ren, C. Chao, Z. Xiao, Z. Liu, G. Shen and G. Han, Dianzi Xianwei Xuebao, 2013, 32, 1994–2013 Search PubMed.
- Z. Hou, K. Guo, H. Li and T. Zhai, CrystEngComm, 2016, 18, 3040–3047 RSC.
- S. Gnanasekar, Q. V. Le and A. N. Grace, Sol. Energy, 2021, 213, 145–153 CrossRef CAS.
- Z. Hou, K. Guo, H. Li and T. Zhai, CrystEngComm, 2016, 18, 3040–3047 RSC.
- Y. Song, W. Zhao, L. Kong, L. Zhang, X. Zhu, Y. Shao, F. Ding, Q. Zhang, J. Sun and Z. Liu, Energy Environ. Sci., 2018, 11, 2620–2630 RSC.
- E. F. de Souza, C. A. Chagas, T. C. Ramalho, V. Teixeira da Silva, D. L. M. Aguiar, R. S. Gil and R. B. de Alencastro, J. Phys. Chem. C, 2013, 117, 25659–25668 CrossRef CAS.
- X. Lu, M. Yu, T. Zhai, G. Wang, S. Xie, T. Liu, C. Liang, Y. Tong and Y. Li, Nano Lett., 2013, 13, 2628–2633 CrossRef CAS.
- L. Zhang, C. M. B. Holt, E. J. Luber, B. C. Olsen, H. Wang, M. Danaie, X. Cui, X. Tan, V. W. Lui, W. P. Kalisvaart and D. Mitlin, J. Phys. Chem. C, 2011, 115, 24381–24393 CrossRef CAS.
- N. Li, Z. Xu, P. Wang, Z. Zhang, B. Hong, J. Li and Y. Lai, Chem. Eng. J., 2020, 398, 125432 CrossRef CAS.
- C. Li, L. Zhu, S. Qi, W. Ge, W. Ma, Y. Zhao, R. Huang, L. Xu and Y. Qian, ACS Appl. Mater. Interfaces, 2020, 12, 49607–49616 CrossRef CAS.
- Y. Liu, L. Liu, Y. Tan, L. Kong, L. Kang and F. Ran, J. Phys. Chem. C, 2017, 122, 143–149 CrossRef.
- B. Tang, J. Zhou, G. Fang, F. Liu, C. Zhu, C. Wang, A. Pan and S. Liang, J. Mater. Chem. A, 2019, 7, 940–945 RSC.
- Y. Li, W. Yang, W. Yang, Y. Huang, G. Wang, C. Xu, F. Kang and L. Dong, J. Energy Chem., 2021, 60, 233–240 CrossRef CAS.
- Y. Bai, H. Zhang, B. Xiang, J. Hao, L. Yan and C. Zhu, Chem. Eng. J., 2021, 420, 130474 CrossRef CAS.
- C. Xia, J. Guo, Y. Lei, H. Liang, C. Zhao and H. N. Alshareef, Adv. Mater., 2018, 30, 1705580 CrossRef PubMed.
- J. Liu, W. Peng, Y. Li, F. Zhang and X. Fan, J. Mater. Chem. C, 2021, 9, 6308–6315 RSC.
- D. Chen, M. Lu, B. Wang, H. Cheng, H. Yang, D. Cai, W. Han and H. J. Fan, Nano Energy, 2021, 83, 105835 CrossRef CAS.
- M. Du, C. Liu, F. Zhang, W. Dong, X. Zhang, Y. Sang, J. J. Wang, Y. G. Guo, H. Liu and S. Wang, Adv. Sci., 2020, 7, 2000083 CrossRef CAS PubMed.
- S. Wang, Z. Yuan, X. Zhang, S. Bi, Z. Zhou, J. Tian, Q. Zhang and Z. Niu, Angew. Chem., Int. Ed., 2021, 60, 7056–7060 CrossRef CAS.
- Y. An, Y. Tian, C. Liu, S. Xiong, J. Feng and Y. Qian, ACS Nano, 2021, 15, 15259–15273 CrossRef CAS PubMed.
- Z. Liu, Q. Yang, D. Wang, G. Liang, Y. Zhu, F. Mo, Z. Huang, X. Li, L. Ma, T. Tang, Z. Lu and C. Zhi, Adv. Energy Mater., 2019, 9, 1902473 CrossRef CAS.
- C. Cai, Z. Tao, Y. Zhu, Y. Tan, A. Wang, H. Zhou and Y. Yang, Nanoscale Adv., 2021, 3, 3780–3787 RSC.
- T. Xiong, Z. G. Yu, H. Wu, Y. Du, Q. Xie, J. Chen, Y. W. Zhang, S. J. Pennycook, W. S. V. Lee and J. Xue, Adv. Energy Mater., 2019, 9, 1803815 CrossRef.
- K. Zhu, S. Wei, H. Shou, F. Shen, S. Chen, P. Zhang, C. Wang, Y. Cao, X. Guo, M. Luo, H. Zhang, B. Ye, X. Wu, L. He and L. Song, Nat. Commun., 2021, 12, 6878 CrossRef CAS PubMed.
- D. Yu, Z. Wei, X. Zhang, Y. Zeng, C. Wang, G. Chen, Z. X. Shen and F. Du, Adv. Funct. Mater., 2020, 31, 2008743 CrossRef.
- Y. Zhang, Y. An, B. Yin, J. Jiang, S. Dong, H. Dou and X. Zhang, J. Mater. Chem. A, 2019, 7, 11314–11320 RSC.
- D. Zeng, K. Yang, C. Yu, F. Chen, X. Li, Z. Wu and H. Liu, Appl. Catal., B, 2018, 237, 449–463 CrossRef CAS.
- C. Zhu, G. Fang, S. Liang, Z. Chen, Z. Wang, J. Ma, H. Wang, B. Tang, X. Zheng and J. Zhou, Energy Storage Mater., 2020, 24, 394–401 CrossRef.
- Y. Zeng, Z. Lai, Y. Han, H. Zhang, S. Xie and X. Lu, Adv. Mater., 2018, 30, e1802396 CrossRef PubMed.
- G. Fang, C. Zhu, M. Chen, J. Zhou, B. Tang, X. Cao, X. Zheng, A. Pan and S. Liang, Adv. Funct. Mater., 2019, 29, 1808375 CrossRef.
- Y. Lu, T. Zhu, W. van den Bergh, M. Stefik and K. Huang, Angew. Chem., Int. Ed., 2020, 59, 17004–17011 CrossRef CAS PubMed.
- Y. Gu, L. Zhang, D. Li, R. Sheng, F. Li and L. Wang, CrystEngComm, 2022, 24, 1285–1291 RSC.
- Y. Bai, H. Zhang, B. Xiang, Q. Yao, L. Dou and G. Dong, Nano Energy, 2021, 89, 106386 CrossRef CAS.
- H. Shen, S. Liang, S. Adimi, X. Guo, Y. Zhu, H. Guo, T. Thomas, J. P. Attfield and M. Yang, J. Mater. Chem. A, 2021, 9, 19669–19674 RSC.
- Z. Wang, J. Zhang, H. Wang, X. Wei, J. Zhang, H. Chen, S. Liu, S. Wei and X. Lu, Electrochim. Acta, 2022, 404, 139785 CrossRef CAS.
- W. Dong, M. Du, F. Zhang, X. Zhang, Z. Miao, H. Li, Y. Sang, J. J. Wang, H. Liu and S. Wang, ACS Appl. Mater. Interfaces, 2021, 13, 5034–5043 CrossRef CAS PubMed.
- J. Ding, H. Gao, K. Zhao, H. Zheng, H. Zhang, L. Han, S. Wang, S. Wu, S. Fang and F. Cheng, J. Power Sources, 2021, 487, 229369 CrossRef CAS.
- D. Chen, M. Lu, B. Wang, R. Chai, L. Li, D. Cai, H. Yang, B. Liu, Y. Zhang and W. Han, Energy Storage Mater., 2021, 35, 679–686 CrossRef.
Footnote |
| † Electronic supplementary information (ESI) available. See DOI: https://doi.org/10.1039/d2ce01241c |
| This journal is © The Royal Society of Chemistry 2023 |

