DOI:
10.1039/D2CE01128J
(Paper)
CrystEngComm, 2023,
25, 162-172
Designing of a Zn(II)-isonicotinohydrazido thiophenyl based 2D coordination polymer: structure, augmented photoconductivity and superior biological activity†
Received
17th August 2022
, Accepted 12th November 2022
First published on 14th November 2022
Abstract
Thiophenyl-isonicotinohydrazide, a multidentate Schiff base, acts as a tridentate N,O,N donor out of which N,O-chelates to one Zn(II) and pyridyl-N links to the adjacent Zn(II) to constitute a 2D coordination polymer, {[Zn(SIZ)2]·DMF}n (CP1) (HSIZ = (E)-N′-(thiophen-2-ylmethylene)isonicotinohydrazide, DMF = N,N-dimethylformamide). CP1 has been characterized by different physicochemical data and confirmed by single crystal X-ray crystallographic measurement. The H-bonding, C–H⋯π and π⋯π interactions in the 2D geometry of the coordination polymer creates a 3D architecture. The Tauc plot for CP1 indicates an optical band gap of 2.91 eV (calc., 2.48 eV) (direct)/2.80 eV (calc., 2.50 eV) (indirect) and CP1 is non-conducting (2.53 × 10⁻⁹ Sm−1) in the dark while it is enhanced by ∼23![[thin space (1/6-em)]](https://www.rsc.org/images/entities/char_2009.gif) 000 times (5.97 × 10−5 Sm−1) upon light irradiation (1000 Wm−2). Considering the biological importance of isoniazid and Zn(II) the antimicrobial activities of CP1 is measured against Staphylococcus aureus and Escherichia coli (MIC, 20 μg mL−1). The cytotoxic potency of CP1 is examined on thirty different cancer cell lines which has been found active against four cancer cell lines, HCT-116 (colon cancer), HeLa (cervical cancer), MDA-MB-231 (human breast cancer cell), and HepG2 (hepatocellular carcinoma) and the results are compared with the human normal kidney epithelial cell line, NKE. However, CP1 shows the highest anticancer efficiency against HeLa (IC50: 9.13 ± 2.32 μg mL−1) cells. The mechanism of cell killing activity may presumably be the generation of intracellular reactive oxygen species as suggested by the caspase 3/7 activation assay.
000 times (5.97 × 10−5 Sm−1) upon light irradiation (1000 Wm−2). Considering the biological importance of isoniazid and Zn(II) the antimicrobial activities of CP1 is measured against Staphylococcus aureus and Escherichia coli (MIC, 20 μg mL−1). The cytotoxic potency of CP1 is examined on thirty different cancer cell lines which has been found active against four cancer cell lines, HCT-116 (colon cancer), HeLa (cervical cancer), MDA-MB-231 (human breast cancer cell), and HepG2 (hepatocellular carcinoma) and the results are compared with the human normal kidney epithelial cell line, NKE. However, CP1 shows the highest anticancer efficiency against HeLa (IC50: 9.13 ± 2.32 μg mL−1) cells. The mechanism of cell killing activity may presumably be the generation of intracellular reactive oxygen species as suggested by the caspase 3/7 activation assay.
Introduction
In the past few decades, the scientific community has witnessed a considerable switching in the mode of research in chemistry from the fundamental area to diverse real-world applications. Subsequently, the current drift in research specially in inorganic chemistry has increasingly been focused in the designing of different coordination polymers (CPs)/metal–organic frameworks (MOFs) owing to their diversity in structural frameworks, easy synthetic procedure, high thermal and chemical stability, excellent level of purity in their native crystalline form, large surface area, high porosity (MOFs) and tunable structure–property relationship.1–4 The physical properties of MOFs make them attractive for various practical applications in the field5–11 of sorption, separation of gases, sensing of ions, catalysis, magnetism, photoconductivity, etc. The promising involvement of MOFs in numerous environmentally benign applications such as fuel storage, fuel cells, batteries, superconductivity, supercapacitors and photo-induced hydrogen evolution has created a promising horizon for the current research interest. The presence of redox-inactive metal ions (e.g., Zn2+, Cd2+ (d10)) and a large number of carbon atoms in organic linkers (polycarboxylates, polypyridines) are the usual consequence of low electrical conductivity of most of the CPs and MOFs. However, a judicious choice of donor ligands enables these materials to generate an organic–inorganic junction for enhanced conductivity, taking into account the advantages of electronic communication between metal ions and ligand systems. To construct CPs, generally N-donor ligands with a bridging ‘linker’ are used12 and the properties of CPs have been influenced by the chemical functionality, flexibility, electronic nature of the ligand. The band gap of CPs can be tuned by the size of grain-boundaries and conjugation, where the increased size and/or π conjugation results in narrowing of the band gaps.13–15 Isoniazid and its derivatives have been considered as a very important class of building blocks to fabricate hybrid materials in the context of semiconductivity of CPs.16 On the other hand, isoniazid and its derivatives have gained eminence in pharmaceutical chemistry for their different biological action such as antibacterial,17 antimycobacterial,18 antifungal,19 antivirus,20 antitumor,21 anticonvulsant22 and antianalgesic23 activities. Isoniazid, with the combination of rifampicin, pyrazinamide and ethambutol, has been used as the first-line anti-tuberculosis (anti-TB) drug for diagnosing TB infection.24 Hence, it is encouraging for the researchers to design and synthesize new CPs having a flexible and conjugated isoniazid derivative as the ligand system and to explore their biological activity with reference to the structure–function relationship.
In the last few years, we have been engaged in the designing of CPs/MOFs25–27 and some of them show promising electrical conductivity under illumination. In this work, a Schiff base, (E)-N′-(thiophen-2-ylmethylene)isonicotinohydrazide, is synthesized from the condensation of isoniazid and thiophene-2-carboxaldehyde that acts as a tridentate N,O,N donor out of which N,O-chelates to one Zn(II) and bridges to adjacent Zn(II) via pyridyl-N to generate a 2D coordination polymer (CP1) and self-assembly by H-bonding, C–H⋯π and π⋯π interactions to generate a 3D architecture. The compound is electrically non-conducting (2.53 × 10⁻⁹ Sm−1) in the dark and shows significant conductivity (5.97 × 10⁻⁵ Sm−1) upon light irradiation. Because of the inherent biological properties of Zn(II) and isoniazid (precursor to the Schiff base), the antimicrobial activities of CP1 have been examined against Gram-positive (Staphylococcus aureus) and Gram-negative (Escherichia coli) bacteria. The exhaustive cytotoxicity study on thirty different cancer cell lines shows the activity of CP1 on four cell lines (HCT 116, HepG2, MDA-MB 231, and HeLa) where HeLa cells show the highest mortality rate (IC50: 9.13 ± 2.32 μg mL−1). Therefore, the dual performance of a single CP can be helpful to sustainable chemistry, which might be enthralling towards manufacturing future energy devices with the added advantage of protecting mammalian health.
Results and discussion
Structural description of CP1
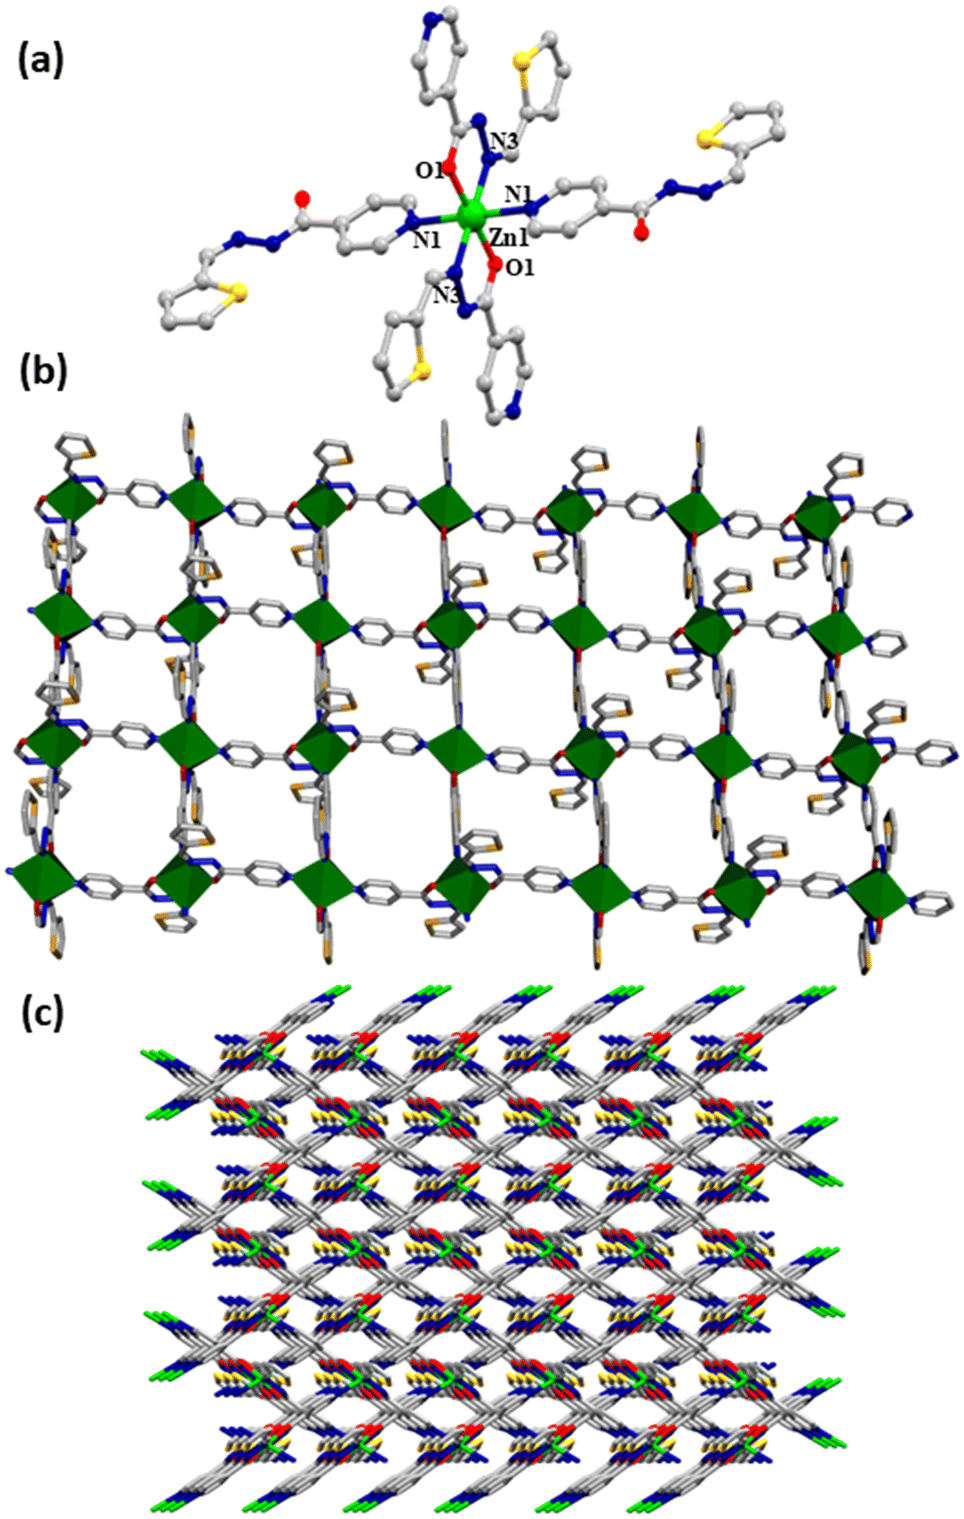
A Zn(II) based 2D metal organic coordination polymer, {[Zn(SIZ)2]·DMF}n (CP1), has been synthesized by the bridging of (E)-N′-(thiophen-2-ylmethylene)isonicotinohydrazide (HSIZ)(Scheme S1, ESI†). CP1 crystallizes in the monoclinic system, space group of C2/c, Z = 4 and Dcalcd (g cm−3) = 1.534 (crystal parameters and some selected bond lengths with bond angles are reported in Table S1 and S2, ESI†). HSIZ has two types of donor centers namely N (pyridyl-N, hydrazido-imine-N) and the enolato-O. The single crystal X-ray structure of CP1 shows the Zn(II) coordination with four N atoms and two O centers to form a distorted octahedral ZnN4O2 unit (Fig. 1, Fig. S1, ESI†). The structure confirms that SIZ− serves as a monoanionic N,O,N donor that has N,O-chelation as well as pyridyl-N bridging to two Zn(II) centers (Fig. 1a). A Zn(II) center coordinated with two pyridyl-N (Zn(1)–N(1), 2.340(4)Å); two –O of carbonyl, (Zn(1)–O(1), 2.066(3)Å) and two hydrazido-imine-N (Zn(1)–N(3), 2.085(3)Å) to form a 2D coordination polymer (Fig. 1b). Subsequently, a 2D cage like arrangement has been executed by different noncovalent interactions (H-bonding, C–H⋯π and π⋯π bonds) to construct a 3D superstructure. Interestingly, the robustness of the architecture is superposed through the interactions like N(2)⋯S(1) (2.817 Å), H-bonding with solvent molecule [H⋯A, C(7)–H(7)⋯O(3) = 2.50 Å (∠C(7)–H(7)⋯O(3) = 163°), C(14)–H(14A)⋯S(1) = 2.759 Å (∠C(14)–H(14A)⋯S(1) = 145°)], C–H⋯π (H(3)⋯O(3)–C(12f)–N(4)–C(12) = 2.68 Å) (Fig. S2, ESI†) and weak π⋯π interaction (3.769 Å) (Fig. S3, ESI†) within thiophenyl and pyridyl rings (Fig. 1c).
 |
| | Fig. 1 (a) The coordination environment and the bridging nature of octahedral Zn(II) in CP1 (hydrogen atoms and the solvent molecule are omitted for clarity), (b) 2D cage like network in CP1, (c) 2D supramolecular assembly in CP1 along the ‘a-axis’, (gray: C, blue: N, green: Zn, yellow: S, red: O). | |
TGA and PXRD analysis
In order to ascertain the thermal stability of CP1, a fine powdered sample was subjected to thermogravimetric analysis (TGA) within a wide range of temperatures from 30 °C to 850 °C under an inert N2 gas atmosphere (Fig. S4, ESI†). The plot indicates that after an initial deduction (1.89%) of surface adsorbed gas molecules, CP1 has remained steady up to 148 °C, followed by the loss of solvent molecules within the crystal system, the weight loss has been calculated as 13.7% (the associated weight loss resembles to that of the disordered DMF molecule; calculated as 12.18%); however, the framework has endured stability till 362 °C, above which CP1 has been finally decomposed and the residue corresponds to ZnO. The TGA experiment of desolvated CP1 was also performed by heating the compound at 170 °C under vacuum for 1 h and Fig. S4† indicates complete removal of DMF molecules with no weight loss at ∼150 °C. The thermal results confirm the practical usefulness of CP1 for real-world material applications. Also, most of the PXRD peaks of the finely ground crystal of the as synthesized CP1 showed appreciable similarity with that of the simulated X-ray diffraction pattern which certainly confirms its phase purity at room temperature (Fig. S5, ESI†). The PXRD studies of the desolvated compound have also been performed, which shows framework stability after removal of DMF (guest) molecules (Fig. S5, ESI†).
Optoelectronic properties
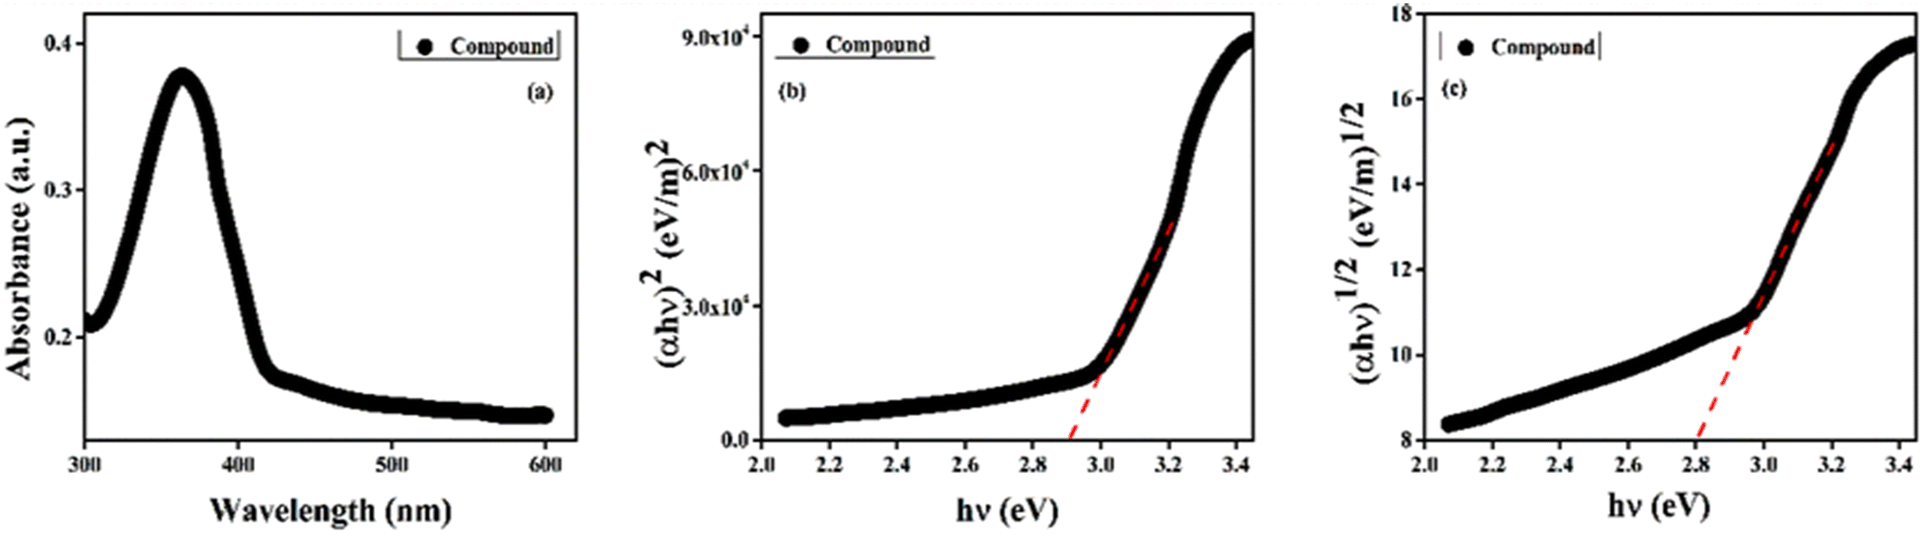
The UV-vis spectrum of CP1 in DMF solution shows maximum absorption at 363 nm with an onset at 428 nm (Fig. S6†). Correspondingly, the absorption spectra of the dispersed compound CP1 (in DMF) in the wavelength range of 300 to 600 nm (Fig. 2a) show the optical band gap (Eg) regarding electronic transition between the VB and CB following the Tauc equation (eqn (1)).28where α is the absorption coefficient; h and ν are the Planck's constant and frequency; A is an arbitrary constant; n corresponds to the allowed direct (= 2) and indirect (= 1/2) electronic transitions. Accordingly, the Tauc plot for direct [(αhν)2vs. hν] (Fig. 2b) and indirect transitions [(αhν)1/2vs. hν] (Fig. 2c) indicates optical band gap energies of 2.91 eV (direct) and 2.80 eV (indirect), and has substantiated the theoretical band gap obtained from DFT calculations (2.48 eV (direct); 2.50 eV (indirect)).29
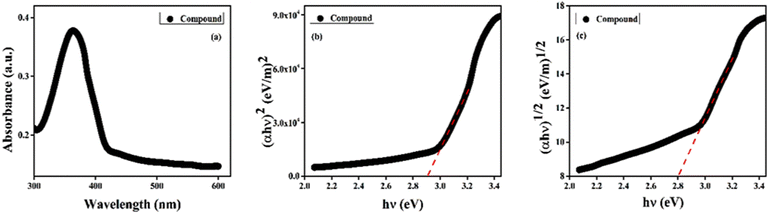 |
| | Fig. 2 (a) Absorption spectra of the compound, CP1, in DMF at 300–600 nm. (b and c) Tauc plots for the direct (b) and the indirect (c) band gaps. | |
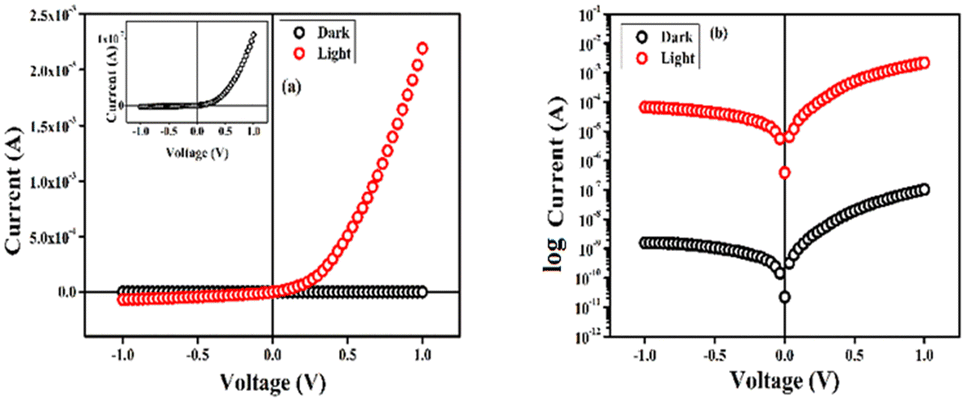
Then a Keithley 2635B source meter, capable of generating a biased voltage (dc) of ±1 V was applied to record the current–voltage (I–V) characteristics of the fabricated device of CP1 in the dark as well as in light (intensity ∼1000 Wm−2), having a configuration as Al/compound (CP1)/ITO at room temperature (300 K). The non-linear rectifying behaviour of the I–V curves for both cases indicated the Schottky diode nature of the material (Fig. 3a and b). A large enhancement of the photocurrent under illumination ensures the excellent photosensitive properties of CP1. The density of the photocurrent (Jph = Jlight − Jdark) is ∼104 times higher compared to the current density in the dark (Jdark) (eqn (2)).30
The
J–
V curves were implemented for calculating the dc conductivity (
σdc) in the ohmic region, where CP
1 upon photo-illumination gave rise to
σdc = 5.97 × 10
−5 Sm
−1 which was 23
000 times higher than the calculated current in the dark (
σdc = 2.53 × 10
−9 Sm
−1 for dark) (
Table 1). The electrical conductivity measurement was performed with different thicknesses of the active layers of CP
1 and the obtained data showed that the generated value of the conductivity remained almost the same in every thickness for the coordination polymer (Table S3
†). The augmented dc current under photo-illumination could be accredited to the expedient photon migration throughout the basic 2D structure and self-assembled 3D architecture of CP
1, which enables a large cross-sectional area for photon absorption at the conjunction in the metal–semiconductor Schottky diode.
31
 |
| | Fig. 3 (a) I–V curves for the Schottky device of CP1. Corresponding inset denotes the dark current, (b) logarithmic representation of the current as a function of voltage. | |
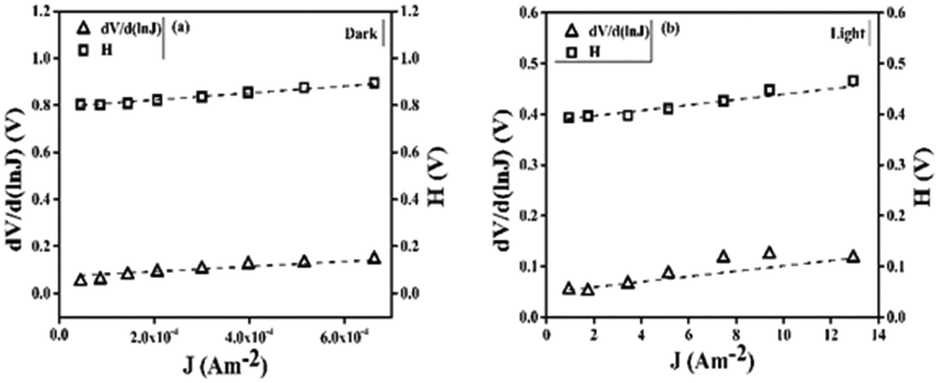
Table 1 Schottky diode parameters
| Condition |
Ideality factor (η) |
R
S (Ω) |
Φ
b (eV) |
| dV/d(lnJ) vs. J |
H vs. J
|
| Dark |
2.04 |
2.16 × 10⁷ |
2.21 × 10⁷ |
0.39 |
| Light |
1.88 |
1.13 × 10³ |
1.24 × 10³ |
0.21 |
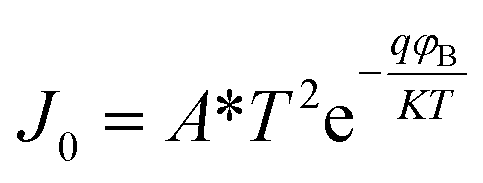
Now, the theory of thermionic emission was used to analyze the obtained diode parameters for the current Schottky device,32,33 according to which the diode current density (J) is expressed as (eqn (3)),
where
J0 is the reverse saturation current density,
q is the electronic charge,
VD is the voltage across the diode,
η is the ideality factor,
k is the Boltzmann constant and
T is the absolute temperature. Accordingly,
J0 can be stated as (
eqn (4)),
16| |  | (4) |
where
A* is the effective Richardson constant and the magnitude of which is assigned as 3.2 × 10
5 Am
−2 K
−2.
φB is the barrier height within the measured effective diode area of 7.065 × 10
−6 m
2. Using
eqn (3) and
(4), two linear equations (Cheung's equation) were developed,
34,35 which give the magnitudes of the ideality factor (
η), barrier height (
φB), and series resistance (
RS) of the Al/compound
1/ITO configured Schottky device.
| |  | (5) |
where
| |  | (7) |
From the linear regressive region of
eqn (5), the intersection of the
y-axis gave rise to the magnitude of
η of the diode to pure thermionic emission,
36 which were 2.04 for dark and 1.88 for light conditions respectively (
Fig. 4). The inhomogeneous metal–semiconductor Schottky junction caused
η to deviate from the ideal value.
37 The intersection of
eqn (6) provided the barrier height (
φB), 0.39 and 0.21 eV for dark and light illumination respectively. It was observed that for the light conditions, the ideality factor and barrier heights were decreased accordingly. The reduction in barrier height and series resistance (
Rs) under illumination signifies the enhanced charge transfer properties.
31 The respective magnitudes of
η,
φB and
RS as expressed from
eqn (5) and
(6) are given in
Table 1.
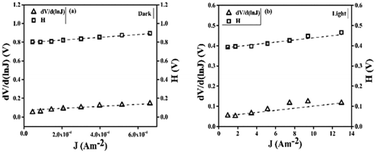 |
| | Fig. 4 Variation in dV/d(lnJ) and H(J) with respect to J for (a) the dark and (b) light conditions respectively. | |
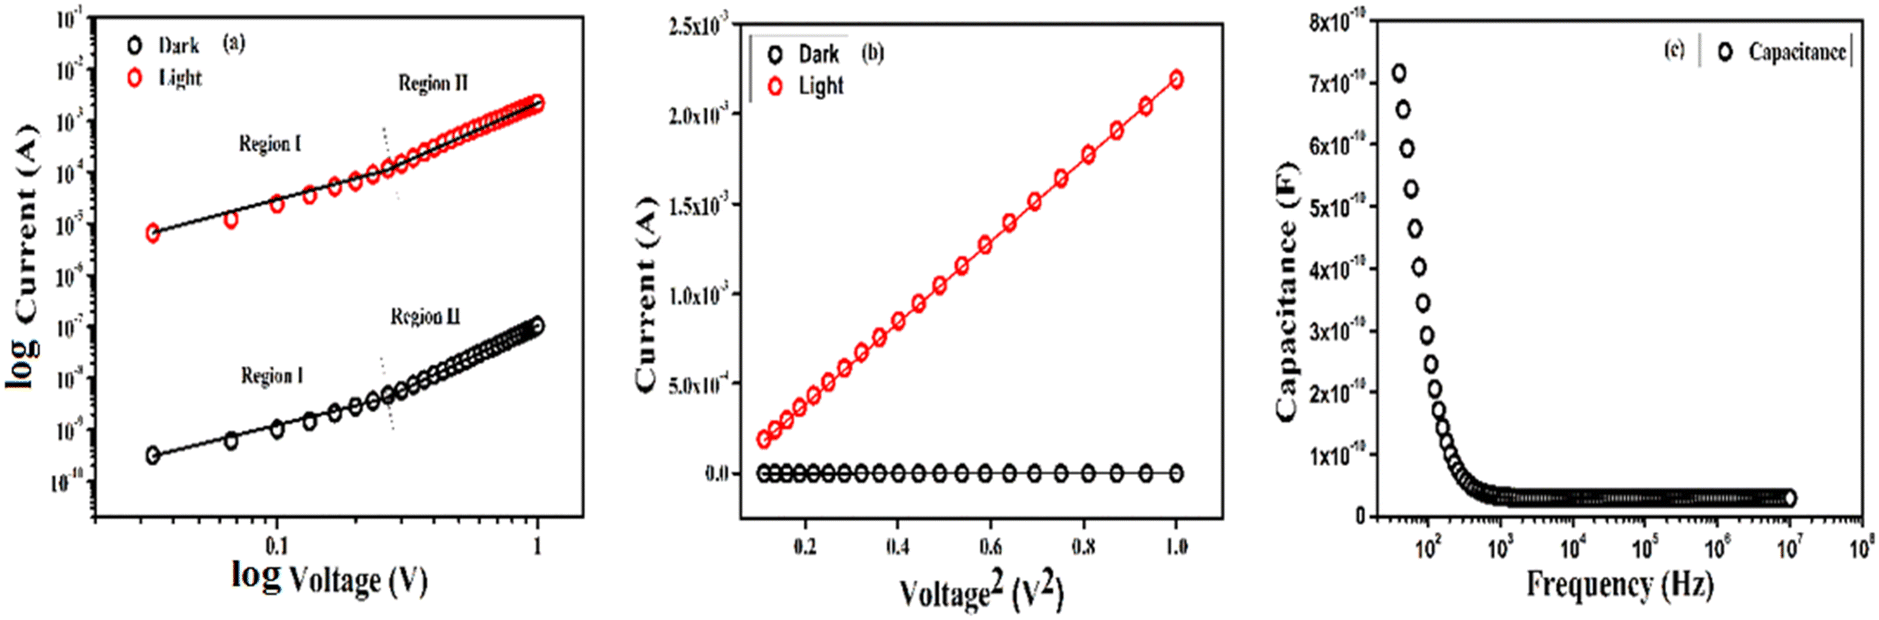
The plot of logI vs. logV (Fig. 5a) evidenced that the device could transport charge within two regions. In the first region (region-I), the current (I) was linearly proportional to the applied voltage (V), which is defined as the ohmic conduction (I ∝ V) and in region-II the current increased nonlinearly with respect to the applied voltage as per the power law (I ∝ V2) which satisfied the mechanistic pathway for space charge limited current (SCLC).38 For this purpose, the following optoelectronic parameters viz., (i) effective carrier mobility (μeff), (ii) transit time (τ) and (iii) mobility-transit time product (μτ), were interpreted.
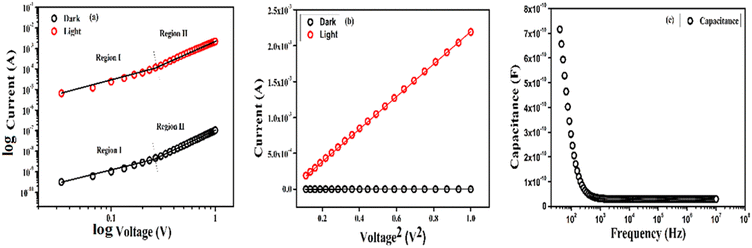 |
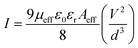
| | Fig. 5 (a) logI vs. logV plot under dark conditions (black) and light (red) illumination, (b) I vs. V2 plot for dark conditions (black) and light illumination (red), (c) variation of capacitance with respect to frequency. | |
The slope of the I vs. V2 plot (Fig. 3b) was used in the SCLC region to evaluate the magnitude of μeff according to the Mott–Gurney equation (eqn (8)),39
| |  | (8) |
where
I is the current,
Aeff is the effective diode area,
ε0 is the permittivity of free space and
εr is the dielectric constant and
d is the thickness of the diode.
Meanwhile, the change in capacitance with respect to frequency (Fig. 5c) was examined to evaluate the dielectric constant of the material using two probe techniques. The value of capacitance at saturation (C0) gives us the value of dielectric constant according to the following equation (eqn (9)).39
| |  | (9) |
From the above equation the magnitude of
C0 was calculated as 0.47 following the value of the effective carrier mobility as 3.32 × 10
−9 m
2 V
−1 s
−1 under dark conditions and 6.83 × 10
−5 m
2 V
−1 s
−1 after photo-illumination (
eqn (8)), which clearly depicted a dramatic enhancement in
μeff for the ITO/compound 1/Al based electronic device after light irradiation. The required time for the electron and/or hole to travel from one electrode to the other is defined as the transit time (
τ) and expressed using following equation (
eqn (10)),
40| | 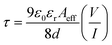 | (10) |
The
μeff,
τ and
μeffτ (
Table 2) indicated that all of the said optoelectronic parameters were varied considerably by absorption of photons
41 which imparted pivotal roles in the charge transport mechanism of the device. The carrier mobility is increased remarkably by 10
4 times (approx.) under illumination in comparison with the dark conditions while the transit time is reduced accordingly. In the absence of light (dark condition), the prevailed probability of trapping resulted in longer transit time that got reversed after light absorption and acted as a driving force for uninterrupted charge transport within the supramolecular network of CP
1, which finally improved the carrier mobility. The photostability of the material is of primary concern towards device fabrication and measurements. Incidentally, the photostability of CP
1 has been examined by measuring the UV-vis absorption spectra in 5% DMSO/H
2O and in the solid state after exposure to UV light (
λex = 365 nm) at different time intervals (Fig. S7 and S8, ESI
†). Both the solution and solid-state spectra reveal negligible photodegradation as the absorbance remains unchanged with time, where the present isoniazid-based Schiff base ligand acts as a photoexcitation site.
Table 2 SCLC parameters
| Condition |
μ
eff (m2 V−1 s−1) |
τ (s) |
μ
eff
τ (m2 V−1) |
| Dark |
3.32 × 10⁻⁹ |
2.09 × 10⁻⁴ |
6.93 × 10⁻¹³ |
| Light |
6.83 × 10⁻⁵ |
1.11 × 10⁻⁸ |
7.49 × 10⁻¹³ |
Biological application
Antimicrobial activity.
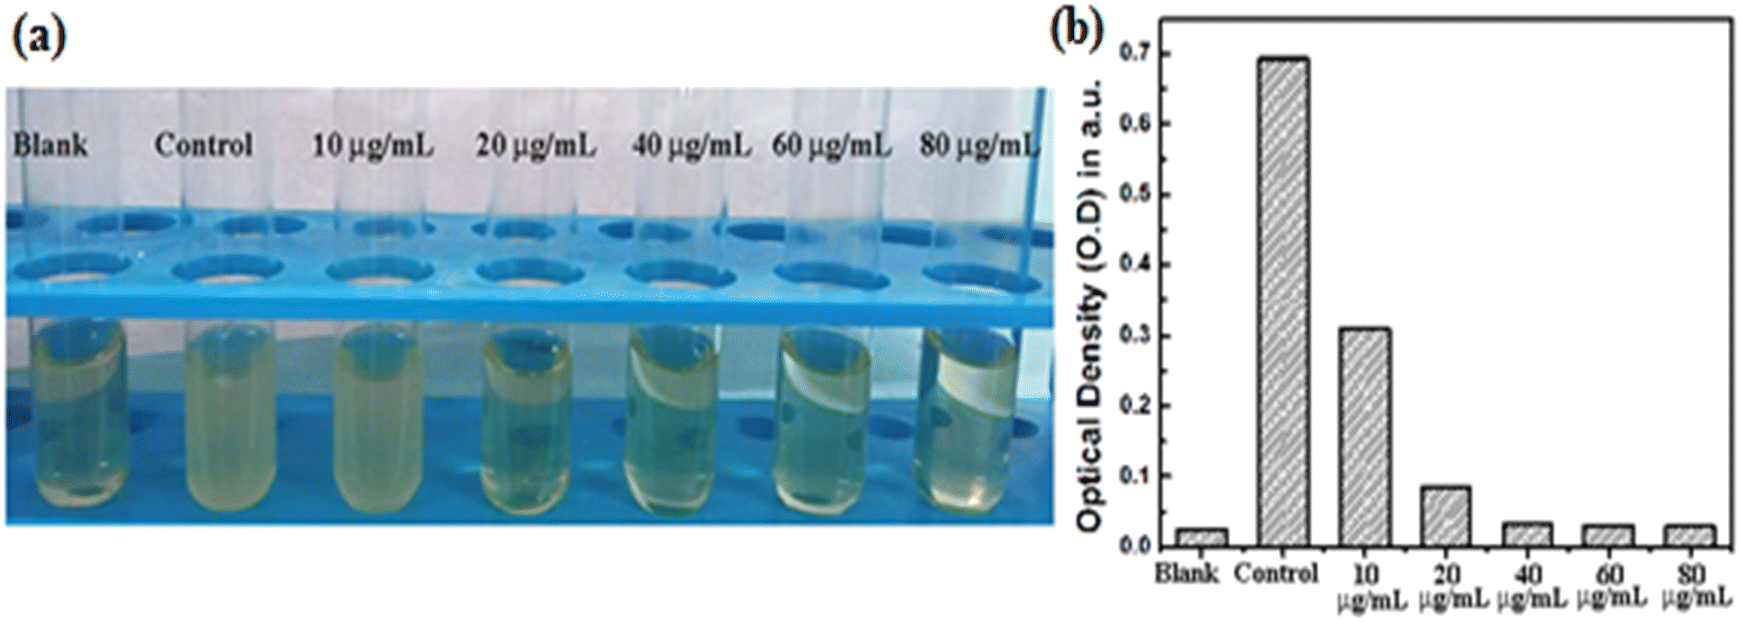
The antimicrobial activity of CP1 against Staphylococcus aureus and Escherichia coli revealed that the increased concentration of drugs considerably inhibited the growth of microorganisms (Fig. 6, Table S4, Fig. S9, ESI†). The experimental MIC (minimum inhibitory concentration) of CP1 against Staphylococcus aureus (Fig. 6a) and Escherichia coli (Fig. S10, ESI†) was found to be 20 μg mL−1. Further, the effect of bactericidal concentration of Staphylococcus aureus on CP1 has shown that the MBC is 40 μg mL−1 (Fig. S9, ESI†) and with the increased concentration no such colonies are seen.
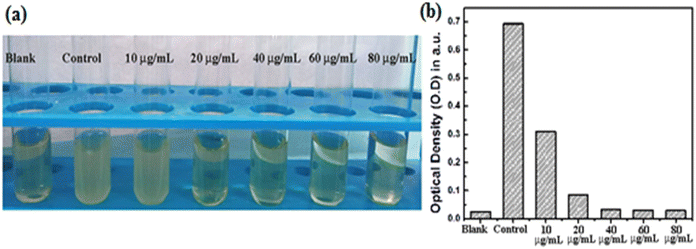 |
| | Fig. 6 (a) Determination of the MIC of CP1, different increasing concentrations (10, 20, 40, 60, 80 μg ml−1) were added separately against Staphylococcus aureus by using the BDS method; (b) determination of the MIC at varying concentration by checking turbidity through O.D. measurement at 600 nm. | |
Anticancer activity.
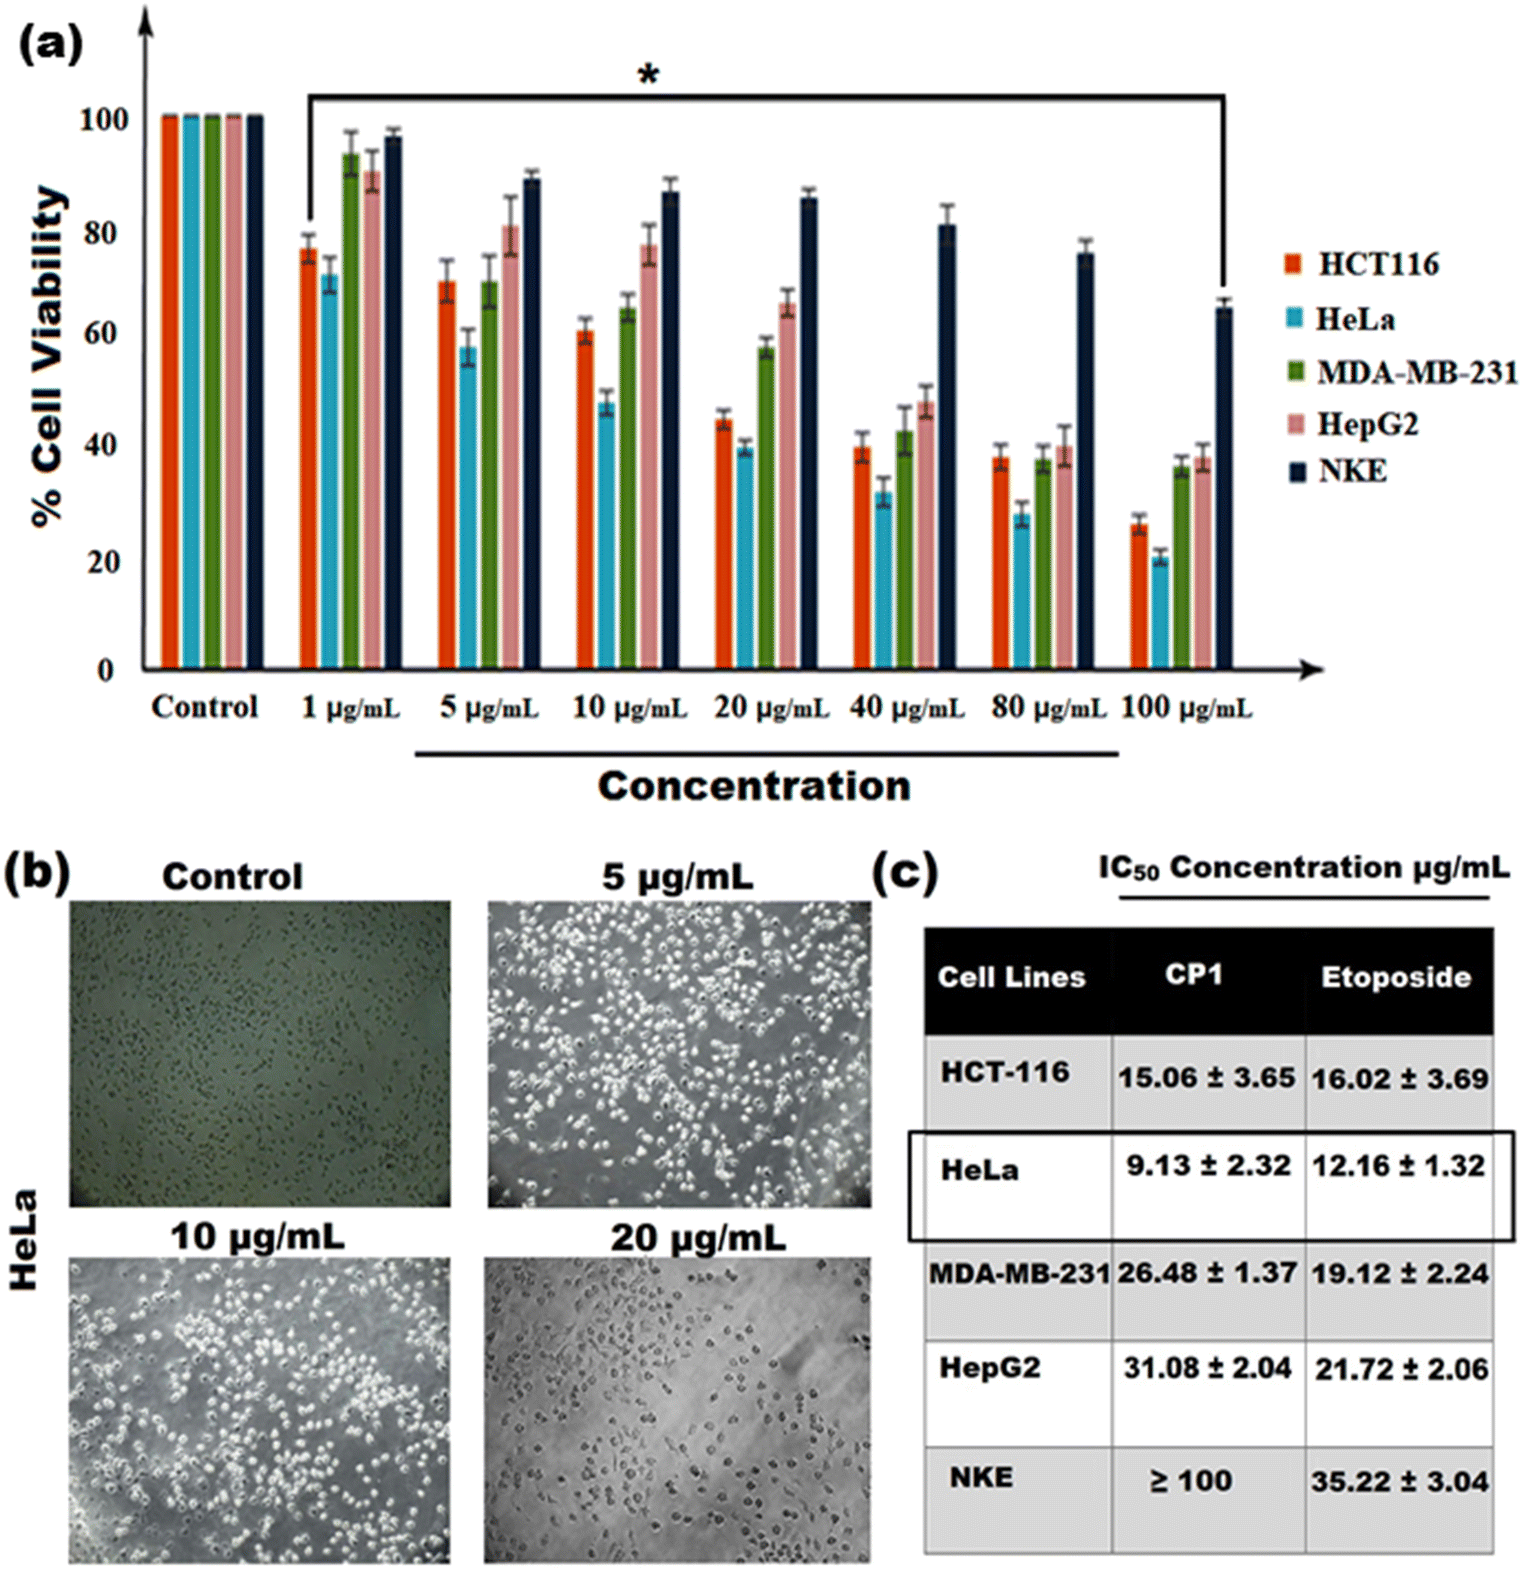
The anticancer activity of CP1 was examined against thirty different cancer cell lines and the results show that four cancer cell lines – HCT-116 (colon cancer), HeLa (cervical cancer), MDA-MB-231 (human breast cancer cell), and HepG2 (hepatocellular carcinoma) – are active and the results have been compared with the human normal kidney epithelial cell line, NKE. The MTT assay was performed using etoposide as a standard broad spectrum anticancer drug against testicular, bladder, prostate, lung, stomach, and uterine cancers.
The IC50 (Fig. 7a and c) data have shown that CP1 is cytotoxic to all the cancer cell lines, relative to the normal cell line NKE. However, the cytotoxic efficacy is found to be the highest in inhibiting the proliferation of cervical cancer cell lines, HeLa (IC50: 9.13 ± 2.32 μg mL−1), and the other results are 15.06 ± 3.65 μg mL−1 (HCT 116), 31.08 ± 2.04 μg mL−1 (HepG2), 26.48 ± 1.37 μg mL−1 (MDA-MB 231) and the IC50 of etoposide is 12.16 ± 1.32 μg mL−1 (Fig. 7). To further re-establish our findings obtained from the MTT assay, phase contrast microscopy imaging of CP1 treated HeLa was performed which revealed that as compared to the control setup, the treated setup showed a concentration-dependent increase in the level of morphological change to induce death in HeLa cells.
 |
| | Fig. 7 (a) In vitro cytotoxicity was measured by MTT (bar graph); (b) phase contrast microscopy imaging of CP1 (5 μg mL−1, 10 μg mL−1, and 20 μg mL−1) treated HeLa. The results were expressed as mean ± SEM. The level of significance was set at *(P ≤ 0.01–0.05) in respect with the control, (c) table shows IC50 values of CP1 in various cancer cell lines including HCT-116, HeLa, MDA-MB 231, HepG2 (cancer cells), and NKE (human normal kidney epithelial cell line). | |
Apoptotic cell death and intercellular ROS generation.
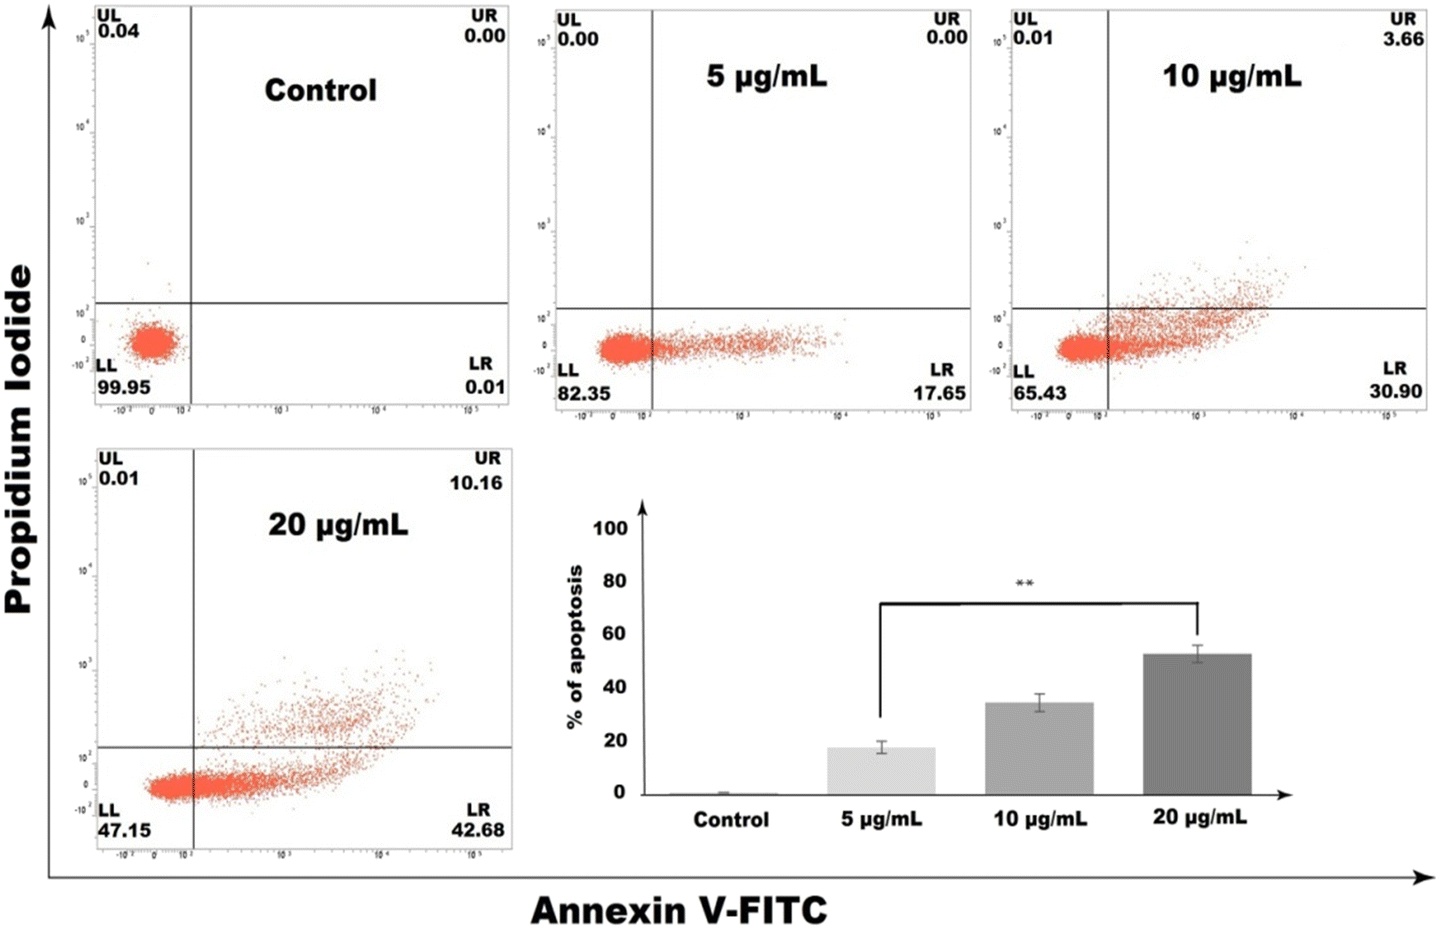
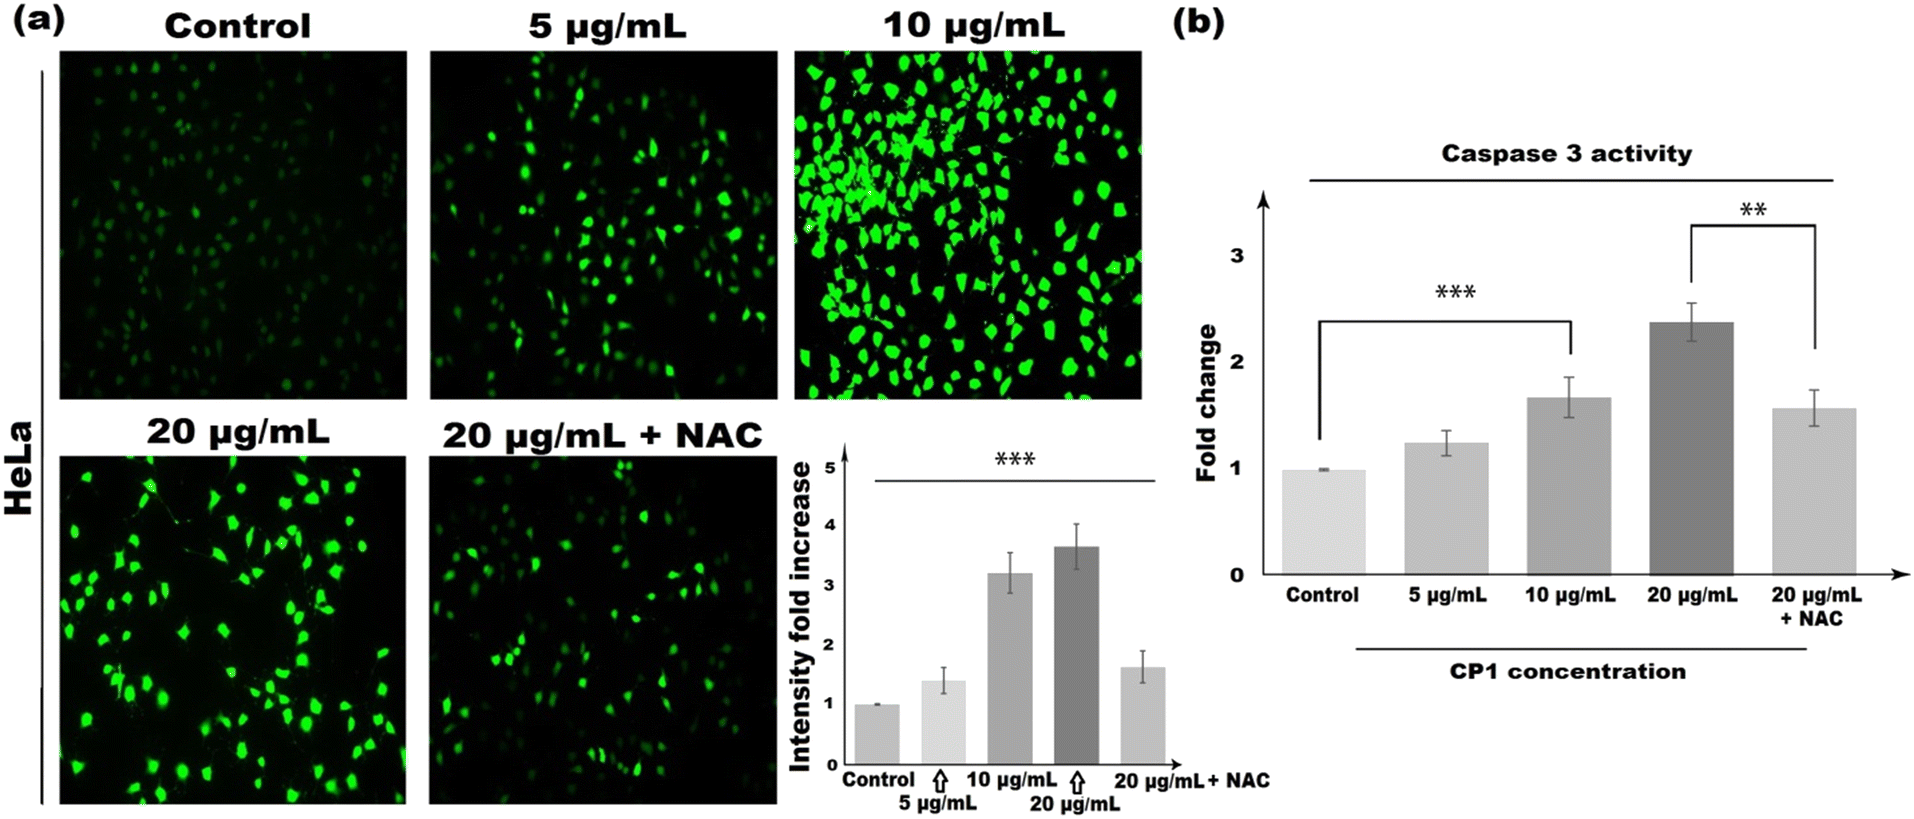
The annexin V-FITC/PI flow cytometric assay had shown an increased number of apoptotic cell populations with the increase of CP1 concentration (5, 10, and 20 μg mL−1 in treatment for 48 h, Fig. 8). It is observed that the annexin V-FITC+/PI− (early apoptotic) and annexin V-FITC+/PI+ (late apoptotic) cell population are 17.65%, 34.56% and 52.84% respectively in comparison to 0.01% in the control setup. To further determine whether CP1 induced apoptotic cell death was due to intracellular reactive oxygen species (ROS) accumulation, the H2DCFDA fluorescence assay was performed and ROS generation was measured using the fluorescence microscopy images of CP1 treated cells (Fig. 9). A dose dependent increase in the level of green coloured fluorescence intensity as compared to control untreated cells specifies the intracellular ROS accumulation even at a concentration of 5 μg mL−1. Nonetheless, HeLa cells pre-treated with 10 mM N-acetyl-cysteine (NAC), a potent and widely accepted inhibitor of ROS, decrease the CP1 induced ROS generation in comparison to only CP1 treatment, at a concentration of 20 μg mL−1 of CP1 (Fig. 9).
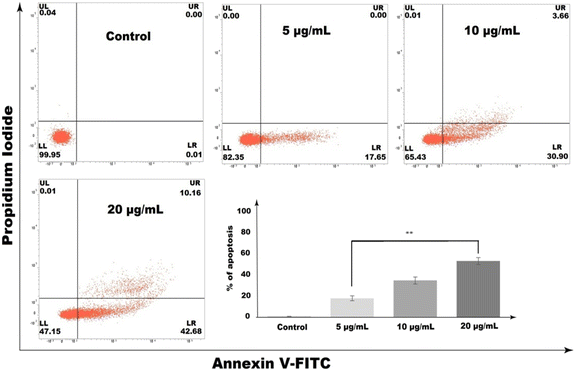 |
| | Fig. 8 Concentration-dependent increase in the annexin V-FITC/PI-positive population of HeLa cells in response to CP1 treatment. Post treatment with CP1 (5, 10, and 20 μg mL−1) for 48h. The cells were stained with annexin V-FITC/PI and analyzed in FACS. The results were expressed as mean ± SEM. The level of significance was set at **(P ≤ 0.001–0.01) with respect to the control. | |
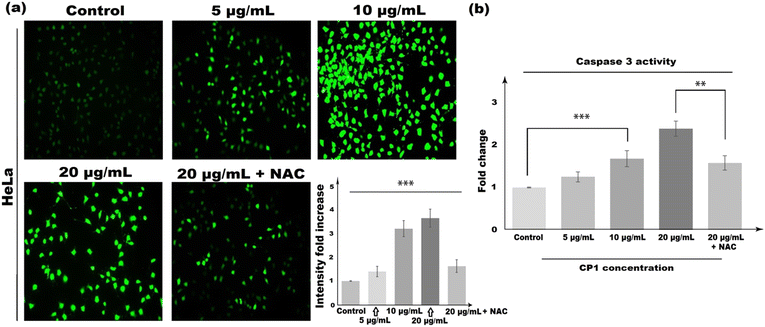 |
| | Fig. 9 (a) Concentration-dependent increase in intercellular ROS accumulation of HeLa cells in response to CP1 treatment (5 μg mL−1, 10 μg mL−1, 20 μg mL−1 and 20 μg mL−1 + NAC) for 48h, cells were stained with H2DCFDA and fluorescence microscopy was performed. (b) Concentration-dependent increase in caspase 3 activity of HeLa cells in response to CP1 treatment. Post treatment with CP1 (5 μg mL−1, 10 μg mL−1, 20 μg mL−1, 20 μg mL−1 + NAC) for 48h. The results were expressed as mean ± SEM. The level of significance was set at **(P ≤ 0.001–0.01) and ***(P ≤ 0.0001–0.001) with respect to the control. | |
To further verify the present finding obtained from the H2DCFDA and annexin V-FITC/PI assay, the caspase-3/7 activity assay was performed, and the results from Fig. 9b clearly showed a dose dependent increase in caspase 3 activity. In the treatment set-up and at a concentration of 20 μg mL−1, after 48 h, CP1 showed a 2.39 ± 0.18 fold increase in caspase 3 activity when compared with the control. Meanwhile, HeLa cells, pre-treated with NAC, reduce CP1 induced caspase 3 activation in comparison to CP1 treatment alone (at a concentration of 20 μg mL−1). This finding clearly validates our results obtained from the annexin V-FITC/PI assay, suggesting that CP1 mediated ROS generation and cell death of HeLa cells were due to apoptosis induction, induced by increased caspase 3 activity. Meanwhile, the solution-stability of the synthesized polymer is monitored from UV-vis absorption spectra recorded at different time intervals. As the biological experiment is carried out in 5% DMSO/H2O solvent, hence, the solution stability was also checked in that solvent. From Fig. S11† it can be seen that, the absorption spectral response of CP1 hardly undergoes any significant changes, where both the absorbance and its peak position remain steady in the said solvent mixture even after 48 h, which demonstrate its potent stability. Moreover, the compound exhibits reasonable pH stability as evidenced from the unaltered UV/vis absorption maxima throughout the tested pH range without changing its peak position (Fig. S12†).
Theoretical analysis.
The structural unit of the 2D coordination polymer (CP1) was modelled using DFT calculations, where the simulated atomic positions were optimized with the experimental crystal lattice parameters fixed. Accordingly, all the calculated data were found to be in close agreement with the experimental ones by the standard band theory methodology. Interestingly, a small drop in the magnitudes of the band gap between experimental and theoretical approaches in this case is noted.
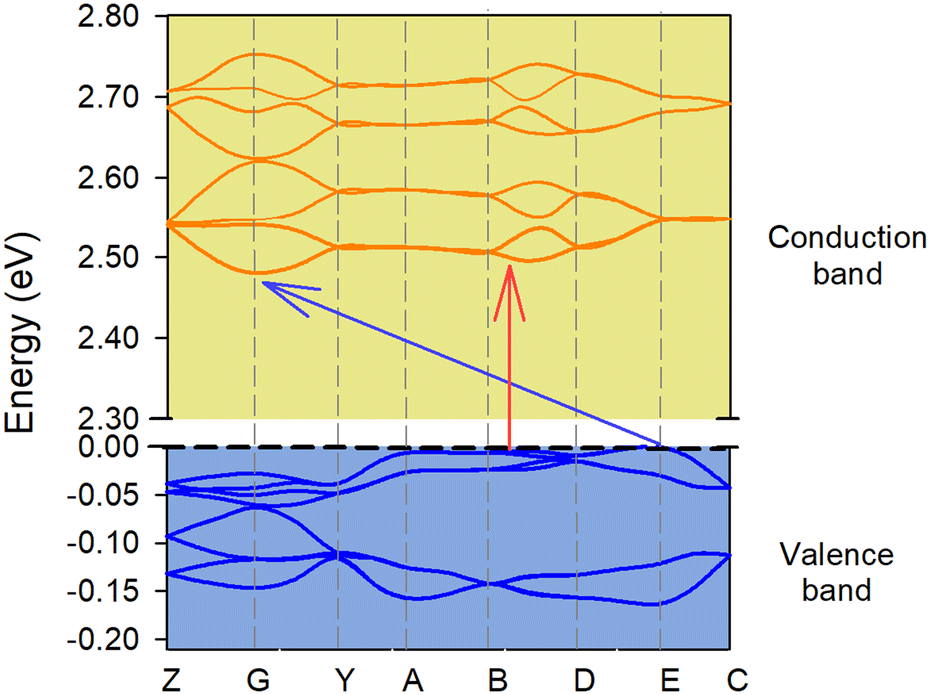
The indirect band gap is 2.48 eV (Fig. 10) between the B and G points of high symmetry and a direct band gap is 2.50 eV near point B. The same tendency has also been shown in the experimental part (2.91 vs. 2.80 eV). Fig. 10 describes only the first levels of the conduction band and the last levels of the valence bands. In reality there are many more levels and possible transits between them that satisfy the spectroscopic selection rules. In the ESI,† the total unprocessed graph for the material is presented (Fig. S13, ESI†). Both results demonstrate that the material indeed belongs to a semiconductor family. Accordingly, the partial density of states analysis (Fig. S14, ESI†) reveals that both the valence and conduction bands of the current in the semiconductor were mainly dominated by the p-character of the ligands.
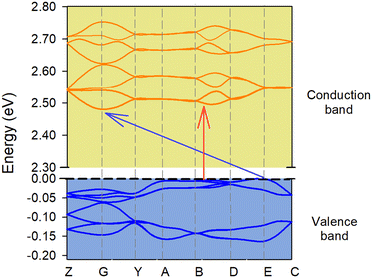 |
| | Fig. 10 Electronic band structures of the ground state. The first Brillouin zone contains the following labeled high symmetry points: Z = (0, 0, 0.5); G = (0, 0, 0); Y = (0, 0.5, 0); A = (−0.5, 0.5, 0); B = (−0.5, 0, 0); D = (−0,5, 0, 0.5); E = (−0.5, 0.5, 0.5); C = (0, 0.5, 0.5). The red arrow marks the direct band gap at 2.50 eV, while the blue arrow marks the indirect band gap at 2.48 eV. | |
The dielectric function ε(ω) (Fig. S15, ESI†) theoretically elaborates how an incident photon on a material depends upon the frequency.42–46 In order to calculate the optical response, a range from 0 to 10 eV was chosen for photon-energy, where three main decomposed directions (εxx, εyy, and εzz) for the dielectric constant were preferred during incidence of light on the crystal. In this material, the εxx component presents the most intense signals, finding the maximum peaks of the range studied at 2.1, 3.0, 4.2 and 5.6 eV. The εyy and εzz components are coincident and present lower intensity peaks with maximum peaks at 2.2, 2.9, 3.7 and 4.9 eV. The above results signified the anisotropic behaviour of the crystal. Besides the optical conductivity [σ(ω)] of the material was also taken into account for analysing deeper insights about the dependence of conductivity on photo-illumination. Evidently, the photo and/or electrical conductivity of materials increases because of absorbing photons.42–45
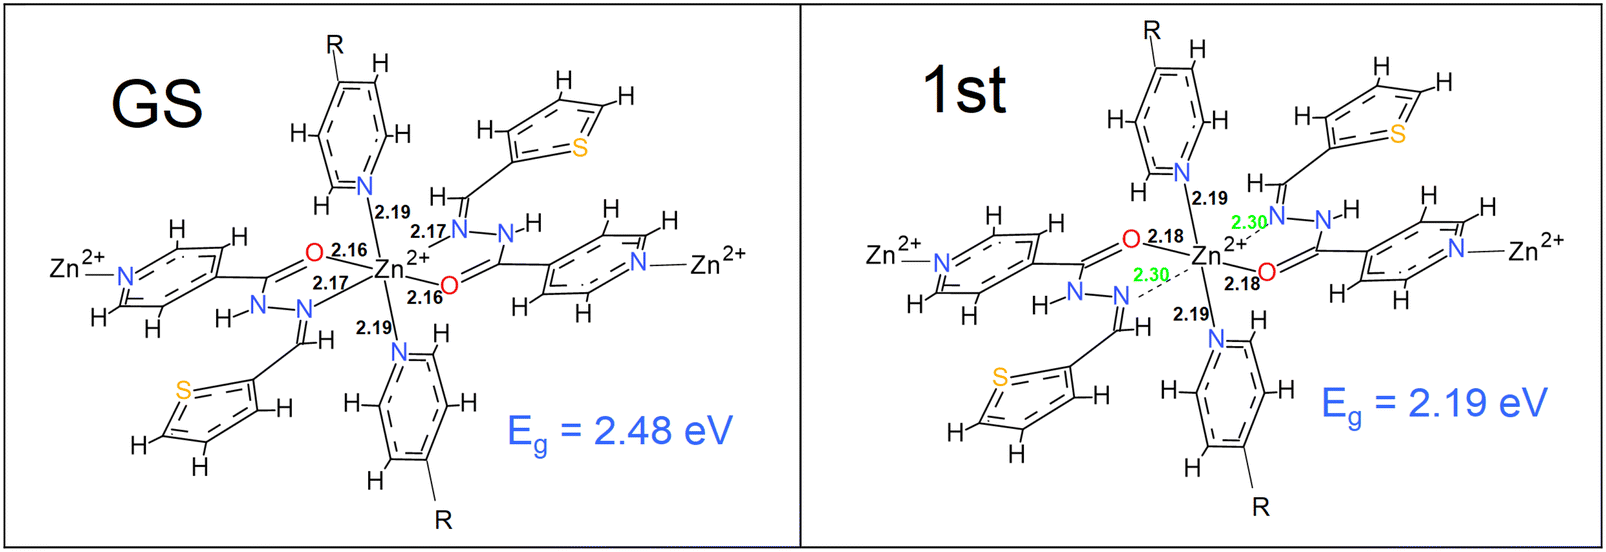
The optical properties of CP1 showed that only some directed wavelengths into the crystal were associated with an optical response (Fig. S15, right, ESI†). The onset of the light absorption started at 2.4 eV for CP1 with other associated intense peaks at 3.2, 4.4 and 5.9 eV in the εxx direction. During the course of photon absorption, a plausible correlation could be made between the optical and experimental electrical conductivity of CP1, which might elucidate the desired change in its electronic configuration, caused by light absorption. Evidently, the required changes in the first excited state of CP1, associated with its energy levels in the crystalline state of the material could feasibly be simulated by the TD-DFT calculations. The detailed methodologies for TD-DFT and frontier orbital calculations along with .cif files for the optimized structures both in the ground and excited states are included in the ESI.† Subsequently, the energy allowance behind the electronic transitions could be linked with the required geometry alteration. Herein, we calculated the first excited state of the 2D coordination polymer, and obtained a significant difference between the bonding of the nitrogen Schiff base ligand and Zn(II), as an example. Light absorption affects the structural parameters and Fig. 11 shows that some of the bonds in the coordination sphere around the Zn(II) are elongated compared to the GS phase which may augment the conductivity of CP1 under light illumination. Furthermore, other optoelectronic parameters, namely, carrier density, charge states, carrier interface of metal/polymer electrode and its work function might also shed light on the augmented conductivity of such a material in the presence of light, which requires further sophisticated research inputs for its detailed deliberation. The fact that using the TD-DFT theory to optimize the first excited level as an example does not mean that this is the only one responsible for the increase in conductivity, but rather indicates that it could be a possible cause (one of the possible causes among the all other excited states) of that happening. In our work, with the calculation of the geometry of the first excited state, significant changes in the geometry of the crystal are observed that make the band gap decrease and can be related to the increase in optical conductivity and transversely to electrical conductivity. Many other levels can be responsible for the changes, however, the high computational cost makes its geometric optimization expensive (from a computational point of view). The results together further indicates that the synthesized CP1 possesses semiconducting properties. Furthermore, the calculation of the frontier orbitals for the optimized structure both in the ground and excited states has been performed and analysed. Accordingly, in the ground state the HOMO is located in the thiophenyl groups and in the heteroatoms of the ligand that coordinate the Zn(II) (Fig. S16, ESI† left). No participation of the Zn(II) function is shown. However, the LUMO is distributed throughout the HSIZ ligand, especially in the pyridyl group (Fig. S16, ESI† right). The considerable change in heterogeneous electronic distribution in CP1 going from the HOMO to LUMO along with notable structural modulations undoubtedly refer to the establishment of the band or zone theory for the synthesized coordination polymer.
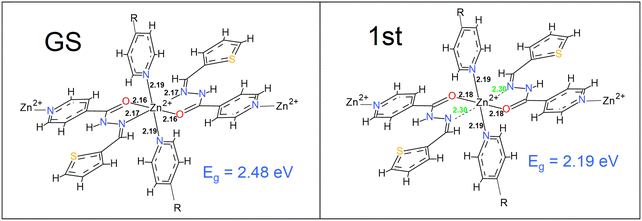 |
| | Fig. 11 The energy optimized ground and first excited state geometries of the compound, elucidating the required change in the energy state along with the conspicuous variation in the coordination bonding with Zn2+ principally. | |
Taking the results together it can be inferred that by attaching the isoniazid based Schiff base and Zn(II) ion without any linker the developed CP1 exhibits dual-functional activity from a single CP framework on the basis of augmented photoconductivity as well as superior biological events, which are compared with previously reported CP based materials and the results are tabulated in Table S5.† From the table, it can be suggested that the present CP1 is better as a functional material compared to others for practical applications.
Conclusion
(E)-N′-(Thiophen-2-ylmethylene)isonicotinohydrazide (HSIZ), a multidentate Schiff base, has been used to synthesize a 2D Zn(II)-coordination polymer {[Zn(SIZ)2]·DMF}n (CP1) which forms a 3D architecture through H-bonding, C–H⋯π and weak π⋯π interactions. CP1 is semiconducting with an optical band gap of 2.91 eV (theoretical, 2.48 eV) which measures the insignificant conductivity in the dark (2.53 × 10⁻⁹ Sm−1) and is enhanced substantially by ∼23000 times (5.97 × 10−5 Sm−1) upon light irradiation (1000 Wm−2). The theoretical calculation supported the semiconducting behaviour and electrical properties upon illumination. The antibacterial activity of the compound showed higher efficiency against E. coli than S. aureus. The cell killing action of the compound was explained by the presumable ROS generation in the cells. CP1 exhibits cytotoxicity against four cancer cell lines, in the case of the HeLa cell line it exerted the lowest IC50 (9.13 ± 2.32 μg mL−1) as compared to etoposide (12.16 ± 1.32 μg mL−1). Therefore, this study paves an avenue towards the establishment of a multifunctional polymeric material which might serve as a potential candidate to satisfy the ongoing energy crisis and relevant biological applications.
Associated Content
Supporting information
It contains the detail in the experimental section, synthetic scheme of CP1 (Scheme S1, ESI†), the crystal data, refinement parameters and some selected bond length and angles (Tables S1 and S2†), supramolecular aggregate of CP1 (Fig. S1–S3†), TGA graph (Fig. S4†), PXRD measurement (Fig. S5†), conductivity (Table S3†) UV-vis measurements (Fig. S6–S8†) data on microbial study of CP1 (Table S4, Fig. S9 and S10†), absorption spectral studies (Fig. S11 and S12†) and some important figure for theoretical calculation (Fig. S13–S16†), comparison table (Table S5†).
Accession Codes
The crystal data of the CP was deposited to Cambridge Crystallographic Data Centre with CCDC number 2169715.
Author contributions
Kingshuk Debsharma: conceptualization, data curation, formal analysis, investigation, methodology, software, validation, visualization, writing – original draft, writing – review & editing; Sunanda Dey: conceptualization, data curation, formal analysis, investigation, methodology, software, validation, visualization, writing – original draft, writing – review & editing; Dhananjoy Das: data curation, formal analysis, investigation, methodology, software, validation, writing – original draft; Satyajit Halder: data curation, formal analysis, investigation, methodology, software, validation, writing – original draft; Joaquin Ortega-Castro: data curation, formal analysis, investigation, methodology, software, validation, writing – original draft; Sarita Sarkar: data curation, formal analysis, investigation, methodology, software, validation, writing – original draft; Basudeb Dutta: data curation, formal analysis, methodology, software, validation; Suvendu Maity: data curation, formal analysis, software, validation; Kuladip Jana: data curation, project administration, resources, supervision, validation, writing – review & editing; Antonio Frontera: data curation, project administration, resources, supervision, validation, writing – review & editing; Partha Pratim Ray: data curation, project administration, resources, supervision, validation, writing – review & editing; Chittaranjan Sinha: conceptualization, data curation, funding acquisition, project administration, resources, supervision, validation, writing – review & editing.
Conflicts of interest
The authors declare no conflicts of interest.
Acknowledgements
The authors are thankful for the financial support and infrastructure provided by the Jadavpur University, Kolkata.
References
-
S. R. Batten, S. M. Neville and D. R. Turner, Coordination Polymers: Design, Analysis and Application, Royal Society of Chemistry, London, 2009 Search PubMed.
- X.-X. Wu, H.-R. Fu, M.-L. Han, Z. Zhou and L.-F. Ma, Cryst. Growth Des., 2017, 17, 6041–6048 CrossRef CAS.
- B. Dutta, R. Jana, A. K. Bhanja, P. P. Ray, C. Sinha and M. H. Mir, Inorg. Chem., 2019, 58, 2686–2694 CrossRef CAS PubMed.
- K. Nath, C. K. Karan and K. Biradha, Cryst. Growth Des., 2019, 19, 6672–6681 CrossRef CAS.
- K. Biradha, C.-Y. Su and J. J. Vittal, Cryst. Growth Des., 2011, 11, 875–886 CrossRef CAS.
- L. Sun, M. G. Campbell and M. Dinca, Angew. Chem., Int. Ed., 2016, 55, 3566–3579 CrossRef CAS PubMed.
- M. D. Allendorf, C. A. Bauer, R. K. Bhakta and R. J. T. Houk, Chem. Soc. Rev., 2009, 38, 1330–1352 RSC.
- O. M. Yaghi, M. O'Keeffe, N. W. Ockwig, H. K. Chae, M. Eddaoudi and J. Kim, Nature, 2003, 423, 705–714 CrossRef CAS PubMed.
- H. Sato, R. Matsuda, M. H. Mir and S. Kitagawa, Chem. Commun., 2012, 48, 7919–7921 RSC.
- G. K. Kole, G. K. Tan and J. J. Vittal, Cryst. Growth Des., 2012, 12, 326–332 CrossRef CAS.
- B. Dutta, R. Jana, C. Sinha, P. P. Ray and M. H. Mir, Inorg. Chem. Front., 2018, 5, 1998–2005 RSC.
- X. Y. Dong, C. D. Si, Y. Fan, D. C. Hu, X. Q. Yao, Y. X. Yang and J. C. Liu, Cryst. Growth Des., 2016, 16, 2062–2073 CrossRef CAS.
- Y. He, B. Li, M. O'Keeffe and B. Chen, Chem. Soc. Rev., 2014, 43, 5618–5656 RSC.
- M. Alhamami, H. Doan and C. H. Cheng, Materials, 2014, 7, 3198–3250 CrossRef PubMed.
- E. Alvarez, N. Guillou, C. Martineau, B. Bueken, B. Van de Voorde, C. Le Guillouzer, P. Fabry, F. Nouar, F. Taulelle, D. de Vos, J.-S. Chang, K. H. Cho, N. Ramsahye, T. Devic, M. Daturi, G. Maurin and C. Serre, Angew. Chem., Int. Ed., 2015, 54, 3664–3668 CrossRef CAS PubMed.
- K. Naskar, A. Dey, B. Dutta, F. Ahmed, C. Sen, M. H. Mir, P. P. Roy and C. Sinha, Cryst. Growth Des., 2017, 17, 3267–3276 CrossRef CAS.
- L. Xia, Y. F. Xia, L. R. Huang, X. Xiao, H. Y. Lou, T. J. Liu, W. D. Pan and H. Luo, Eur. J. Med. Chem., 2015, 97, 83–93 CrossRef CAS PubMed.
- F. Martins, S. Santos, C. Ventura, R. Elvas-Leitão, L. Santos, S. Vitorino, M. Reis, V. Miranda, H. F. Correia, J. Aires-de-Sousa, V. Kovalishyn, D. A. R. S. Latino, J. Ramos and M. Viveiros, Eur. J. Med. Chem., 2014, 81, 119–138 CrossRef CAS PubMed.
- M. Malhotra, S. Sharma and A. Deep, Med. Chem. Res., 2012, 21, 1237–1244 CrossRef CAS.
- V. Judge, B. Narasimhan, M. Ahuja, D. Sriram, P. Yogeeswari, E. De Clercq, C. Pannecouque and J. Balzarini, Med. Chem., 2013, 9, 53–76 CrossRef CAS.
- P. Dandawate, E. Khan, S. Padhye, H. Gaba, S. Sinha, J. Deshpande, K. V. Swamy, M. Khetmalas, A. Ahmad and F. H. Sarkar, Bioorg. Med. Chem. Lett., 2012, 22, 3104–3108 CrossRef CAS PubMed.
- M. Malhotra, V. Monga, S. Sharma, J. Jain, A. Samad, J. Stables and A. Deep, Med. Chem. Res., 2012, 21, 2145–2152 CrossRef CAS.
- G. Nigade, P. Chavan and M. Deodhar, Med. Chem. Res., 2012, 21, 27–37 CrossRef CAS.
- A. Zumla, P. Nahid and S. T. Cole, Nat. Rev. Drug Discovery, 2013, 12, 388–404 CrossRef CAS PubMed.
- S. Jana, R. Jana, S. Sil, B. Dutta, H. Sato, P. P. Ray, A. Datta, T. Akitsu and C. Sinha, Cryst. Growth Des., 2019, 19, 6283–6290 CrossRef CAS.
- G. Bairy, A. Dey, B. Dutta, P. P. Ray and C. Sinha, Cryst. Growth Des., 2022, 22, 3138–3147 CrossRef CAS.
- B. Dutta, A. Dey, C. Sinha, P. P. Ray and M. H. Mir, Inorg. Chem., 2019, 58, 5419–5422 CrossRef CAS PubMed.
-
J. Tauc, Amorphous and Liquid Semiconductors, Plenum Press, New York, 1974 Search PubMed.
- J. Datta, M. Das, S. Sil, S. Kumar, A. Dey, R. Jana, S. Bandyopadhyay and P. P. Ray, Mater. Sci. Semicond. Process., 2019, 91, 133–145 CrossRef CAS.
- S. Sil, A. Dey, J. Datta, M. Das, R. Jana, S. Halder, J. Dhar, D. Sanyal and P. P. Ray, Mater. Res. Bull., 2018, 106, 337–345 CrossRef CAS.
- F. Ahmed, J. Ortega-Castro, A. Frontera and M. H. Mir, Dalton Trans., 2021, 50, 270–278 RSC.
-
S. M. Sze, Physics of Semiconductor Devices, Wiley, New York, 2nd edn, 1981 Search PubMed.
-
E. H. Rhoderick and R. H. Williams, Metal-Semiconductor Contacts, Clarendon, Oxford, 2nd edn, 1988 Search PubMed.
- S. K. Cheung and N. W. Cheung, Appl. Phys. Lett., 1986, 49, 85–87 CrossRef CAS.
- A. Dey, S. Middya, R. Jana, M. Das, J. Datta, A. Layek and P. P. Ray, J. Mater. Sci.: Mater. Electron., 2016, 27, 6325–6335 CrossRef CAS.
- M. Sahin, H. Safak, N. Tugluoglu and S. Karadeniz, Appl. Surf. Sci., 2005, 242, 412–418 CrossRef CAS.
- M. Campos, L. D. S. Bulhoes and C. A. Lindino, Sens. Actuators, A, 2000, 87, 67–71 CrossRef CAS.
- M. Das, J. Datta, A. Dey, R. Jana, A. Layek, S. Middya and P. P. Ray, RSC Adv., 2015, 5, 101582–101592 RSC.
- R. Jana, A. Dey, M. Das, J. Datta, P. Das and P. P. Ray, Appl. Surf. Sci., 2018, 452, 155–164 CrossRef CAS.
-
K. C. Kao, Dielectric Phenomena in Solids, Elsevier Inc., San Diego, California, 2004 Search PubMed.
- S. Sil, J. Datta, M. Das, R. Jana, S. Halder, A. Biswas, D. Sanyal and P. P. Ray, J. Mater. Sci.: Mater. Electron., 2018, 29, 5014–5024 CrossRef CAS.
- T. Mandal, S. Pathak, A. Dey, M. M. Islam, S. K. Seth, A. A. Masum, J. Ortega-Castro, P. P. Ray, A. Frontera and S. Mukhopadhyay, ACS Omega, 2019, 4, 7200–7212 CrossRef CAS PubMed.
- T. Mandal, A. Dey, S. Pathak, M. M. Islam, S. Konar, J. Ortega-Castro, S. K. Seth, P. P. Ray, A. Frontera and S. Mukhopadhyay, RSC Adv., 2019, 9, 9663–9677 RSC.
- P. Ghorai, A. Dey, P. Brandao, J. Ortega-Castro, A. Bauza, A. Frontera, P. Ray and A. Saha, Dalton Trans., 2017, 46, 13531–13543 RSC.
- S. Halder, A. Dey, A. Bhattacharjee, J. Ortega-Castro, A. Frontera, P. P. Ray and P. Roy, Dalton Trans., 2017, 46, 11239–11249 RSC.
- S. Halder, A. Dey, J. Ortega-Castro, A. Frontera, P. P. Roy and P. Roy, J. Phys. Chem. C, 2016, 120, 25557–25563 CrossRef CAS.
Footnotes |
| † Electronic supplementary information (ESI) available. CCDC 2169715. For ESI and crystallographic data in CIF or other electronic format see DOI: https://doi.org/10.1039/d2ce01128j |
| ‡ Both the authors contributed equally. |
|
| This journal is © The Royal Society of Chemistry 2023 |
Click here to see how this site uses Cookies. View our privacy policy here. 
 f,
Sarita
Sarkar
g,
Basudeb
Dutta
f,
Sarita
Sarkar
g,
Basudeb
Dutta