
 Open Access Article
 This Open Access Article is licensed under a
 Creative Commons Attribution 3.0 Unported Licence
A flexible and sensitive electrochemical sensing platform based on dimethyl sulfoxide modified carbon cloth: towards the detection of dopamine and carvedilol†
Neermunda
Shabana
ab,
Ajith Mohan
Arjun
 a,
Menon
Ankitha
b,
Sabarija A.
Mohandas
c,
Praveena
Gangadharan
cd and
Pathath Abdul
Rasheed
*ab
a,
Menon
Ankitha
b,
Sabarija A.
Mohandas
c,
Praveena
Gangadharan
cd and
Pathath Abdul
Rasheed
*ab
aDepartment of Biological Sciences and Engineering, Indian Institute of Technology Palakkad, Palakkad, 678 557, Kerala, India. E-mail: abdulrasheed@iitpkd.ac.in
bDepartment of Chemistry, Indian Institute of Technology Palakkad, Palakkad, 678 557, Kerala, India
cDepartment of Civil Engineering, Indian Institute of Technology Palakkad, Palakkad, 678 557, Kerala, India
dEnvironmental Sciences and Sustainable Engineering Center, Indian Institute of Technology, Palakkad, Kerala, India
First published on 6th January 2023
Abstract
The determination of neurotransmitters and adrenoreceptor drugs is highly essential due to their specific functions in the human body. In this work, the determination of carvedilol (CAR) and dopamine (DA) was carried out using carbon cloth (CC), which was modified using a facile strategy of drop-casting dimethyl sulfoxide (DMSO). This induced the formation of functional groups without any loss in the structural integrity of CC. The DMSO modified CC (CC-DMSO) was used for the detection of CAR in the range of 1 nM to 10 μM with a limit of detection (LOD) of 120 pM. Similarly, the CC-DMSO was able to detect DA in the range of 10 pM to 10 μM with a highly promising LOD of 0.3 pM. A bending test was also carried out on the electrode and it could be seen that only a negligible variation in sensing capability was observed when the electrode was in the bent form. In addition, the detection of CAR and DA was also carried out in real samples such as human serum. This study reveals that this modification strategy can serve as a versatile and flexible sensing platform for the detection of CAR and DA together in real world medical scenarios.
1. Introduction
Carvedilol (CAR) is a β-adrenoreceptor drug, which causes vasodilation via the α1-adrenergic blockade which can reduce blood pressure in patients.1 From the pharmacological perspective, CAR acts as a β-adrenoreceptor antagonist at low concentrations and also as a calcium channel antagonist at higher concentrations.2 It also has the capability to mitigate tardive movement disorders, psychosis, and depression.3 Dopamine (DA) is a physiologically relevant molecule that plays an important role in many bodily functions like movement, memory, reward, and its deficiency has been known to cause many neurological and mental health related diseases.4 DA was discovered to be a neurotransmitter by Arvid Carlson approximately 50 years ago and the insights provided by Paul Greengard into its cellular signalling mechanisms have had great impact on the development of biological psychiatry and psychopharmacology.5 Hypofunctional states of DA have been known to cause Parkinson's disorder and attentional deficit hyperactivity disorder, and hyperactivity has been known to cause schizophrenia.6 In addition to this, DA also plays an important role in cardiac functions like enhancing the shrinking ability of muscles of the heart and improving vessel ending circulation.3 Hence, it is highly important that the level of DA in the body is maintained within the appropriate limits to ensure normal functioning of the human body. Because of the overlapping roles of both CAR and DA, it is possible that these molecules could be used together. Therefore, it is highly important to ensure that a sensing system is envisaged for analyzing the levels of both molecules individually in the human body.7 Among many methods, which could be applied for the sensing, electrochemical sensing offers a facile, reproducible, and highly sensitive alternative for the detection of these molecules.The electrochemical determination of CAR has been reported on conventional electrodes like the glassy carbon electrode (GCE). Radi et al. used differential pulse voltammetry (DPV) for the determination of CAR using GCE. The molecule could be detected by using this method with an LOD of 0.10 μM with a detection in the linear range of 0.25–10 μM.8 Coelho et al. modified GCE with a molecularly imprinted polymer (MIP) and multiwalled carbon nanotubes for the detection of CAR.9 This method was able to produce linear detection in the range from 50 to 325 μM with an LOD of 16.14 μM. Ordered mesoporous carbon was used to modify GCE for the detection of CAR by Rofouei et al.10 The material was able to produce linearity in sensing CAR in the range of 0.1–23 μM combined with an LOD of 0.034 μM. Even though the determination of CAR has been reported using GCE, a sensing platform, which used a flexible CC has not been reported to the best of our knowledge.
Many reports have focused on the electrochemical detection of DA. Specifically, the use of flexible substrates like carbon cloth (CC) modified with nanoparticles has been extensively reported for the detection of DA.11–13 An attractive avenue that has garnered the attention of researchers is the facile modification of CC with functional groups by treatment with different molecules thus avoiding the use of metals as catalyst centers for DA oxidation. Only a few papers have focused on this aspect. Recently, Ma et al. reported a facile hydrothermal strategy for the treatment of CC with nitric acid using a hydrothermal method.14 This method was reported to introduce oxygen containing groups on the surface of the CC, in addition to improving the hydrophilicity of the cloth. Such a functionalization was able to produce a limit of detection (LOD) of 10 nM in addition to being able to detect DA in the range of 0.1–104.5 μM. Another method was developed by Zhao et al., which involved the development of N, P co-doped mesoporous carbon foam on CC. This method was able to detect DA in the range of 2–200 μM combined with a low LOD of 0.6 μM.15 Both these methods used an extra layer of modification and involved the use of strong acids like nitric acid for modifying CC. The development of a method which does not involve the use of metals or strong acids would prove to be advantageous for the modification of CC.
There is only a single report on the determination of both CAR and DA and this report employed first-order derivative fluorometry to achieve detection.3 Hence, a sensing platform, which uses flexible CC for the electrochemical determination of both CAR and DA would be highly desirable. In this work, we report on the facile modification of CC with dimethyl sulfoxide (CC-DMSO), which is an industrially relevant molecule. The method involved drop casting DMSO on CC followed by drying the electrode to achieve the modification. It was found that the drop casting of DMSO on CC causes the emergence of functional groups on the surface of CC in addition to maintaining the crystal structure of the CC thus making this method a very attractive one for making CC more applicable for electrochemical sensing without the involvement of metal-based nanoparticles. The CC-DMSO electrode was able to detect CAR in the range of 1 nM to 10 μM with an LOD of 120 pM. In addition, the electrode was able to detect DA in the range of 10 pM to 10 μM with an LOD of 0.3 pM, and the lowest detected concentration being 10 pM. In addition to this, the detection of CAR and DA was also carried out in human serum. A bending test was also carried out on the electrode to evaluate the flexibility of the sensing electrode, and it could be seen that only a slight variation in sensing capability was observed when the electrode was in the bent form.
2. Experimental
2.1. Materials
Uric acid (UA), ascorbic acid (AA), dopamine (DA), NaCl, glutathione reduced (GSH), glucose (Glu), sucrose (Suc), glycine (Gly), KNO3, Na2SO4, CaCl2, (NH4)2SO4, carvedilol (CAR), human serum, sodium dihydrogen phosphate, and disodium hydrogen phosphate were purchased from Sigma Aldrich. Carbon cloth (CC) was purchased from Sainergy Fuel Cell India Pvt. Ltd. Dimethyl sulfoxide (DMSO) was purchased from Merck. Deionized water (DI) was used in all the experiments.2.2. DMSO modification of CC
The CC was cut into 1 cm2 pieces and washed thrice in water . The DMSO modification was done by drop casting 85 μL of 1.1 g mL−1 DMSO and heated to 60 °C for different modification times in a hot air oven. After modification, the modified CC samples were stored in an inert atmosphere until further use.2.3. Material characterization
The X-ray diffractograms (XRD) were captured using a 9 kW X-ray diffractometer to characterize the crystal structure of the material. The chemical composition of the catalyst was analyzed by X-ray photoelectron spectroscopy (XPS) (ULVAC-PHI, Inc; model: PHI5000 Version Probe III). The FTIR spectra of the sample were recorded on an IR Tracer 100 spectrometer instrument in the range of 4000–500 cm−1. The morphology and elemental composition of the prepared CC-DMSO were studied by scanning electron microscopy (SEM, Gemini SEM 300, Carl Zeiss) at 1.0 kV accelerating voltage.2.4. Electrochemical analysis
Electrochemical experiments were performed using a CHI6038 workstation with a saturated calomel electrode (SCE), Pt wire, and CC-DMSO as the reference, counter, and working electrodes, respectively. The electrochemical characterizations of CC-DMSO were studied by conducting cyclic voltammetry (CV) in the potential window of −0.2 to 0.6 V (vs. SCE) by using a mixture of 10 mM potassium ferricyanide K3[Fe(CN)6] and 0.1 M KCl as the electrolyte. The electrochemical cell is filled with 20 mL of electrolyte solution and CV was done with a scan rate of 100 mV s−1. Additionally, CV analysis was done in 0.1 M phosphate buffer saline (PBS) solution (pH 6.74) containing varying concentrations of CAR and DA in the potential window of 0.1 V to 0.9 V, and −0.2 V to 0.6 V (vs. SCE), respectively, with a scan rate of 100 mV s−1. Chronoamperometric analysis was done for the quantitative detection of the sensor electrode towards CAR and DA. Scan rate dependence studies of the electrodes towards CAR and DA were performed by varying the scan rate from 20 to 100 mV s−1.3. Results and discussion
3.1. Characterization of DMSO modified CC (CC-DMSO)
The structural morphology was investigated by employing scanning electron microscopy (SEM). Fig. S1† shows the comparisons between the SEM images of CC and CC-DMSO, respectively and there are no changes to the underlying bulk crystallographic texture and structural morphology. Thus, it could be inferred that there are no variations in the topography of the CC even after exposing for 30 min in DMSO. This is further evident from XRD data displayed in Fig. 1(a). As shown in Fig. 1(a), the diffraction peaks seen at 25.8° and 43.7° are attributed to (002) and (101) planes of graphitic carbon of CC.16,17 As expected, there is neither a shift in the characteristic peaks of CC nor the appearance of new peaks in CC-DMSO. Since the two main peaks of CC were well preserved with similar intensities and half-peak widths even after modification with DMSO, it can be concluded that there is no variation within the crystal structure of the CC. In addition, the EDS spectra showed the presence of S and slight increase in the O content in the CC-DMSO (Fig. S2†). This enhancement in the O content along with presence of S in the DMSO treated CC reflects the modification of CC by the S![[double bond, length as m-dash]](https://www.rsc.org/images/entities/char_e001.gif) O group on the CC surface.
O group on the CC surface.
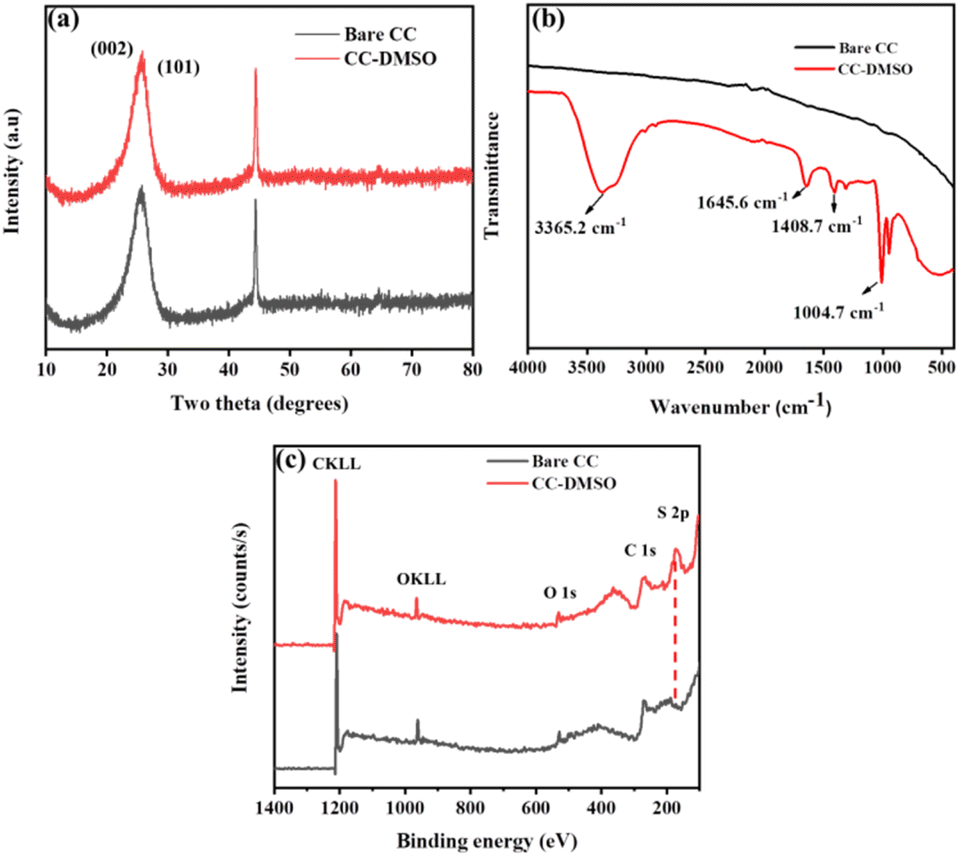 | ||
| Fig. 1 (a) XRD pattern of CC and CC-DMSO, (b) FTIR spectra of bare CC and CC-DMSO, and (c) XPS survey spectra of bare CC and CC-DMSO. The peak for S 2p is visible for CC-DMSO. | ||
The surface functionalization was monitored by analyzing the FTIR spectra before and after modification with DMSO (Fig. 1(b)). The intense band at 1004.7 cm−1 could be attributed to SO vibration stretching modes. The bands present at 1408.7 cm−1 could be attributed to the presence of -COO- .18 The appearance of other peaks at 1645.6 and 3365 cm−1 matches the peaks of DMSO in the standard CAS database list and hence confirms the modification of CC with DMSO.18,19 To confirm the modification of the surface of CC, XPS was employed to carry out the surface chemistry analysis. The survey spectrum shows the peaks corresponding to C 1s and O 1s for bare CC (Fig. 1(c)) with an extra peak for S 2p for CC-DMSO. This additional peak is attributed to the S that originated from the sulphoxide group (SO) of DMSO.20 Additionally, auger peaks corresponding to OKLL and CKLL were also observed in the survey spectra.21,22
The high resolution (HR) scan of C 1s in bare (Fig. 2(a)) and modified CC (Fig. 2(c)) showed similar results. Highly intense peaks at 284.6 eV correspond to C–C/CC bonds owing to the presence of graphitic sp2 carbon atoms.23,24 The peaks at 285.4 and 286.9 eV could be attributed to C–O (O of the hydroxyl) and C–O–C groups, respectively. Similar peaks for C–O and C–O–C were observed for DMSO modified CC as well.25 The HR scan of O 1s in bare CC and CC-DMSO is given in Fig. 2(b) and (d), respectively. The HR scan of O 1s in CC-DMSO reveals the appearance of a peak corresponding to SO at 532 eV, which implies the successful modification of the CC.20 A further confirmation of surface modification is evident from the emergence of the peak at 532.9 eV attributed to O–CO.26 A peak at 534.6 eV appears in both the samples, which corresponds to adsorbed H2O on the CC surface.27 There is also a slight increase in the intensities of peaks at 530.15 eV and 533.8 eV corresponding to the presence of C–O26 and –COOH,24 respectively. The intensity enhancement of these peaks along with the emergence of a new peak at 532.9 eV reflects the successful modification of the CC. In addition, the XPS elemental analysis showed the presence of S and enhancement in the intensity of O in CC-DMSO compared to bare CC (Table S1†).
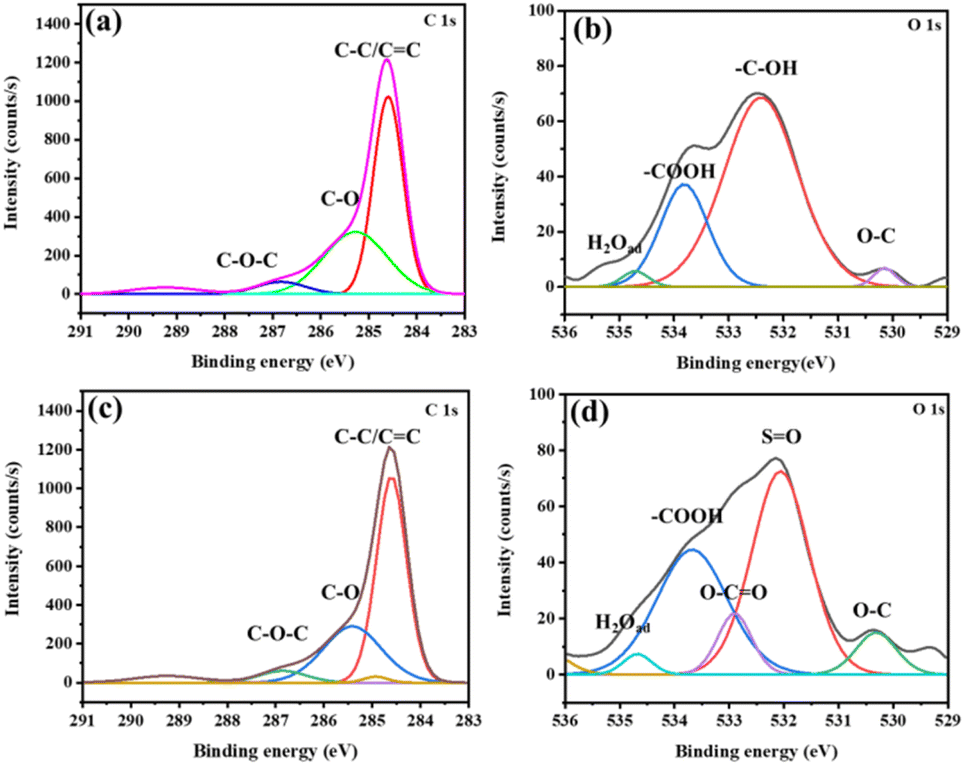 | ||
| Fig. 2 The XPS deconvoluted HR scan for (a) C 1s and (b) O 1s for bare CC. The XPS deconvoluted HR scans for (c) C 1s and (d) O 1s for CC-DMSO. | ||
3.2. Electrochemical analysis
The electrochemical activity of CC-DMSO electrodes with varying modification time was analyzed using CV in a mixture of 10 mM [Fe(CN)6]3−/4− and 0.1 M KCl. The modification was carried out with varying modification time such as 0, 0.5, 1, 1.5 and 2 h by heating at 60 °C. As shown in Fig. S3,† a couple of redox peaks can be observed on the modified electrodes, which correspond to the redox behavior of [Fe(CN)6]3−/4−.28 From the response towards the redox activity of ferricyanide, the CC-DMSO with a modification time of 0.5 h is taken as the best electrode for further studies.To evaluate the electrochemical activity of the CC-DMSO towards the redox peaks of CAR and DA, cyclic voltammetry analysis was carried out at a potential range of 0.1 V to 0.9 V and −0.2 V to 0.6 V, respectively, in 0.1 M PBS solution containing different concentrations of CAR and DA. As shown in Fig. 3(a), two oxidation peaks at 0.69 and 0.74 V were observed for CAR, and the oxidation peaks increase with increasing the concentration of CAR. For DA, the oxidation peak was observed at 0.18 V and the reduction peak was observed at 0.12 V, respectively (Fig. 3(b)). It was found that both the peaks increase with increase in the concentration of DA. These datas confirm that DMSO modification enhances the electrochemical response towards both CAR and DA. Hence, it can be utilized for the highly sensitive detection of CAR and DA. It was proposed that the modification of DMSO on CC introduces more O groups (SO group also), which enhances the adsorption of DA and CAR by electrostatic interactions.
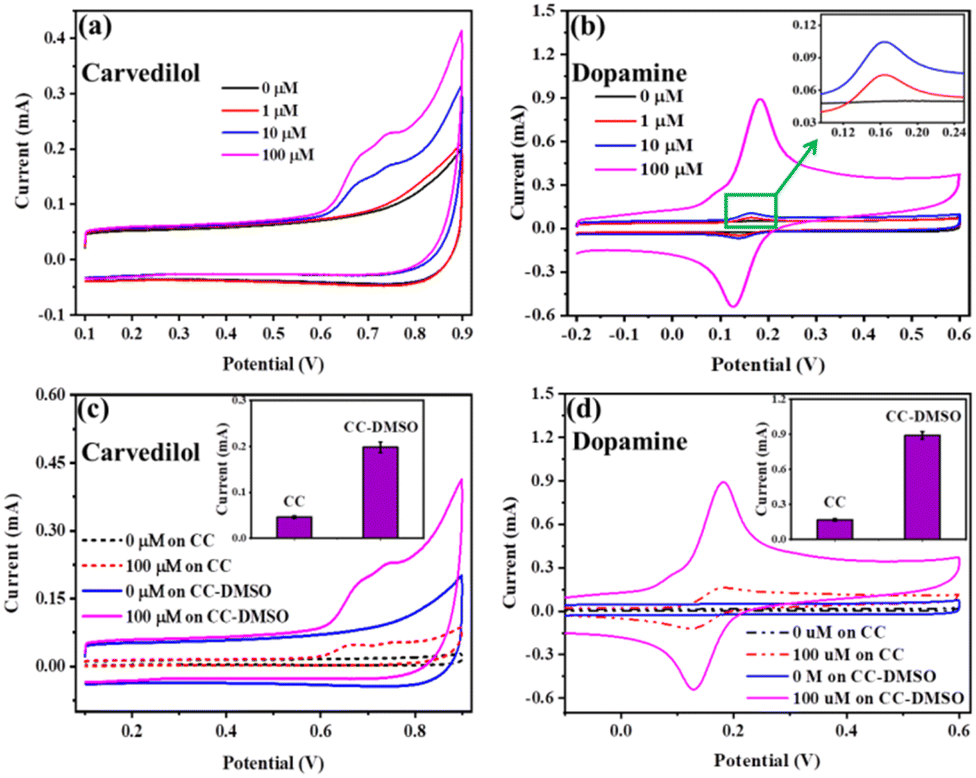 | ||
| Fig. 3 The CV of CC-DMSO in 0.1 M PBS solution containing (a) different concentrations of CAR and (b) different concentrations of DA. The CV of bare CC and CC-DMSO towards (c) CAR (d) DA. Insets of (c) and (d) show the comparison of sensor response between CC and CC-DMSO at 100 μM CAR and DA respectively. The error bar shows the standard deviation of three independent measurements. | ||
To evaluate the effect of DMSO modification of CC, the electrochemical activity of the CC-DMSO towards CAR and DA was investigated and compared with bare CC. It was found that the CC-DMSO showed higher peak current for both CAR and DA compared to bare CC, which could be attributed to the enhanced electrochemical performance of CC-DMSO towards the oxidation of CAR and DA (Fig. 3(c) and (d)).
3.3. Effect of scan rate
The effect of scan rate was analyzed by the CV analysis of CC-DMSO with different scan rates in the potential window of 0.1 V to 0.9 V and −0.2 to 0.6 of in 0.1 M PBS solution containing 100 μM of CAR and DA, respectively. Here, the CC electrodes are functionalized with negatively charged oxide groups; the positively charged DA should be electrostatically attracted and adsorbed to the negatively charged surface of the CC. Analogous to DA, CAR with a basic pKa of 7.8 facilitates the formation of protonated CAR at physiological pH. Formation of such a positive charge on CAR promotes the adsorption of the analyte towards the surface of negatively charged CC.29 The CV data are shown in Fig. S4.† The oxidation peak current of CAR increases linearly as the scan rate increases (Fig. S4(a)†), whereas for DA, both the oxidation and reduction peak currents are in good linear relationship by increasing the scan rate (Fig. S4(b)†). The calibration plot of peak current vs. scan rate for CAR is given in Fig. S4(a’)† and the correlation coefficient value was found to be 0.98651. The calibration plot of peak current vs. scan rate for DA is given in Fig. S4(b’)† and the correlation coefficient value was found to be 0.98243 and 0.98631 for both anodic current and cathodic current, respectively. The data in Fig. S4(a) and (b)† indicate that the oxidation of CAR and oxidation and reduction of DA on the CC-DMSO electrode is an adsorption-controlled process.3.4. Quantitative detection of carvedilol by CC-DMSO
For the quantitative detection of CAR by CC-DMSO, chronoamperometry analysis was carried out at a potential of 0.74 V with varying concentration of CAR from 0 to 100 μM, as illustrated in Fig. 4(a). The current increases with increase in the concentration of CAR from 1 nM to 100 μM. From the chronoamperometry plot, a calibration plot of current (at 6 s) vs. logarithmic concentration of CAR has been drawn, and the calibration plot showed a good linear range from 1 nM to 10 μM with a good regression coefficient of 0.96018 (Fig. 4(a’)). The LOD was calculated from the calibration plot using the 3 sigma method and it is found to be 120 pM. The sensitivity of the sensor was calculated to be 1.36 μA μM−1 in the range of 1 to 10 μM. A comparison of electrochemical sensors for the detection of CAR is given in Table 1. The LOD of the developed CC-DMSO sensor is significantly better than those of all other reported sensors.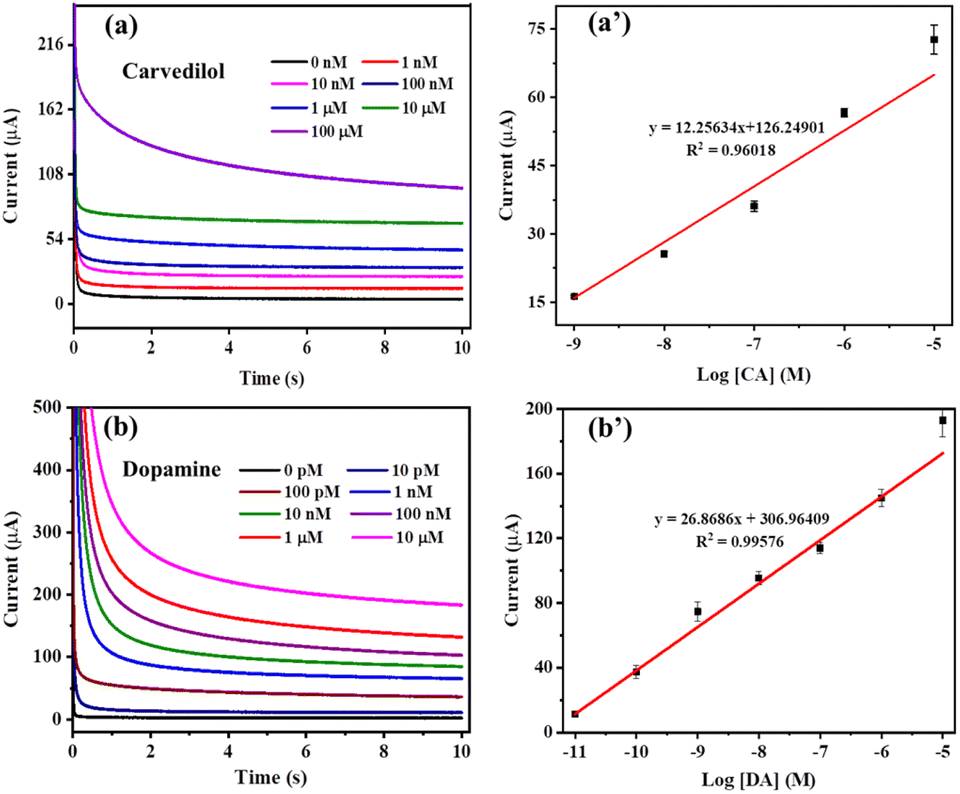 | ||
| Fig. 4 (a) The chronoamperometric response of CC-DMSO at a potential of 0.74 V by varying the concentration of CAR and (a’) the calibration plot of peak current (at 6 s) vs. logarithmic concentration of CAR. (b) The chronoamperometric response of CC-DMSO at a potential of 0.18 V by varying the concentration of DA and (b’) the calibration plot of peak current (at 6 s) vs. logarithmic concentration of DA. The error bar shows the standard deviation of three independent measurements. | ||
| Material | Technique | Linear range | LOD | Sensitivity | Selectivity (in the presence of) | Ref. |
|---|---|---|---|---|---|---|
| GCE | DPV | 0.625–40 μM | 0.25 μM | — | Sucrose, lactose, povidone, colloidal anhydrous silica, crospovidone, and magnesium stearate | 8 |
| MIP and MWCNT modified GCE | CV | 50–325 μM | 16.14 μM | 0.008 μA L μmol−1 | L-cysteine and L-ascorbic acid | 30 |
| Ordered mesoporous carbon/GCE | DPV | 0.1–23.0 μM | 0.034 nM | — | K+, Na+, NH4+, Ca2+, Mg2+, SCN−, NO3−, SCN− | 10 |
| Modified carbon paste electrode | Potentiometric | 0.3 μM–1 mM | 0.15 μM | — | Na+, K+, NH4+, Mg2+, Ca2+, Pb2+, Cu2+, Ba2+, Hg2+, Al3+, Fe3+, glycine cytidine, L-cysteine, glucose, lactose, urea, ascorbic acid, lactic acid, tartaric acid, L-leucine, D-proline | 31 |
| CC-DMSO | Chronoamperometry | 1 nM to 10 μM | 120 pM | 1.36 μA μM−1 | Glu, Suc, Gly, Na2SO4, CaCl2, and (NH4)2SO4 | This work |
| Modification | Technique used | Linear range | LOD | Sensitivity | Selectivity (in the presence of) | Ref |
|---|---|---|---|---|---|---|
| N, P co-doped mesoporous carbon foam on CC | DPV | 2–200 μM | 0.6 μM | 7.94 mA mM−1 cm−2 | DA, AA, Glu, and UA | 15 |
| Acid oxidized CC | Linear sweep voltammetry (LSV) | 0.1–104.5 μM | 10 nM | 9320 μA mM−1 cm−2 | AA, UA, glucose, fructose, lactose, and sucrose | 14 |
| α-Fe2O3 nanoparticles/acid treated CC | Amperometry | 0.074–113 μM | 50 nM | 0.020 μA μM−1 cm−2 | AA and UA | 11 |
| Pt@NP-AuSn/Ni/carbon fiber paper | DPV | 1–10 μM | 0.13 μM | 15.23 μA μM−1 cm−2 | AA and UA | 32 |
| CuSe/CC | Chronoamperometry | 50 nM to 640 μM | 68 nM | 26 μA μM−1 cm−2 | AA and UA | 33 |
| N, O co-doped CC (NOCCs) | DPV | 0.3–55 μM | 0.18 μM | 1.145 μA μM−1 cm−2 | AA and UA | 34 |
| α-MoO3 nanostructure on CC | Square wave voltammetry (SWV) | 1–700 μM | 0.48 μM | 0.008 μA μM−1 | AA and UA | 35 |
| CC-DMSO | Chronoamperometry | 10 pM to 10 μM | 0.3 pM | 2.98 μA μM−1 | AA, Glu, GSH, NaCl and UA | This work |
To evaluate the effect of DMSO modification of CC towards the sensor response, the electroactive area of the bare and DMSO modified CC was estimated by doing CV at different scan rates and the calibration plot of change in current density vs. scan rate was plotted (Fig. S5†). The double layer capacitance (Cdl) of CC and DMSO was found to be 13.14 mF and 20.25 mF respectively, which relate directly to the electroactive area. This shows that the electroactive area is enhanced by 1.54 times after DMSO modification. Additionally, we have analysed the quantitative detection of CAR and DA using unmodified CC. As shown in Fig. S6,† it was found that the unmodified CC was capable of producing the sensor response only in the range of 1 to 100 μM for both CAR and DA even without appropriate regression coefficient values (0.65781 and 0.87609). Also, the response of bare CC towards both CAR and DA is random and non-linear compared to the CC-DMSO. So there is a discrepancy in the sensor response between bare CC and CC-DMSO when we compare the sensor response in terms of electroactive surface area before and after the modification.
3.6. Evaluation of sensor parameters
The selectivity of the developed CC-DMSO sensor towards the drug CAR (Fig. 5(a)) has been evaluated in the presence of common interfering molecules such as Glu, Suc, Gly, Na2SO4, CaCl2, (NH4)2SO4 with 10 times higher concentration. The change in current with respect to the background was used for plotting the selectivity plot in which the background was taken as the response of CC-DMSO in the presence of 0.1 M PBS solution without CAR. The selectivity plot confirmed that there was no interference in the sensor response of CAR in the presence of 10 times higher concentration of interfering molecules. Similarly, the selectivity of the developed CC-DMSO sensor towards the DA (Fig. 5(b)) has been evaluated in the presence of common interferents such as AA, Glu, GSH, NaCl, and UA. The change in current with respect to the background was used for plotting the selectivity plot, and it showed that no interference was observed in the sensor response towards DA in the presence of interferents even at 10 times higher concentrations. Hence, it is confirmed that the developed CC-DMSO sensor showed excellent selectivity towards CAR and DA independently in the presence of other interfering molecules specific to CAR and DA.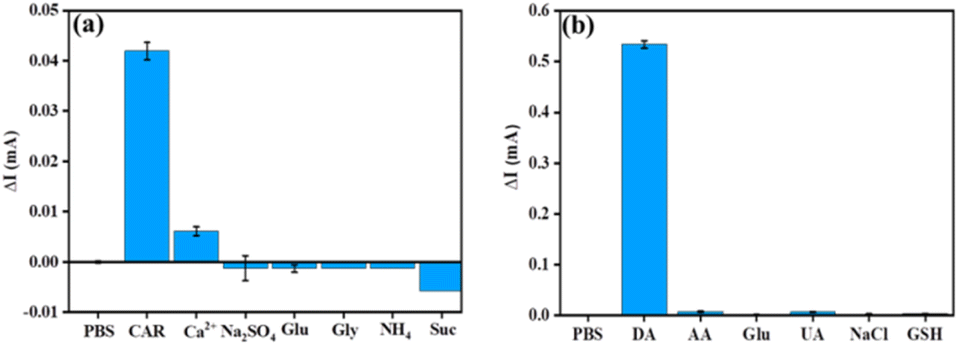 | ||
| Fig. 5 The selectivity plot showing the CC-DMSO sensor response towards (a) CAR detection in the presence of different interfering molecules such as Glu, Suc, Gly, Na2SO4, CaCl2, and (NH4)2SO4. (b) The selectivity plot towards the DA detection in the presence of different interfering molecules such as AA, Glu, GSH, NaCl and UA. The error bar shows the standard deviation of three independent measurements. | ||
The repeatability of the CC-DMSO sensor has been evaluated by measuring the CV for 4 continuous scans in the presence of 100 μM CAR and DA. As shown in Fig. S7((a) and (b)),† there is no significant change in the sensor response between the three consecutive scans for CAR and five consecutive scans for DA. These data confirmed the repeatability of the developed sensor at least for four continuous measurements for CAR and five continuous measurements for DA with the p value less than 0.001 in the paired t test. This shows that this difference is considered to be extremely significant. The reproducibility of the CC-DMSO sensors has been evaluated by taking four different electrodes, and we measured the cyclic voltammogram in the presence of 100 μM CAR and DA. As depicted in Fig. S8(a) and (b),† no significant changes in the current response were observed for three different electrodes in either case, which proves the strong reproducibility of the developed sensor.
The storage stability of the CC-DMSO sensor was evaluated after keeping the electrode at 4 °C for 10 days, and the chronoamperometric analysis was done after 10 days with 10 μM of CAR and DA. The result is given in Fig. S9(a and b),† and it is clear that the sensor reproduced around 98.6% of the initial value of the sensor response for CAR and around 90.7% of the initial value of the sensor response for DA, which reveals the storage stability of the developed sensor.
The flexibility of the developed CC-DMSO sensing platform has also been evaluated by folding the electrode in a bent shape as shown in Fig. 6, and the chronoamperometric analysis was carried out in 0.1 M PBS containing 10 μM CAR and DA. Fig. 6(a) and (a’) show the sensor response in the normal form and bent form, respectively, for CAR, while Fig. 6(b) and (b’) show the sensor response in the normal form and bent form, respectively, for DA. It was observed that the electrode in the bent form reproduced 97.24% of the sensor response in the normal form for CAR and reproduced 95.65% of the sensor response in the normal form for DA, respectively. These data reveal the flexibility of the developed sensing platform towards fabricating flexible sensor devices for the real time detection of different biomolecules.
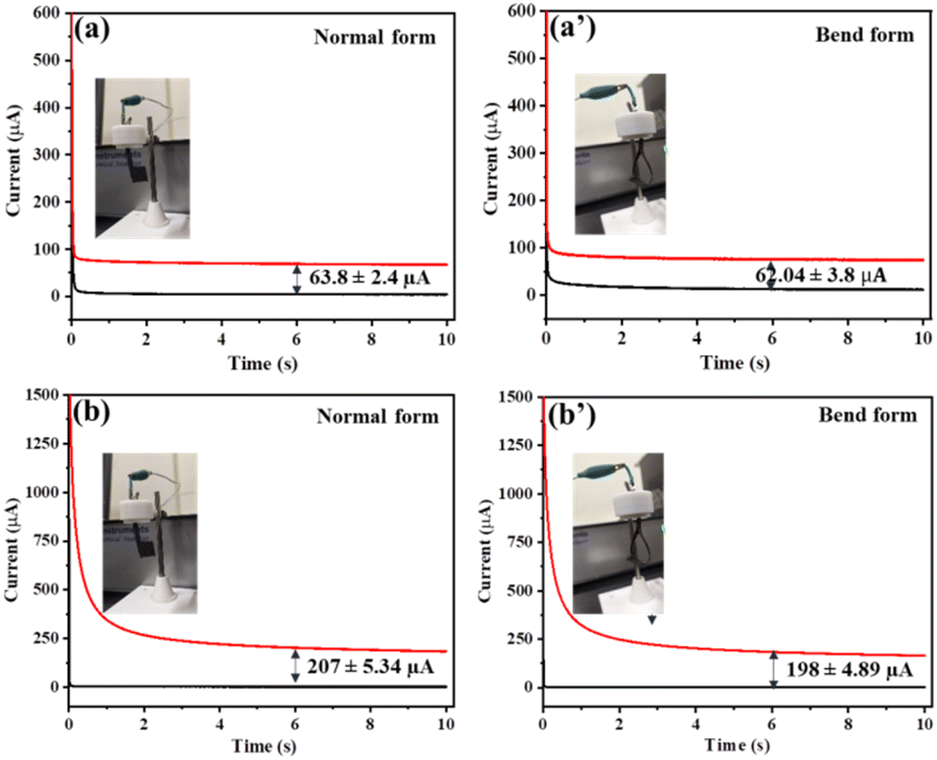 | ||
| Fig. 6 The chronoamperometric response of the electrode for 10 μM CAR (a and a’) and for 10 μM DA (b and b’) in the normal and bent forms showing the flexibility of the developed sensor platform. | ||
3.7. Real sample analysis
To evaluate the practical application of the developed CC-DMSO sensor, both CAR and DA were spiked in human serum and the sensor response was measured. The human serum was purchased from Sigma Aldrich India and diluted to 20 times with 0.1 M PBS solution (pH 7) and different concentrations (100 nM and 100 μM) of CAR and DA were added. The chronoamperometric analysis was used to observe the sensor response in human serum containing CAR and DA and compared with the sensor response in 0.1 M PBS. The recovery of CAR was found to be 91.8–97.6% with an RSD of 1.2–3.1% and the recovery was found to be 98–108% with an RSD of 0.2–1.3% with the p value less than 0.001 in the paired t test. The results showed that the sensor response is highly comparable with the response in PBS, and it revealed that the developed sensor can be used to detect both CAR and DA in real samples such as human serum (Fig. 7(a and b)).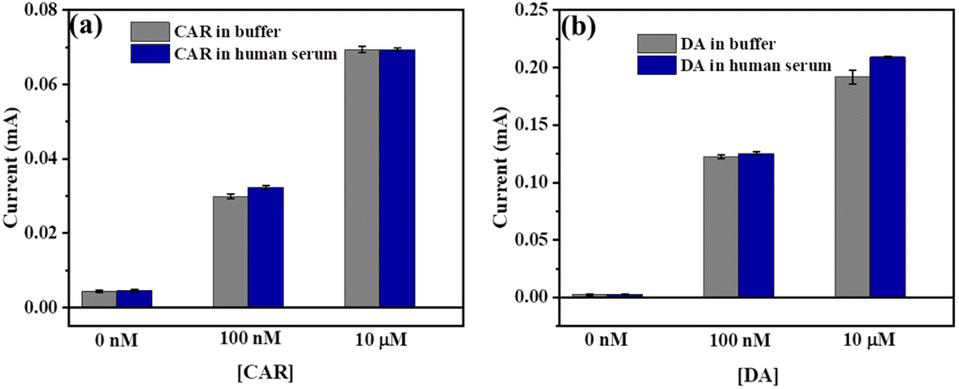 | ||
| Fig. 7 Comparison of CC-DMSO sensor responses towards (a) CAR and (b) DA detection in 0.1 M PBS and in 5% human serum. The error bar shows the standard deviation of three independent measurements. | ||
4. Conclusions
This work focused on the utilization of a very facile modification involving drop casting DMSO on unmodified CC. Drop casting DMSO on CC induces the formation of functional groups that makes the electrode more susceptible to exposure to the electrolyte. The DMSO modified CC (CC-DMSO) electrode was used for the detection of CAR and DA as it exhibits good sensing characteristics. The electrode was capable of detecting CAR in the range of 1 nM to 10 μM with an LOD of 120 pM. Similarly, the electrode could detect DA in the range of 10 pM to 10 μM with an LOD of 0.3 pM. Besides, the CC-DMSO electrode displayed high storage stability, repeatability, reproducibility, and selectivity in addition to its applicability towards the sensing of CAR and DA in human serum samples. Furthermore, a bending test was also carried out on the electrode, and it could be seen that only a slight variation in sensing capability was observed when the electrode was in the bent form. This electrode can serve as a versatile and flexible sensing platform for the detection of CAR and DA in real life scenarios.Data availability statement
Data will be made available on request.Author contributions
Conceptualization-PAR; formal analysis-NS, MA, SAM; investigation-NS, MA, AMA, SAM; methodology-AMA, PAR; supervision-PG, PAR; validation-AMA, PAR; funding acquisition-PAR; project administration-PG, PAR; writing-original draft-NS, MA, AMA, SAM, PAR; writing-review & editing-PG, PAR.Conflicts of interest
The authors declare no conflicts of interests.Acknowledgements
MA acknowledges the junior research fellowship from the University Grants Commission (UGC), Government of India. PAR acknowledges the Ramalingaswami fellowship (BT/RLF/Re-entry/75/2020) from the Department of Biotechnology (DBT), Government of India. The authors acknowledge the Central Instrumentation Facility (CIF), Indian Institute of Technology Palakkad for material characterization. We acknowledge Nanotechnology Research Centre (NRC), SRIMST for providing the XPS analysis facility.References
- D. McTavish, D. Campoli-Richards and E. M. Sorkin, Drugs, 1993, 45, 232–258 CrossRef CAS PubMed.
- R. R. Ruffolo, M. Gellai, J. P. Hieble, R. N. Willette and A. J. Nichols, Eur. J. Clin. Pharmacol., 1990, 38, S82–S88 CrossRef CAS PubMed.
- H. Y. Wang, J. Han and X. S. Chang, Anal. Sci., 2005, 21, 1281–1285 CrossRef CAS PubMed.
- H. Juárez Olguín, D. Calderón Guzmán, E. Hernández García and G. Barragán Mejía, Oxid. Med. Cell. Longevity, 2016, 2016, 9730467 Search PubMed.
- S. D. Iversen and L. L. Iversen, Trends Neurosci., 2007, 30, 188–193 CrossRef CAS PubMed.
- A. A. Grace, Nat. Rev. Neurosci., 2016, 17, 524–532 CrossRef CAS PubMed.
- N. C. Bouchard, J. Forde and R. S. Hoffman, Basic Clin. Pharmacol. Toxicol., 2008, 103, 102–103 CrossRef CAS PubMed.
- A. Radi and T. Elmogy, Il Farmaco, 2005, 60, 43–46 CrossRef CAS PubMed.
- M. K. Coelho, J. D. Giarola, A. T. Da Silva, C. R. Tarley, K. B. Borges and A. C. Pereira, Chemosensors, 2016, 4(4), 22 CrossRef.
- M. K. Rofouei, H. Khoshsafar, R. J. Kalbasi and H. Bagheri, RSC Adv., 2016, 6, 13160–13167 RSC.
- K. P. O. Mahesh, I. Shown, L.-C. Chen, K.-H. Chen and Y. Tai, Appl. Surf. Sci., 2018, 427, 387–395 CrossRef CAS.
- D. Murugesan, K. Moulaee, G. Neri, N. Ponpandian and C. Viswanathan, Nanotechnology, 2019, 30, 265501 CrossRef CAS PubMed.
- Á. Torrinha and S. Morais, TrAC, Trends Anal. Chem., 2021, 142, 116324 CrossRef.
- Y. Ma, Z. Wei, Y. Wang, Y. Ding, L. Jiang, X. Fu, Y. Zhang, J. Sun, W. Zhu and J. Wang, ACS Sustainable Chem. Eng., 2021, 9, 16063–16072 CrossRef CAS.
- L. Zhao, Z. Cai, Q. Yao, T. Zhao, H. Lin, Y. Xiao and X. Chen, Sens. Actuators, B, 2017, 253, 1113–1119 CrossRef CAS.
- K. Lu, Z. Hu, J. Ma, H. Ma, L. Dai and J. Zhang, Nat. Commun., 2017, 8, 527 CrossRef PubMed.
- Z. Huang, Z. Zhang, X. Qi, X. Ren, G. Xu, P. Wan, X. Sun and H. J. N. Zhang, Nanoscale, 2016, 8, 13273–13279 RSC.
- R. Qu, Y. Sun, C. Wang, S. Lu, H. Yu and G. Cheng, J. Appl. Polym. Sci., 2002, 84(2), 310–317 CrossRef CAS.
- M. Ragamathunnisa, E. Vasantha Rani, R. Padmavathy and N. Radha, J. Appl. Phys., 2013, 4, 5–8 Search PubMed.
- T. G. Avval, C. V. Cushman, S. Bahr, P. Dietrich, M. Meyer, A. Thißen and M. R. J. S. S. S. Linford, Surf. Sci. Spectra, 2019, 26, 014020 CrossRef.
- K. Hu, E. Lei, D. Zhao, Y. Li, W. Zhao and H. J. C. Rongab, Anaesthesia, 2020, 75(8), 1086–1095 CrossRef PubMed.
- S. Jiang, B. Yi, C. Zhang, S. Liu, H. Yu and Z. J. J. o. P. S. Shao, J. Power Sources, 2015, 276, 80–88 CrossRef CAS.
- W. Tang, X. Wang, G. Zeng, J. Liang, X. Li, W. Xing, D. He, L. Tang and Z. Liu, Environ. Sci. Technol., 2019, 53, 2670–2678 CrossRef CAS PubMed.
- Y. Ma, Z. Wei, Y. Wang, Y. Ding, L. Jiang, X. Fu, Y. Zhang, J. Sun, W. Zhu and J Wang, ACS Sustainable Chem. Eng., 2021, 9, 16063–16072 CrossRef CAS.
- A. Ganguly, S. Sharma, P. Papakonstantinou and J. Hamilton, J. Phys. Chem. C, 2011, 115, 17009–17019 CrossRef CAS.
- B. Shi, Y. Su, Y. Duan, S. Chen and W. Zuo, Microchim. Acta, 2019, 186, 1–10 CrossRef CAS PubMed.
- S. Yamamoto, H. Bluhm, K. Andersson, G. Ketteler, H. Ogasawara, M. Salmeron and A. Nilsson, J. Condens. Matter Phys, 2008, 20, 184025 CrossRef.
- P. A. Rasheed, R. P. Pandey, K. Rasool and K. A. Mahmoud, Sens. Actuators, B, 2018, 265, 652–659 CrossRef.
- T. Loftsson, S. B. Vogensen, C. Desbos and P. Jansook, AAPS PharmSciTech, 2008, 9, 425–430 CrossRef CAS PubMed.
- M. K. L. Coelho, J. D. F. Giarola, A. T. M. Da Silva, C. R. T. Tarley, K. B. Borges and A. C. Pereira, Chemosensors, 2016, 4, 22 CrossRef.
- A. Soleymanpour and M. Ghasemian, Measurement, 2015, 59, 14–20 CrossRef.
- H. Yang, J. Zhao, M. Qiu, P. Sun, D. Han, L. Niu and G. Cui, Biosens. Bioelectron., 2019, 124–125, 191–198 CrossRef CAS PubMed.
- S. Umapathi, J. Masud, H. Coleman and M. Nath, Microchim. Acta, 2020, 187, 440 CrossRef CAS PubMed.
- X. Xi, D. Wu, W. Ji, S. Zhang, W. Tang, Y. Su, X. Guo and R. Liu, Adv. Funct. Mater., 2020, 30, 1905361 CrossRef CAS.
- D. Murugesan, K. Moulaee, G. Neri, N. Ponpandian and C. Viswanathan, Nanotechnology, 2019, 30, 265501 CrossRef CAS PubMed.
Footnote |
| † Electronic supplementary information (ESI) available. See DOI: https://doi.org/10.1039/d2ay01922a |
| This journal is © The Royal Society of Chemistry 2023 |