 Open Access Article
A smart chitosan-graphite molecular imprinted composite for the effective trapping and sensing of dimethyl methylphosphonate based on changes in resistance
James
Disley
a,
Guzmán
Gil-Ramírez
 a,
Peter
Eaton
ab and
Jose
Gonzalez-Rodriguez
 *a
*a
aUniversity of Lincoln, School of Chemistry, Joseph Banks Laboratories, Green Lane, LN6 7DL, Lincoln, UK. E-mail: jgonzalezrodriguez@lincoln.ac.uk
bThe Bridge, University of Lincoln, 4 Edgewest Road, Lincoln LN6 7EL, UK
First published on 1st September 2023
Abstract
A molecular imprinted polymer (MIP) fabricated from a chitosan doped with graphite to create a conductive composite (CG-MIC) with the ability to trap and detect dimethyl methylphosphonate (DMMP) through a change in resistance of the material has been successfully manufactured. The GC-MIC presented a maximum trapping capacity of 96 ppm (0.096 mg g−1) of DMMP. A similar non-imprinted composite made of chitosan-graphite (CG-NIC) had a surface adsorption of 48 ppm (0.048 mg g−1) of DMMP. The manufacturing process was tested for consistency and there were no significant differences in resistance between batches of CG-MIC before (around 450 Ω) and after (around 70 Ω) DMMP extraction, representing a homogeneous manufacturing process. Although Atomic Force Microscopy studies revealed that the graphite was not homogenously distributed throughout the chitosan matrix, the response was consistent. The changes in the concentration of DMMP within the self-sensing material, being proportional to those in gas concentration, could be followed by the changes in resistance. The inclusion of common interferents: Acetic acid, acetone, ethanol, ammonium hydroxide and 2-propanol, equivalent in concentration to the DMMP, caused a change in the resistance of the material but did not substantially affect the specific resistance response of the composite material. Based on this data, the CG-MIC could be used as a smart material with sensing capabilities to monitor trapping levels of DMMP.
1 Introduction
In the last 30 years, there have been several reports of Novichok poisoning occurring around the world. The most notable being the case of Sergei Skripal and his daughter Yulia in 2018, who were found unconscious and taken to the Salisbury National Health Service (NHS) Foundation Trust.1 Later, Detective Sergeant Nick Bailey would be admitted to the hospital with the same symptoms, and it was quickly determined he had come into contact with the same toxic substance.2 Several days later it would be announced the Skripal's and Mr Bailey had been poisoned with an unknown nerve agent, with 46 more members of the local community coming forward to express concern.3Experts from the Organisation for the Prohibition of Chemical Weapons (OPCW) took samples from several locations known to the victims and determined it to be a Novichok nerve agent.4 The highest concentration of the agent was found to be on the handle of Mr Skripal's car.5 These findings were also confirmed by the Defence Science and Technology Laboratory (DSTL) in Porton Down. It is believed up to 131 people could have come into contact with the poisonous substance.3
Novichok is the newest form of nerve agent and very little is known. However, the nerve agent it-self dates all the way back to World War 2. The G- agents (Tabun, Sarin, Soman) were created under project Trilon; a military project commissioned by the Nazi government.6 The V Agents (VX, VE, VG, VM) were later created in the 1950s through a partnership between the United Kingdom and the United States.7 With the Novichok nerve agent being the latest addition, its conception is believed to have been a part of the soviet chemical warfare program in the 1970s, codename: Foliant.1
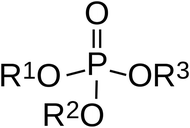
Nerve agents are organophosphorus compounds (OPCs) that contain an oxygen atom bound to a phosphorus atom (phosphoryl bond), two alkyl substituents (R1 & R2) and a leaving group (R3) as shown in Fig. 1.8,9 This is the most common structure but there are many other variations that make the group quite varied. For example, a suspected structure for the Novichok agent 2324 would involve R1 = CH3, R2 = F (no oxygen) and R3 = N2C5H13. The broad range of configurations available for residues and leaving groups makes it difficult to produce a classification system for all derivatives.10 Some examples include phosphonate, phosphorofluoridate, phosphorthioamidate and phosphates but all OPCs are derivatives of phosphoric, phosphonic or phosphinic acids.8 To reduce the toxicity for mammals, the oxygen atom can be substituted with a sulphur atom to create a thiophosphoryl bond.
Organophosphorus compounds can cause a wide range of symptoms this can include vomiting, dyspnoea, eye pain, meiosis rhinorrhoea, bronchoconstriction, bronchorrhea and bradycardia.11 This is caused by the inhibition of acetyl cholinesterase (AChE), an enzyme required by the body to regulate the amount of acetylcholine (Ach) in the synapses. Without regulation the respiratory muscles are paralysed, and the onset of respiratory paralysis occurs.12
The chemical weapons convention (CWC) has banned the use of all chemical weapons and associated equipment. However, from recent cases, it is clear the convention has not got complete control over the agent.4 This leaves the door open for potential attacks on the public by terror groups and hostile territories. As a result, public services must have access to the most up to date protective equipment.
The Homeland Security Research Program (HSRP) developed by the Environmental Protection Agency (EPA) in the United States have a list of recognised methodologies for the detection of chemical warfare agents (CWA).13 Samples are typically collected by specialised wipes14 or sorbent polyurethane foam cartridge15,16 and sent to accredited laboratories. Normally gas chromatography mass spectrometry (GC-MS) or liquid chromatography mass spectrometry (LC-MS) will be used for the analysis. However to quickly confirm the presence of CWAs there is a need for effective onsite screening methods.17 This can involve handheld electronics, commercial kits, colour-changing tubes and test paper for the identification of CWAs18 Current methods that are commercially available have several drawbacks for example the Draeger Civil Defence Kit can produce false positives or colour indicating tubes can be time consuming.18,19 Furthermore, these methods are not smart materials and do not inform of quantities or whether the contaminant is present in the material.
The main form of PPE available for chemical warfare is a respirator. A common respirator contains activated carbon in the filter, a process dating all the way back to WW1.20 Activated carbon is a porous material that can absorb compounds with low saturation vapor pressures.21 However, in order to absorb compounds with high saturation vapor pressures, the activated carbon has to be modified. Potassium hydroxide can be impregnated into the material for acidic gasses while phosphoric acid could be used basic gases. These types of activated carbon are typically referred to as impregnated carbon.22 Metals can also be used as impregnant materials for activated carbon and this includes Cu, Zn, Ag, V and triethylenediamine. These are typically found in military-grade activated carbon while the use of triethylenediamine is classed as nuclear-grade activated carbon.21 The National Institute for Occupational Safety and Health has 9 different categories for air respirators: N (95, 99, and 100), P (95, 99, and 100), and R (95, 99 and 100). The letter determines whether the mask is resistant to oil while the number is the minimum filtering efficiency as a percentage. Not oil resistant is classed as ‘N’, somewhat resistant is ‘R’ and strongly resistant is “P”.23 In 2010, the British army was issued with the General Service Respirators (GSR) to replace the S10, a gas mask that the British army had used for over 30 years.24
Chitosan has proven to be an effective material to trap dimethylmethylphosphonate (DMMP), therefore the ability could be potentially exploited for the detection of DMMP. The abundance of oxygen, nitrogen and the alcohol acidic protons make it a good selection to interact with a molecule like DMMP. Chitosan can be manufactured from the deacetylation of chitin which can be found in discarded seafood. Which also happens to be the second most abundant natural biopolymer in the world, approximately 6–8 million tonnes of biowaste is produced a year from the seafood industry.25
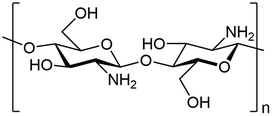
Chitosan has been made in to several different base materials, this includes films, membranes, nanoparticles, gel beads, sponge and fibres.26 The chemical and physical characteristics of chitosan include inherent antimicrobial activity, biocompatibility, biodegradability, large availability, and presence of functional groups for chemical modifications.27 The large abundance of hydroxy and amino groups used for modification can be accredited to the repeating units of glucosamine and N-acetylglucosamine that form the co-polymer (Fig. 2).28
This study follows on the work done by Disley et al.17 and it is an evolution on our previous work. Although there has been some studies based on the sensing of volatile organic compounds in the gas phase using molecular imprinting.29 To the best of our knowledge there is no literature on the implementation of smart sensing and filtering materials for the trapping and identification of organophosphorus compounds. There has been work on the detection of DMMP using changes in amplitude although this was a relatively big system and would not be considered portable.30
Many trapping materials used in filters and gas masks lack the ability to detect and evaluate the efficiency of trapping. This paper uses the concept of self-sensing materials, where a material designed for a function also offers an additional source of information. In our case, the designed material presents the ability not only to selectively trap but also to inform of the presence of the substance of interest and evaluate the capacity and amount trapped. In this paper an evaluation of the adsorption capabilities, the selectivity, and the capacity of the chitosan-graphite molecularly imprinted composite (CG-MIC) and the ability to inform of the presence and capacity of trapping using the resistance of the material have been reported. This is specially a useful detection method to easily implement in filters and gas masks.
2 Experimental
2.1 Materials
Acetic acid, acetone, chitosan, citric acid, dimethyl methylphosphonate (DMMP), graphite powder, methanol (MeOH) and 2-propanol were purchased from Sigma-Aldrich (Dorset, UK). Ammonium hydroxide and ethanol were purchased from Fisher Scientific (Loughborough, UK). All chemicals are analytical grade.2.2 Instruments
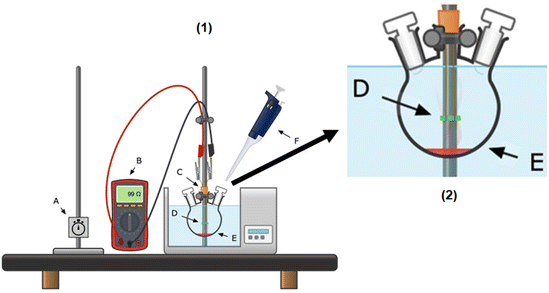
Resistance was measured using a Duoyi Dy4106 Automotive Circuit Resistance Tester (Duoyi Instrument, Guangzhou City, China). A Vega 4 scanning electron microscope (SEM) from Tescan (UK), a HR-AFM atomic force microscope from AFM Workshop (USA) and a spectrum 100 Fourier-transform infrared spectrometer (FTIR) by PerkinElmer (UK) was used to characterise the CG-NIC and CG-MIC. Data obtained from the FTIR were recorded and processed using Spectrum (PerkinElmer) under the following condition: range 4500–400 cm−1; units: % transmittance; scan number: 16; resolution: 4.00 cm−1. The SEM settings were as follows: working distance of approximately 10 mm, operating at 10 kV and approximate spot size of 80 nm. The micrographs were collected in secondary electron mode and captured using TESCAN Essence software. For the AFM, a 100 × 100 × 17 μm scanner was used, measurements were set to vibrating mode and all samples were scanned in 10 and 2 μm square areas. NSG-10 cantilevers from NT-MDT were used with a resonant frequency about 200 kHz. All data was processed using Gwyddion 2.60 software and the surface texture measurements were made in 10 μm areas.2.3 Apparatus
2.4 Methods
3 Results and discussion
3.1 Preparation of the CG-MIC and extraction of DMMP
The modification described in section 2.4.1 allowed the molecularly imprinted polymer (MIP) to be conductive and act as a smart material designated CG-MIC. To ensure a resistance change could be detected, a resistance study was carried out on the extraction of the DMMP. The resistance of the material was recorded and then the material was submerged for 30 min and the left to dry. Based on previous work, methanol is an effective solvent to extract DMMP from the polymer matrix.31 Once the material was dry, the resistance was recorded for the second time and the data is presented in Table 1. This test was conducted on three separate batches of GC-MIC and readings taken in triplicate.| Different batches of CG-MIC + CG-NIC reference | Resistance before extraction (Ω) | Resistance after extraction (Ω) |
|---|---|---|
| CG-NIC | 362 ± 91 | 173 ± 25 |
| CG-MIC batch 1 | 442 ± 27 | 78 ± 14 |
| CG-MIC batch 2 | 464 ± 78 | 70 ± 16 |
| CG-MIC batch 3 | 449 ± 33 | 62 ± 16 |
The data shows a significant drop in resistance after the methanol extraction suggesting the presence of the DMMP alters the resistance of the CG-MIC. There was no significant difference between different batches of CG-MIC and CG-NIC, representing a homogeneous manufacturing process. The resistance changes of the CG-MIC were also compared against the resistance changes of the CG-NIC (Table 1), to ensure the methanol was not the altering factor. The resistance of GC-NIC has approximately halved while the resistance of the GC-MIC after the methanol wash is approximately 1/7 of what it used to be. This dramatic change in resistance can only be explained by the removal of the DMMP and not the methanol wash. Therefore, the methanol extraction for 30 min after production was implemented into the method.
3.2 Characterisation of the material
FTIR spectroscopy measurements were conducted on the CG-MIC (triplicate) and CG-NIC (triplicate) and presented in Fig. 5. The CG-MIC and CG-NIC share similar regions with one another: 3500–3300 cm−1 (O–H), 3000–2800 cm−1 (N–H), 1900–1600 cm−1 (C–H) and 1200–900 cm−1 (C–O). The main difference between the two materials is the % transmittance, with several peaks belonging to the CG-MIC's increasing in intensity. This could be attributed to ionic bonding taking place between the Chitosan and the DMMP inside the polymer matrix.33 Overall, the inclusion of the DMMP into the polymer matrix has caused the % transmittance to decrease and produce two spectra that share key elements.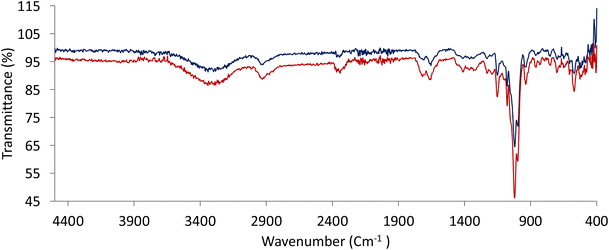 | ||
| Fig. 5 FTIR Spectra for the CG-MIC complete in triplicate (dark red) and the CG-NIC completed in triplicate (dark blue). | ||
Based on micrographs obtained from the AFM, the graphite is distributed throughout the chitosan matrix, based on Fig. 6A graphite flakes (light colour) are embedded into the chitosan and protrude outwards. Although as previously thought, the graphite is not homogenously distributed throughout the chitosan as seen in Fig. 6B. Also, different sized fragments of graphite can be observed throughout the material. Therefore, further work could have to be conducted to ensure the suspension is homogenous during the manufacturing process.
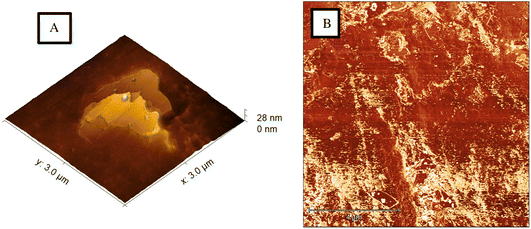 | ||
| Fig. 6 (A) 3D AFM height image showing graphite fragments embedded in the chitosan matrix. (B) AFM phase image showing heterogeneity of the graphite in chitosan matrix material. | ||
3.3 Resistance study
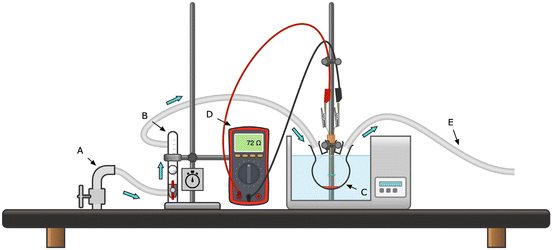
The change in resistance of the CG-NIC and CG-MIC in the presence of DMMP was monitored over a duration of 60 min, a reading was taken every 5 min. After 60 min, N2 gas was passed through the system to remove the DMMP and clean the sensing element. The resistance changes recorded have been presented in Fig. 7. It is clearer that the increase of resistance is due to the presence of the DMMP molecules. In the presence of DMMP the resistance of the CG-MIC significantly increases compared to the CG-NIC, as seen by the different slopes. The greater slope shown by the GC-MIC would suggest that DMMP gets inserted in the created cavities within the polymer matrix creating a greater electrical resistance of the material. This change on the electrical properties can be used to monitor the concentration and the trapping of the organophosphorus compound. This change of resistance can be explained due to the chemical nature and structure of the chitosan, as the oxygen atoms present in the DMMP can form hydrogen bonds with the hydroxy (–OH) and amino (–NH2) functional groups of the chitosan.34,35 Also, the inclusion of the graphite is key to bridge the different chitosan structures with a highly conductive material. Depending on the configuration of the molecule, an induced dipole could be occurring between the DMMP and the chitosan.36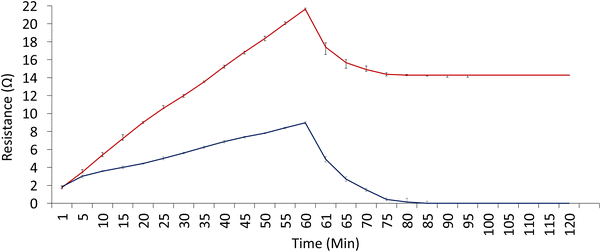 | ||
| Fig. 7 A comparison of the change in resistance for the CG-NIC (dark blue) and CG-MIC (dark red) in the presence of DMMP. | ||
Furthermore, the CG-NIC can return to its original resistance after approximately 30 min (the period between 60 min and 90 min on Fig. 7) while the CG-MIC only fractionally decreases in resistance. This suggests the interaction (van der Waals) between the DMMP on the surface of the CG-NIC and CG-MIC is weaker and some of the DMMP can be dragged by the N2 gas.36 As the CG-NIC behaviour can be explained by just surface DMMP adsorption, the removal of the DMMP causes the resistance to return to its original value. As the imprinting process produce cavities, and the chemical nature of the chitosan polymer favours 3D hydrogen bonding with DMMP, the interactions in this case are stronger than those attributed to weaker 2D Wan der Waals (VdW), formed on the surface of the polymer, causing only a small decrease in resistance. The greater number of bonding sites in the imprinting together with the stronger nature of hydrogen bonding explain why nitrogen cannot drag the DMMP molecules from the cavities, while it is able to do so with weaker and fewer VdW interactions on the surface. Also, the surface is more exposed than the inner spaces in the polymer.
This is also important, as the structure of the CG-MIC guarantees that the trapped toxic is not released easily after being trapped.
3.4 Selectivity
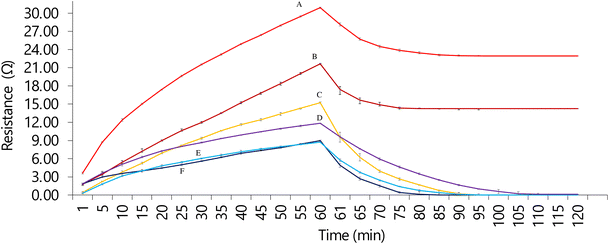
The selectivity of the sensing element was tested against a selection of interferents. Acetic acid, acetone, ethanol, ammonium hydroxide and 2-propanol are common interferences used in protective material and senor development.31,37,38 The interferences also act as impurities that could be potentially found in a dirty bomb or improvised explosive device (for example, acetone is a product of the decomposition of TATP). For example, during the Gulf war US personnel were exposed to a mixture of chemicals that included nerve agents when the Khamisiyah chemical depot was destroyed.39The study was carried out using the method outlined in 2.4.6. Over a 60 min period the resistance of the CG-MIC and CG-NIC were recorded and then cleaned with nitrogen gas. The first experiment involved the sensing element in the presence of just the interferences and then the second experiment to include the DMMP with the interferences. This data obtained has been summarized in Fig. 8 with the data from the CG-MIC and CG-NIC in the presence of DMMP included for comparison.
The CG-MIC and CG-NIC in the presence of the interferences and the DMMP interference mixture demonstrates the same pattern seen in 3.3, with a significant increase in resistance for the CG-MIC. The interferences on their own can cause the resistance to change but is lower than just the DMMP. When the sensing element is in the presence of both the DMMP and the interferences, the resistance increases beyond what was recorded for just the DMMP. This suggests the interferences bond to different parts of the material without effecting the DMMP sites. The presence of O, N and H in the structure of the polymer will favour these non-specific interactions. However, they will not bond to the recognition sites as they do not have the adequate size. This will effectively shift the baseline, so if the interferences are known, they can be deducted from the DMMP interference mixture resistance to obtain a true measure of the presence of DMMP. This can be easily achieved by pre-loading calibrations in a chip.
3.5 Capacity
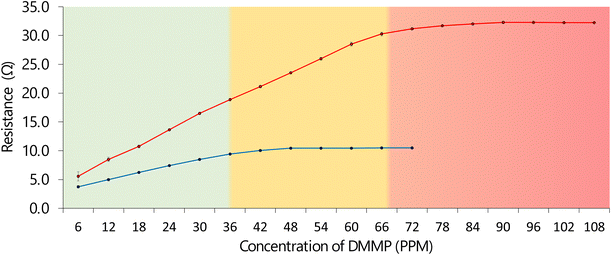
Based on the DMMP isotherms reported in Disley et al. 2023,31 an approximation within the chamber can be made. The capacity of the material for DMMP was examined and recorded until the resistance plateaued. Based on the data in Fig. 9, 20 mg of the CG-NIC has an approximate capacity of 48 ppm (0.048 mg g−1), while 20 mg of the CG-MIC has an approximate capacity of 96 ppm (0.096 mg g−1). Furthermore, the CG-MIC continues to have larger increases in resistance than the CG-NIC, for example 30 ppm equals 16.5 Ω, 60 ppm equals 28.5 Ω and 90 ppm equals 32.3 Ω.The material originally reported in Disley et al. 202331 (chitosan MIP) had a capacity of 4554 ppm (4.55 mg g−1) for 500 mg of the material. To compare, 20 mg of this material corresponds to approximately 182 ppm (0.182 mg g−1), which is double obtained for the CG-MIC. This is mainly due to the graphite inclusions. However, the new material possesses enhanced abilities in terms of identification and sensing capabilities as it is conductive and can detect the presence of DMMP. This ability could be used to create a smart gas masks and filters for vehicles or facilities, where the trapping capacity of the material is monitored by a traffic light system. For example, when the system is empty it is green, at 50% amber and near 100% its red. Furthermore, when the CG-MIC is compared to activated (500 mg = 82 ppm/0.082 mg g−1) tested in Disley et al. 2023,31 the CG-MIC remains superior, because it is now selective and through its conductivity can be used as self-sensing system. There has successfully been the incorporated of the best properties of the graphite and chitosan MIP to create the GC-MIC, a new smart composite. Also, the system can be used as an early warning system when the mask is up, as the high change in resistivity is associated with the trapping of the DMMP.
3.5 Extraction damage
In the previous work by Disley et al.,31 the chitosan MIP was affected by multiple methanol washes. After three or four washes, the cavities inside the material were damaged and no longer were selective to DMMP. As methanol is an effective solvent for removing DMMP out of the polymer matrix, the number of washes were reduced. Unfortunately, a single wash can still damage the CG-MIC as seen in Fig. 10, an obvious change has occurred on the surface of the material after one methanol wash. Based on the calculation of the AFM obtained through TESCAN Essence™ EDS the roughness has increased from 0.877 nm to 26.93 nm and the projected area has increased from 1 to 1.008. It could be argued the projected area has increased due to the cavities becoming available however, when the CG-NIC was compared to its processed counterpart the roughness had increased from 1.26 nm to 44.35 nm and the projected area increased from 1 to 1.025. | ||
| Fig. 10 A comparison of the change in surface morphology of the CG-MIC (A) before and (B) after a single methanol wash captured by AFM height images. | ||
This would suggest the area has not increased due to the availability of the cavities and instead the surface has been damaged by the methanol treatment, this is further supported with images captured with SEM (Fig. 11). However, as commented in Disley et al.,31 those materials dedicated to trap chemical warfare agents in gas masks are not deemed to be reused or recycled for obvious reasons. This is why the single use of this sensing/trapping material would not diminish its usability in filter systems.
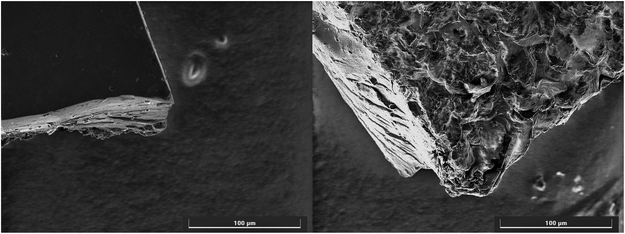 | ||
| Fig. 11 A comparison of the change in surface morphology of the CG-MIC after a single methanol wash captured by SEM imaging. | ||
3.6. Self-sensing materials
There are not many examples in the literature on the use of self-sensing materials for the combined identification and trapping of chemical warfare agents (CWAs) in materials, making the work presented here highly innovative. Most of DMMP sensors are designed to monitor the concentration of DMMP in the surrounding area, however ignoring the amounts trapped in gas masks or filtering devices used to protect personnel. It is true that the self-sensing material in the gas mask can indirectly inform of the presence of the CWAs in the atmosphere following the changes in resistance and can inform of the level of the threat though the increase %capacity of the organophosphorus. However, a direct comparison with existing sensor for gas phase cannot be made. The closest technology to the one presented in this work, using imprinting methods, is that reported by Pan et al.,40 where a surface acoustic wave array sensor based on supramolecular self-assembling imprinted films for different simulants of CWAs has been described. The sensor in this case is an atmospheric sensor, where trapping capacity is not reported. It presents an excellent limit of detection of 10 ppb (considering that 15 ppb is the lethal dose for sarin gas) for real field applications.There is a wide trend to incorporate self-sensing materials in many areas of defence, environmental protection and assessment of building materials. The assessment of the state of the material, adsorption of substances and the consequences of such actions can have consequences in the material itself or the users.
4 Conclusions
In this work, a CG-MIC was successfully manufactured with the ability to change its resistance in the presence of DMMP. Based on the data, the CG-MIC outperforms the CG-NIC with a capacity of approximately 96 ppm (0.096 mg g−1) of DMMP compared to 48 ppm (0.048 mg g−1) of DMMP for the CG-NIC. The CG-MIC is an evolution of the material manufactured in our previous work. The inclusion of graphite into the polymer matrix has made it possible to detect the presence of DMMP through the change in the materials resistance. The increase in resistance for the CG-MIC is beyond double when compared to the CG-NIC, this can be attributed to the selective cavities inside the composite matrix for DMMP. Surface interactions are also found to be beneficial and cause an increase in resistance. However, the van der Waals forces between the sensing element and DMMP can be weakened by N2 gas. Furthermore, methanol washes cause the roughness of the material to increase from 0.877 nm to 26.93 nm. Although the chitosan MIP has a larger capacity than the CG-MIC: 96 ppm (0.096 mg g−1) and 182 ppm (0.182 mg g−1) respectively. The chitosan MIP lacks conductivity and without this property the chitosan MIP has a smaller range of applications when compared to the GC-MIC. This technology has the potential to be adapted into creating a smart filter for gas masks, where the filter capacity and threat identification is monitored by a traffic light system hyphenated to a small electronic resistor. The reproducible change of resistivity to DMMP, observed in different batches, when presented to different concentrations of the organophosphorus compound allows to establish a permanent calibration that can be embedded in a circuit and used as a reference to establish the presence of the compound and the level of filter saturation.Author contributions
The manuscript was written through contributions of all authors. All authors have given approval to the final version of the manuscript. Conceptualization: James Disley, Jose Gonzalez-Rodriguez; data curation: James Disley; formal Analysis: James Disley; investigation: James Disley, Peter Eaton; methodology: James Disley, Guzmán Gil-Ramírez, Jose Gonzalez-Rodriguez; project administration: James Disley, Jose Gonzalez-Rodriguez; supervision: Guzmán Gil-Ramírez, Jose Gonzalez-Rodriguez; writing – original draft: James Disley; writing – review & editing: James Disley, Guzmán Gil-Ramírez, Jose Gonzalez-Rodriguez, Peter Eaton.Abbreviations
| NHS | National health service |
| OPCW | Organisation for the prohibition of chemical weapons |
| DSTL | Defence science and technology laboratory |
| AChE | Acetyl cholinesterase |
| Act | Acetylcholine |
| CWC | Chemical weapons convention |
| HSRP | Homeland security research program |
| EPA | Environmental protection agency |
| CWAs | Chemical warfare agents |
| GC-MS | Gas chromatography mass spectrometry |
| LC-MS | Liquid chromatography mass spectrometry |
| CG-MIC | Chitosan-graphite molecularly imprinted composite |
| MIP | Molecularly imprinted polymer |
| DMMP | Dimethyl methylphosphonate |
| MeOH | Methanol |
| SEM | Scanning electron microscope |
| FTIR | Fourier-transform infrared spectrometer |
| NIP | Non-imprinted polymer |
| CG-NIC | Chitosan-graphite molecularly imprinted composite. |
Conflicts of interest
There are no conflicts to declare.Acknowledgements
The authors would like to acknowledge Major Gaetano Francesco Bellia, British Army, RAMC, MOSU, Pharmacist for presenting part of this research in the NATO officers summer congress 2023 of the CIOMR-JMROW in Helsinki. Also, we would like to thank the RSC for its invitation to include this paper in their 2023 Fellows collection.References
- P. R. Chai, B. D. Hayes, T. B. Erickson and E. W. Boyer, Toxicol. Commun., 2018, 2, 45–48 CrossRef PubMed.
- O. Nosseir and C. Hadad, Chemical Warfare Agents and Treatments, American Chemical Society, 2021 Search PubMed.
- J. A. Vale, T. C. Marrs and R. L. Maynard, Clin. Toxicol., 2018, 56, 1093–1097 CrossRef CAS PubMed.
- H. M. Bolt and J. G. Hengstler, Arch. Toxicol., 2022, 96, 1137–1140 CrossRef CAS PubMed.
- M. I. A. Talukder, OPUS-International Journal of Society Researches, 2021, 17, 5525–5544 Search PubMed.
- E. Nepovimova and K. Kuca, Food Chem. Toxicol., 2018, 121, 343–350 CrossRef CAS PubMed.
- R. Black, Chemical Warfare Toxicology, 2016, pp. 1–28 Search PubMed.
- R. Delfino, T. Ribeiro and J. Figueroa-Villar, J. Braz. Chem. Soc., 2009, 20(3), 407–428 CrossRef CAS.
- F. Worek, H. Thiermann and T. Wille, Arch. Toxicol., 2020, 94, 2275–2292 CrossRef CAS PubMed.
- F. Worek, T. Wille, M. Koller and H. Thiermann, Arch. Toxicol., 2016, 90, 2131–2145 CrossRef CAS PubMed.
- S. Chauhan, S. Chauhan, R. D'Cruz, S. Faruqi, K. K. Singh, S. Varma, M. Singh and V. Karthik, Environ. Toxicol. Pharmacol., 2008, 26, 113–122 CrossRef CAS PubMed.
- K. Ganesan, S. K. Raza and R. Vijayaraghavan, J. Pharm. Bioallied Sci., 2010, 2, 166–178 CrossRef CAS PubMed.
- Enviromental Protection Agency, ESAM Collaborative Analytical Methods and Protocols for Chemistry, https://www.epa.gov/esam/esam-collaborative-analytical-methods-and-protocols-chemistry, (accessed January 18, 2023).
- R. Campisano , U.S. Environmental Protection Agency.
- R. G. Lewis, Compendium of methods for the determination of toxic organic compounds in ambient air, DIANE Publishing, U. S. Environmental Protection Agency Office of Research and Development National Risk Management Research Laboratory Center for Environmental Research Information, 2nd edn, 1999 Search PubMed.
- E. Woolfenden and W. McClenny, Compendium of Methods for the Determination of Toxic Organic Compounds in Ambient Air, in Compendium Method TO-17 Search PubMed.
- H. Nagashima, T. Kondo, T. Nagoya, T. Ikeda, N. Kurimata, S. Unoke and Y. Seto, J. Chromatogr., A, 2015, 1406, 279–290 CrossRef CAS PubMed.
- T. Kelly, M. McCauley, C. Fricker, E. Burckle and B. Fahey, Testing of Screening Technologies for Detection of Chemical Warfare Agents in All Hazards Receipt Facilities, U.S. Environmental Protection Agency, Columbus, 2007 Search PubMed.
- E. Koglin, Technology Performance Summary for Chemical Detection Instruments, 2011 Search PubMed.
- C.-C. Li, Chem. Eng. Sci., 2009, 64, 1832–1843 CrossRef CAS.
- S. S. Kiani, A. Farooq, M. Ahmad, N. Irfan, M. Nawaz and M. A. Irshad, Environ. Sci. Pollut. Res., 2021, 1–18 Search PubMed.
- H. Fortier, C. Zelenietz, T. Dahn, P. Westreich, D. Stevens and J. R. Dahn, Appl. Surf. Sci., 2007, 253, 3201–3207 CrossRef CAS.
- J. Bryant and W. Ruch, NIOSH guide to the selection and use of particulate respirators certified under 42 CFR 84, https://www.cdc.gov/niosh/docs/96-101/default.html, (accessed June 1, 2023).
- R. Dunn, S. Moore, D. Naughton, D. HR-Corp-BusMgr, R. Stillman and H. Holborn, Desider, 2015, 9 Search PubMed.
- F. N. Maluin and M. Z. Hussein, Molecules, 2020, 25, 1611 CrossRef CAS PubMed.
- G. L. Dotto, J. M. Moura, T. R. S. Cadaval and L. A. A. Pinto, Chem. Eng. J., 2013, 214, 8–16 CrossRef CAS.
- I. O. Saheed, W. D. Oh and F. B. M. Suah, J. Hazard. Mater., 2021, 408, 124889 CrossRef CAS PubMed.
- B. Bellich, I. D'Agostino, S. Semeraro, A. Gamini and A. Cesàro, Mar. Drugs, 2016, 14, 99 CrossRef PubMed.
- T. Cowen and M. Cheffena, Int. J. Mol. Sci., 2022, 23, 9642 CrossRef CAS PubMed.
- T. Hiller, L. L. Li, E. L. Holthoff, B. Bamieh and K. L. Turner, J. Microelectromech. Syst., 2015, 24, 1275–1284 CAS.
- J. Disley, G. Gil-Ramírez and J. Gonzalez-Rodriguez, ACS Appl. Polym. Mater., 2023, 5, 935–942 CrossRef CAS.
- N. I. I. M. Hairi, A. A. M. Ralib, F. B. Ahmad and M. A. B. M. Hattar, J. Mater. Sci.: Mater. Electron., 2022, 33, 15574–15585 CrossRef.
- L. Nicolle, C. M. A. Journot and S. Gerber-Lemaire, Polymers, 2021, 13, 4118 CrossRef CAS PubMed.
- W. Dong, M. Yan, M. Zhang, Z. Liu and Y. Li, Anal. Chim. Acta, 2005, 542, 186–192 CrossRef CAS.
- R. S. Dongre, Chitosan Formulations: Chemistry, Characteristics and Contextual Adsorption in Unambiguous Modernization of S&T, IntechOpen, 2019 Search PubMed.
- M. A. R. Bhuiyan, L. Wang, A. Shaid, R. A. Shanks and J. Ding, J. Ind. Text., 2019, 49, 97–138 CrossRef CAS.
- P. Powroźnik, W. Jakubik and A. Kaźmierczak-Bałata, Procedia Eng., 2015, 120, 368–371 CrossRef.
- K. T. Alali, J. Liu, K. Aljebawi, Q. Liu, R. Chen, J. Yu, M. Zhang and J. Wang, J. Alloys Compd., 2019, 780, 680–689 CrossRef CAS.
- T. C. Smith, G. C. Gray, J. C. Weir, J. M. Heller and M. A. K. Ryan, Am. J. Epidemiol., 2003, 158, 457–467 CrossRef PubMed.
- Y. Pan, T. Guo, G. Zhang, J. Yang, L. Yang and B. Cao, Anal. Methods, 2020, 12, 2206–2214 RSC.
| This journal is © The Royal Society of Chemistry 2023 |

