 Open Access Article
Creative Commons Attribution 3.0 Unported Licence
Effect of doping TiO2 with Mn for electrocatalytic oxidation in acid and alkaline electrolytes†
Lauren
Vallez‡
 a,
Santiago
Jimenez-Villegas‡
 b,
Angel T.
Garcia-Esparza‡
 c,
Yue
Jiang
 a,
Sangwook
Park
 def,
Qianying
Wu
 a,
Thomas Mark
Gill
 g,
Dimosthenis
Sokaras
 *c,
Samira
Siahrostami
 *b and
Xiaolin
Zheng
 *a
*a
aDepartment of Mechanical Engineering, Stanford University, Stanford, California 94305, USA. E-mail: xlzheng@stanford.edu
bDepartment of Chemistry, University of Calgary, 2500, University Drive NW, Calgary, Alberta T2N 1N4, Canada. E-mail: samira.siahrostami@ucalgary.ca
cStanford Synchrotron Radiation Lightsource, SLAC National Accelerator Laboratory, 2575 Sand Hill Road, Menlo Park, USA. E-mail: dsokaras@slac.stanford.edu
dDepartment of Mechanical Engineering, Seoul National University, Seoul 08826, South Korea
eInstitute of Advanced Machines and Design, Seoul National University, Seoul 08826, South Korea
fInstitute of Engineering Research, Seoul National University, Seoul 08826, South Korea
gDepartment of Chemical Engineering, Massachusetts Institute of Technology, Cambridge, MA 02139, USA
First published on 14th April 2022
Abstract
Electrochemical oxidation of water and electrolyte ions is a sustainable method for producing energy carriers and valuable chemicals. Among known materials for catalyzing oxidation reactions, titanium dioxide (TiO2) offers excellent electrochemical stability but is less active than many other metal oxides. Herein, we used density functional theory calculations to predict an increase in catalytic activity by doping anatase TiO2 with manganese atoms (Mn). We synthesized Mn-doped TiO2 and then utilized X-ray absorption spectroscopy to study the chemical environment around the Mn site in the TiO2 crystal structure. Our electrochemical experiments confirmed that TiO2, with the optimal amount of Mn, reduces the onset potential by 260 mV in a 2 M KHCO3 (pH = ∼8) electrolyte and 370 mV in a 0.5 M H2SO4 (pH = ∼0.5) electrolyte. Moreover, in 0.5 M H2SO4, we observed that the amount of Mn doping greatly impacts the selectivity towards oxygen production versus peroxysulfate formation. In 2 M KHCO3, the Mn doping of TiO2 slightly decreases the selectivity towards oxygen production and increases the hydrogen peroxide formation. The Mn-doped TiO2 shows good electrochemical stability for over 24 hours in both electrolytes.
Introduction
Electrochemical water splitting can be accelerated with the aid of a catalyst to store and convert renewable energy to hydrogen. The water oxidation reaction (WOR) can proceed through three competing pathways that produce oxygen, hydrogen peroxide, or hydroxyl radicals at the anode of an electrochemical cell.1 The selectivity towards each product depends on the catalyst material,1,2 the electrolyte used,3–5 and the potential applied.6 The four-electron water oxidation reaction (4e− WOR, 2H2O → O2 + 4H+ + 4e−, E0 = 1.23 V),7 also known as the oxygen evolution reaction (OER), is the most commonly studied and occurs at the lowest applied potential thermodynamically.7 Although the 4e− WOR may not produce a terrestrially valuable product at the anode, it provides the electrons necessary to produce high-purity hydrogen at the cathode. Polymer electrolyte membrane (PEM) electrolysis relies on an acidic electrolyte to operate.8,9 While significant efforts aim towards the development of catalysts for the 4e− WOR, severe degradation in acidic conditions has hindered their success.10,11The two-electron water oxidation reaction (2e− WOR) requires a larger applied potential (2e− WOR, 2H2O → H2O2 + 2H+ + 2e−, E0 = 1.76 V)7 than that of the 4e− WOR but produces valuable hydrogen peroxide (H2O2) at the anode. H2O2 is a highly sought-after chemical due to its broad applications in industry, home, healthcare, and energy.12–14 Unlike PEM electrolysis, the 2e− WOR does not rely on an acidic electrolyte. Rather, an alkaline electrolyte of potassium bicarbonate (KHCO3) is commonly used.5 However, catalyst stability remains a significant challenge for the 2e− WOR due to the higher potential necessary to promote H2O2 production.1
In addition to water oxidation, other reactions can occur via oxidation of the electrolyte anions in acidic media. Peroxysulfate (SO52− and S2O82−) can be produced at the anode of an electrochemical cell by oxidizing the HSO4− anion in an aqueous H2SO4 electrolyte15–18 (2HSO4− → S2O82− + 2H+ + 2e−, E0 = 2.08 V).7 Similar to H2O2, peroxysulfate has many applications in water purification, chemical synthesis, cleaning, bleaching, and etching.17 Because S2O82− possesses the highest oxidizing capacity among all peroxides,17 it's considered to be a desirable electrochemical product worth producing. Nevertheless, its catalysts will also face the challenge of retaining stability in acidic conditions and under high anodic bias.
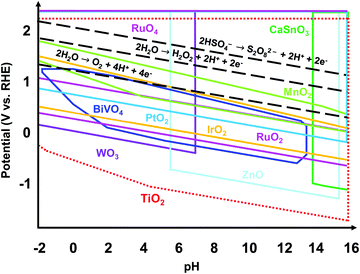
Regardless of the desired electrochemical product, the catalyst used should be electrically stable under applied potential and chemically stable in the acidic or alkaline conditions of the electrolyte. Fig. 1 shows the theoretically stable pH and potential ranges of several metal oxides used as electrocatalysts. The Pourbaix diagrams were compiled from the Materials Project database and assume ion concentrations of 10 M.19,20 Black dashed lines were added to indicate the applied potentials necessary to produce O2, H2O2, and S2O82−. The stable regions of many metal oxides do not reach or barely reach these redox lines, indicating that they would not be stable at the applied potentials necessary to produce these products. Ru and Ir and their oxides are the most well-known and some of the top-performing catalysts for the 4e− WOR to O2 in acidic conditions.10,21 However, RuOx and IrOx are susceptible to further oxidation and dissolution under applied voltage.22 Additionally, Ru and Ir are scarce and expensive. Doped BiVO4 has been shown to have high selectivity towards the 2e− WOR pathway to H2O2 but suffers from severe degradation.23 WO3 has proven to produce peroxysulfate in an aqueous H2SO4 electrolyte but only under solar irradiation.15–18 Among all the metal oxides shown, TiO2 has the widest stable range of pH values and applied potentials, making it a great candidate as a stable electrochemical catalyst. In addition, TiO2 is a nontoxic, earth-abundant, and low-cost material.24,25 That being said, TiO2 alone requires a high overpotential for water oxidation.6,26
Heterometal electrocatalysts have become a growing research interest in recent years due to their tunable activity and selectivity and the improvement of theoretical modeling and characterization techniques used to study these materials at the atomic level.27 In particular, various manganese (Mn)-doped TiO2 structures have been synthesized for a wide range of catalytic applications, such as nanosheets,28 nanopowders,29,30 nanoparticles,31–33 and thin films34 as photocatalysts, nanospheres for electrochemical N2 reduction,35 nanoparticles for electrochemical O2 reduction,36 and thin films for water oxidation.37 Herein, we study the effect Mn atoms have on the activity and selectivity of TiO2 for different electrochemical oxidation pathways in 0.5 M H2SO4 and 2 M KHCO3 electrolytes. We synthesized Mn-doped TiO2 (Mn:TiO2) thin films via a simple and rapid sol–gel method and verified the nature of Mn through X-ray Absorption Spectroscopy (XAS). Our density functional theory (DFT) calculations and experiments show that a moderate amount of Mn improves the onset potential in both acid and alkaline electrolytes while retaining TiO2's superior stability.
Theoretical analysis
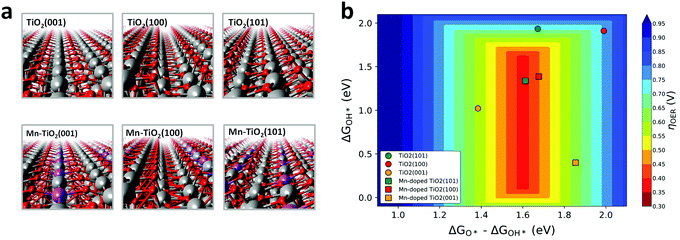
We first performed DFT calculations to study the 4e− WOR activity over the Mn:TiO2 systems. Optimized structures of bulk anatase TiO2 were cleaved to the (100), (101), and (001) low-index facets, which are most commonly exposed on anatase TiO2.38,39 Single atoms of Mn were introduced into the surface layer of the TiO2 lattices to explore its effect on the WOR (Fig. 2a). We also considered subsurface doping and a fully Mn-saturated TiO2 surface (Fig. S1, ESI†). All resulting structures were used to model the 4e− WOR reaction mechanism described by eqn (1)–(4), where * denotes a surface Mn or Ti active site.| H2O + * → OH* + (H+ + e−) | (1) |
| OH* → O* + (H+ + e−) | (2) |
| O* + H2O + * → OOH* + (H+ + e−) | (3) |
| OOH* → * + O2 + (H+ + e−) | (4) |
The intrinsic electrocatalytic activity was examined based on thermodynamics, which is a commonly employed method used to rationalize trends in various electrochemical reactions involving oxygen.13,23,40 We apply the computational hydrogen electrode (CHE) model in which the chemical potential of an electron–proton couple (H+ + e−) is equivalent to that of the gas phase H2 at U = 0.0 V vs. reversible hydrogen electrode (RHE).41 Through the CHE model, the Gibbs free energy of adsorption, ΔG, of reaction intermediates on the surface of the Mn:TiO2 were calculated (see ESI† for calculation details).41 The calculated limiting potential (UL) is defined as the minimum potential at which all steps are downhill in free energy. From which, theoretical overpotential, η, can be calculated.
| ηOERTheor. = UL − 1.23 eV | (5) |
Fig. 2b displays the theoretical 4e− WOR overpotential for the doped and undoped TiO2 as a function of ΔGOH* and ΔGO*–ΔGOH* in a 3D volcano contour plot. ΔGOH* and ΔGO*–ΔGOH* are widely reported as effective descriptors for the activity towards the WOR.42,43 This is in part due to a proposed “universal” linear scaling relation between ΔGOOH* and ΔGOH* used to describe a variety of metal oxides, ΔGOOH* = ΔGOH* + 3.2 eV (±0.2 eV).42–44 Ideally, the catalyst will lie in the red region at the center of the plot, with optimal intermediate binding free energies, minimizing overpotentials. TiO2 (sphere symbols, in Fig. 2b) sits at the top, right-hand side of the volcano plot where the OH* intermediate is weakly bound to a surface Ti atom. With the introduction of a surface Mn into the TiO2 lattice (square symbols, Fig. 2b), the interaction with reaction intermediates becomes stronger, shifting the ΔGOH* and ΔGO*–ΔGOH* descriptors to lower values. Consequently, Mn:TiO2 surfaces have lower calculated overpotentials than those of TiO2 alone as Mn strengthens the adsorption of all reaction intermediates and shifts it towards optimal binding energies.
To gain insights into the nature of the Mn–oxygen intermediate interaction, a Bader charge analysis and charge density difference plots were carried out (Fig. S2–S3, ESI†). An in-depth discussion can be found in the ESI.† This analysis revealed a greater charge transfer between the surface Mn atom (in Mn:TiO2) and OH*, O*, or OOH* adsorbates when compared to that between a surface Ti atom (in TiO2) and adsorbates. As binding events are often accompanied by a redistribution of charge, a greater charge transfer suggests a preference in Mn–oxygen intermediate binding, relative to that in the Ti active site. Accordingly, our results indicate that the decrease in calculated overpotentials, observed upon the incorporation of Mn into the TiO2 surface (Fig. 2b), originates from a greater charge transfer between the oxygenated reaction intermediate and the active site (i.e., Mn or Ti).
Material characterization
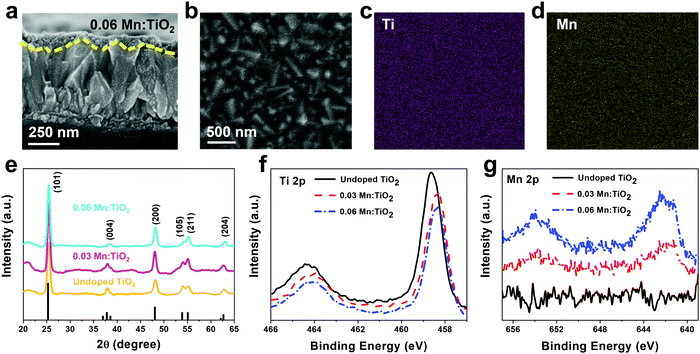
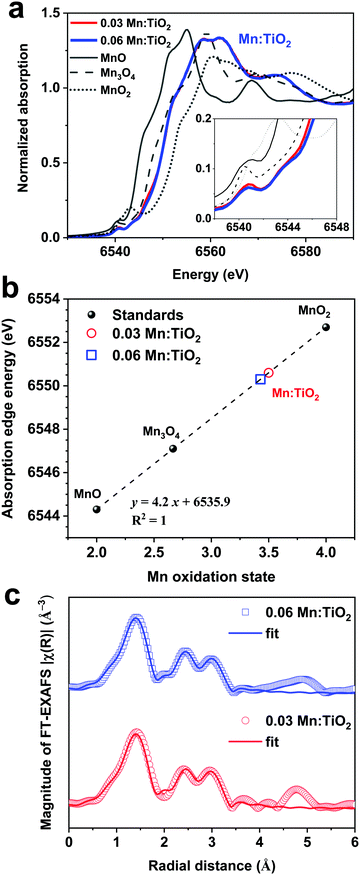
Thin films of Mn:TiO2 with Mn to Ti atomic ratios of 0 (undoped), 0.03, and 0.06 were synthesized on fluorine-doped tin oxide (FTO) coated glass using a sol–gel-method. As for notation, we use X Mn:TiO2, where X represents the atomic ratio of Mn to Ti in the sol–gel precursor solution. The cross-section scanning electron microscope (SEM) image in Fig. 3a shows that the film of 0.06 Mn:TiO2 has an average thickness of ∼100 nm. An aerial SEM image (Fig. 3b) was used for energy-dispersive X-ray spectroscopy (EDS) of Ti (Fig. 3c) and Mn (Fig. 3d) showing homogeneous distribution. The crystal structure was investigated by X-ray diffraction (XRD) and was determined to be anatase TiO2 for the undoped, 0.03, and 0.06 Mn:TiO2 samples, as shown in Fig. 3e, where the black peaks correspond to reference anatase TiO2 (ICDD: No. 21-1272). The average crystallite size of TiO2 was estimated to be approximately 10 nm based on the Scherrer equation. If the Mn to Ti atomic ratio is extended past 0.06 to 0.09 or 0.12, the TiO2 transitions from anatase to rutile phase according to XRD spectra (Fig. S4, ESI†).45 The chemical state and composition of the surface of the samples were analyzed using X-ray photoelectron spectroscopy (XPS). Fig. 3f shows the Ti 2p XPS spectra for all samples. The Ti 2p peaks of the undoped sample occur at 464.4 eV and 458.6 eV, which we ascribed to the published Ti 2p1/2 and 2p3/2 binding energies of Ti4+ in TiO2.46,47 For the 0.03 and 0.06 Mn:TiO2 samples, both Ti 2p peaks are slightly shifted to lower binding energies by 0.3 eV, likely due to the weakening of the Ti–O bonds from the incorporation of Mn in the TiO2 lattice.48 The Mn 2p XPS spectra in Fig. 3g show that Mn is present only in the doped samples. The bulk XRD characterization confirms that the samples are crystalline anatase TiO2 without Mn-based impurity phases, while the surface XPS characterization identifies Mn in the doped anatase TiO2 structures.To determine the oxidation state of the Mn atoms and gain insights into the local atomic structure of Mn in the TiO2 lattice, the Mn:TiO2 samples were studied using X-ray absorption spectroscopy (XAS). The reference spectra of MnO, Mn3O4, and MnO2 standards were also obtained for comparison purposes. Fig. 4a shows the normalized Mn K-edge X-ray absorption near edge structure (XANES) spectra of the standards and the 0.03 and 0.06 Mn:TiO2 samples. The Mn K-edge XANES of the doped samples shows distinct spectral features and a different absorption edge energy position (the first maximum in the first derivative) than the oxide standards. The 0.03 and 0.06 Mn:TiO2 doped samples exhibited mostly overlapped spectra, suggesting that Mn is in a similar microenvironment. The pre-edge peak centered at around 6540 and 6542 eV appears to be composed of a double component (based on the broadness of the feature), which may be characteristic of an octahedral environment (inset in Fig. 4a).49 A shift toward higher energy has been observed in this pre-edge peak position with an increasing valence state.50 In general, as the oxidation state increases, the energy at which the main absorption peak occurs increases as well.51 This trend is clearly shown in Fig. 4b by comparing the energy of the absorption edge to the oxidation states of manganese(II) oxide (MnO), manganese(II,III) oxide (Mn3O4), and manganese(IV) oxide (MnO2). Overall, an oxidation state of 3.5 was obtained for the Mn:TiO2 samples. It has been reported that the Mn K-edge position can be affected by local distortions of the MnO6 octahedra;52 nonetheless, when also considering a complementary first-moment analysis (Fig. S5, ESI†), our spectroscopy results indicate that the average oxidation state of the Mn sites in the doped anatase samples is between 3.1 and 3.5.
Extended X-ray absorption fine structure (EXAFS) was performed to study the average local atomic environment of the Mn atom that is assumed to substitute a Ti atom in the anatase crystal structure. Fig. 4c shows the Mn K-edge Fourier-transformed EXAFS (FT-EXAFS) analysis of the 0.03 and 0.06 Mn:TiO2 samples. As an initial step, a first-shell fit indicates that the Mn atom coordinates with approximately 5.8 ± 0.4 O-atoms at a distance of 1.91 ± 0.01 Å, most likely in an octahedral environment (Fig. S6 and Table S1, ESI†). Second, the long-range fitting indicates that the Mn–Ti coordination number (CN) of the 0.03 and 0.06 samples can vary from 1.1 to 1.8 when assuming Mn substitutions in configurations such as on the (101) and (001) surfaces or in the bulk anatase lattice (average CNMn–Ti = 1.4 ± 0.7 at an average distance of 2.89 ± 0.02 Å). Third, the Mn–O–Ti multiple scattering paths and long-range Mn–O′ scattering path resulted in an average CNMn–O–Ti of 5 ± 2 (RMn–O–Ti = 3.77 ± 0.02 Å) and CNMn–O′ of 16 ± 2 (RMn–O′ = 3.97 ± 0.03 Å), respectively (see details of the FT-EXAFS fitting in Fig. S7 and Tables S2–S5, ESI†). Those longer scattering path's coordination numbers are in reasonable agreement with the expected anatase values of 4 (Mn–O–Ti) and 16 (Mn–O′).
Ultimately, the XANES and EXAFS analysis indicate that the Mn atom has an average oxidation state of 3.3 in an octahedral environment with an average of 5.8 O-atoms at 1.9 Å. The best theoretical fit indicates an average number of 1.5 Ti-atoms at a 2.9 Å distance from the Mn center, which is lower than the expected value of 4 for bulk anatase. The Mn K-edge EXAFS provides an average perspective of the local coordination environment of Mn atoms in the sample, and although it cannot rule out Mn–Mn coordination, the extracted low Mn–M CN (i.e., Mn to Ti or Mn to Mn with ≈2.9 Å distance) may support the proposal that Mn sites are homogeneously dispersed mostly on anatase surfaces. Based on the doping level and assuming spherical 10 nm TiO2 nanoparticles (estimated by XRD), we estimate a surface-to bulk atomic ratio where approximately one-third of the Ti atoms in the system are surface atoms with a plausible percentage of Mn substitutions. DFT suggests (101) surfaces to be preferentially exposed (i.e., lowest surface energy); yet, on 10 nm TiO2 nanoparticles, vacancies and other surface defects are abundant exposing a higher density of unsaturated Mn-substituted Ti sites. Notably, the extracted lower Mn to Ti coordination suggests that Mn sits isolated preferentially on the surface.
Electrocatalytic oxidation experiments
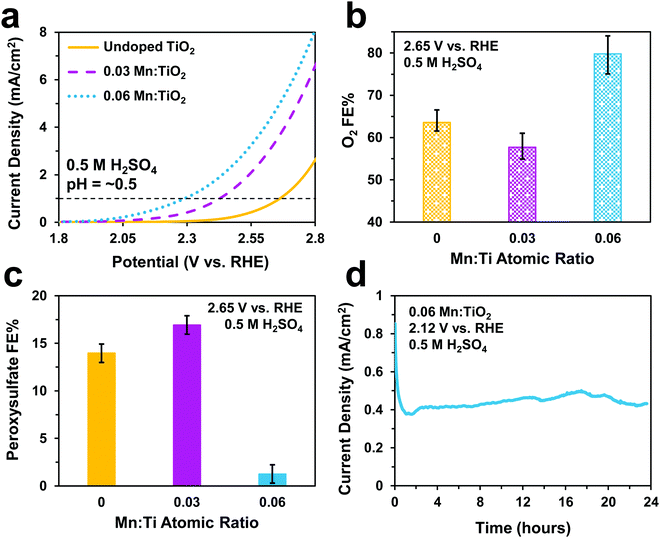
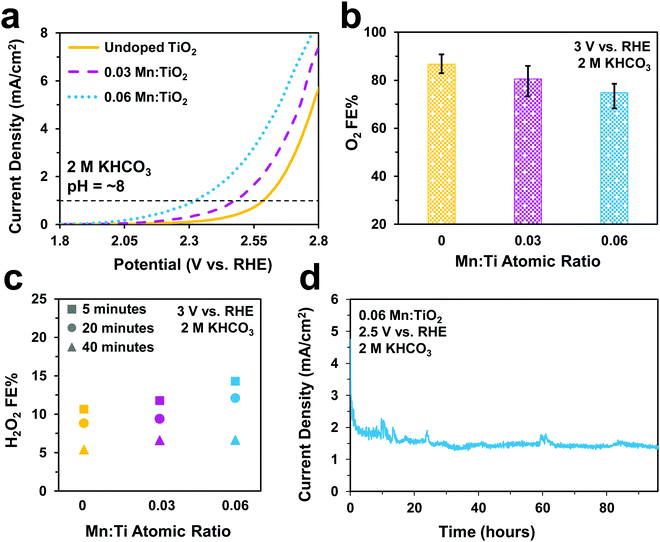
Electrochemical tests were performed to evaluate the catalytic performance of undoped TiO2, 0.03, and 0.06 Mn:TiO2 samples for O2 and S2O82− production in 0.5 M H2SO4 (pH = ∼0.5). As predicted, doping TiO2 with Mn lowers the onset potential as shown in Fig. 5a (with an onset potential defined as the potential applied to achieve 1 mA cm−2). The onset potential of 0.06 Mn:TiO2 is 370 mV lower than that of the undoped sample. The faradaic efficiency (FE) towards O2 (Fig. 5b) and S2O82− (Fig. 5c) were evaluated after 5 minutes at 2.65 V vs. RHE, and the amount of Mn dopant was found to have a significant impact on the FE. For the 0.03 Mn:TiO2 sample, 58% of the charge goes towards producing O2 and 17% towards S2O82−, while for the 0.06 Mn:TiO2 sample, 80% of the charge goes towards producing O2 and only 1% towards S2O82−. Lastly, the stability of the 0.06 Mn:TiO2 sample in the 0.5 M H2SO4 electrolyte was evaluated at 2.12 V vs. RHE. After the decay in current density due to charging of the electrochemical double layer was considered, the current density change is within 5% over the 24 hours tested (Fig. 5d).Next, we studied the electrocatalytic performance of the samples in 2 M KHCO3 (pH = ∼8), an electrolyte known to aid in the production of H2O2.5 In Fig. 6a, we show a similar activity trend as observed in 0.5 M H2SO4, where an increase in Mn lowers the onset potential. The 0.06 Mn:TiO2 decreases the onset potential by 260 mV compared to the undoped sample. As for selectivity, increasing the Mn amount in Mn:TiO2 decreases the FE towards O2 from 87% to 75% after applying 3 V vs. RHE for 5 minutes (Fig. 6b), opposite the trend observed in the acid electrolyte (Fig. 5b), but it increases the FE towards H2O2 (Fig. 6c). Here, we noticed that the FE towards H2O2 shows a dependence on the length of time the potential was applied (5, 20, or 40 minutes), where the H2O2 FE decreases with increasing testing time. For example, for the 0.06 Mn:TiO2 sample, the FE towards H2O2 decreases from 14% after 5 mins of testing to 7% after 40 mins of testing. Although the exact reasoning for this time dependence is unknown, one possibility is that the produced H2O2 is further oxidized at the surface of the Mn:TiO2 catalyst, resulting in a lower H2O2 FE after a longer testing time. Another possibility is that the H2O2 could be oxidizing the carbonate ions in the electrolyte during the longer timescales, in which case the H2O2 would get converted back to water. The stability of the 0.06 Mn:TiO2 sample in 2 M KHCO3 was evaluated under 2.5 V vs. RHE. It retained ∼93% of its original current density in the first 24 hours and ∼69% of its original current density after four days (Fig. 6d), after taking into account the initial decay in current density due to charging of the electrochemical double layer.
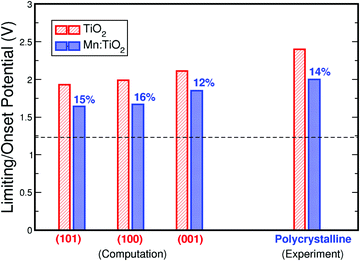
Finally, Fig. 7 compares the theoretical and experimental onset potentials of Mn-doped TiO2 and undoped TiO2. Here, we show the calculated onset potentials assuming exposed facets of (101), (100), and (001) on anatase TiO2. The experimentally measured onset potentials were taken from the current density–voltage curves of undoped TiO2 and 0.06 Mn:TiO2 in 0.5 M H2SO4. As predicted by theory, a substantial improvement is observed experimentally from the addition of Mn in the TiO2 lattice. When Mn substitutes Ti, theoretically, the onset potential decreases by 15%, 16%, and 12% for (101), (100), and (001) respectively. Experimentally, the onset potential decreases by 14%, which is in excellent agreement with theory.
Conclusions
The catalytic activity of TiO2 was improved by homogeneous dispersion of Mn sites on the surface of anatase TiO2, as predicted by DFT calculations. In the 0.06 Mn:TiO2 sample, the onset potential was reduced by 370 mV, and the sample was proven to be stable in 0.5 M H2SO4 at 2.12 V vs. RHE for 24 hours. Applying a voltage of 2.65 V vs. RHE to the 0.03 Mn:TiO2 sample resulted in a FE towards S2O82− of 17%. In a 2 M KHCO electrolyte, the onset potential was reduced by 260 mV, and the sample was proven to be stable at 2.5 V vs. RHE for 4 days with only a 7% loss in current density after the first 24 hours. These experiments confirm TiO2's superior stability in highly oxidizing conditions from extreme pH values and potentials. In the future, the onset potentials need to be further decreased for the OER, and the FEs towards H2O2 and S2O82− could be increased by potentially incorporating other metal dopants on well-defined selective facets. The current density needs to be increased, which could be achieved by adding small amounts of an additional active and highly conductive dopant. Synthesis of Mn:TiO2 could also be optimized for light absorption in hopes of lowering applied overpotentials via photoelectrochemistry.Methods
Computational details
All electronic structure calculations were performed using the QUANTUM ESPRESSO program package.53 Atomic Simulation Environment (ASE) was used to handle the simulation.54 The electronic wavefunctions were expanded in plane waves up to a cut-off energy of 500 eV, while the electron density is represented on a grid with an energy cut-off of 5000 eV. Core electrons were approximated with ultrasoft pseudopotentials.54 The Perdew–Burke–Ernzerhof (PBE) functional was used to describe the chemisorption properties. TiO2 and Mn:TiO2 surfaces were modeled using a 2 × 2 unit cell with a total of four layers for the (101), (001), and (100) facets. The first two layers and adsorbates were allowed to relax while the two bottom layers were fixed at their bulk position. A vacuum of ∼20 Å was used to decouple periodic replicas along the z-direction. The Brillouin zone was sampled with (4 × 4 × 1) Monkhorst–Pack k-points.Material synthesis
Sheets of 7–8 Ohm per square TEC 7 FTO coated glass (MSE Supplies) were cut and sonicated in acetone, isopropyl alcohol, and DI water for 10 minutes each before being rinsed in DI water and dried. TiO2 was synthesized on the FTO substrates via a solution gelation (sol–gel) method.55 To prepare a solution for dip coating, 38.5 mL of ethanol was placed in a glass container in an ice bath and stirred while 0.0385 mol (11.42 mL) of titanium(IV) isopropoxide (TTIP) 97% (Sigma-Aldrich) was added dropwise. Next, a second solution was prepared of 50 mL of ethanol, 2.5 mmol of HCl, and 30 mmol of deionized water, which was stirred and incrementally added to the first solution of ethanol and TTIP. The combined ∼100 mL solution was sonicated for 10 minutes in an ice bath. The solution was then stirred for 4.5 hours at room temperature. The solution should remain transparent. For the Mn-doped samples, manganese(II) acetate 98% (Sigma-Aldrich) was added after stirring, and the solution was sonicated for another 15 minutes in an ice bath. For a 0.03 Mn to Ti atomic ratio, 0.0012 mol of Mn was added. For a 0.06 Mn to Ti atomic ratio, 0.0023 mol of Mn was added. After sonication, substrates of FTO coated glass were dip-coated into the solution while the solution was being stirred in an ice bath. A section of the FTO was kept uncoated for electrical contact. The samples were then put in a furnace at 260 °C for 10 minutes to promote gelation. After cooling, the samples were annealed at 500 °C for 2 hours. Copper tape was attached to the exposed FTO, and silver paste was painted over the connection. Any exposed FTO was isolated with glue so that only the dip-coated TiO2 or Mn:TiO2 was exposed to the electrolyte during testing. This exposed area was measured using ImageJ software and was used as the geometric area to normalize the current densities.Material characterization
The surface morphology and sample thickness were viewed using scanning electron microscopy (FEI XL30, Sirion). The crystallinity of TiO2 was investigated by X-ray diffraction (Xpert2, PANalytical with Cu Kα radiation) deposited on silicon dioxide substrates to avoid measuring peaks from FTO. The chemical state on the surface was determined using X-ray photoelectron spectroscopy (PHI Versaprobe 1 and Versaprobe 3 with Al Kα radiation) calibrated to adventitious carbon at 248.8 eV. Mn K-edge X-ray absorption spectroscopy was collected at BL 7–3 at the Stanford Synchrotron Radiation Light source (SSRL) with a Si (220) monochromator 50% detuned that delivered a 1 mm(v) × 3 mm(h) beam. XANES and EXAFS were done in fluorescence mode directly on the FTO-supported electrodes. Reference spectra were simultaneously collected upstream using Mn metal via transmission detection mode, and all scans were calibrated to the metallic reference at 6539 eV. At least four scans were averaged, and a linear pre-edge was subtracted. Athena software was used for data normalization by unit edge jump. For the EXAFS analysis, multiple k-weighted EXAFS data in R space were obtained by subtracting a polynomial background function to the normalized data and processing the resulting χ(k) signal through Fourier transform (using a Hanning window, dk = 1, k-range of 3–10.5 Å−1, R-range of 1.0–1.8 for the first shell, and R-range of 1.0–3.7 for the long-range fitting). Data were fitted in R-space using the Artemis software.56Electrochemical testing
Electrochemical tests were run using a Gamry 1000 potentiostat with a three-electrode configuration. Synthesized undoped TiO2 or Mn-doped TiO2 on FTO coated glass was used as the working electrode for all experiments. When testing in an electrolyte of 0.5 M H2SO4, a Pt wire was used as the counter electrode and Hg/Hg2SO4 (Gamry) as the reference electrode. When testing in an electrolyte of 2 M KHCO3, a piece of carbon paper (Fuel Cell Store) or a graphite rod (Gamry) was used as the counter electrode and Ag/AgCl (Gamry) as the reference electrode. To condition each sample, the voltage was cycled 10 times between 0 V vs. ref. and the voltage applied during subsequent chronoamperometry tests. The voltage was linearly increased in increments of 10 mV at 50 mV s−1 before a constant voltage was applied for ≥ 5 minutes to produce a measurable quantity of product or to evaluate the catalyst's long-term stability. The electrolyte was constantly stirred during the chronoamperometry tests using a magnetic stir bar to prevent concentration gradients.Oxygen quantification
The amount of dissolved oxygen was measured both in 0.5 M H2SO4 and 2 M KHCO3 electrolytes using a HIOXY-R oxygen probe attached to an oxygen sensor (NeoFox, Ocean Optics). The electrodes, oxygen probe, gas bubbler, and electrolyte were contained within a sealed cell (EuroCell, Gamry). The oxygen probe and gas bubbler were placed mid-depth into the electrolyte. The oxygen sensor was calibrated against an air-saturated and argon-saturated electrolyte. Before each experiment, the stirred electrolyte was purged with argon via the gas bubbler until the oxygen measurement was stable. The bubbler was then removed from the cell and the port was closed to ensure an airtight seal. The oxygen concentration was continuously measured throughout the chronoamperometry test, and the FE was calculated using the following equation: | (6) |
The accumulated moles of O2 in the electrolyte increased steadily while the voltage was applied until shortly after the experiment ended when the O2 concentration plateaued. The concentration never approached the O2 solubility limit of 1.22 mmol L−1.57 The O2 concentration in the headspace above the electrolyte was also measured before and after the chronoamperometry test to ensure a negligible change.
Peroxysulfate and hydrogen peroxide quantification
The amount of S2O82− generated in 0.5 M H2SO4 was measured after a voltage of 2.65 V vs. RHE was applied for 10 minutes. A 2 mL aliquot was taken from the electrolyte, and 2 mL of 0.01 M FeSO4 and 2 mL of 1 M H2SO4 were then added to the aliquot.18 The absorbance of Fe(III) was measured using UV-visible spectrophotometry (Agilent Cary 6000i) at 302 nm.58 A calibration was performed using various concentrations of K2S2O8 sonicated in 0.5 M H2SO4.The amount of H2O2 generated in 2 M KHCO3 was measured after a voltage of 3 V vs. RHE was applied for either 5, 20, or 40 minutes. An aliquot of the electrolyte was mixed with 2 M KHCO3 and 0.07 M cobalt sulfate heptahydrate, forming a complex of Co(CO)33−.59 The absorbance of the cobalt-carbonate assay was measured using UV-visible spectrophotometry at 260 nm.60 The FEs toward S2O82− and H2O2 were calculated using the following equation:
 | (7) |
Nomenclature
| WOR | Water oxidation reaction |
| OER | Oxygen evolution reaction |
| PEM | Polymer electrolyte membrane |
| Mn:TiO2 | Mn-doped TiO2 |
| DFT | Density functional theory |
| * | Surface active site |
| CHE | Computational hydrogen electrode |
| RHE | Reversible hydrogen electrode |
| ΔG | Gibbs free energy of adsorption |
| η | Overpotential |
| FTO | Fluorine-doped tin oxide |
| SEM | Scanning electron microscopy |
| EDS | Energy-dispersive X-ray spectroscopy |
| XRD | X-Ray diffraction |
| XPS | X-Ray photoelectron spectroscopy |
| XAS | X-Ray absorption spectroscopy |
| XANES | X-Ray absorption near edge structure |
| EXAFS | Extended X-ray absorption fine structure |
| FT-EXAFS | Fourier transformed extended X-ray absorption fine structure |
| CN | Coordination number |
| FE | Faradaic efficiency |
Author contributions
X. L. Z. conceptualized the study. S. J. V. performed the theoretical analysis (DFT calculations) under S. S.'s supervision. A. T. G. performed XAS and the FT-EXAFS fittings under D. S.'s supervision. Y. J. performed SEM and EDS. S. P. performed XRD. L. V. designed and performed all other experiments and assembled the figures and manuscript under X. L. Z.'s supervision. Q. W. helped with some of the electrochemical experiments. L. V., S. J. V., and A. T. G. were involved in writing the original draft. X. L. Z., L. V., S. J. V., S. S., A. T. G., and T. M. G. were involved in reviewing and editing.Conflicts of interest
There are no conflicts of interest to declare.Acknowledgements
X. L. Z. would like to thank the National Science Foundation EFRI-DCheM program (Agreement Number: SUB0000425) for their generous support. L. V. would like to thank the National Science Foundation for their support through the Graduate Research Fellowship Program (Grant No. DGE-1656518). S. S. and S. J. V. acknowledge support from the University of Calgary's Canada First Research Excellence Fund Program, the Global Research Initiative in Sustainable Low Carbon Unconventional Resources. This research was enabled in part by support provided by computational resources at the University of Calgary (https://www.rcs.ucalgary.ca). Part of this work was performed at the Stanford Nano Shared Facilities (SNSF), supported by the National Science Foundation under award ECCS-2026822. Use of the Stanford Synchrotron Radiation Lightsource, SLAC National Accelerator Laboratory, is supported by the US Department of Energy, Office of Science, Office of Basic Energy Sciences under Contract No. DE-AC02-76SF00515.References
- X. Shi, S. Back, T. M. Gill, S. Siahrostami and X. Zheng, Chem, 2021, 7(1), 38–63 CAS.
- C. C. L. McCrory, S. Jung, I. M. Ferrer, S. M. Chatman, J. C. Peters and T. F. Jaramillo, J. Am. Chem. Soc., 2015, 137, 4347–4357 CrossRef CAS PubMed.
- K. Fuku, Y. Miyase, Y. Miseki, T. Gunji and K. Sayama, ChemistrySelect, 2016, 1(18), 5721–5726 CrossRef CAS.
- J. A. Arminio-Ravelo, A. W. Jensen, K. D. Jensen, J. Quinson and M. Escudero-Escribano, Chem. Phys. Chem., 2019, 20(22), 2956–2963 CrossRef CAS PubMed.
- T. M. Gill, L. Vallez and X. Zheng, ACS Energy Lett., 2021, 6, 2854–2862 CrossRef CAS.
- X. Shi, S. Siahrostami, G.-L. Li, Y. Zhang, P. Chakthranont, F. Studt, T. F. Jaramillo, X. Zheng and J. K. Nørskov, Nat. Commun., 2017, 8(1), 701 CrossRef PubMed.
- A. J. Bard, R. Parsons and J. Jordan, Standard Potentials in Aqueous Solution, Routledge, 1985 Search PubMed.
- M. Carmo, D. L. Fritz, J. Mergel and D. Stolten, Int. J. Hydrogen Energy, 2013, 38(12), 4901–4934 CrossRef CAS.
- S. Shiva Kumar and V. Himabindu, Mater. Sci. Energy Technol., 2019, 2(3), 442–454 Search PubMed.
- C. C. L. McCrory, S. Jung, I. M. Ferrer, S. M. Chatman, J. C. Peters and T. F. Jaramillo, J. Am. Chem. Soc., 2015, 137(13), 4347–4357 CrossRef CAS PubMed.
- Z. Lei, T. Wang, B. Zhao, W. Cai, Y. Liu, S. Jiao, Q. Li, R. Cao and M. Liu, Adv. Energy Mater., 2020, 10, 1–18 Search PubMed.
- J. Tang, T. Zhao, D. Solanki, X. Miao, W. Zhou and S. Hu, Joule, 2021, 5, 1432–1461 CrossRef CAS.
- S. Siahrostami, S. J. Villegas, A. H. B. Mostaghimi, S. Back, A. B. Farimani, H. Wang, K. A. Persson and J. Montoya, ACS Catal., 2020, 10, 7495–7511 CrossRef CAS.
- J. M. Campos-Martin, G. Blanco-Brieva and J. L. G. Fierro, Angew. Chem., Int. Ed., 2006, 45(42), 6962–6984 CrossRef CAS PubMed.
- T. Nakajima, A. Hagino, T. Nakamura, T. Tsuchiya and K. Sayama, J. Mater. Chem. A, 2016, 4, 17809–17818 RSC.
- Q. Mi, A. Zhanaidarova, B. S. Brunschwig, H. B. Gray and N. S. Lewis, Energy Environ. Sci., 2012, 5, 5694–5700 RSC.
- K. Fuku, N. Wang, Y. Miseki, T. Funaki and K. Sayama, ChemSusChem, 2015, 8, 1593–1600 CrossRef CAS PubMed.
- S. H. Ahn, J. Zhao, J. H. Kim and X. Zheng, Electrochim. Acta, 2017, 244, 184–191 CrossRef CAS.
- A. Jain, S. P. Ong, G. Hautier, W. Chen, W. D. Richards, S. Dacek, S. Cholia, D. Gunter, D. Skinner, G. Ceder and K. A. Persson, APL Mater., 2013 DOI:10.1063/1.4812323.
- K. A. Persson, B. Waldwick, P. Lazic and G. Ceder, Phys. Rev. B, 2012, 85(23), 235438 CrossRef.
- S. Cherevko, S. Geiger, O. Kasian, N. Kulyk, J.-P. Grote, A. Savan, B. R. Shrestha, S. Merzlikin, B. Breitbach, A. Ludwig and K. J. J. Mayrhofer, Catal. Today, 2016 DOI:10.1016/j.cattod.2015.08.014.
- N.-T. Suen, S.-F. Hung, Q. Quan, N. Zhang, Y.-J. Xu and H. M. Chen, Chem. Soc. Rev., 2017, 46(2), 337–365 RSC.
- J. H. Baek, T. M. Gill, H. Abroshan, S. Park, X. Shi, J. Nørskov, H. S. Jung, S. Siahrostami and X. Zheng, ACS Energy Lett., 2019, 4(3), 720–728 CrossRef CAS.
- X. Chen and S. S. Mao, Chem. Rev., 2007, 107(7), 2891–2959 CrossRef CAS PubMed.
- S.-Y. Lee and S.-J. Park, J. Ind. Eng. Chem., 2019, 19(6), 1761–1769 CrossRef.
- M. García-Mota, A. Vojvodic, H. Metiu, I. C. Man, H.-Y. Su, J. Rossmeisl and J. K. Nørskov, ChemCatChem, 2011, 3(10), 1607–1611 CrossRef.
- A. Pedersen, J. Barrio, A. Li, R. Jervis, D. J. L. Brett, M. M. Titirici and I. E. L. Stephens, Adv. Energy Mater., 2021, 12(3), 2102715 CrossRef.
- H. Sudrajat, S. Babel, A. T. Ta and T. K. Nguyen, J. Phys. Chem. Solids, 2020, 144, 109517 CrossRef CAS.
- L. Wang, X. Zhang, P. Zhang, Z. Cao and J. Hu, J. Saudi Chem. Soc., 2015, 19, 595–601 CrossRef.
- Q. R. Deng, X. H. Xia, M. L. Guo, Y. Gao and G. Shao, Mater. Lett., 2011, 65, 2051–2054 CrossRef CAS.
- V. D. Binas, K. Sambani, T. Maggos, A. Katsanaki and G. Kiriakidis, Appl. Catal., B, 2012, 113–114, 79–86 CrossRef CAS.
- R. Chauhan, A. Kumar and R. P. Chaudhary, Spectrochim. Acta, Part A, 2012, 98, 256–264 CrossRef CAS PubMed.
- L. Wang, J. Fan, Z. Cao, Y. Zheng, Z. Yao, G. Shao and J. Hu, Chem. – Asian J., 2014, 9, 1904–1912 CrossRef CAS PubMed.
- X. H. Xia, L. Lu, A. S. Walton, M. Ward, X. P. Han, R. Brydson, J. K. Luo, G. Shao, X. H. Xia, L. Lu, A. S. Walton, M. Ward, X. P. Han, R. Brydson, J. K. Luo and G. Shao, Acta Mater., 2012, 60, 1974–1985 CrossRef CAS.
- H. Chen, T. Wu, X. Li, S. Lu, F. Zhang, Y. Wang, H. Zhao, Q. Liu, Y. Luo, A. M. Asiri, Z.-S. Feng, Y. Zhang and X. Sun DOI:10.1021/acssuschemeng.0c09009.
- Q. Chen, C. Ma, S. Yan, J. Liang, K. Dong, Y. Luo, Q. Liu, T. Li, Y. Wang, L. Yue, B. Zheng, Y. Liu, S. Gao, Z. Jiang, W. Li and X. Sun, ACS Appl. Mater. Interfaces, 2021, 13, 46659–46664 CrossRef CAS PubMed.
- J. Li, D. Solanki, Q. Zhu, X. Shen, G. Callander, J. Kim, Y. Li, H. Wang and S. Hu, J. Mater. Chem. A, 2021, 9, 18498–18505 RSC.
- R. Katal, S. Masudy-Panah, M. Tanhaei, M. H. D. A. Farahani and H. Jiangyong, Chem. Eng. J., 2020, 384, 123384 CrossRef CAS.
- W. J. Ong, L. L. Tan, S. P. Chai, S. T. Yong and A. R. Mohamed, Nanoscale, 2014, 6, 1946–2008 RSC.
- I. C. Man, H. Y. Su, F. Calle-Vallejo, H. A. Hansen, J. I. Martínez, N. G. Inoglu, J. Kitchin, T. F. Jaramillo, J. K. Nørskov and J. Rossmeisl, ChemCatChem, 2011, 3, 1159–1165 CrossRef CAS.
- J. K. Nørskov, J. Rossmeisl, A. Logadottir, L. Lindqvist, J. R. Kitchin, T. Bligaard and H. Jónsson, J. Phys. Chem. B, 2004, 108, 17886–17892 CrossRef.
- M. J. Craig, G. Coulter, E. Dolan, J. Soriano-López, E. Mates-Torres, W. Schmitt and M. García-Melchor, Nat. Commun., 2019, 10, 1–9 CrossRef CAS PubMed.
- L. C. Seitz, C. F. Dickens, K. Nishio, Y. Hikita, J. Montoya, A. Doyle, C. Kirk, A. Vojvodic, H. Y. Hwang, J. K. Norskov and T. F. Jaramillo, Science, 2016, 353, 1011LP–1014 CrossRef PubMed.
- G. Gao, E. R. Waclawik and A. Du, J. Catal., 2017, 352, 579–585 CrossRef CAS.
- D. Banerjee, S. K. Gupta, N. Patra, S. Wasim Raja, N. Pathak, D. Bhattacharyya, P. K. Pujari, S. V. Thakare and S. N. Jha, Phys. Chem. Chem. Phys., 2018, 20, 28699 RSC.
- D. Gonbeau, C. Guimon, G. Pfister-Guillouzo, A. Levasseur, G. Meunier and R. Dormoy, Surf. Sci., 1991, 254 DOI:10.1016/0039-6028(91)90640-E.
- C. Sleigh, A. P. Pijpers, A. Jaspers, B. Coussens and R. J. Meier, J. Electron Spectrosc. Relat. Phenom., 1996, 77(1), 41–57 CrossRef CAS.
- M. Guo, Y. Gao and G. Shao, Phys. Chem. Chem. Phys., 2016, 18(4), 2818–2829 RSC.
- I. Saratovsky, P. G. Wightman, P. A. Pastén, J.-F. Gaillard and K. R. Poeppelmeier, J. Am. Chem. Soc., 2006, 128, 11188–11198 CrossRef CAS PubMed.
- E. Chalmin, F. Farges and G. E. Brown, Contrib. Mineral. Petrol., 2008, 157, 111–126 CrossRef.
- D. Joseph, A. K. Yadav, S. N. Jha and D. Bhattacharyya, Bull. Mater. Sci., 2013, 36(6) DOI:10.1007/s12034-013-0567-8.
- V. Celorrio, L. Calvillo, G. Granozzi, A. E. Russell and D. J. Fermin, Top. Catal., 2018, 61, 154–161 CrossRef CAS PubMed.
- P. Giannozzi, S. Baroni, N. Bonini, M. Calandra, R. Car, C. Cavazzoni, D. Ceresoli, G. L. Chiarotti, M. Cococcioni, I. Dabo, A. Dal Corso, S. De Gironcoli, S. Fabris, G. Fratesi, R. Gebauer, U. Gerstmann, C. Gougoussis, A. Kokalj, M. Lazzeri, L. Martin-Samos, N. Marzari, F. Mauri, R. Mazzarello, S. Paolini, A. Pasquarello, L. Paulatto, C. Sbraccia, S. Scandolo, G. Sclauzero, A. P. Seitsonen, A. Smogunov, P. Umari and R. M. Wentzcovitch, J. Phys.: Condens. Matter, 2009, 21(39), 395502 CrossRef PubMed.
- S. R. Bahn and K. W. Jacobsen, Comput. Sci. Eng., 2002, 4, 56–66 CrossRef CAS.
- T. Wen, J. Gao, J. Shen and Z. Zhou, J. Mater. Sci., 2001, 36(24), 5923–5926 CrossRef CAS.
- B. Ravel and M. Newville, J. Synchrotron Radiat., 2005, 12, 537–541 CrossRef CAS PubMed.
- W. Xing, M. Yin, Q. Lv, Y. Hu, C. Liu and J. Zhang, Rotating Electrode Methods Oxyg. Reduct. Electrocatal., 2014, 1–31 Search PubMed.
- M. H. Mariano, Anal. Chim. Acta, 1962, 17, 16 Search PubMed.
- D. Belhateche and J. M. Symons, J. – Am. Water Works Assoc., 1991, 83(8), 70–73 CrossRef CAS.
- T. M. Gill and X. Zheng, Chem. Mater., 2020, 32(15), 6285–6294 CrossRef CAS.
Footnotes |
| † Electronic supplementary information (ESI) available. See DOI: https://doi.org/10.1039/d2ya00027j |
| ‡ These authors contributed equally. |
| This journal is © The Royal Society of Chemistry 2022 |

