 Open Access Article
Modeling and optimization of two-step shea butter oil biodiesel synthesis using snail shells as heterogeneous base catalysts
Akinola D.
Ogunsola
*a,
Modiu O.
Durowoju
a,
Abass O.
Alade
b,
Simeon O.
Jekayinfa
c and
Oyetola
Ogunkunle
 *d
*d
aDepartment of Mechanical Engineering, Ladoke Akintola University of Technology, Ogbomoso, Nigeria. E-mail: adogunsola@lautech.edu.ng
bDepartment of Chemical Engineering, Ladoke Akintola University of Technology, Ogbomoso, Nigeria
cDepartment of Agricultural Engineering, Ladoke Akintola University of Technology, Ogbomoso, Nigeria
dDepartment of Mechanical Engineering, Faculty of Engineering and Built Environment, University of Johannesburg, South Africa. E-mail: oogunkunle@uj.ac.za
First published on 5th January 2022
Abstract
Shea butter oil (SBO) is underutilized in the biodiesel production industry in Nigeria because of its high free fatty acid (FFA) content, which reduces its biodiesel yield. This research aimed at optimizing shea butter oil biodiesel (SBOB) production using a biomass-derived heterogeneous catalyst. Crude SBO was purified and then esterified with H2SO4. An active heterogeneous catalyst was synthesized from snail shells via calcination at 100–900 °C. The calcined samples were characterized using XRD, SEM and EDS. The esterified SBO was transesterified using the calcined sample with the highest CaO percentage as a catalyst. Both esterification and transesterification processes were optimized using half factorial design of Design-Expert 11. The influence of the catalyst dosage, ethanol to oil ratio, reaction temperature, reaction time, and agitation speed was investigated on SBOB yields. XRD results showed that the snail shell calcined at 900 °C gave the highest yield (75%) of CaO. SEM results showed that the pore sizes ranged from 1.09 to 3.19 μm in the snail shell calcined at 100 °C and 5.30 to 9.18 μm in the sample calcined at 900 °C. EDS results showed that the calcium, oxygen and carbon contents in the snail shell calcined at 100 °C were 18.2, 44.4, and 28.0%, respectively, while their corresponding values in the sample calcined at 900 °C were 25.5, 30.1, and 23.0%, respectively. The highest FFA percentage reduction (60.36%) in SBO was obtained under optimum conditions of the 6.1 molar ratio, 78 °C reaction temperature, 120 min reaction time, 6.5 ml H2SO4, and 600 rpm agitation speed. The highest yield of SBOB (97.40%) was obtained under optimum conditions of the 9.1 molar ratio, 78 °C reaction temperature, 15 min reaction time, 3 wt% catalyst concentration, and 600 rpm agitation speed.
1. Introduction
The geometrical increase in global energy consumption due to technological innovations, depletion of fossil fuels and the increasing threat to the environment from emissions of crude oil has necessitated global interest in renewable fuels.1–3 Atadashi et al.4 indicated that the global energy needed in 2002 was 3.8 × 10¹⁸ GJ and that almost 81% of it was obtained from fossil fuels. This will lead to early extinction of fossil fuels as a result of the total dependence on them, which will lead to economic retrogression of the country and increase environmental pollution caused by exhaust emissions of engines running on fossil fuels which can endanger lives of all living things on earth.3,5,6The world is presently focusing on converting waste to wealth by using cheap organic matter that has similar physicochemical properties to petroleum diesel to produce fuels that are renewable and biodegradable and have lower emission profiles to replace fossil fuels.3,7,8 This will enhance the global energy demand, reduce the environmental degradation of the planet earth and engage myriad unemployed youth productively.4,9–11
One of such biofuels is biodiesel, which is defined as methyl or ethyl ester of fatty acids produced from vegetable oils or animal fats through a trans-esterification process.4,9,12,13 Biodiesel is renewable and biodegradable and has lower emission profiles than petroleum diesel.13–16 Alamu et al.17 reported that biodiesel production can improve the economic development and poverty alleviation of a country because it provides opportunities of new jobs and businesses in its production, transportation, trade, and uses.
Shea trees are predominant in the Southern Guinea Savanna of Nigeria and the butter obtained from their nuts is presently underutilized in the area of biodiesel production because of its high FFAs that adversely affect its biodiesel yield.18,19 Shea trees grow naturally in Nigeria. The locations where these trees are predominantly cultivated in Nigeria are shown in Fig. 1. Shea butter oil can be extracted from the nuts of shea trees. According to FAO Statistics,20 Nigeria has the largest number of shea trees in the world. Nigeria is currently the world's largest producer of shea butter with an annual production of 361![[thin space (1/6-em)]](https://www.rsc.org/images/entities/char_2009.gif) 017 MT.21 To increase the production, the Nigerian Institute for Oil Palm Research (NIFOR) has been able to reduce the long gestation period of shea butter trees from twenty to an average of six years. In light of this, Nigeria has the capacity to double its shea butter production to 650
017 MT.21 To increase the production, the Nigerian Institute for Oil Palm Research (NIFOR) has been able to reduce the long gestation period of shea butter trees from twenty to an average of six years. In light of this, Nigeria has the capacity to double its shea butter production to 650![[thin space (1/6-em)]](https://www.rsc.org/images/entities/char_2009.gif) 000 MT to increase exports.
000 MT to increase exports.
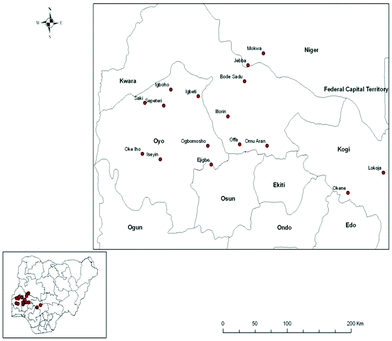 | ||
| Fig. 1 Locations where shea trees are predominantly grown in the Southern Guinea Savanna of Nigeria. Source: Adebayo et al.18 | ||
Shea butter is composed principally of 41.1% saturated fatty acids. Analysis of its fatty acid composition showed that the fatty acids include palmitic (5.4%), stearic (35.7%), oleic (49.6%), linoleic (7.8%), and arachidic (1.3%) acids.22 Enweremadu and Alamu22 reported that stearic and oleic acids account for 85 to 90% of the fatty acids and that high stearic acid content gives the shea butter its solid consistency, while the percentage oleic acid influences how soft or hard the shea butter is, depending on ambient temperature. Owing to its relatively high oil yield, the use of SBO as feedstock in transesterification reaction will produce high biodiesel yields. The production of biodiesel from this oil will reduce the excessive dependence on fossil fuels, save the environment from fossil pollutant emissions, and increase the national income of the country via increased local production and foreign exchange.
Biodiesel was produced from raw shea butter oil by Ejeh and Aderemi23 and Enweremadu and Alamu22 using a homogeneous potassium hydroxide catalyst. Ejeh and Aderemi23 employed direct base (KOH) catalyzed transesterification to produce biodiesel from shea butter using methanol and potassium hydroxide at 60 °C for an hour, while Enweremadu and Alamu22 used a two-step acid–alkali method to produce biodiesel from shea butter using methanol, tetraoxosulphate(VI) acid and potassium hydroxide at 55 °C for an hour for each step. The limitations of these studies are that the biodiesel produced resulted in wastewater generation and a loss of biodiesel yield. One hour reaction time is also a lot of time for biodiesel production from these previous studies. Also, none of the researchers reported on the optimization and modeling of the esterification of SBO and its conversion into biodiesel using a heterogeneous catalyst derived from snail shells. In overcoming these deficits in the body of literature with regard to biodiesel synthesis from shea butter oil, the objective of developing an active heterogeneous base catalyst from giant African snail (Archachatina marginata) shells was formulated for its catalysis and also optimize the process parameters for high biodiesel production.
The use of heterogeneous catalysts provides another route to solving associated problems with biodiesel production using homogeneous catalysts. Generally, heterogeneous catalysts have been found to be preferred to homogeneous catalysts in industrial production of biodiesel because of their robustness and lower operational cost. Their ease of separation from the reactants, recoverability and reusability have led to wider applications in the transesterification process.24 A carbon supported heterogeneous catalyst was used by Dhawane et al.25 to obtain a high biodiesel yield (90%) from Hevea brasiliensis through a Taguchi optimization method. Similarly, a high biodiesel yield (82%) was obtained from transesterification of waste Madhuca indica oil using a calcium based heterogeneous catalyst derived from egg shells.26 Heterogeneous catalysts that are mainly used for biodiesel production are alkaline metal carbonates (Na2CO3, K2CO3 and CaCO3), alkaline earth metal oxides (CaO, MgO, SrO, BaO) and other oxides such as ZnO and K2O.1,2 The most widely used amongst the heterogeneous catalysts for biodiesel production are calcium oxide (CaO) and magnesium oxide (MgO) based on the relatively high biodiesel yields achieved with them even under moderate reaction conditions.27–30 Shells of Archachatina marginata were found to contain calcium carbonate (CaCO3), which is a raw material to produce calcium oxide (CaO) that is cost effective and environmentally friendly.31,32
Like Nigerian seed plants with high oil yields which are reported by some researchers,33–35 shea butter is chosen for this study owing to its abundance in Nigeria and its underutilization in the biodiesel industry. In this research, the reduction of shea butter oil high FFA content to a minimum level that favours biodiesel conversion using snail shells as a heterogeneous catalyst was achieved within the time frame of ten to fifteen minutes. An efficient optimization technique was carried out using the factorial experimental design of the Response Surface Methodology (RSM) to obtain cost-effective process variables for the production of biodiesel from SBO using the heterogeneous catalyst derived from snail shells. This approach will encourage households to start producing renewable fuels needed for their daily activities with the use of available oil based biomass that is underutilized in the region. Further, this measure will reduce agricultural residues that constitute nuisance to the environment by using them as heterogeneous catalysts in biodiesel production to improve the economy of the country.
2. Materials and methodology
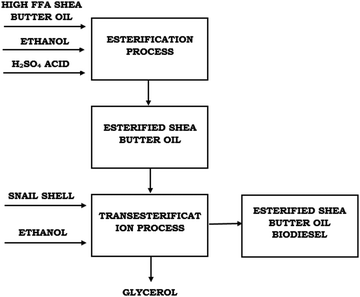
A heterogeneous catalyst was developed from giant snail (Archachatina marginata) shells via calcination at different temperatures. Raw SBO was purified and converted into biodiesel via a two-step transesterification reaction using the developed heterogeneous catalyst. The flowchart of the two-step acid catalyzed transesterification process is presented in Fig. 2. The two-step reactions were optimized in order to obtain optimum conditions for biodiesel production using the most active heterogeneous catalyst (CaO) derived from giant African snail (Archachatina marginata) shells.2.1 Materials and equipment
The materials and equipment used in this work are categorized as follows:2.2 Preparation of heterogeneous catalysts
Archachatina marginata shells were collected from a local restaurant in Ogbomosho North Local Government Area (8.1335° N, 4.2538° E), Oyo State, Nigeria, and rinsed several times with tap and distilled water to remove impurities and other organic matter attached to them. These were then crushed with a pestle in a mortar, air dried and then oven dried at 105 °C for 24 hours to constant weight to remove their moisture content. The crushed oven dried snail shells were ground to a uniform particle size of 0.31 mm, and then calcined in a furnace at temperatures of 100, 200, 300, 400, 500, 600, 700, 800 and 900 °C, respectively, for 4 hours based on related studies.27,32,362.3 Characterization of heterogeneous snail shell catalysts
XRD of the samples was performed on a MiniFlex II. An England based generator X-ray diffractometer using Cu-Kα radiation fitted over a range from 20 to 80° with a step size of 0.04 at a scanning speed of 3° per minute. SEM images were obtained on an FEI Quanta 200 F using a tungsten filament doped with lanthanum hexaboride as an X-ray source that was fitted with an EDS detector with a high vacuum mode using secondary electrons and an acceleration tension of 30 kV. Snail shell samples were analysed by spreading them on carbon tape. Transmission electron microscopy images were obtained and the elemental compositions of the samples were determined. XRF analysis that analyzes the elemental chemical compositions of the snail shells was performed using an XRF machine (Oxford, ED 2000, England) in energy dispersive mode.2.4 Purification of shea butter oil
Solidified crude SBO was obtained from a local market in Ogbomosho North Local Government Area (8.1335° N, 4.2538° E), Oyo State, Nigeria. It was purified by heating and stirring in a conical flask placed on a water bath mounted on a hot-plate magnetic stirrer until it turns into a homogenized liquid. The molten SBO was then filtered by using glass wool in a funnel to remove its impurities. The filtered oil was collected, cooled and used for the subsequent experimental procedure.2.5 Process optimization of acid-catalyzed esterification of shea butter oil
A summary of the design variable levels that were considered in this study is presented in Table 1. These levels were used to generate 16 experimental runs. Each experiment was performed in triplicate, and the average values were recorded. Process variables such as the molar ratio, reaction temperature, reaction time, concentration of acid-catalyst, and agitation speed of the reaction were optimized using Half Factorial Design (HFD) of the Design of Experiment (DOE) software (10.0.1). The process optimization was done using the optimization tool based on the desirability function for the esterification conditions of SBO. To achieve the best selection case, the reaction variables were set to minimum levels, while the FFA content was set to maximum.| Variable | Units | Low actual | High actual | Low coded | High coded | |
|---|---|---|---|---|---|---|
| Molar ratio | M | 6.00 | 9.00 | −1.00 | 1.00 | |
| Reaction temperature | °C | 75.00 | 78.00 | −1.00 | 1.00 | |
| Reaction time | min | 90.00 | 120.00 | −1.00 | 1.00 | |
| Concentration of catalyst | wt% | 6.00 | 6.50 | −1.00 | 1.00 | |
| Agitation speed | rpm | 600.00 | 650.00 | −1.00 | 1.00 | |
A measured amount of SBO was poured into a three-neck round bottom flask in which a thermometer was fixed to one of its side necks to measure temperature changes, a reflux condenser was fixed to its middle neck to cool the water/alcohol vapour, and its third neck was covered with glass cork. The flask was then placed on a hot-plate magnetic stirrer to provide the necessary heat and agitation speed for the process. Ethanol was added to this volume of SBO according to the experimental design. The mixture was heated to the desired experimental temperature with vigorous agitation speed at the corresponding revolutions per minute until it turned murky. A measured volume of H2SO4 was added, while heating and agitation speed of the mixture continued for the corresponding reaction time. The product mixture was allowed to settle for 2 hours in a separating funnel which facilitates the separation of the mixture into two phases. The upper phase consists of esterified shea butter oil, while the lower phase consists of a mixture of ethanol, acid, and water. The upper phase was removed and subjected to heating at 110 °C for one hour in a hot-air oven to remove the remaining alcohol and water. The FFA value of the ESBO was determined.
2.6 Determination of the free fatty acid content of shea butter oil
Isopropanol was neutralized by pouring 50 ml of isopropanol into a conical flask, and the flask was mounted on a hot plate to bring its content to boil. 0.5 ml of 1.0% concentration of phenolphthalein was added to it to form a solution which was neutralized by titrating it with 0.25 M NaOH and shaken constantly until a faint permanent pink colour was obtained. 7.05 g of the shea butter oil was heated to 70 °C in another conical flask and allowed to homogenize thoroughly. 50 ml of the prepared neutralized solvent was added to the oil sample in a conical flask, and the flask was heated to 40 °C on the hot plate. The mixture was then titrated with 0.25 M NaOH, constantly shaking until the first permanent pink colour occurred and persisted for 30 seconds. The free fatty acid (FFA) content of SBO was computed according to eqn (1)–(3) used by Ejeh and Aderemi.23 | (1) |
 | (2) |
 | (3) |
The experimental conditions that yield the lowest FFA percentage content of ESBO were used for mass production of ESBO that was used in the subsequent experimental procedure.
2.7 Process optimization of transesterification of esterified shea butter oil
Process variables such as the molar ratio, reaction temperature, reaction time, catalyst dosage, and agitation speed of the reaction were optimized using Half Factorial Design (HFD) under the Factorial Methodology of the Design of Experiment (DOE) software (10.0.1). The optimisation tool based on the desirability function was used to obtain the optimum biodiesel production conditions from SBO. To achieve the best selection case for biodiesel production, the reaction variables were set to minimum levels, while the response (biodiesel yield) was set to maximum. A summary of the design variable levels considered in this process is presented in Table 2, and these variable levels were used to conduct each experiment of the sixteen experimental runs.| Variable | Units | Low actual | High actual | Low coded | High coded | |
|---|---|---|---|---|---|---|
| Molar ratio | M | 6.00 | 9.00 | −1.00 | 1.00 | |
| Reaction temperature | °C | 75.00 | 78.00 | −1.00 | 1.00 | |
| Reaction time | min | 90.00 | 120.00 | −1.00 | 1.00 | |
| Concentration of catalyst | wt% | 3.00 | 5.00 | −1.00 | 1.00 | |
| Agitation speed | rpm | 600.00 | 650.00 | −1.00 | 1.00 | |
A measured volume of ethanol was poured into this flask according to the experimental design, and the flask was placed on a hot plate magnetic stirrer to provide necessary heat and agitation speed for the process. The content of the flask was agitated vigorously and heated to the corresponding reaction temperature to boil for five minutes to activate the catalyst. A measured quantity of optimum ESBO from FFA reduction (64.79%) was added to the content of the flask while heating and agitation speed of the mixture were continued until the preset reaction time was reached. The mixture was allowed to settle overnight in a separating funnel to facilitate separation of the mixture into two phases. The lower phase which contained ESBOB was drained into a beaker and heated in a hot-air oven at 110 °C for one hour to remove excess ethanol and traces of water after which its percentage yield was determined.
The percentage error between the predicted and actual values, as expressed in eqn (4), was computed to determine the degree of variation between the two biodiesel yields.
 | (4) |
2.8 Determination of the percentage yield of shea butter oil biodiesel
The percentage yield of ESBOB produced was calculated using eqn (5).23,35 | (5) |
The experimental conditions that gave the highest percentage yield of ESBOB were used for mass production of ESBOB that was used in the other experimental procedure.
2.9 Effect of process variables on the yield of shea butter oil biodiesel
The effects of selected process variables gathered from the literature were investigated on the yield of ESBOB under optimum conditions. The effect of the molar ratio on the yield of ESBOB was investigated at a ratio of 9![[thin space (1/6-em)]](https://www.rsc.org/images/entities/char_2009.gif) :
:![[thin space (1/6-em)]](https://www.rsc.org/images/entities/char_2009.gif) 1 (optimum value) at intervals of 1.0 M. The effect of the reaction temperature on the yield of ESBOB was investigated at 78 °C (optimum value) at intervals of 1 °C. The effect of the reaction time on the yield of ESBOB was investigated at 15 minutes (optimum value) at intervals of 1 minute. The effect of the base concentration on the yield of ESBOB was investigated at 3 wt% (optimum value) at intervals of 0.5%. The effect of the agitation speed on the yield of ESBOB was investigated at 600 rpm (optimum value) at intervals of 10 rpm.
1 (optimum value) at intervals of 1.0 M. The effect of the reaction temperature on the yield of ESBOB was investigated at 78 °C (optimum value) at intervals of 1 °C. The effect of the reaction time on the yield of ESBOB was investigated at 15 minutes (optimum value) at intervals of 1 minute. The effect of the base concentration on the yield of ESBOB was investigated at 3 wt% (optimum value) at intervals of 0.5%. The effect of the agitation speed on the yield of ESBOB was investigated at 600 rpm (optimum value) at intervals of 10 rpm.
3. Results and discussion
3.1 Results of characterization of snail shells
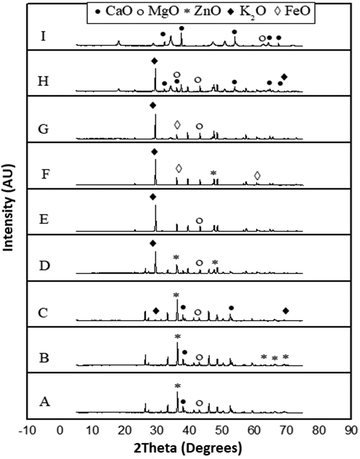
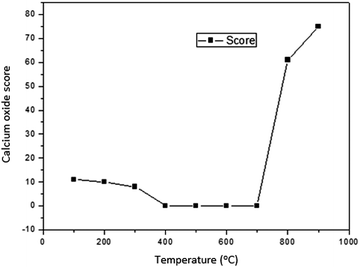
The results of characterization of catalysts obtained by calcination of snail shells at different temperatures are as follows:There was no calcium oxide in the snail shell samples calcined at 400, 500, 600 and 700 °C. This could be as a result of the formation of some calcium based compounds in them that negate the formation of calcium oxide in these snail shell samples. The content of calcium oxide was 61 in the snail shell calcined at 800 °C and 75 in that calcined at 900 °C. The high scores of calcium oxide observed at these elevated temperatures could be ascribed to the fact that there is total destruction of organic molecules at elevated calcination temperatures, leaving behind the inorganic elements intact, which can be oxygenated to produce high contents of the elements present in the snail shell such as calcium oxide as was observed in the XRD analytical report of the snail shells calcined at 100, 200, 300, 800 and 900 °C. The highest content was also reported by Laskar et al.32 It is important to note that the composition used in the XRD result indicated how close the candidate compounds are to the peak position and the relative intensity ratio. The highest value is 100. This indicates perfect match.
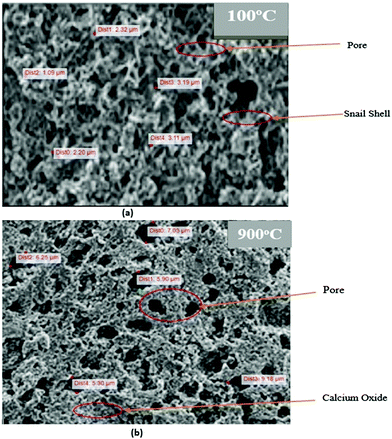 | ||
| Fig. 5 (a) SEM analysis of the snail shell oven-dried at 100 °C and (b) SEM analysis of the snail shell calcined at 900 °C. | ||
This is in agreement with the report of Trisupakitti et al.8 and Laskar et al.32 that concluded that heat leads to degradation of the organic substance in the snail shell, leaving the inorganic intact (CaO), which is brittle and more easily ground. This observation is also evident in the size of the pores formed in each of the structures as shown in Fig. 5a and b. Fig. 5a shows that the average pore sizes range from 5.30 to 9.18 μm, and Fig. 5b shows that the average pore sizes range from 1.09 to 3.19 μm. This shows that the snail shell calcined at 900 °C exhibits more catalytic properties than that oven-dried at 100 °C.
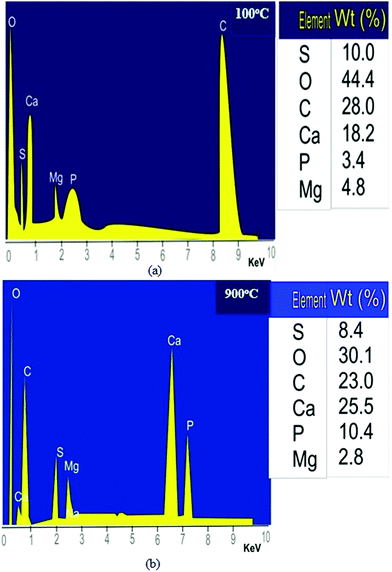 | ||
| Fig. 6 (a) EDS analysis of the snail shell oven-dried at 100 °C and (b) EDS analysis of the snail shell calcined at 900 °C. | ||
Fig. 6a and b show a decrease in carbon percentage from 10.40 to 8.40% as the percentage of calcium increased from 18.20 to 25.50% as the calcination temperature increased from 100 to 900 °C, which may be due to the decomposition of CaCO3 to CaO with the release of CO2 in accordance with the work of Laskar et al.32 The decrease in sulphur percentage from 10.00 to 8.40 as the calcination temperature increased may be due to the volatility of sulphur as the temperature increased. Calcium and phosphorus are the major constituents of any carbonaceous materials (biomass) such as snail shells. They occur as complex compounds and heat effects set them free, thus increasing their concentration. Magnesium is a mild element that reacts with oxygen during combustion to form compounds such as magnesium oxide; thus, its content decreased from 4.80 to 2.80%. This is in agreement with the work of Laskar et al.32 who used energy-dispersive X-ray spectroscopy (EDS), amongst the other methods, to characterize a waste snail shell as a catalyst in soybean oil biodiesel production. They reported that calcium, oxygen and carbon were the major elements among the other elements present in both the uncalcined and calcined snail shells characterized.
3.2 Esterification of the shea butter oil
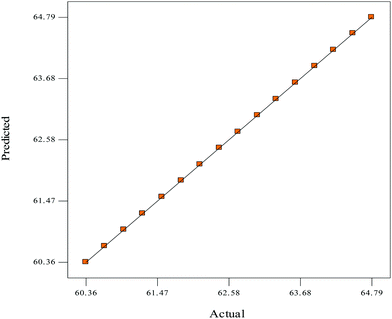
The experimental design for the esterification of shea butter oil (ESBO) is shown in factorial design (Table 3). The design generated sixteen16 experimental runs, and experimental run 2 (9 M, 78 °C, 120 min, 6.5 ml and 650 rpm) had the highest value (64.79%) of FFA reduction, while experimental run 8 (6 M, 78 °C, 120 min, 6.5 ml and 600 rpm) had the least value (60.36%) of FFA reduction (Table 3). The final tool factor interaction (2FI) empirical model in terms of coded factors for the ESBO for both the significant and insignificant terms is expressed in eqn (6) as: | (6) |
| Run | Factors | Response | |||||
|---|---|---|---|---|---|---|---|
| A | B | C | D | E | FFA | ||
| Ethanol molar ratio (M) | Temperature (°C) | Reaction time (min) | H2SO4 (ml) | Agitation speed (rpm) | Actual (%) | Predicted (%) | |
| 1 | 9.0 | 75.0 | 90.0 | 6.50 | 650.0 | 64.50 | 64.50 |
| 2 | 9.0 | 78.0 | 120.0 | 6.50 | 650.0 | 64.79 | 64.79 |
| 3 | 9.0 | 78.0 | 90.0 | 6.00 | 650.0 | 63.91 | 63.91 |
| 4 | 9.0 | 78.0 | 90.0 | 6.50 | 600.0 | 63.31 | 63.31 |
| 5 | 6.0 | 75.0 | 90.0 | 6.00 | 650.0 | 62.43 | 62.43 |
| 6 | 6.0 | 78.0 | 120.0 | 6.00 | 650.0 | 60.95 | 60.95 |
| 7 | 9.0 | 75.0 | 120.0 | 6.00 | 650.0 | 62.72 | 62.72 |
| 8 | 6.0 | 78.0 | 120.0 | 6.50 | 600.0 | 60.36 | 60.36 |
| 9 | 9.0 | 75.0 | 90.0 | 6.00 | 600.0 | 63.02 | 63.02 |
| 10 | 6.0 | 78.0 | 90.0 | 6.00 | 600.0 | 62.13 | 62.13 |
| 11 | 9.0 | 75.0 | 120.0 | 6.50 | 600.0 | 64.20 | 64.20 |
| 12 | 9.0 | 78.0 | 120.0 | 6.00 | 600.0 | 63.61 | 63.61 |
| 13 | 6.0 | 75.0 | 120.0 | 6.50 | 650.0 | 61.54 | 61.54 |
| 14 | 6.0 | 78.0 | 90.0 | 6.50 | 650.0 | 60.65 | 60.65 |
| 15 | 6.0 | 75.0 | 90.0 | 6.50 | 600.0 | 61.24 | 61.24 |
| 16 | 6.0 | 75.0 | 120.0 | 6.00 | 600.0 | 61.84 | 61.84 |
The low value of standard deviation for ESBO was an indication that the predicted value for the model was considered as suitable to correlate the experimental data.38 “Adeq Precision”, which measures the signal to noise ratio, is 915.057 (greater than 4) and is a desirable adequate signal necessary for the model to navigate the design space. The model terms are considered as significant if the value of Prob > F is less than 0.05. The relatively high model F-value of 84943.93 (Table 4) implies that the model is significant and that there is only 0.27% chance that the model F-value could occur due to noise.37 The values of “Prob > F” less than 0.10 indicate that the model terms are significant and values greater than 0.10 indicate that the model terms are not significant; thus A, B, C, E, AB, AC, AD, AE, BC, BD, CD, CE and DE are significant model terms.
| Source | Sum of squares | df | Mean square | F value | Prob > F |
|---|---|---|---|---|---|
| a Significant at p < 0.05, R-squared 1.0000, A – ethanol molar ratio, B – reaction temperature, C – time, E – agitation speed, D – catalyst concentration. | |||||
| Model | 29.73 | 14 | 2.12 | 84943.93 | 0.0027a |
| A4 | 22.37 | 1 | 22.37 | 8.949 × 10⁵ | 0.0007a |
| B | 0.023 | 1 | 0.023 | 900.00 | 0.0212a |
| C | 0.087 | 1 | 0.087 | 3481.00 | 0.0108a |
| E | 0.023 | 1 | 0.023 | 900.00 | 0.0212a |
| AB | 2.66 | 1 | 2.66 | 1.063 × 10⁵ | 0.0020a |
| AC | 0.34 | 1 | 0.34 | 13689.00 | 0.0054a |
| AD | 3.15 | 1 | 3.15 | 1.260 × 10⁵ | 0.0018a |
| AE | 0.022 | 1 | 0.022 | 900.00 | 0.0212a |
| BC | 0.20 | 1 | 0.20 | 7921.00 | 0.0072a |
| BD | 0.021 | 1 | 0.021 | 841.00 | 0.0219a |
| BE | 0.000 | 1 | 0.000 | 0.000 | 1.0000 |
| CD | 0.79 | 1 | 0.79 | 31684.00 | 0.0036a |
| CE | 0.021 | 1 | 0.021 | 841.00 | 0.0219a |
| DE | 0.021 | 1 | 0.021 | 841.00 | 0.0219a |
| Residual | 2.500 × 10⁻⁵ | 1 | 2.500 × 10⁻⁵ | ||
| Cor total | 29.73 | 15 | |||
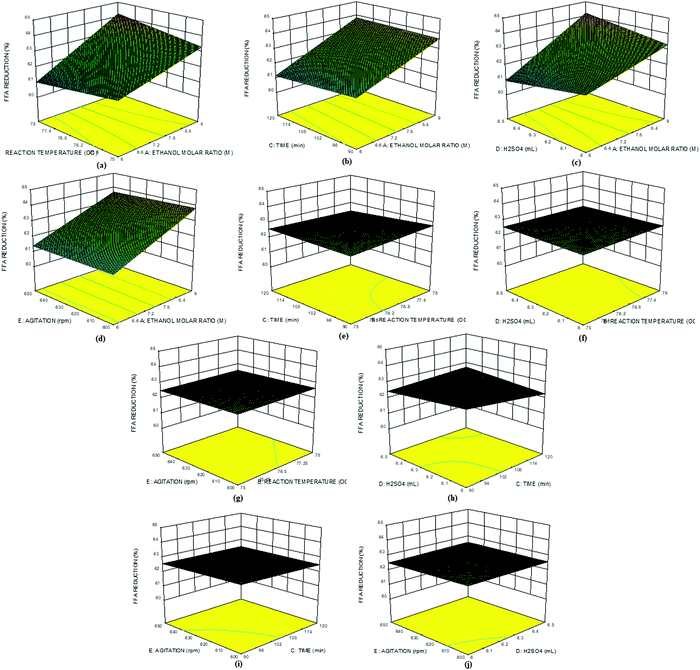
Fig. 8a–j show the 3D plots for the interactive effects among all the selected factors on the %FFA content of the ESBO. Fig. 8a shows that the interaction between the molar ratio and reaction temperature led to a reduction in %FFA content of ESBO as the two factors increased. Similar trends were observed in the interaction between the molar ratio and reaction time (Fig. 8b), molar ratio and catalyst concentration (Fig. 8c), and molar ratio and agitation speed (Fig. 8d). The interaction between reaction temperature and reaction time also showed a slight increase in the %FFA reduction (Fig. 8e). This suggests that an increase in the reaction time and temperature is unfavourable for the FFA reduction in the ESBO. Similar trends were also observed in the interaction plots of catalyst concentration and reaction temperature (Fig. 8f), reaction temperature and agitation speed (Fig. 8g), and reaction time and catalyst concentration (Fig. 8h). Interaction of reaction time with agitation speed indicated a very slight increase in the %FFA reduction (Fig. 8i). Fig. 8j shows an interaction between agitation speed and catalyst concentration. Essentially, all the factors interacting with the molar ratio reduced the %FFA content of ESBO, thus indicating the importance of the alcohol/oil ratio in the % FFA content reduction. Fig. 8a–j further indicates that reduction of %FFA content in the ESBO is effectively influenced by the molar ratio, reaction temperature and reaction time while keeping the catalyst concentration (6.25 ml) and agitation speed (625 rpm) constant.
3.3 Transesterification of the esterified shea butter oil
The experimental results for biodiesel production are presented in Table 5. Experimental run 4 was found to have the highest value of 97.4% biodiesel yield, while experimental run 15 had the least value of 87.45% biodiesel yield. The final empirical model in terms of coded factors for the trans-esterification of ESBOB for both the significant and insignificant terms is expressed in eqn (7) as: | (7) |
| Run | Response | Response | Residual | |||||
|---|---|---|---|---|---|---|---|---|
| A | B | C | D | E | Biodiesel yield | |||
| Molar ratio (M) | Reaction temperature (°C) | Reaction time (min) | Catalyst conc. (wt%) | Agitation speed | Actual | Predicted | ||
| 1. | 6.00 | 78.00 | 15.00 | 5.00 | 600.00 | 96.20 | 96.20 | 0.000 |
| 2. | 6.00 | 75.00 | 15.00 | 5.00 | 650.00 | 97.25 | 97.26 | −0.001 |
| 3. | 9.00 | 75.00 | 15.00 | 5.00 | 600.00 | 95.30 | 95.30 | 0.000 |
| 4. | 9.00 | 78.00 | 15.00 | 3.00 | 600.00 | 97.40 | 97.38 | 0.002 |
| 5. | 6.00 | 75.00 | 10.00 | 5.00 | 600.00 | 94.00 | 93.98 | 0.002 |
| 6. | 6.00 | 78.00 | 15.00 | 3.00 | 650.00 | 95.50 | 95.53 | −0.003 |
| 7. | 9.00 | 75.00 | 10.00 | 3.00 | 600.00 | 92.05 | 92.05 | 0.000 |
| 8. | 6.00 | 75.00 | 10.00 | 3.00 | 650.00 | 97.00 | 97.00 | 0.000 |
| 9. | 6.00 | 75.00 | 15.00 | 3.00 | 600.00 | 90.05 | 90.08 | −0.003 |
| 10. | 6.00 | 78.00 | 10.00 | 5.00 | 650.00 | 89.50 | 89.48 | 0.002 |
| 11. | 9.00 | 78.00 | 10.00 | 3.00 | 650.00 | 97.30 | 97.30 | 0.000 |
| 12. | 9.00 | 78.00 | 10.00 | 5.00 | 600.00 | 96.00 | 96.03 | −0.003 |
| 13. | 9.00 | 75.00 | 15.00 | 3.00 | 650.00 | 97.35 | 97.33 | 0.002 |
| 14. | 9.00 | 75.00 | 10.00 | 5.00 | 650.00 | 96.50 | 96.53 | −0.003 |
| 15. | 6.00 | 78.00 | 10.00 | 3.00 | 600.00 | 87.45 | 87.45 | 0.000 |
| 16. | 9.00 | 78.00 | 15.00 | 5.00 | 650.00 | 97.30 | 97.30 | 0.000 |
The quality of the model developed was evaluated based on the R2 value. The model developed seems to be the best for low standard deviation and high R2 that is closer to unity, thus making the predicted value closer to the actual value of the response.37 In this experiment, the R2 value for eqn (7) was 1.0000, the standard deviation value was 0.05, the mean value was 94.59, the coefficient of variation (C.V.%) was 0.075, adjusted (Adj) R2 was 0.9995, and adequate (Adeq) precision was 145.287. A high value of R2 for eqn (7) was an indication that the predicted value for ESBOB would be more accurate and closer to its actual value.38 Adeq Precision measures the signal-to-noise ratio of 145.287 (greater than 4), and this is a desirable adequate signal necessary for the model to navigate the design space.
| Source | Sum of squares | df | Mean square | F value | p-Value Pro > F |
|---|---|---|---|---|---|
| a Significant at p < 0.05, R-squared 1.0000, A – ethanol molar ratio, B – reaction temperature, C – time, D – catalyst concentration, E – agitation speed. | |||||
| Model | 149.60 | 13 | 11.51 | 2301.48 | 0.0163a |
| A | 11.34 | 1 | 11.34 | 2268.75 | 0.0134a |
| B | 3.08 | 1 | 3.08 | 616.33 | 0.0256a |
| C | 20.72 | 1 | 20.72 | 4144.08 | 0.0099a |
| D | 7.82 | 1 | 7.82 | 1564.08 | 0.0161a |
| E | 7.59 | 1 | 7.59 | 1518.75 | 0.0163a |
| AB | 4.77 | 1 | 4.77 | 954.08 | 0.0206a |
| AE | 3.84 | 1 | 3.84 | 768.00 | 0.0230a |
| BC | 19.26 | 1 | 19.26 | 3852.08 | 0.0103a |
| BD | 0.010 | 1 | 0.010 | 2.08 | 0.3857 |
| BE | 16.50 | 1 | 16.50 | 3300.08 | 0.0111a |
| CD | 0.20 | 1 | 0.20 | 40.33 | 0.0994 |
| CE | 0.48 | 1 | 0.48 | 96.33 | 0.0646 |
| DE | 9.88 | 1 | 9.88 | 1976.33 | 0.0143a |
| Residual | 5.000 × 10⁻³ | 1 | 5.000 × 10⁻³ | ||
| Cor total | 149.60 | 14 | |||
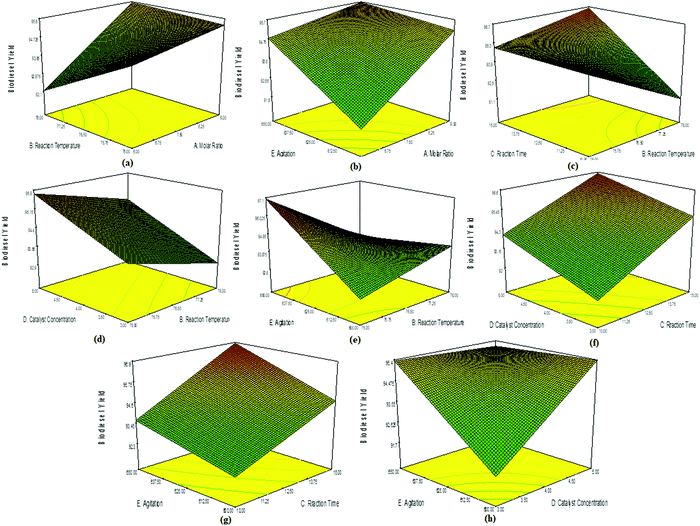
A slight decrease in biodiesel yield was observed in the interaction plots of reaction time and reaction temperature (Fig. 9c), concentration and reaction temperature (Fig. 9d), and agitation speed and reaction temperature (Fig. 9e). The interaction plot between catalyst concentration and reaction time showed a linear trend, but an increase in the % biodiesel yield (Fig. 9f). This indicated that an increase in reaction time was favourable for the conversion to ESBOB until the all the reactants disappeared and the product remained constant. A similar trend was observed in the interaction plot of agitation speed and reaction time (Fig. 9g), as well as agitation speed and catalyst concentration (Fig. 9h). Essentially, all the factors having interaction with the reaction temperature and molar ratio affect the % conversion yield of ESBOB, which indicates the importance of these two factors in the % conversion yield of ESBOB. The ESBOB % conversion yield is therefore effectively influenced by the molar ratio, reaction temperature, agitation speed, catalyst concentration and reaction time.
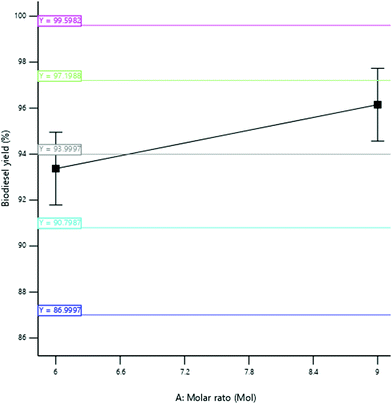
3.3.2.1 Effect of the molar ratio. The yield of SBOB increased from 97 to 97.55% as the ratio of ethanol to esterified shea butter oil increased from ratio 7
![[thin space (1/6-em)]](https://www.rsc.org/images/entities/char_2009.gif) :
:![[thin space (1/6-em)]](https://www.rsc.org/images/entities/char_2009.gif) 1 to 11
1 to 11![[thin space (1/6-em)]](https://www.rsc.org/images/entities/char_2009.gif) :
:![[thin space (1/6-em)]](https://www.rsc.org/images/entities/char_2009.gif) 1 (Fig. 10). This enhances the catalytic performance of the snail shell catalyst in lowering the activation energy of the reaction to facilitate the reaction, thus resulting in an increase in SBOB yield. It can be deduced that the reaction will not be completed if an insufficient volume of alcohol (ethanol) is added to the reaction medium, as also reported by Kundu et al.11 The result is in agreement with the findings of Kumar and Sharma.39 They produced biodiesel from microalgal oil and reported an increase in the biodiesel yield obtained from 50 to 98% as the molar ratio of methanol to oil increased in biodiesel production from 3
1 (Fig. 10). This enhances the catalytic performance of the snail shell catalyst in lowering the activation energy of the reaction to facilitate the reaction, thus resulting in an increase in SBOB yield. It can be deduced that the reaction will not be completed if an insufficient volume of alcohol (ethanol) is added to the reaction medium, as also reported by Kundu et al.11 The result is in agreement with the findings of Kumar and Sharma.39 They produced biodiesel from microalgal oil and reported an increase in the biodiesel yield obtained from 50 to 98% as the molar ratio of methanol to oil increased in biodiesel production from 3![[thin space (1/6-em)]](https://www.rsc.org/images/entities/char_2009.gif) :
:![[thin space (1/6-em)]](https://www.rsc.org/images/entities/char_2009.gif) 1 to 8
1 to 8![[thin space (1/6-em)]](https://www.rsc.org/images/entities/char_2009.gif) :
:![[thin space (1/6-em)]](https://www.rsc.org/images/entities/char_2009.gif) 1. The result was further in agreement with the findings of Hossain and Mazen.40 They produced biodiesel from waste soybean oil biomass and reported an increase in the biodiesel yield obtained up to 71.2% at the 3
1. The result was further in agreement with the findings of Hossain and Mazen.40 They produced biodiesel from waste soybean oil biomass and reported an increase in the biodiesel yield obtained up to 71.2% at the 3![[thin space (1/6-em)]](https://www.rsc.org/images/entities/char_2009.gif) :
:![[thin space (1/6-em)]](https://www.rsc.org/images/entities/char_2009.gif) 1 methanol to oil ratio. The result is furthermore in agreement with the results of Kundu et al.,11 who produced biodiesel from non-edible castor oil and reported an increase in biodiesel yield from 82 to 92% as the molar ratio increased from 5
1 methanol to oil ratio. The result is furthermore in agreement with the results of Kundu et al.,11 who produced biodiesel from non-edible castor oil and reported an increase in biodiesel yield from 82 to 92% as the molar ratio increased from 5![[thin space (1/6-em)]](https://www.rsc.org/images/entities/char_2009.gif) :
:![[thin space (1/6-em)]](https://www.rsc.org/images/entities/char_2009.gif) 1 to 15
1 to 15![[thin space (1/6-em)]](https://www.rsc.org/images/entities/char_2009.gif) :
:![[thin space (1/6-em)]](https://www.rsc.org/images/entities/char_2009.gif) 1.
1.
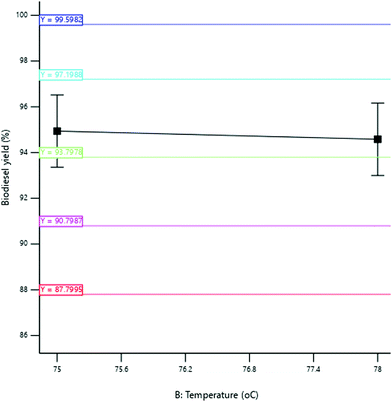
3.3.2.2 Effect of reaction temperature. The yield of SBOB increased from 96.50 to 97.40% as the reaction temperature increased from 76 to 78 °C after which the SBOB yield remained constant with a further increase in reaction temperature to 80 °C (Fig. 11). The increase in temperature led to an increase in the average kinetic energy of the molecules of the reactant that led to an increase in the rate of the reaction.39 This increased the SBOB yield after which the reaction proceeded to completion. The result is in agreement with the findings of Kumar and Sharma,39 who produced biodiesel from microalgal oil and reported an increase in the yield of the biodiesel obtained from 50 to 93.5% as the temperature increased from 30 to 60 °C. The result was further in agreement with the results of Kundu et al.,11 who produced biodiesel from non-edible castor oil and reported an increase in the biodiesel yield from 82 to 90% as the reaction temperature increased from 40 to 60 °C.
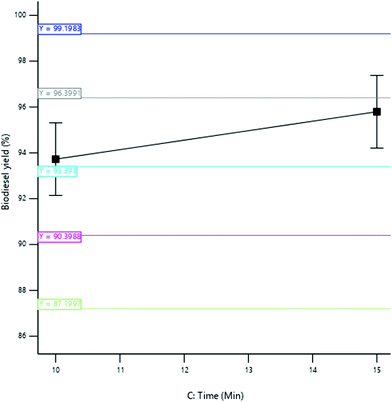
3.3.2.3 Effect of reaction time. The yield of SBOB increased from 97.10 to 97.48% as the reaction time increased from 11 to 19 minutes (Fig. 12). The increase in reaction time resulted in a corresponding increase in SBOB yield until a time (19 min) was reached where all the reactants disappeared and the product remained constant. An additional reaction time may not improve the biodiesel yield, but rather increases the production cost.11 The result is in agreement with the results of Kumar and Sharma,39 who produced biodiesel from microalgal oil and reported an increase in the yield of biodiesel obtained from 55 to 98% as the reaction time increased from 10 to 60 min. The result was further in agreement with the findings of Aworanti et al.,41 who produced biodiesel from waste cooking oil and reported an increase in the yield of the biodiesel obtained from 89.5 to 94.2% as the reaction time increased from 30 to 60 minutes.
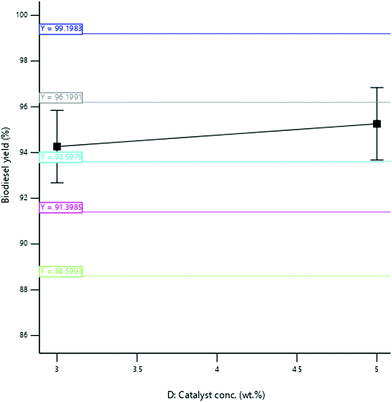
3.3.2.4 Effect of catalyst concentration. The yield of SBOB increased from 92.50 to 97.45% as the catalyst concentration increased from 2 to 3.5% (w/v); thereafter, the biodiesel yield decreased to 96.25% when the catalyst concentration was increased to 4.0% (w/v) (Fig. 13). The increase in the concentration of the catalyst of the reaction increased the rate of reaction, and after the optimum concentration (3 wt%) of the catalyst in the reaction was achieved, an additional increase in the concentration of catalyst in the reaction inhibited the reaction.39 The result is in agreement with the findings of Hossain and Mazen,40 who produced biodiesel from waste soybean oil biomass and reported an increase in the yield of the biodiesel obtained up to 72.7% as the concentration of the catalyst increased from 0.5
![[thin space (1/6-em)]](https://www.rsc.org/images/entities/char_2009.gif) :
:![[thin space (1/6-em)]](https://www.rsc.org/images/entities/char_2009.gif) 1% (w/v). The result was further in agreement with the results of Aworanti et al.,41 who produced biodiesel from waste cooking oil and reported an increase in the yield of the biodiesel obtained from 91.5 to 94.31% as the catalyst concentration increased from 1.0 to 3.0% (w/v).
1% (w/v). The result was further in agreement with the results of Aworanti et al.,41 who produced biodiesel from waste cooking oil and reported an increase in the yield of the biodiesel obtained from 91.5 to 94.31% as the catalyst concentration increased from 1.0 to 3.0% (w/v).
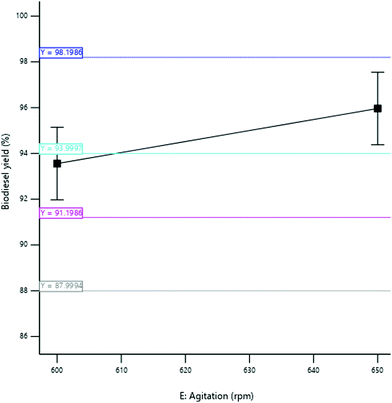
3.3.2.5 Effect of agitation speed. The yield of SBOB increased from 95.50 to 97.44% as the agitation speed of the mixture increased from 580 to 620 rpm (Fig. 14). This increase in the stirring rate of the reaction increased the interaction of the reactants that increased the collision rate of the reactant molecules, thus increasing the yield of the product. The result is in agreement with the results of Ogbu and Ajiwe,42 who produced biodiesel from Cucurbita pepo seed oil and reported an increase in the yield of the biodiesel obtained from 58 to 95% as the agitation speed increased from 0 to 200 rpm. The conversion of triglycerides into FAME is greatly affected by the agitation speed rate because it enhances the inter-molecular contact of reactants (oil, alcohol, and catalyst) during transesterification.43,44 According to Demirbas,45 an increase in agitation speed was found to have a corresponding increase in biodiesel production, while lower agitation speed showed poor product formation as a result of the reverse nature of transesterification reaction.
The percentage error difference between the numerical and experimental ESBOB yields was 0.15%, which indicated no significant difference and level of acceptability of the experiment. A higher biodiesel yield was obtained in this work when compared to results from Aworanti et al.,41 Charoenchaitrakool and Thienmethangkoon,47 Zhang et al.,48 and Wang et al.49 Compared to an optimization study on central composite design (CCD) for shea butter transesterification using KOH,50 a yield higher by 5% was obtained in this study. Commercial CaO used to produce biodiesel from ESBO was further used to validate the efficiency and economic importance of the heterogeneous catalyst developed. A yield of 99.44% was obtained using the optimized conditions suggested by the software. The percentage difference of 1.89% in the biodiesel yield compared to the experimental optimum was recorded, indicating that the heterogeneous catalyst developed from waste snail shells can effectively substitute commercial CaO.
3.4 Physicochemical properties of shea butter oil biodiesel (SBOB)
The physicochemical properties of SBOB are presented in Table 7. It was found that the specific gravity, viscosity, pH, iodine value, cetane number, flash point, fire point, cloud point, and pour point of SBOB are 0.895 kg m−3, 5.794 mm2 s−1, 5.50, 0.51, 56.0, 121 °C, 130 °C, 10 °C, and 14 °C, respectively. The values obtained for most of the physicochemical properties of the SBOB compared well with the specifications of American Society for Testing and Materials (ASTM D 975 and D 6751), the European Biodiesel Standard (EN 14214) and the Bureau of Indian Standards (BIS).| Blend | B100 | Diesel ASTM D 975 | B100 ASTM D 6751 | B100 EN 4214 | B100 BIS |
|---|---|---|---|---|---|
| B100 – shea butter oil biodiesel (SBOB), ASTM – American Society for Testing and Materials (Ved and Padam,51 Barabas and Todorut52), EN – European Organization (Ved and Padam,51 Barabas and Todorut),52 BIS – Bureau of Indian Standards (Bhandare and Naik,13 Barabas and Todorut52). | |||||
| Specific gravity at 15 °C (kg m−3) | 0.895 | 0.84 | ≤0.90 | ≤0.90 | ≤0.90 |
| Viscosity at 40 °C (mm2 s−1) | 5.794 | 1.3 to 4.1 | 1.4 to 6.0 | 3.5 to 5.0 | 2.5 to 6.0 |
| pH value | 5.50 | — | — | — | — |
| Iodine value (mg kg−1) | 0.51 | — | — | — | |
| Cetane number | 56.0 | 48 to 50 | ≥47 | ≥51 | ≥51 |
| Flash point (°C) | 121 | 60 to 93 | 100 to 170 | ≥120 | ≥120 |
| Fire point (°C) | 130 | — | ≥120 | ≥120 | ≥120 |
| Cloud point (°C) | 10 | −3 to 12 | −3 to 12 | −3 to 12 | −3 to 12 |
| Pour point (°C) | 14 | −35 to 15 | −15 to 16 | −15 to 16 | −15 to 16 |
| Carbon content (wt%) | 0.12 | 0.86 | ≤0.2 | ≤0.3 | ≤0.05 |
| Sulphur content (wt%) | 0.00 | ≤0.05 | ≤0.05 | ≤10 | ≤50 |
| Heating value (MJ kg−1) | 34.2 | 43 to 46 | ≤37.12 | ≤37.12 | ≤37.12 |
| Ash content (wt%) | 0.010 | 0.02 | ≤0.02 | ≤0.02 | ≤0.02 |
4. Conclusions
This study dealt with synthesis of biodiesel from shea butter oil through experimental exploration of its FFA reduction and transesterification using an active heterogeneous catalyst derived from giant African snail (Archachatina marginata) shells. The study showed that shea butter oil is a suitable oil feedstock for biodiesel production via a two-step transesterification process. Optimum experimental conditions for producing a heterogeneous catalyst from snail shells were established for application in the catalysis of quality shea butter biodiesel synthesis. This would pave the way for large-scale production of shea butter biodiesel and its blends as renewable energy sources for home and industrial applications and safer alternatives to petroleum diesel fuel. More research investigations into the recoverability and reusability of the snail shell derived heterogeneous catalyst are suggested for further studies on transesterification of SBO.Based on the results obtained, the following conclusions can be summarized:
(i) Snail shells were characterized as heterogeneous catalysts and the sample calcined at a temperature of 900 °C had the highest CaO yield.
(ii) The lowest value of 60.36% SBO FFA reduction was obtained under optimum conditions of the 6![[thin space (1/6-em)]](https://www.rsc.org/images/entities/char_2009.gif) :
:![[thin space (1/6-em)]](https://www.rsc.org/images/entities/char_2009.gif) 1 molar ratio, 78 °C reaction temperature, 120 min reaction time, 6.5 ml catalyst concentration, and 600 rpm agitation speed.
1 molar ratio, 78 °C reaction temperature, 120 min reaction time, 6.5 ml catalyst concentration, and 600 rpm agitation speed.
(iii) The highest SBOB yield value of 97.40% was obtained under optimum experimental conditions of the 9![[thin space (1/6-em)]](https://www.rsc.org/images/entities/char_2009.gif) :
:![[thin space (1/6-em)]](https://www.rsc.org/images/entities/char_2009.gif) 1 molar ratio, 78 °C reaction temperature, 15 min reaction time, 3 wt% catalyst concentration, and 600 rpm agitation speed.
1 molar ratio, 78 °C reaction temperature, 15 min reaction time, 3 wt% catalyst concentration, and 600 rpm agitation speed.
(iv) The specific gravity, viscosity, pH value, iodine value, cetane number, flash point, cloud point, pour point, carbon content, sulphur content, heating value, ash content values obtained were within the specifications of ASTM D 975, ASTM D 6751, EN 4214 and the BIS.
(v) All the process variables (snail shell dosage, ethanol to oil ratio, reaction temperature, reaction time and agitation speed) had significant effects on the yield of ESBOB under optimum conditions.
Conflicts of interest
No potential conflict of interest was reported by the authors.Acknowledgements
The authors would like to express their thanks to the scholars whose articles are cited and included in the references of this manuscript. The authors also thank the authors/editors/publishers of all the articles and journals from where the research article has been studied and discussed.References
- H. Husin, A. Abubakar, S. Ramadhani, C. F. B. Sijabat and F. Hasfita Coconut husk ash as heterogenous catalyst for biodiesel production from cerbera manghas seed oil. In: MATEC Web of Conferences, 2018.
- N. I. Mohammed, N. A. Kabbashi, A. O. Alade and S. Sulaiman, Advancement in the Utilization of Biomass-Derived Heterogeneous Catalysts in Biodiesel Production, Green Sustainable Chem., 2018, 08(01), 74–91 CrossRef CAS.
- W. Roschat, S. Phewphong, P. Moonsin and A. Thangthong, The Kinetic Study of Transesterification Reaction for Biodiesel Production Catalyzed by CaO Derived from Eggshells, J. Mater. Sci. Appl. Energy, 2019, 8(1), 358–364 Search PubMed.
- I. M. Atadashi, M. K. Aroua, A. R. Abdul Aziz and N. M. N. Sulaiman, Membrane biodiesel production and refining technology: A critical review. Vol. 15, Renewable Sustainable Energy Rev., 2011, 5051–5062 CrossRef CAS.
- G. Wu, G. Jiang, Z. Yang and Z. Huang, Emission characteristics for waste cooking oil biodiesel blend in a marine diesel propulsion engine, Polish J. Environ. Stud., 2019, 28(4), 2911–2921 CrossRef CAS.
- N. A. Musa, G. M. Teran and S. A. Yaman, Comparative performance evaluation of a diesel engine run on diesel and biodiesel produced from coconut oil, J. Appl. Sci. Environ. Manage., 2019, 23(4), 689 CAS.
- O. Ogunkunle and N. A. Ahmed, A review of global current scenario of biodiesel adoption and combustion in vehicular diesel engines, Energy Rep., 2019, 5, 1560–1579 CrossRef . Available from: https://www.sciencedirect.com/science/article/pii/S2352484719302240?via%3Dihub.
- S. Trisupakitti, C. Ketwong, W. Senajuk, C. Phukapak and S. Wiriyaumpaiwong, Golden apple cherry snail shell as catalyst for heterogeneous transesterification of biodiesel, Brazilian J. Chem. Eng., 2018, 35(4), 1283–1291 CrossRef CAS.
- C. He, Y. Ge, J. Tan, K. You, X. Han and J. Wang, Characteristics of polycyclic aromatic hydrocarbons emissions of diesel engine fueled with biodiesel and diesel, Fuel, 2010, 89(8), 2040–2046 CrossRef CAS.
- O. Ogunkunle and N. A. Ahmed, Overview of biodiesel combustion in mitigating the adverse impacts of engine emissions on the sustainable human–environment scenario. Vol. 13, Sustainability, 2021, 5465 CrossRef CAS.
- A. Kundu, A. Mukherjee, G. Halder and D. Datta, A Kinetic Study on Acid Catalyzed Esterification of Free Fatty Acids In Ricinus Communis Oil for the Production of Biodiesel, Int. J. Res. Eng. Technol., 2016, 05(13), 31–44 CrossRef . Available from: https://ijret.org/volumes/2016v05/i13/IJRET20160513007.pdf.
- I. M. Atadashi, M. K. Aroua, A. R. Abdul Aziz and N. M. N. Sulaiman, The effects of water on biodiesel production and refining technologies: A review. Vol. 16, Renewable Sustainable Energy Rev., 2012, 3456–3470 CrossRef CAS.
- P. Bhandare and G. R. Naik, Physico-Chemical Properties of Biodiesel Produced from Neem Oil, Int. Lett. Chem. Phys. Astron., 2015, 47, 40–48 Search PubMed.
- E. Buyukkaya, Effects of biodiesel on a DI diesel engine performance, emission and combustion characteristics, Fuel, 2010, 89(10), 3099–3105 CrossRef CAS.
- M. Canakci, Combustion characteristics of a turbocharged DI compression ignition engine fueled with petroleum diesel fuels and biodiesel, Bioresour. Technol., 2007, 98(6), 1167–1175 CrossRef CAS PubMed.
- K. Bozbas, Biodiesel as an alternative motor fuel: Production and policies in the European Union. Vol. 12, Renewable Sustainable Energy Rev., 2008, 542–552 CrossRef CAS.
- O. J. Alamu, M. A. Waheed and S. O. Jekayinfa, Effect of ethanol-palm kernel oil ratio on alkali-catalyzed biodiesel yield, Fuel, 2008, 87(8–9), 1529–1533 CrossRef CAS.
- M. A. Adebayo, D. O. Ladipo, G. O. Kolawole, M. B. Sarumi, Y. Kira, A. A. Adebisi, et al., Vitellaria paradoxa (Gaertner, A.G) Hepper (syn. Butryoespernum paradoxoum, Ssp. PARII): Germplasm collection strategy, conservation and domestication potentials in Nigeria, Ibadan, Nigeria, 2006 Search PubMed.
- J. Okullo, F. Omujal, J. Agea, P. Vuzi, A. Namutebi and J. Okello, et al., Physico-Chemical characteristics of shea butter(Vitellaria paradoxa C.F. Gaertn.) oil from the Shea district of Uganda. African J Food, Agric. Nutr. Dev., 2010, 10(1), 2070–2084 CAS . Available from: http://www.ajol.info/index.php/ajfand/article/view/51484.
- Food and Agriculture Organization of the United Nations Statistics Division. Karite (Shea nut) production in Nigeria from 1961–2013. Food and Agricultural Organization Statistics. 2015 [cited 2015 Jul 9]. Available from: http://faostat3.fao.org/home/E.
- Food and Agriculture Organization of the United Nations. Living in and from the Forests of Central Africa. Non-Wood Forest Products. 2017 [cited 2021 Dec 5]. p. 258. Available from: https://www.fao.org/family-farming/background/en/.
- C. C. Enweremadu and O. J. Alamu, Development and characterization of biodiesel from shea nut butter, Int. Agrophys., 2010, 24(1), 29–34 CAS.
- J. Ejeh and B. Aderemi, Production of Biodiesel from Shea Butter Oil using Homogeneous Catalysts, Leonardo J. Sci., 2014,(24), 39–48 Search PubMed.
- T. C. Ong, R. Verel and C. Copéret, Solid-State NMR: Surface Chemistry Applications, Encycl. Spectrosc. Spectrom., 2017, 121–127 CAS.
- S. H. Dhawane, T. Kumar and G. Halder, Biodiesel synthesis from Hevea brasiliensis oil employing carbon supported heterogeneous catalyst: Optimization by Taguchi method, Renewable Energy, 2016, 89, 506–514 CrossRef CAS.
- S. Chowdhury, S. Dhawane, B. Jha, S. Pal, R. Sagar and A. Hossain, et al., Biodiesel synthesis from transesterified Madhuca indica oil by waste egg shell–derived heterogeneous catalyst: parametric optimization by Taguchi approach, Biomass Convers. Biorefinery, 2021, 11, 1171–1181 CrossRef.
- A. Buasri, N. Chaiyut, V. Loryuenyong, C. Wongweang and S. Khamsrisuk, Application of eggshell wastes as a heterogeneous catalyst for biodiesel production, Sustainable Energy, 2013, 1, 7–13 Search PubMed.
- Y. C. Sharma, B. Singh and J. Korstad, Application of an efficient nonconventional heterogeneous catalyst for biodiesel synthesis from pongamia pinnata oil, Energy Fuels, 2010, 3223–3231 CrossRef CAS.
- Z. Wei, C. Xu and B. Li, Application of waste eggshell as low-cost solid catalyst for biodiesel production, Bioresour. Technol., 2009, 100(11), 2883–2885 CrossRef CAS PubMed . Available from: https://linkinghub.elsevier.com/retrieve/pii/S0960852408010985.
- O. Ogunkunle, O. O. Oniya and A. O. Adebayo, Yield Response of Biodiesel Production from Heterogeneous and Homogeneous Catalysis of Milk Bush Seed (Thevetia peruviana) Oil, Energy Policy Res., 2017, 4(1), 21–28 CrossRef . Available from: http://www.tandfonline.com/action/journalInformation?journalCode=uetp21.
- S. Kaewdaeng, P. Sintuya and R. Nirunsin Biodiesel production using calcium oxide from river snail shell ash as catalyst. In: Energy Procedia, 2017.
- I. B. Laskar, K. Rajkumari, R. Gupta, S. Chatterjee, B. Paul and L. Rokhum, Waste snail shell derived heterogeneous catalyst for biodiesel production by the transesterification of soybean oil, RSC Adv., 2018, 8(36), 20131–20142 RSC.
- E. Betiku and S. O. Ajala, Modeling and optimization of Thevetia peruviana (yellow oleander) oil biodiesel synthesis via Musa paradisiacal (plantain) peels as heterogeneous base catalyst: A case of artificial neural network vs. response surface methodology, Ind. Crops Prod., 2014, 314–322 CrossRef CAS.
- J. O. Oyelade, D. O. Idowu, O. O. Oniya and O. Ogunkunle, Optimization of biodiesel production from sandbox (Hura crepitans L.) seed oil using two different catalysts, Energy Sources, Part A, 2017, 39(12), 1242–1249 CrossRef CAS . Available from: http://www.tandfonline.com/action/journalInformation?journalCode=ueso20.
- O. Ogunkunle and N. A. Ahmed, Response surface analysis for optimisation of reaction parameters of biodiesel production from alcoholysis of Parinari polyandra seed oil, Int. J. Sustainable Energy, 2019, 38(7), 630–648 CrossRef . Available from: https://www.tandfonline.com/doi/full/10.1080/14786451.2018.1554661.
- A. Obadiah, G. A. Swaroopa, S. V. Kumar, K. R. Jeganathan and A. Ramasubbu, Biodiesel production from Palm oil using calcined waste animal bone as catalyst, Bioresour. Technol., 2012, 116, 512–516 CrossRef CAS PubMed.
- M. Nazri, Z. Arifin and M. Azmier, Optimization of Process Variables for Malachite Green Dye Removal Using Rubber Seed Coat Based Activated Carbon, Int. J. Eng. Technol. IJET-IJENS, 2011, 11, 305–311 Search PubMed.
- D. C. Montgomery, Design and analysis of experiments, John Wiley and Sons, Inc., Singapore, 6th edn, 2005, p. 101 Search PubMed.
- M. Kumar and M. P. Sharma, Kinetics of Transesterification of Chlorella Protothecoides Microalgal Oil to Biodiesel, Waste Biomass Valorization, 2016, 7(5), 1123–1130 CrossRef CAS.
- A. B. M. S. Hossain and M. A. Mazen, Effects of catalyst types and concentrations on biodiesel production from waste soybean oil biomass as renewable energy and environmental recycling process, Aust. J. Crop. Sci., 2010, 4(7), 550–555 CAS.
- O. Aworanti, Statistical Optimization of Process Variables for Biodiesel Production from Waste Cooking Oil Using Heterogeneous Base Catalyst, Br. Biotechnol J., 2014, 116–132 Search PubMed.
- I. M. Ogbu and V. I. E. Ajiwe, Biodiesel Production via Esterification of Free Fatty Acids from Cucurbita pepo L. Seed Oil: Kinetic Studies, Int. J. Sci. Technol., 2013, 616–621 Search PubMed.
- M. Mathiyazhagan and A. Ganapathi, Factors Affecting Biodiesel Production, Res. Plant Biol., 2011, 1(2), 1–5 Search PubMed.
- M. Kuppusamy and T. Kannan, Optimization and production of biodiesel from cottonseed oil and neem oil, Int. J. Mod. Sci. Technol., 2016, 01, 23–28 Search PubMed.
- A. Demirbas, Use of algae as biofuel sources, Energy Convers. Manage., 2010, 51(12), 2738–2749 CrossRef CAS.
- J. M. Salman, Optimization of preparation conditions for activated carbon from palm oil fronds using response surface methodology on removal of pesticides from aqueous solution, Arab. J. Chem., 2014, 7(1), 101–108 CrossRef CAS.
- M. Charoenchaitrakool and J. Thienmethangkoon, Statistical optimization for biodiesel production from waste frying oil through two-step catalyzed process, Fuel Process. Technol., 2011, 112–118 CrossRef CAS.
- J. Zhang, S. Chen, R. Yang and Y. Yan, Biodiesel production from vegetable oil using heterogenous acid and alkali catalyst, Fuel, 2010, 89(10), 2939–2944 CrossRef CAS.
- Z. M. Wang, J. S. Lee, J. Y. Park, C. Z. Wu and Z. H. Yuan, Optimization of biodiesel production from trap grease via acid catalysis, Korean J. Chem. Eng., 2008, 25(4), 670–674 CrossRef CAS.
- E. O. Ajala, F. Aberuagba, A. M. Olaniyan, M. A. Ajala and M. O. Sunmonu, Optimization of a two stage process for biodiesel production from shea butter using response surface methodology, Egypt. J. Pet., 2017, 943–955 CrossRef.
- V. Kumar and P. Kant, Study of Physical and Chemical Properties of Biodiesel from Sorghum Oil. Res, J. Chem. Sci., 2013, 3(9), 64–68 CAS.
- I. Barabás and I.-A. Todorut, Biodiesel Quality, Standards and Properties, Biodiesel- Quality, Emissions and By-Products, Biodiesel Qual. Emiss Products, 2011, 3–28 Search PubMed.
| This journal is © The Royal Society of Chemistry 2022 |

