Microwave catalytic activities of MFe2O4@CMT (M = Ni, Co) supported catalysts for the degradation of dimethyl phthalate†
Received
1st February 2022
, Accepted 9th June 2022
First published on 15th June 2022
Abstract
Meso–macroporous MFe2O4@CMT (M = Ni, Co) catalysts were synthesized by coating carbon microtubes (CMTs) employing a calcination method. The obtained materials NiFe2O4@CMT (PCNF) and CoFe2O4@CMT (PCCF) were characterized via X-ray powder diffraction (XRD), pore structure analysis, X-ray photoelectron spectroscopy (XPS), and scanning electron microscopy (SEM). The electromagnetic (EM) wave absorption of catalysts was measured and it was found that the maximum reflection loss value of PCCF and PCNF was about −41.50 dB at a thickness of 1.85 mm and −24.70 dB at a thickness of 6.55 mm, respectively. The composite catalysts were prepared for the microwave (MW)-induced Fenton-like catalytic degradation of dimethyl phthalate (DMP). The microwave catalytic activity of PCNF was higher than that of PCCF, which was closely related to its higher concentration of active species, better microwave-absorbing ability and high interaction between NiFe2O4 and CMT. Moreover, the degradation kinetics could be well-fitted by the pseudo-first-order kinetic model. With an increase in the MW power, initial pH, catalyst dosage, and H2O2 concentration, the DMP degradation rate initially increased and then decreased, while it declined continuously with an increase in the initial DMP concentration. The introduction of metal oxides increased the mobility of the surface oxygen, playing a crucial role in the generation of surface oxygen species. The catalysts maintained high stability after five reaction cycles. The overall findings provide new insight into PCCF and PCNF under MW irradiation for the degradation of DMP and other relevant organic pollutants.
1 Introduction
Phthalate acid esters (PAEs) comprise a large family of chemical compounds extensively used as cellulose film coating, adhesives, and plasticizers in industrial production. Dimethyl phthalate (DMP) ester is a common short-chained ester from the class of PAEs, which has been detected in the natural environment including water and sediments.1 DMP is relatively recalcitrant to biodegradation in the natural environment because of its benzene carboxylic group and its hydrolysis half-life of about 3 years.2 Moreover, DMP can be bioconcentrated and biomagnified in the aquatic food chain. It is considered that the potential sources of DMP are mainly through the release of wastewater from production and processing activities and from the usage and disposal of materials containing PAEs. Long-term exposure to DMP can cause functional disturbances in the nervous system and liver of animals. Also, it is suspected to have endocrine-disrupting activity and result in decreased fertility in human beings and other organisms. Because of its ecological toxicity and hazard, it has been listed as a priority organic pollutant by the U.S. Environmental Protection Agency because of its toxicological properties and potential risks to human health, wildlife, and the environment.3,4 Thus, it is necessary to identify appropriate treatment technologies to remove DMP and remediate its adverse effects.5
The methods for the removal of DMP mainly include adsorption, electrocatalysis, photocatalysis, microwave catalysis, and other advanced oxidation processes (AOPs).6,7 Among the many wastewater treatment technologies, adsorption technology stands out because of its flexible operation and design; however, it also has the drawback of adsorbent regeneration and the rerelease of adsorbed organics into the environment.8 Photocatalysis and electrocatalysis technology present high removal efficiency but with high energy consumption.9,10 The Fenton reaction, a type of highly efficient and widely used AOP, degrades persistent organic pollutants in water by activating H2O2 to produce ·OH. However, it has a relatively low reaction efficiency and usually requires long reaction times to reach equilibrium. For faster reaction speeds, external energy such as UV-Vis light,11 electricity12 and microwaves (MW)13 are often introduced. MW-induced catalytic oxidation (MICO) is regarded a promising AOP because of its high energy utilization, quick reaction rate, and high degradation efficiency.14,15 It has been reported that appropriate MW-absorbing catalysts (i.e., carbon materials, metals, and metal oxides) coupled with MW can facilitate the degradation efficiency of organic pollutants.16–18 Liu et al.19 proved that MW has an enhanced effect on the degradation of methylene blue (MB) by rice hull-based ferrite nanocomposites. It seems that efficient catalysts are extremely important to achieve a high MW catalytic performance.
Ferrite has the advantages of strong electromagnetic wave absorption and wide absorption band. The combination of ferrite with a porous carbon matrix can prevent aggregation of the ferrite to improve its electromagnetic wave absorption performance. Accordingly, Shu et al.20 synthesized ZnFe2O4, graphene oxide, and multi-walled carbon nanotubes in a highly connected three-dimensional conductive network structure ternary mixture, which achieved the maximum reflection loss (RL) of −22.2 dB. Wang et al.21 coated NiFe2O4 with polyaniline (PANI), obtaining the maximum RL of −42.5 dB. Zhang et al.22 encapsulated MnFe2O4 into the tubular structure of aragonite, resulting in a turbine effect and the maximum RL of −36 dB. Carbon microtubes (CMT) based on corncob with a tubular structure and low density were used as a catalyst carrier, which could improve the interaction between the catalyst and the contaminant, and further facilitate electron transfer to enhance the photocatalysis performance.23 However, the use of CMT as a carrier of ferrite to form light MW-absorbing materials has been rarely studied.
In this study, we report a strategy for the preparation of porous-structured ferrite supported on CMT (MFe2O4@CMT (M = Ni, Co)) catalysts, which were based on the use of newly made CMT as a hard template. The as-prepared materials were utilized as MW-induced Fenton-like catalysts and their catalytic degradation behavior for DMP was compared. The role of pH, MW power, catalyst dosage, H2O2 dosage, and DMP concentration in the MW catalytic degradation process was studied and the probable mechanism was also proposed.
2 Method and materials
2.1 Materials
Corncob powder was obtained from Yanggu Ruikang Technology Co., Ltd (China). Fe(NO3)3, Co(NO3)2, and DMP were purchased from Shanghai Aladdin Biochemical Technology Co., Ltd. Hydrogen peroxide (H2O2) was purchased from Shanghai Sinopec Chemical Reagent Co., Ltd (China). Yier sea salt was purchased from Haoyangze Aquarium Pet Supplies, Nanshan District, Shenzhen City (China). All solutions used in this study were prepared to have a water conductivity of 18.2 MΩ cm−1. All chemical reagents were of analytical grade and used without further refinement. High-purity nitrogen (purity > 99.999%) was purchased from Ningbo Baifang Gas Co., Ltd (China). Mixed cellulose ester filters with a pore size of 0.45 μm were purchased from Shanghai Xingya Purification Plant (China).
2.2 Preparation of catalyst
Corncob powder was designated as CC, and acidified corncob powder was prepared according to our previous work,23 which was designated as AC. The precursor aqueous (PA) solution was obtained by mixing 100 mL 1.5 M Fe(NO3)3 with 100 mL 0.75 M Co(NO3)2 or Ni(NO3)2, respectively. A total of 50 g acidified corncob powder was mixed with the PA solution, stirring at a constant temperature of 70 °C for 2 h. Then, it was kept at 60 °C for 24 h, and finally dried at 100 °C to yield a dry precursor. The dried precursor powder was further heated to 750 °C for 2 h at a rate of 1 °C min−1 in a tube furnace under a high-purity nitrogen atmosphere. After heating, the products were designated as PCCF (powder of CoFe2O4 coated on corncob) and PCNF (powder of NiFe2O4 coated on corncob), respectively. Using the same method, CoFe2O4 and NiFe2O4 were synthesized without corncob powder, which were designated as CF and NF, respectively. The experimental process is shown in Fig. 1.
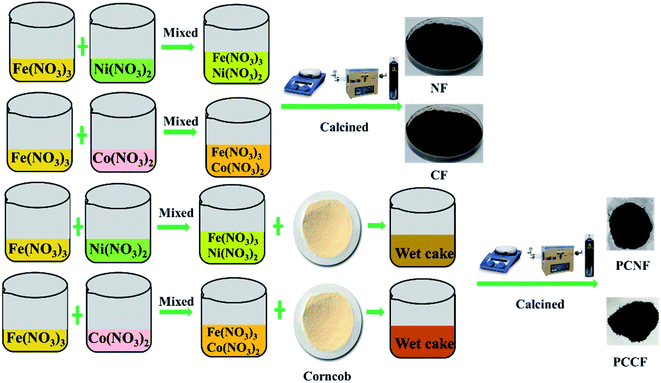 |
| | Fig. 1 Preparation of NF, CF, PCNF, and PCCF. | |
2.3 Degradation process
The adsorption and subsequent degradation of DMP by CC, CF, NF, PCCF and PCNF were measured. Firstly, 50 mL of 500 μg L−1 DMP solution and 0.1 g catalyst were placed in a glass beaker, followed by 10 min of ultrasonic to equilibrate the catalyst. The suspension was initially stirred in the dark at a speed of 250 rpm, and subsequently 120 min. Then, the supernatant (3 mL) was centrifuged at the speed of 10![[thin space (1/6-em)]](https://www.rsc.org/images/entities/char_2009.gif) 000 rpm for 5 min, and then the extent of DMP adsorption by the catalyst was determined. The characteristic absorption peaks of the DMP functional groups were analyzed by scanning the sample with a UV-2550 spectrophotometer (Shimadzu Corporation of Japan) in the wavelength range of 200–900 nm, while the concentration of the DMP solution was calculated using the maximum absorption peak (229 nm and 275 nm) according to the Lambert–Beer formula. To evaluate the catalytic activity, an identical experiment was performed. Hydrogen peroxide (10 mg) was added after the equilibration step, and then the catalyst and DMP solution were exposed to MW at a frequency of 2450 MHz. To prevent overheating bumping, the MW oven was closed for 15 s, and then reheated after an interval of 15 s. Subsequently, a sample of the DMP solution was removed and subjected to the same analysis, as described above. To ensure the consistency of the solid–liquid ratio, only one sample was taken from each experiment. All experiments were conducted in triplicate and the average value was taken. The same procedure was repeated with simulated wastewater instead of ultrapure water. The content of the main elements in the simulated wastewater is shown in Table S1 (ESI†).
000 rpm for 5 min, and then the extent of DMP adsorption by the catalyst was determined. The characteristic absorption peaks of the DMP functional groups were analyzed by scanning the sample with a UV-2550 spectrophotometer (Shimadzu Corporation of Japan) in the wavelength range of 200–900 nm, while the concentration of the DMP solution was calculated using the maximum absorption peak (229 nm and 275 nm) according to the Lambert–Beer formula. To evaluate the catalytic activity, an identical experiment was performed. Hydrogen peroxide (10 mg) was added after the equilibration step, and then the catalyst and DMP solution were exposed to MW at a frequency of 2450 MHz. To prevent overheating bumping, the MW oven was closed for 15 s, and then reheated after an interval of 15 s. Subsequently, a sample of the DMP solution was removed and subjected to the same analysis, as described above. To ensure the consistency of the solid–liquid ratio, only one sample was taken from each experiment. All experiments were conducted in triplicate and the average value was taken. The same procedure was repeated with simulated wastewater instead of ultrapure water. The content of the main elements in the simulated wastewater is shown in Table S1 (ESI†).
2.4 Characterization
The composition of the catalyst was determined by X-ray diffraction (XRD) using a D/Max 2550 X-ray diffractometer (Rigaku, Japan). The microstructure of the catalyst was measured via scanning electron microscopy (SEM) (Zeiss Merlin FESEM, Germany). The specific surface area of the catalyst was tested using the Brunauer–Emmett–Teller (BET) method (AUTOSORB-IQ-MP, US). All data were analyzed using a Quantachrome ASiQWin (version 3.01). High-resolution X-ray photoelectron spectroscopy (XPS) was performed using a pass energy of 20 eV, with a step size of 0.02 eV. The UHV chamber base pressure was maintained at <10−9 Mbar throughout the measurements. To compensate for any type of charging effect, the C 1s binding energy peak at 284.5 eV was used as a reference. The electromagnetic (EM) parameters were determined using an HP8720ES vector network analyzer (Agilent, USA) using a T/R coaxial line method in the EM wave frequency range of 1–18 GHz with a thickness of 2 mm, using paraffin as the substrate. The filling rate was 50%. The relative complex permittivity (ε = ε′ − jε′′) and permeability (μ = μ′ − jμ′′) were calculated from the measured T/R coefficients. The measurement errors were less than 10% when ε′ < 15. The concentration of leached metal ions of the materials after the degradation was measured by ICP-AES (Optima 2000, PerkinElmer Co., Ltd, USA), and the metal leaching ratio was calculated using eqn (1):| |  | (1) |
3 Results and discussion
3.1 Catalyst characterization
3.1.1 Composite determination.
The XRD patterns of the as-fabricated samples are exhibited in Fig. 2a. It can be observed that the characteristic reflection peaks of AC, PCNF, and PCCF appeared at the 2θ values of 20.64° (d100), 26.43° (d011), 36.15° (d110), 43.099° (d211), and 62.04° (d204), corresponding to SiO2 (JCPDF # 74-1811), similar to the finding reported for corncob in which SiO2 was preserved during calcination.23,24 However, the main peaks shift to higher 2θ values when loaded with NiFe2O4 or CoFe2O4, indicating a decrease in the crystal interplanar distances of SiO2. Besides, the decrease in the diffraction peak intensities is probably owing to the dilution of the crystal structure of SiO2 by doping with NiFe2O4 or CoFe2O4. In the PCCF sample, the XRD 2θ peaks at 18.28° (d111), 30.08° (d220), 35.43° (d311), 37.05° (d222), and 45.05° (d400) can be ascribed to the CoFe2O4 phase (JCPDF # 22-1086). In the PCNF sample, the diffraction signals at the 2θ values of 18.33° (d111), 30.15° (d220), 35.15° (d311), 37.15° (d222), and 44.16° (d400) are ascribed to the NiFe2O4 phase (JCPDF # 87-2336). The average crystallite size of NiFe2O4 is smaller than that of CoFe2O4 according to the Scherrer equation, which is more conductive to the formation of structural defects, resulting in an improvement in the oxidative reaction.
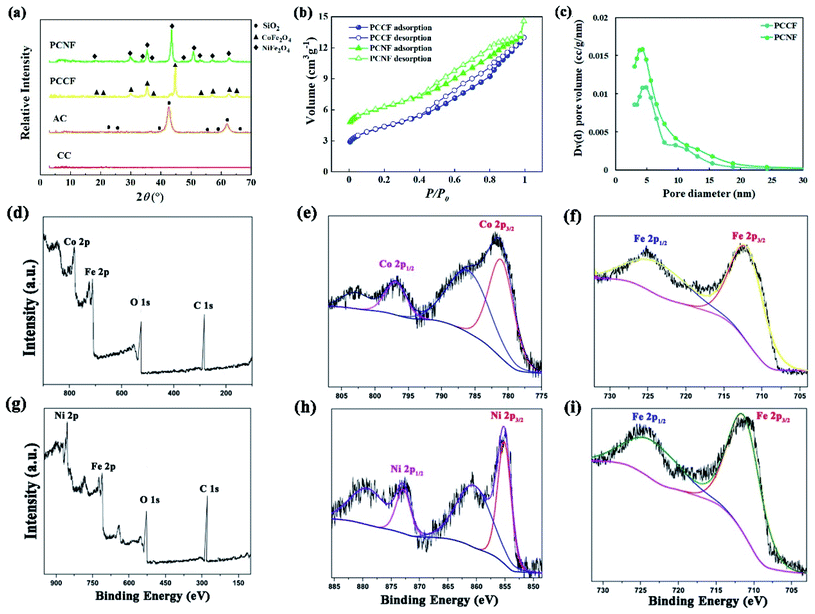 |
| | Fig. 2 Determination of the composite and pore structure of MFe2O4@CMT (M = Ni, Co): (a) XRD patterns, (b) nitrogen adsorption–desorption isotherms, and (c) pore size distribution calculated by BJH method. XPS spectra of PCCF (d) wide scan, (e) Co 2p, and (f) Fe 2p. XPS spectra of PCNF (g) wide scan, (h) Ni 2p, and (i) Fe 2p. | |
3.1.2 Pore structure analysis.
The pore structure of PCCF and PCNF was analyzed via nitrogen adsorption–desorption curves (Fig. 2b). All the curves show a type IV pattern with an H3 hysteresis loop, indicating that PCCF and PCNF are mesoporous materials.25 The BET specific surface area, pore volume, and the pore diameter of PCCF and PCNF are summarized in Table S2.† The BET specific surface area of PCCF and PCNF is 8.995 and 11.22 m2 g−1, respectively. After the introduction of NiFe2O4, the BET specific surface area increased, which is attributed to the fact that NiFe2O4 was successfully supported on CMT and increased the amount of pores. Fig. 2c shows the pore distribution of PCCF and PCNF calculated using the BJH method. It can be found that the introduction of NiFe2O4 has no significant influence on the pore structure of the samples. The total pore volume of PCCF and PCNF is 0.289 and 0.323 cm3 g−1, respectively. Obviously, compared with PCCF, PCNF possesses a larger pore volume, which may be ascribed to the fact that NiFe2O4 entered the pore of CMT and enlarged the pore volume of its pore size to 9 nm during the preparation process, thus enhancing the total pore volume of PCNF.26
3.1.3 The elemental valences of the materials.
To investigate the components, material composition and elemental valences in the synthesized sheets and plates, XPS analysis of PCCF and PCNF was carried out (Fig. 2d–i). Fig. 2d shows the wide scan survey spectrum of PCCF, which shows the presence of Co 2p, Fe 2p, O 1s, and C 1s. The deconvoluted Co 2p spectrum (Fig. 2e) indicates the existence of a doublet at 781.03 eV and 796.8 eV. The two shake-up satellite peaks at 785.9 eV and 802.8 eV indicate the strong presence of Co2+.27Fig. 2f shows the characteristic signals of Fe 2p at 711.9 eV and 723.5 eV, which are due to Fe 2p3/2 and Fe 2p1/2, respectively. This result indicates the presence of Fe3+ and Co2+ in PCCF. The wide scan XPS survey spectrum of PCNF (Fig. 2g) indicates the presence of Ni 2p, Fe 2p, O 1s, and C 1s. After deconvolution of the Ni 2p spectrum (Fig. 2h), it showed four peaks. There are two main peaks at binding energies of 855.1 eV and 872.8 eV, which are followed by two shake-up satellites at the higher binding energy side centered at 860.4 eV and 879.1 eV. These results are in agreement with the literature.27Fig. 2i shows the signals of Fe 2p at 711.2 eV and 723.3 eV for Fe 2p3/2 and Fe 2p1/2, respectively. Thus, the XPS analysis confirmed the presence of the CoFe2O4 and NiFe2O4 phases in our materials.
3.1.4 Microscopic morphology analysis.
The morphology of PCCF and PCNF was characterized via SEM (Fig. 3). For the corncob sample, it has a tubular structure with a diameter of 10 μm, and the surface of its tubes became rough after acidification due to the release of some soluble substances. CoFe2O4 and NiFe2O4 were both loaded on the surface of the corncob powder and agglomerated. The size of CoFe2O4 in PCCF was mainly 1 μm, while that of NiFe2O4 in PCNF was 5 μm or even larger. This is because the diameter of the tubular structure of the corncob powder is about 10 μm, which reduced the confinement effect and resulted in more crystal agglomeration. According to the elemental energy spectrum, PCCF mainly contained C, Fe, Co, and O elements, while PCNF mainly contained C, Fe, Ni, and O elements. Combined with the microstructure and XRD results, CoFe2O4 and NiFe2O4 were successfully loaded on the surface of the corncob, but crystal agglomeration occurred in PCCF and PCNF.
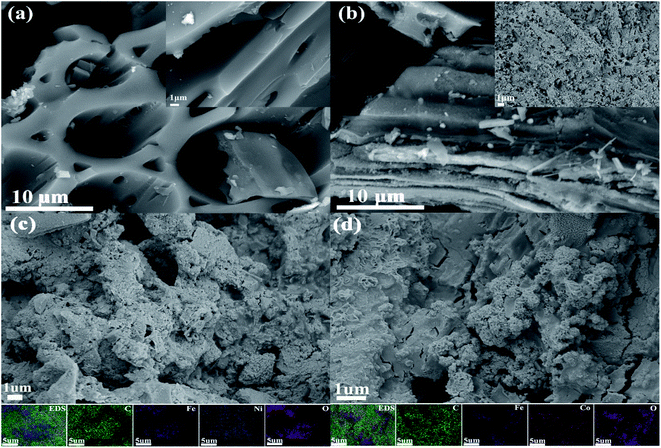 |
| | Fig. 3 SEM images and element mapping data (EDS) of (a) CC, (b) AC, (c) PCCF, and (d) PCNF. | |
3.2 MW absorption of ferrite/corncob composite
According to the transmission line theory, the RL of EM wave absorbers can be evaluated from the measured complex permittivity and permeability using the following equations:28| |  | (2) |
| |  | (3) |
where Zin and Z0 are the impedances of the absorber and air, respectively. ε and μ are the complex permittivity and permeability of the absorber, respectively. f is the frequency of EM waves, d is the thickness of the absorber, and c is the velocity of light. The permittivity and permeability of CC, PCCF, and PCNF are shown in Fig. S1,† indicating that the EM wave absorption of PCCF and PCNF was mainly induced by magnetic loss. The RL of the ferrite/corncob composites as a function of thickness was analyzed to obtain the optimum thickness and frequency for EM absorption (Fig. 4). The maximum RL value of CC, PCCF, and PCNF was about −2.00 dB at the thickness of 1.75 mm, −41.50 dB at the thickness of 1.85 mm, and −24.70 dB at the thickness of 6.55 mm, respectively. This indicates the weak EM absorption by CC, whereas PCCF and PCNF displayed strong EM absorption.
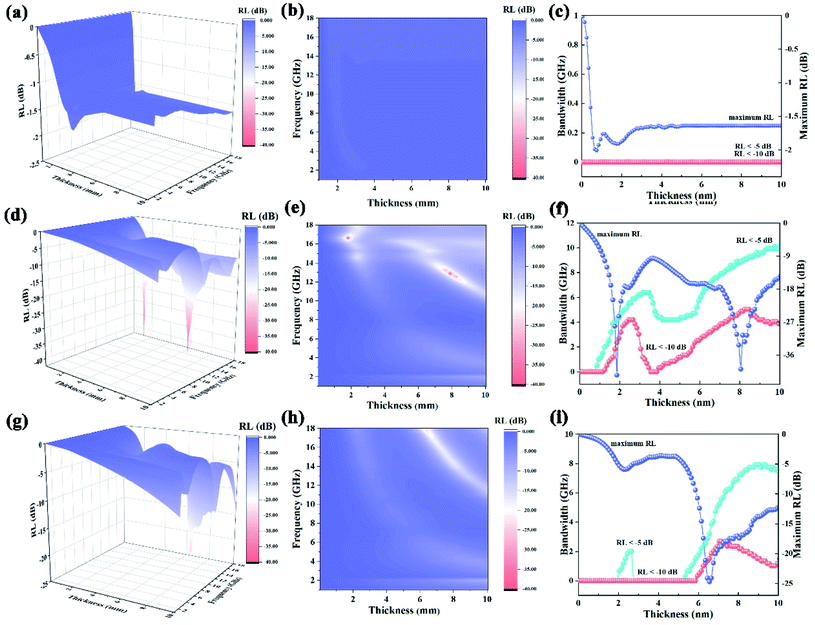 |
| | Fig. 4 RL of MFe2O4@CMT (M = Ni, Co) composite as a function of thickness and frequency: (a–c) CC, (d–f) PCCF, and (g–i) PCNF, respectively. | |
In addition, the RL of the MFe2O4@CMT (M = Ni, Co) composites as function of thickness and frequency was measured to obtain the optimum thickness and frequency for EM absorption. There are two maximum bandwidth values of PCCF in the bandwidth–thickness curve. The first maximum bandwidth for an RL of <−10 dB appears at a thickness in the range of 1.25–3.45 mm, with a value of 4.03 GHz; another appears at the thickness of 3.95–10.00 mm with the maximum bandwidth of 5.04 GHz for RL of <−10 dB and 10.00 GHz for RL of <−5 dB. It was also found that the maximum width of PCNF for RL of <−5 dB with a value of 2.01 GHz is at the thickness of 2.05–2.65 mm, and RL of <−10 dB with a value of 2.69 GHz at the thickness of 5.95–10 mm, while 0 GHz for CC for RL < −5 dB at a thickness in the range of 0–10 mm. These results verified that PCCF and PCNF showed higher permittivity and permeability to absorb EM waves than that of CC. Specifically, introducing metal ions in CMT could substantially improve its microwave absorption capacity. PCNF displayed the strongest reflection loss, suggesting its best microwave absorption property. The smaller particles of NiFe2O4 will accelerate the space-charge polarization among the metal ions, resulting in an improvement in the dielectric loss value.
Among the EM wave-absorbing materials (Table S3†), due to the absence of magnetic components, CC showed a lower absorption of EM waves than traditional EM wave absorbers, such as porous carbon fiber,29 porous Fe,30 and rice husk ash (SiC).31 However, the maximum RL of PCCF and PCNF was considerably higher than that of Fe pillared in halloysite22 and montmorillonite blended with polymers.32 In conclusion, MFe2O4@CMT (M = Ni, Co) is a potential EM wave absorber.
3.3 MW-assisted Fenton-like catalysis by ferrite/corncob composite
The pretreatment of PAEs for their determination by GC-MS is complex. It was found that there are two conjugated π bonds (phenyl ester and benzene ring) in the DMP structure (Fig. S2†), which have strong absorption peaks at 229 nm and 275 nm in its UV-Vis spectrum, respectively. The standard curve fitted these two peaks well (Fig. S3a†), and thus the DMP concentration before and after degradation could be analyzed based on the intensity of these two absorption peaks in its UV-Vis spectrum (Fig. 5). The difference in the decomposition rates at the two wavelengths indicated that the structure of DMP was destroyed. For the fresh water system, the ultraviolet absorption intensity of the two groups decreased gradually with an extension in the irradiation time. For PCCF, after 6 min of MW, the DMP spectrum near 275 nm was almost a straight line, and the absorption peak near 229 nm was red-shifted, but the absorption peak before 210 nm became stronger, which was mainly due to the small molecules or ions produced during the degradation of DMP. For PCNF, the absorption peak of small molecules was stronger, indicating that PCNF had more efficient catalytic activity, where the phenyl ester group degraded to a benzene ring, and then mineralized into small molecules or ions. In the simulated seawater, due to the presence of multiple ions, there were more peaks before 210 nm. Meanwhile, the degradation efficiency of phenyl ester and benzene groups weakened with the number of free radicals reduced. However, the red shift in the absorption peak at 229 nm still existed, indicating that degradation still occurred.
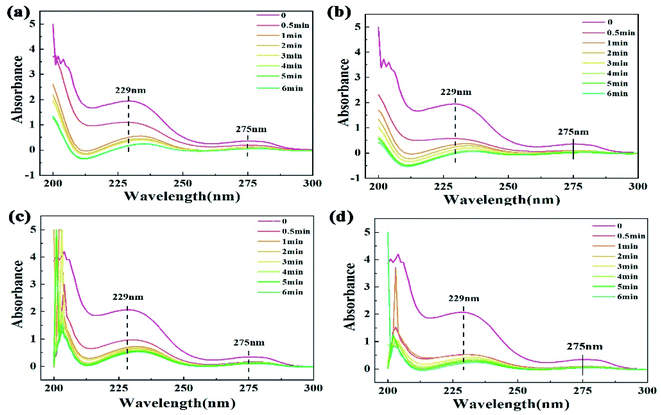 |
| | Fig. 5 UV-Vis spectrum of DMP after MW-enhanced Fenton-like degradation by: (a) PCCF and (b) PCNF in fresh water, (c) PCCF and (d) PCNF in simulated real wastewater. | |
To study the MW catalytic activity of PCCF and PCNF, experiments on the degradation of DMP by different catalysts were carried out. DMP cannot be degraded without MW irradiation, and only less than 15% of DMP could be removed within 6 min (Fig. 6a and b), indicating that adsorption cannot efficiently remove DMP in a short time. Besides, the CC template showed negligible DMP degradation (5%) under MW irradiation. The DMP degradation efficiency rapidly increased to 95% and 99% after 6 min in the PCCF/MW/H2O2 and PCNF/MW/H2O2 systems, respectively, illustrating that the formation of a meso–macroporous structure (MFe2O4@CMT (M = Ni, Co)) will promote the diffusion of reactant molecules in the active sites, and thus improve the catalytic performance (Fig. 6c and d), respectively. Our previous work showed that carbon microtubes have a much larger interlayer spacing than that of commercial graphite, which may be beneficial for ion transmission.23 The apparent width of the diffusion layer for the DMP solution can be calculated as follows:33
| |  | (4) |
where
ρ,
μ and
v are the density in kg m
−3, viscosity of the solution in kg m
−1 s
−1, and linear rate of the solution inside the electrochemical cell in m s
−1, respectively.
L is the hydraulic diameter in m, which is defined as the free area for flow over the wet perimeter.
D is the diffusion coefficient. When a carbon microtube electrode was used, the hydraulic diameter and the width of the diffusion layer of the MFe
2O
4@CMT (M = Ni, Co) decreased and the attack of DMP molecules by hydroxyl radicals became easier, leading to an increase in the oxidation rate, considering only the mass transfer improvement. Thus, the reaction rate of PCNF and PCCF was faster than that of NF and CF, confirming that the formation of a mesoporous–macropore structure will promote the diffusion of reactant molecules to the active sites.
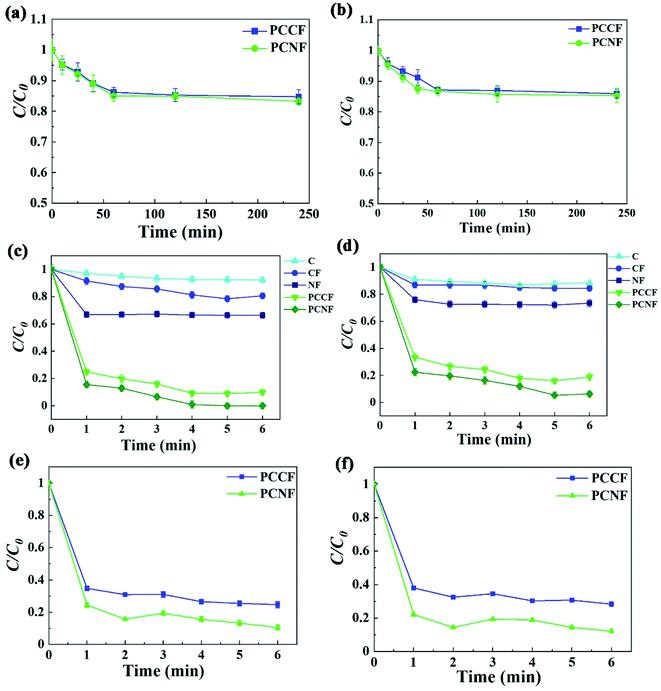 |
| | Fig. 6 Adsorption curves of DMP by PCCF and PCNF at: (a) 229 nm and (b) 275 nm. MW-enhanced Fenton-like process for DMP by CC, CF, NF, PCCF and PCNF at: (c) 229 nm and (d) 275 nm. MW-enhanced Fenton-like process for DMP by PCCF and PCNF in simulated real wastewater at: (e) 229 nm and (f) 275 nm. | |
In the case of CF, there was a decrease of 5% of phenyl ester and 6% of benzene ring concentration after 1 min, which changed to 18% of phenyl ester and 14% of benzene ring within 6 min MW assistance. In the case of NF, the concentration of phenyl ester and benzene ring decreased by 38% and 22% within 1 min MW assistance, respectively. However, subsequently, the concentration of phenyl ester and benzene ring did not decrease significantly and remained stable within 6 min. Thus, it can be concluded that the degradation of DMP was promoted by the MW-induced reaction with MFe2O4 (M = Ni, Co). The reaction in the Fenton system is based on eqn (5), as follows:
| | | Fe2+ + H2O2 → Fe3+ + OH− + ·OH | (5) |
The valence of Fe3+ changed between 2 and 3 in the CoFe2O4 or NiFe2O4 degradation process.34 There is one more free orbit and outer electron in Ni than that in Co, promoting the valence conversion of Fe3+. Thus, the DMP degradation efficiency of NF was higher than that of CF. Secondly, the molecular thermal motion and system temperature increased with MW radiation.35 The temperature of 1000 °C36 could be reached within 3 min MW irradiation with ferrite, forming hotspots and accelerating the molecular motion to degrade DMP.
When coated with CoFe2O4 or NiFe2O4, the catalyst displayed an even higher degradation efficiency of 90% and 99% of phenyl ester by PCCF and PCNF, respectively. Therefore, this type of corncob loaded with CoFe2O4 or NiFe2O4 has wide application for the degradation of refractory pollutants.
When applied to simulated seawater, the PCCF and PCNF still maintained a high degradation rate (Fig. 6e and f), respectively. Degradation rate by PCCF was 65% after 1 min, and that of PCNF was 78% for phenyl ester. The maximum degradation rate by PCCF and PCNF was 70% and 90% after 6 min, respectively.
The results of the kinetic studies on the degradation of DMP are shown in Fig. S3b and Table S4.† All the kinetic equations obtained from the different catalysts follow the pseudo-first-order model. The calculated rate constant (kobs) values are 0.3975, 0.8902, 0.1561, and 0.3043 for PCCF, PCNF, PCCF and PCNF in salinity, respectively. A higher rate constant leads to a faster reaction rate, illustrating that the DMP degradation rate in the NiFe2O4@CMT/MW-induced system is the fastest, which verifies that NiFe2O4@CMT possessed the highest catalytic activity. The rate constant was slightly reduced in the salinity system compared with that in the fresh water system. This is because the degradation reaction is a free radical reaction and the ions in the salinity system would react with the free radicals. Thus, the concentration of free radicals reacting with DMP molecules was reduced, thus reducing the degradation efficiency.37 Simultaneously, it can be seen that PCNF was less affected by ions than PCCF because Ni contained one more vacant orbital than Co and could bind with the ions, reducing the probability of the ions bonding with free radicals.38 Wang et al.26 predicted that the hollow structure of carbon microtubes with a micron size and large aspect ratio reduces the radial stress, presents good electrical conductivity, and a large number of mass transfer pathways. Our previous work tested the electrochemical impedance spectroscopy (EIS) of the prepared photocatalyst, confirming that the confinement effect of CMT could improve the separation and transfer of electron–hole pairs to improve the degradation efficiency.23 This material also showed a higher degradation performance than that in the related literature (Table S5†).
3.4 MW-assisted Fenton-like degradation of DMP with different factors
3.4.1 H2O2 concentration.
The concentration of H2O2 in the solution directly affects the yield of ·OH. With an increase in H2O2 concentration, the mass transfer rate and the degradation rate of DMP increased (Fig. 7a and b), respectively. This may be due to the fact that more hydroxyl radicals were produced with an increase in H2O2 concentration, resulting in a higher DMP degradation efficiency. However, a further increase in the addition of H2O2 (more than 300 mg L−1 for PCCF and 200 mg L−1 for PCNF) decreased the degradation rate mainly because of the consumption of the produced ·OH by excess H2O2, as follows:| | | H2O2 + ·OH → HO2˙ + H2O | (6) |
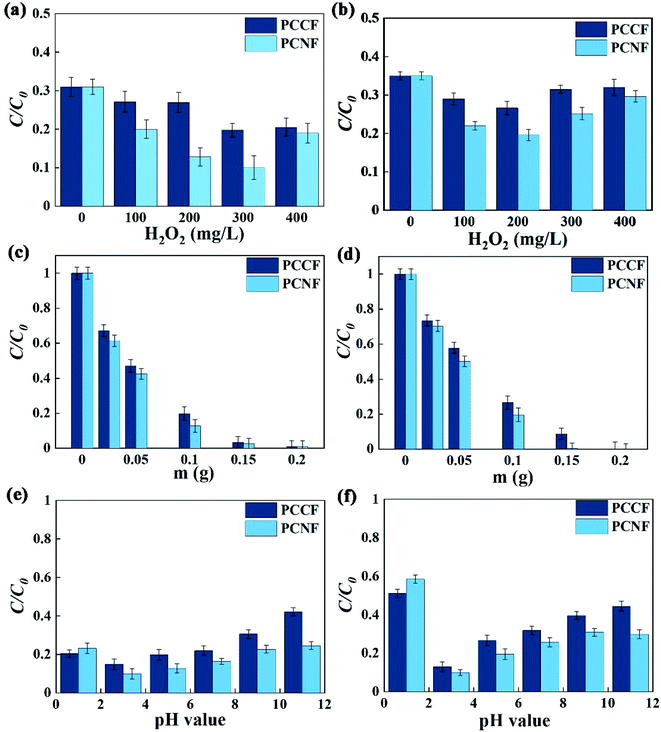 |
| | Fig. 7 Effect of different factors on the MW-enhanced Fenton-like performance, H2O2 concentration at: (a) 229 nm and (b) 275 nm; catalyst dosage at: (c) 229 nm and (d) 275 nm; and pH value at: (e) 229 nm and (f) 275 nm. | |
A certain DMP degradation rate without H2O2 was observed, indicating that the degradation of DMP not only involved ·OH oxidation, but may also be direct oxidation, which required the catalytic degradation mechanism of DMP by PCCF and PCNF to be investigated.
3.4.2 Catalyst dosage.
The catalyst dosage affects the amount of active sites and the content of Fe3+, thus affecting the degradation rate. The larger the catalyst dosage, the more active species generated and more DMP degraded under the same condition (Fig. 7c and d). When the maximum catalyst dosage was 0.20 g, the degradation rate of both PCNF and PCCF reached more than 99%. Nevertheless, excessive catalyst will cover the activated sites and interfere with MW transmission or absorption, resulting in a decrease in the DMP degradation rate.39 The optimal dosage of PCCF in this study was 0.15 g, which was the same for PCNF. Due to the differences in the atomic structure of NiFe2O4 and CoFe2O4 mentioned above, NiFe2O4 promoted the degradation reaction, and thus the degradation rate of PCNF was higher than that of PCCF with the same amount of catalyst.
3.4.3 pH value.
The initial pH value plays a significant role in the removal of DMP, which may be due to its influence on the surface properties of the catalyst and the formation of some active sites. The degradation rate increased with an increase in the initial pH when the pH was <3.0 and decreased at a higher pH (Fig. 7e and f). At pH = 3.0, the degradation rate became the highest, indicating that acidic condition is conductive for the generation of acidic phenolic hydroxyl groups, which will react with hydroxyl radicals to promote the decomposition reaction.40 Besides, when the solution pH is high, the oxidizing ability of the valence-hole on the catalysts surface will decline, leading to a reduction in the amount of ·OH.41 Under alkaline conditions, iron ions precipitated, which also inhibited the catalytic process. At pH = 1, the degradation rate of the benzene ring of DMP was more affected by pH than that of the phenyl group. This is because the benzene ring formed a π bond under acidic conditions, which is more stable than the phenyl ester group42 and more difficult to degrade. At the end of the degradation, the pH value of the DMP solution was higher than that of the initial DMP solution (Fig. S3c†), which means that the degradation process consumes ·OH, resulting in an increase in the pH value of the solution.
3.4.4 Salinity.
Real wastewater contains many ions, which can also influence the degradation rate. In simulated real wastewater, the effect of sample dosage and pH on the degradation of DMP with MW-induced was consistent with that in fresh water (Fig. 8). An increase in the catalyst dosage improved the degradation rate. Excessive acid and alkali would reduce the DMP degradation rate. When the pH was 1, the degradation rate of DMP was greatly reduced due to the presence of ions and excess H+, which inhibited the production of ·OH. Under the alkali condition, not only iron ions would produce precipitation, but also Mg2+, Ca2+, and other metal ions in simulated real wastewater would also produce precipitation and reduce the mass transfer rate of free radicals in the chain reaction, thus reducing the degradation rate.
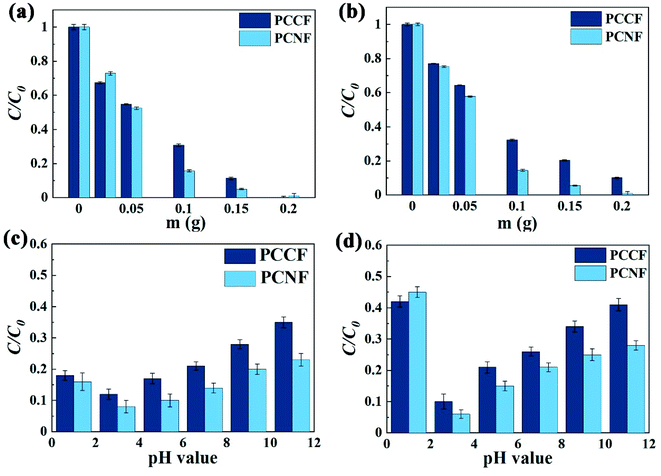 |
| | Fig. 8 Effect of different factors on the MW-enhanced Fenton-like performance: catalyst dosage at (a) 229 nm and (b) 275 nm and pH value at: (c) 229 nm and (d) 275 nm. | |
3.4.5 MW intensity.
To evaluate the effect of MW intensity on the degradation of DMP, three levels of MW intensity ranging from 0 to 580 W were studied. Fig. 9a and b show that the degradation efficiency of PCCF and PCNF increased as the MW intensity increased to 580 W, which showed a slight decrease in salinity. The maximum DMP degradation was achieved by PCNF with 580 W. This is expected given that a greater MW energy input can result in the formation of more hotspots and/or active species (such as ·OH radicals), which accelerate the decomposition reaction rate.43 However, the lower DMP removal efficiency at 0 W can be attributed to the fact that a small amount of hydroxyl radicals was produced without MW assistance. The lower DMP removal efficiency in salinity can be attributed to the fact that the production of a larger amount of hydroxyl radicals results in the recombination reaction becoming dominant, which hampers the degradation process.
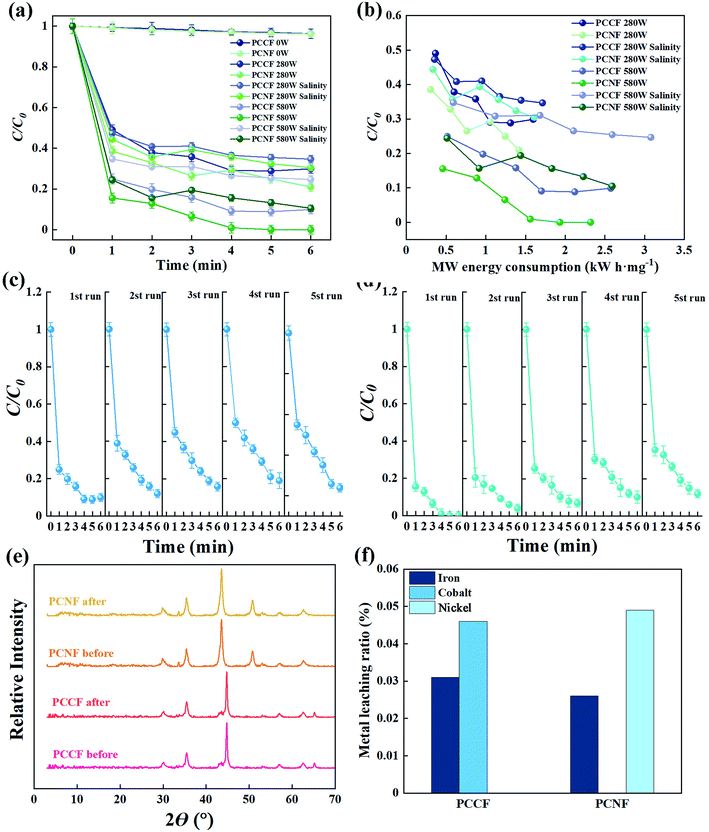 |
| | Fig. 9 Effect of (a) MW power and (b) MW energy consumption on the DMP degradation efficiency in the MW-induced process; cycling runs for the degradation of DMP in the presence of (c) PCCF and (d) PCNF; (e) XRD patterns of PCCF and PCNF before and after the reaction; and (f) the concentration of dissolved metal ions from PCCF and PCNF over five reaction cycles. | |
The MW energy consumption (UE, kW h mg−1) for DMP degradation was calculated using eqn (8) to estimate the energy utilization under different MW intensities.
where MI is the MW intensity (kW);
t is the MW irradiation time (h); and
W represents the DMP degradation amount during the catalytic reaction (mg). When the MW intensity was 580 W, it resulted in the lowest MW energy consumption and the lowest DMP degradation efficiency for all the catalysts, in which the corresponding
UE was 2.57 and 2.32 kW h mg
−1 for PCCF and PCNF, respectively. This result indicates that insufficient MW energy cannot achieve a satisfactory DMP degradation rate, while excessive MW energy will be wasted to further promote the degradation efficiency.
3.4.6 Stability.
The stability of PCCF and PCNF was evaluated by repeating the experiments on the degradation of DMP with MW assistance. The two catalysts were found to exhibit stable activity, achieving a DMP degradation efficiency of 81% for PCCF and 88% for PCNF after five repeated experimented (Fig. 9c and d), respectively. PCCF and PCNF did not undergo corrosion during the degradation of DMP. There was virtually no change in the characteristic peaks between the XRD spectra of PCCF and PCNF obtained before and after the reaction (Fig. 9e), although the relative peak intensities were reduced after the reaction as a result of X-ray shielding caused by the absorption of carbonaceous material. However, the changes were all less than the 5% error bar of XRD. Besides, there was no additional peak in the XRD spectrum after the reaction. In addition, the ICP-AES analysis of the recovered catalysts after five cycles showed the negligible loss of metal elements from the catalyst (Fig. 9f). Thus, the slight changes detected for the catalysts following the degradation of DMP indicate that both catalysts exhibited good stability.
3.5 Mechanism
To analyze the mechanism, XPS was performed on the catalysts after the reaction. In the case of the used PCCF (Table S7†), the percentage of lattice oxygen (Fe–O), surface hydroxyl groups (–OH) and oxygen in chemisorbed water molecules changed from 40.31%, 43.87%, and 15.82% to 45.69%, 51.02, and 3.29%, respectively. In the case of the used PCNF, the percentage of lattice oxygen (Fe–O), surface hydroxyl groups (–OH), and oxygen in chemisorbed water molecules changed from 38.32%, 47.36%, and 14.32% to 43.31%, 54.84, and 1.85%, respectively. The increase in the number of surface hydroxyl groups further demonstrated the surface hydroxylation of PCCF in the MICO reaction. Surface hydroxyl groups have been reported to play a key role in the decomposition of H2O2 and generation of reactive radicals, and a high percentage of surface hydroxyl groups in the catalyst may be beneficial for enhancing the oxidative degradation process. Besides, the increase in the percentage of Fe–O indicates that the Fe in the catalyst was oxidized during the MICO process with H2O2.
The active species for microwave degradation were studied via a free radical capture experiment. A series of free radical inhibitors was added to the reaction system. It can be seen from Fig. S3d† that after the addition of these three inhibitors, the removal rate of IPA of all the catalysts proved different degrees of reduction. Taking PCNF as an example, the highest degradation rate reduction occurred after the addition of IPA to capture ·OH, which reached 25.61%, indicating that ·OH was the most important free radical in the degradation process. Simultaneously, the addition of AgNO3 and KI inhibited the transport of electrons, and thus the degradation rate was also reduced by 23.17% and 18.29%, respectively, indicating that electron transfer occurs in the reaction system. According to some reports, metal oxides can be excited to produce ecb−–hvb+ pairs under MW irradiation, and then the absorbed H2O and OH− can react with hvb+ and generate ·OH,44 and O2−˙ can also indirectly produce ·OH.45 Besides, the ·OH generated from the decomposition of H2O2 under the MW hotspots and the reaction of H2O2 with e− had moderate contribution to the removal.46 DMP degradation also occurred without the addition of H2O2 (Fig. 7a and b), indicating that the oxidation degradation was not only ·OH oxidation, but also direct oxidation. Direct oxidation mainly relies on O2 dissolved in solution and O2 in the air to generate free radicals, which can be attributed to the MW hotspots. The catalyst as an MW sensitizer, with stronger absorbing ability than water molecules, and it is easier to achieve MW resonance with the surface and lattice defects in the catalyst. Thus, the MW could be quickly transformed into potential energy, and then the internal part of the catalyst could reach a high temperature electric arc quickly and high temperature could be induced on the catalyst pore surface. Finally, the micro domain explosion induced the decomposition of the adsorbed DMP. This comparison suggests that ·OH and hvb+ may play the dominant role, while ecb− and ·O2− play a minor role in the DMP degradation process.
The preferential reaction mechanism would be the attack of ·OH radicals on the aromatic ring when DMP was used as the model organic pollutant herein. A total of eight products was identified by comparison of the mass spectrometry results after derivatization with BSTFA and their molecular structures are presented in Table S6.† The degradation pathway of DMP is shown in Fig. S4.†
Based on the above-mentioned conclusions, the following degradation mechanism can be concluded:47
| |  | (9) |
| | | MFe2O4@CMT (hotspots) + DMP → CO2 + H2O | (10) |
| |  | (11) |
| | | 3Fe3+ + 2O2− → 3Fe2+ + ·O−2 | (12) |
| | | O2 + Fe2+ → Fe3+ + ·O−2 | (13) |
| | | Fe2+ + H2O2 → Fe3+ + OH− + ·OH | (15) |
| | | hvb+ + H2O → ·OH + H+ | (16) |
| | | DMP + ·OH/·O2 + hvb+ → intermediates → CO2 + H2O | (18) |
3.6 Health risk evaluation
According to the PAE concentration in the surface water of rivers and lakes in some places in China and overseas (Table S8†), the maximum DMP, DBP, and DEHP concentrations are 173.42 μg L−1, 800.95 μg L−1, and 1299.54 μg L−1, respectively. Thus, 500 μg L−1 was selected as the initial DMP concentration. DMP is a non-carcinogenic compounds, and thus the non-carcinogenic risk assessment was adopted according to the USEPA health risk assessment model. The non-carcinogenic risk is the ratio of long-term daily intake (CDI) to the reference dose (RfD), and its value is expressed by the risk index (HI), which is calculated according to eqn (S1)–(S4).† The HI value of DMP after degradation by PCCF (degradation rate of 80%) and PCNF (degradation rate of 95%) was smaller than that of initial DMP and less than 1, and thus the degradation process could reduce the health risk and the exposure dose does not cause non-carcinogenic risk to the human body exposed through drinking or the skin (Fig. 10). The HI value through drinking was much higher than that through skin, which means that drinking water containing DMP can increase the non-carcinogenic risk for human. It was also found that the HI value for children was the highest, while that of females was the lowest. This may be due to the poor physical resistance of children, making them difficult to resist the risk of various pollutants, and thus the HI value for children was much higher than that for adults under the same dose exposure conditions. The HI drop out value for PCNF was larger than that for PCCF, indicating that process of DMP degradation by PCNF in Fenton-like systems with MW-induced reaction could reduce the non-carcinogenic risk.
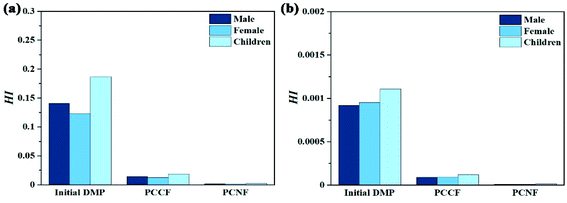 |
| | Fig. 10 Non-carcinogenic risk indexes (HI) of DMP before and after degradation by PCCF and PCNF upon exposure through: (a) drinking and (b) skin. | |
4 Conclusions
Meso–macroporous MFe2O4@CMT (M = Ni, Co) was fabricated by coating carbon microtubes. This study explored the catalytic performance of MFe2O4@CMT (M = Ni, Co) in Fenton-like systems with MW-induced reaction. The DMP degradation efficiency and the corresponding rate constant both increased firstly, and then decreased with an increase in the initial solution pH, MW power, catalyst dosage, and H2O2 concentration. The degradation of DMP by MFe2O4@CMT (M = Ni, Co) follows hydroxyl radical reaction and direct oxidation reaction. The mechanism suggested that the catalyst facilitated the generation of more ·OH under MW irradiation in combination with H2O2, therefore accelerating the degradation of DMP. It can be concluded that the enhanced catalytic activity of MFe2O4@CMT (M = Ni, Co) is closely related to its high active species concentration and good microwave-absorbing ability. Moreover, owing to its good reusability and stability, MFe2O4@CMT (M = Ni, Co) can be used as a promising candidate MW catalyst for the highly efficient degradation of organic wastewater.
Ethical approval
Not applicable because no animals were used in this study.
Consent to publish
All the authors have agreed to publish this work in this journal.
Data availability
The datasets used and/or analyzed during the current study are available from the corresponding author on reasonable request.
Author contributions
Wenli Qin: methodology, software, and writing-original draft preparation; Xinyi Zhang: methodology, software, and writing-original draft preparation; Zefei Chen: data curation and methodology; Xueya Liu: data curation and software; Manqing Ai: data curation and software; Pingping Zhang: writing-reviewing and editing; Ying Ye: conceptualization and supervision; Zengling Ma: supervision and reviewing.
Funding
This work was supported by funding from the National Key R&D Program of China (2018YFE0103700) and the National Oil and Gas Project of China (529000-RE1201).
Conflicts of interest
The authors declare that they have no competing interests.
References
- Y. J. Zhao, C. Yan, D. H. Gu, J. He and H. Q. Hou, Photolysis of Dimethyl Phthalate via MW Discharge Electrodeless Iodine Lamp: Parameters, Feasibility and Mechanism, Asian J. Chem., 2013, 25, 7891–7898 CrossRef CAS.
- X. Zhao, G. Yang, Y. Wang and X. Gao, Photochemical degradation of dimethyl phthalate by Fenton reagent, J. Photochem. Photobiol., A, 2004, 161, 215–220 CrossRef CAS.
- Y. Mei, M. Rongshuang, Z. Ruizhi, H. Hongyuan, T. Qiyue and Z. Shuhua, Effects of Dimethyl Phthalate (DMP) on Serum Sex Hormone Levels and Apoptosis in C57 Female Mice, Int. J. Endocrinol. Metab., 2019, 17(2), e82882 Search PubMed.
- C. Wang, J. Li, X. Lv, Y. Zhang and G. Guo, Photocatalytic organic pollutants degradation in metal-organic frameworks, Energy Environ. Sci., 2014, 7, 2831–2867 RSC.
- J. J. Xue, Z. R. Zhu, Y. Q. Zong, C. J. Huang and M. X. Wang, Oxidative Degradation of Dimethyl Phthalate (DMP) by the Fe(VI)/H2O2 Process, ACS Omega, 2019, 4, 9467–9472 CrossRef CAS PubMed.
- S. T. Jiang, Z. Y. Zhao, J. F. Chen, Y. Yang, C. Y. Ding, Y. Q. Yang, Y. X. Wang, N. Liu, L. Wang and X. D. Zhang, Recent research progress and challenges of MIL-88(Fe) from synthesis to advanced oxidation process, Surf. Interfaces, 2022, 30, 101843 CrossRef CAS.
- X. Li, B. Jie, H. Lin, Z. P. Deng, J. Y. Qian, Y. Q. Yang and X. D. Zhang, Application of sulfate radicals-based advanced oxidation technology in degradation of trace organic contaminants (TrOCs): recent advances and prospects, J. Environ. Manage., 2022, 308, 114664 CrossRef CAS PubMed.
- Y. Wang, Y. Gong, N. Lin, H. Jiang, X. Wei, N. Liu and X. D. Zhang, Cellulose hydrogel coated nanometer zero-valent iron intercalated montmorillonite (CH-MMT-nFe0) for enhanced reductive removal of Cr(VI): characterization, performance, and mechanisms, J. Mol. Liq., 2022, 347, 118055 Search PubMed.
- Q. Du, R. Rao, F. Bi, Y. Yang, W. Zhang, Y. Yang, N. Liu and X. Zhang, Preparation of modified zirconium-based metal-organic frameworks (Zr-MOFs) supported metals and recent application in environment: a review and perspectives, Surf. Interfaces, 2022, 28, 101647 CrossRef CAS.
- Y. Gong, Y. Wang, N. Lin, R. Wang, M. Wang and X. Zhang, Iron-based materials for simultaneous removal of heavy metal(loid)s and emerging organic contaminants from the aquatic environment: recent advances and perspectives, Environ. Pollut., 2022, 299, 118871 CrossRef CAS PubMed.
- N. Liu, J. X. Wu, F. H. Fei, J. Q. Lei, W. Y. Shi, G. X. Quan, S. Zeng, X. D. Zhang and L. Tang, Ibuprofen degradation by a synergism of facet-controlled MIL-88B (Fe) and persulfate under simulated visible light, J. Colloid Interface Sci., 2022, 612, 1–12 CrossRef CAS PubMed.
- D. H. Yu, J. G. He, Z. Y. Wang, H. L. Pang, L. Li, Y. S. Zheng, Y. W. Chen and J. Zheng, Mineralization of norfloxacin in a CoFe–LDH/CF cathode-based heterogeneous electro-Fenton system: preparation parameter optimization of the cathode and conversion mechanisms of H2O2 to ·OH, Chem. Eng. J., 2021, 417, 129240 CrossRef CAS.
- Y. Wang, R. Wang, N. Lin, J. Xu, X. Liu, N. Liu and X. Zhang, Degradation of norfloxacin by MOF-derived lamellar carbon nanocomposites based on microwave-driven Fenton reaction: improved Fe (III)/Fe(II) cycle, Chemosphere, 2022, 293, 1336141 Search PubMed.
- Y. Wang, R. Wang, L. Yu, Y. Wang, C. H. Zhang and X. D. Zhang, Efficient reactivity of LaCu0.5Co0.5O3 perovskite intercalated montmorillonite and g-C3N4 nanocomposites in microwave-induced H2O2 catalytic degradation of bisphenol A, Chem. Eng. J., 2020, 401, 126057 CrossRef CAS.
- Y. Wang, Y. Wang, L. Yu, R. Wang and X. Zhang, Highly effective microwave-induced catalytic degradation of bisphenol A in aqueous solution using double-perovskite intercalated montmorillonite nanocomposite, Chem. Eng. J., 2020, 390, 124550 CrossRef CAS.
- C. Walling, Fentons reagent revisited, Acc. Chem. Res., 1975, 8, 125–131 CrossRef CAS.
- S. Wang, A Comparative study of Fenton and Fenton-like reaction kinetics in decolourisation of wastewater, Dyes Pigm., 2008, 76, 714–720 CrossRef CAS.
- R. Aplin and T. D. Waite, Comparison of three advanced oxidation processes for degradation of textile dyes, Water Sci. Technol., 2000, 42, 345–354 CrossRef CAS.
- S. Liu, A. Zhang, K. Yan, Y. Ye and X. Chen, MW-enhanced catalytic degradation of methylene blue by porous MFe2O4 (M= Mn, Co) nanocomposites: pathways and mechanisms, Sep. Purif. Technol., 2014, 135, 35–41 CrossRef CAS.
- R. Shu, G. Zhang, X. Wang, X. Gao, M. Wang, Y. Gan, J. Shi and J. He, Fabrication of 3D net-like MWCNTs/ZnFe2O4 hybrid composites as high-performance electromagnetic wave absorbers, Chem. Eng. J., 2018, 337, 242–255 CrossRef CAS.
- Y. Wang, W. Wang and D. Yu, Three-phase heterostructures f-NiFe2O4/PANI/PI EMI shielding fabric with high MW absorption performance, Appl. Surf. Sci., 2017, 425, 518–525 CrossRef CAS.
- A. Zhang, S. Liu, K. Yan, Y. Ye and X. Chen, Facile preparation of MnFe2O4/halloysite nanotubular encapsulates with enhanced magnetic and electromagnetic performances, RSC Adv., 2014, 4, 13565 RSC.
- T. Xia, Z. Ma, M. Ai, K. Qian, S. Zhu, M. Rong, P. Zhang, Y. Ye and W. Qin, Photocatalyst-coated carbon microtube electrodes: preparation and characterization of their properties and photocatalytic degradation of methylene blue, Chemosphere, 2021, 128927 CrossRef CAS PubMed.
- W. Qin, H. Lv, T. Xia, Y. Ye, X. Chen and S. Lyu, TiO2 Intercalated Talc Nanocomposite: Preparation, Characterization, and Its Photocatalytic Performance, J. Nanosci. Nanotechnol., 2017, 17, 6558–6565 CrossRef CAS.
- F. K. Bi, X. D. Zhang, Q. X. Du, K. Yue, R. Z. Wang, F. Li, N. Liu and Y. D. Huang, Influence of pretreatment conditions on low-temperature CO oxidation over Pd supported UiO-66 catalysts, Mol. Catal., 2021, 509, 111633 CrossRef CAS.
- B. Wang, F. Yuan, W. A. Wang, D. Zhang, H. L. Sun, K. Xi, D. L. Wang, J. H. Chu, Q. J. Wang, Q. J. Wang and W. Li, A carbon microtube array with a multihole cross profile: releasing the stress and boosting long-cycling and high-rate potassium ion storage, J. Mater. Chem. A, 2019, 7, 25845–25852 RSC.
- C. Mahala, M. D. Sharma and M. Basu, 2D nanostructures of CoFe2O4 and NiFe2O4: efficient oxygen evolution catalyst, Electrochim. Acta, 2018, 273, 462–473 CrossRef CAS.
- Y. Naito and K. Suetake, Application of ferrite to electromagnetic wave absorber and its characteristics, IEEE Trans. Microwave Theory Tech., 1979, MT19, 65–72 Search PubMed.
- H. Guan, S. Liu, Y. Duan and Y. Zhao, Investigation of the electromagnetic characteristics of cement based composites filled with EPS, Cem. Concr. Compos., 2007, 29, 49–54 CrossRef CAS.
- X. Chen, J. Cheng, S. Lv, P. Zhang, S. Liu and Y. Ye, Preparation of porous magnetic nanocomposites using corncob powders as template and their applications for electromagnetic wave absorption, Compos. Sci. Technol., 2012, 72, 908–914 CrossRef CAS.
- S. T. Liu, X. G. Chen, A. B. Zhang, K. K. Yan and Y. Ye, Electromagnetic Performance of Rice Husk Ash, Bioresources, 2014, 9, 2328–2340 Search PubMed.
- R. Moučka, M. Mravčáková, J. Vilčáková, M. Omastová and P. Sáha, Electromagnetic absorption efficiency of polypropylene/montmorillonite/polypyrrole nanocomposites, Mater. Des., 2011, 32, 2006–2011 CrossRef.
- C. I. Brinzila, M. J. Pacheco, L. Ciríaco, R. C. Ciobanu and A. Lopes, Electrodegradation of tetracycline on BDD anode, Chem. Eng. J., 2012, 209, 54–61 CrossRef CAS.
- Y. Tamaura and M. Tabata, Complete reduction of carbon dioxide to carbon using cation-excess magnetite, Nat. Photonics, 1990, 346, 255–256 CAS.
- B. Sahoo, S. K. Sahu, S. Nayak, D. Dhara and P. Pramanik, Fabrication of magnetic mesoporous manganese ferrite nanocomposites as efficient catalyst for degradation of dye pollutants, Catal. Sci. Technol., 2012, 2, 1367–1374 RSC.
- S. W. Kingman and N. A. Rowson, MW treatment of minerals-a review, Miner. Eng., 1998, 11, 1081–1087 CrossRef CAS.
- D. V. Konarev, S. S. Khasanov, M. Ishikawa, A. Otsuka, H. Yamochi, G. Saito and R. N. Lyubovskaya, Charge transfer complexes of metal-free phthalocyanine radical anions with decamethylmetallocenium cations: (Cp2Co(+)-Co−*)(H2Pc center dot-)).solvent and (Cp2Cr(+-Cr−*)(H2Pc center dot-).4C6H4Cl2, Dalton Trans., 2017, 46, 3492–3499 RSC.
- A. Homayonfard, M. Miralinaghi, R. H. S. M. Shirazi and E. Moniri, Efficient removal of cadmium (II) ions from aqueous solution by CoFe2O4/chitosan and NiFe2O4/chitosan composites as adsorbents, Water Sci. Technol., 2018, 78, 2297–2307 CrossRef CAS PubMed.
- M. Nawaz, A. Shahzad, K. Tahir, J. Kim, M. Moztahida, J. Jang, M. B. Alam, S. Lee, H. Jung and D. S. Lee, Photo-Fenton reaction for the degradation of sulfamethoxazole using a multi-walled carbon nanotube-NiFe2O4 composite, Chem. Eng. J., 2020, 382, 123053 CrossRef CAS.
- M. Lucas and J. Peres, Decolorization of the azo dye Reactive Black 5 by Fenton and photo-Fenton oxidation, Dyes Pigm., 2006, 71, 236–244 CrossRef CAS.
- S. H. Lin and C. C. Lo, Fenton process for treatment of desizing wastewater, Water Res., 1997, 31, 2050–2056 CrossRef CAS.
- M. Li, J. Huang, M. Liu, S. Li, J. Ma and D. L. Phillips, Investigation of the Role of Protonation of Benzophenone and Its Derivatives in Acidic Aqueous Solutions Using Time-Resolved Resonance Raman Spectroscopy: How Are Ketyl Radicals Formed in Aqueous Solutions?, J. Phys. Chem. B, 2014, 119, 2241–2252 CrossRef PubMed.
- C. Yin, J. J. Cai, L. F. Gao, J. Y. Yin and J. C. Zhou, Highly efficient degradation of 4-nitrophenol over the catalyst of Mn2O3/AC by MW catalytic oxidation degradation method, J. Hazard. Mater., 2016, 305, 15–20 CrossRef CAS PubMed.
- Y. Qiu, J. Zhou, J. Cai, W. Xu, Z. You and C. Yin, Highly efficient microwave catalytic oxidation degradation of p-nitrophenol over microwave catalyst of pristine a-Bi2O3, Chem. Eng. J., 2016, 306, 667–675 CrossRef CAS.
- X. Liu, S. An, W. Shi, Q. Yang and L. Zhang, Microwave-induced catalytic oxidation of malachite green under magnetic Cu-ferrites: new insight into the degradation mechanism and pathway, J. Mol. Catal. A: Chem., 2014, 395, 243–250 CrossRef CAS.
- Y. Lei, X. Lin and H. Liao, New insights on microwave induced rapid degradation of methyl orange based on the joint reaction with acceleration effect between electron hopping and Fe2+-H2O2 reaction of NiFeMnO4 nanocomposites, Sep. Purif. Technol., 2018, 192, 220–229 CrossRef CAS.
- E. Neyens and J. Baeyens, A review of classic Fenton's peroxidation as an advanced oxidation technique, J. Hazard. Mater., 2003, 98, 33–50 CrossRef CAS PubMed.
|
| This journal is © The Royal Society of Chemistry 2022 |
Click here to see how this site uses Cookies. View our privacy policy here.  Open Access Article
 a,
Xinyi
Zhang
a,
Zefei
Chen
a,
Xueya
Liu
a,
Manqing
Ai
b,
Pingping
Zhang
a,
Xinyi
Zhang
a,
Zefei
Chen
a,
Xueya
Liu
a,
Manqing
Ai
b,
Pingping
Zhang
 b,
Ying
Ye
 b and
Zengling
Ma
*a
![[thin space (1/6-em)]](https://www.rsc.org/images/entities/char_2009.gif) 000 rpm for 5 min, and then the extent of DMP adsorption by the catalyst was determined. The characteristic absorption peaks of the DMP functional groups were analyzed by scanning the sample with a UV-2550 spectrophotometer (Shimadzu Corporation of Japan) in the wavelength range of 200–900 nm, while the concentration of the DMP solution was calculated using the maximum absorption peak (229 nm and 275 nm) according to the Lambert–Beer formula. To evaluate the catalytic activity, an identical experiment was performed. Hydrogen peroxide (10 mg) was added after the equilibration step, and then the catalyst and DMP solution were exposed to MW at a frequency of 2450 MHz. To prevent overheating bumping, the MW oven was closed for 15 s, and then reheated after an interval of 15 s. Subsequently, a sample of the DMP solution was removed and subjected to the same analysis, as described above. To ensure the consistency of the solid–liquid ratio, only one sample was taken from each experiment. All experiments were conducted in triplicate and the average value was taken. The same procedure was repeated with simulated wastewater instead of ultrapure water. The content of the main elements in the simulated wastewater is shown in Table S1 (ESI†).
000 rpm for 5 min, and then the extent of DMP adsorption by the catalyst was determined. The characteristic absorption peaks of the DMP functional groups were analyzed by scanning the sample with a UV-2550 spectrophotometer (Shimadzu Corporation of Japan) in the wavelength range of 200–900 nm, while the concentration of the DMP solution was calculated using the maximum absorption peak (229 nm and 275 nm) according to the Lambert–Beer formula. To evaluate the catalytic activity, an identical experiment was performed. Hydrogen peroxide (10 mg) was added after the equilibration step, and then the catalyst and DMP solution were exposed to MW at a frequency of 2450 MHz. To prevent overheating bumping, the MW oven was closed for 15 s, and then reheated after an interval of 15 s. Subsequently, a sample of the DMP solution was removed and subjected to the same analysis, as described above. To ensure the consistency of the solid–liquid ratio, only one sample was taken from each experiment. All experiments were conducted in triplicate and the average value was taken. The same procedure was repeated with simulated wastewater instead of ultrapure water. The content of the main elements in the simulated wastewater is shown in Table S1 (ESI†).


