DOI:
10.1039/D2TC03463H
(Paper)
J. Mater. Chem. C, 2022,
10, 17965-17973
Blue heteroleptic iridium(III) complexes for OLEDs: simultaneous optimization of color purity and efficiency†
Received
17th August 2022
, Accepted 2nd November 2022
First published on 2nd November 2022
Abstract
High-performance blue phosphorescent iridium(III) complexes having good efficiency and color purity simultaneously are still a huge challenge. Two blue phosphorescent iridium(III) complexes, (dfdmappy)2Ir(phim) (Ir1) and (dfdmapypy)2Ir(phim) (Ir2), were developed by employing 2-(2,4-difluorophenyl)-N,N-dimethylpyridin-4-amine (dfdmappy) and 2′,6′-difluoro-N,N-dimethyl-[2,3′-bipyridin]-4-amine (dfdmapypy) as cyclometalating ligands and N-heterocyclic carbene (phim) as an ancillary ligand. The introduction of a strong electron-donating dimethylamino (dma) group onto the N-coordinating pyridine ring of the main ligands and the adoption of high field-strength phim effectively raise the cyclometalating ligand-centered emitting triplet states (i.e.3LC). Meanwhile, the phim ligand with strong σ-donating electron character destabilizes the non-radiative d–d*state as well. These strategies make both complexes achieve charge transfer (CT) state dominated emission, i.e., metal-to-ligand/ligand-to-ligand charge transfer (3MLCT/3LLCT) dominated emission from the T1 state and resulted in Ir1 and Ir2 single-peak blue phosphorescence with high photoluminescence quantum yields (PLQYs) of 91% and 60%, respectively, and shorter excited-state lifetimes of 1.10 and 3.33 μs, respectively. Quantum chemical calculations verified the CT-dominated feature and lower root-mean-square displacement/deviation (RMSD) value of Ir1versus more metal centered d–d*transition and larger RMSD value of Ir2, well accounting for the higher PLQY and superior color purity of Ir1. Pure blue organic light-emitting diodes (OLEDs) of Ir1 exhibit a maximum external quantum efficiency (EQE) of 28% with Commission Internationale de I’Eclairage (CIE) coordinates of (0.16, 0.21), which is one of the best performances for blue phosphorescent OLEDs reported so far.
Introduction
Organic light-emitting devices (OLEDs) have received extensive attention, especially in the fields of solid-state lighting, biological imaging and display.1 To achieve full-color luminescence, three primary color red, green and blue (RGB) emitters are indispensable.2 Due to the spin–orbit coupling effect, heavy metal complexes can simultaneously harvest singlet and triplet excitons, leading to an internal quantum efficiency of up to 100%.3,4 In particular, owing to their high photoluminescence quantum yields (PLQYs), short phosphorescence lifetimes, facile color adjustments and good stability, iridium(III) metal complexes are considered as one of the most promising light-emitting materials for practical applications.5–7
However, there are still some thorny problems in the development of blue phosphorescent iridium(III) complexes with regard to color purity, stability and emission efficiency, as compared to green and red phosphorescent iridium(III) complexes.8 By increasing the energy gap, the lowest emitting triplet state (T1) approaches the metal-centered d–d* state, resulting in fast nonradiative decay via accessible thermal population and low emission efficiency, frequently accompanied by the decomposition of the iridium complexes due to the breaking of the Ir–N bond.9 In addition, as reported previously, the emission spectrum of the typical blue phosphorescent bis(4′,6′-difluorophenylpyridinato)-iridium(III) picolinate (FIrpic) has a long-wavelength shoulder, which gives the corresponding OLED device inferior Commission Internationale de I’Eclairage (CIEx,y) coordinates of around (0.15, 0.30).10–12 This phenomenon is a common problem for blue-emitting complexes because of the decreased proportion of metal-to-ligand charge transfer (MLCT) transition in the excited state. Apparently, in order to shift the emission to the pure blue or deep blue region, the long-wavelength emission shoulder derived from 0 to 1 vibronic transitions should be suppressed by increasing the MLCT state percentage in the T1 state to generate a single-peak emission. Moreover, the higher MLCT character is beneficial for shortening radiative decay lifetimes and improving photoluminescence quantum yields (PLQYs).13 Nowadays, to achieve highly efficient blue phosphorescent iridium complexes, it is necessary to tackle these problems. Usually, there are several typical strategies to realize blue or deep blue emission. To increase the ligand-centered triplet state (i.e.3LC) energy by appropriate ligand modification, e.g. by adding a heteroatom in the C-coordinating ring of the cyclometalating ligands, was proved favorable to cause a hypsochromic shift of phosphorescence.14–17 In addition, adopting strong σ-donating ligands such as carbenes as the ancillary ligands could raise the non-radiative d–d* excited-state so as to make it distant from the emitting triplet states such as 3MLCT. Meanwhile, the carbene ligand with higher triplet energy could adjust the electron density distribution of the frontier molecular orbital to increase the contribution of 3MLCT in the lowest lying triplet manifold.18–21 For example, Huang reported excellent blue iridium(III) complexes, Ir(fdpt)3, which showed a high maximum external quantum efficiency (EQEmax) of 22.5% with CIEx,y coordinates of (0.15, 0.11). Unfortunately, the phosphorescence spectrum has two bands at 431 and 458 nm in CH2Cl2, deviating from the deep blue region.22 Forrest's group designed two deep-blue iridium(III) complexes fac-/mer-Ir(pmp)3 (pmp: N-phenyl,N-methyl-pyridoimidazol-2-yl) with single-peak emissions at 418 and 465 nm in 2-MeTHF, respectively.18 The single-peak emission for mer-Ir(pmp)3 was proved to originate primarily from a 3MLCT excited state, and the corresponding OLEDs exhibited EQEmax of 9.0% and 13.3% at 1000 cd m−2. Zysman-Colman and coworkers also reported two NHC-containing (N-heterocyclic carbene) iridium complexes. The OLEDs achieved deep-blue emission with an EQEmax of 13.4% and CIE coordinates of (0.154, 0.052).19 These results demonstrated that the introduction of N-heterocyclic carbene indeed causes a hypsochromic shift and generates single-peak phosphorescence. As is well known, typical blue iridium complexes bearing phenylpyridine (ppy) or bipyridine (pypy) ligands are popular among researchers due to their inherent advantages such as the facile control of emitting color from sky blue to deep blue, high PLQYs and simple synthesis.23,24 Therefore, it is a good choice to use ppy and pypy as cyclometalating ligand skeletons with necessary modifications to develop high-performance blue phosphors.
Herein, we designed and synthesized two new blue-emitting iridium(III) complexes, namely (dfdmappy)2Ir(phim) (Ir1) and (dfdmapypy)2Ir(phim) (Ir2) (Scheme 1), in which 2-(2,4-difluorophenyl)-N,N-dimethylpyridin-4-amine (dfdmappy, L1) and 2',6'-difluoro-N,N-dimethyl-[2,3′-bipyridin]-4-amine (dfdmapypy, L2) were designed as the cyclometalating ligands and N-(4-trifluoromethyl)phenyl-N-methyl-imidazol-2-yl (phim, L3) as the ancillary ligand. Both the incorporation of the strong electron-donating dimethylamino (dma) group onto the N-coordinating pyridine ring of the main ligands and the adoption of high field-strength phim were used to raise the cyclometalating ligand-centered emitting triplet states (i.e.3LC). The phim ligand with the strong σ-donating electron character destabilized the non-radiative d–d*state as well. The time-dependent density functional theory (TD-DFT) results of the complexes verified that the CT states dominated the emission for complexes Ir1 and Ir2, whereas the ligand-centered 3π–π* state dominated the emission for the typical blue phosphor FIrpic. In CH2Cl2 solution, both complexes exhibited shorter wavelength and single-peak phosphorescence profiles with suppressed vibronic side peaks, which further indicated that the emission arose from the CT states. However, both complexes exhibited high and moderate PLQYs of 0.94 and 0.61, and short excited lifetimes of 1.10 and 3.33 μs in the doped dibenzo[b,d]furan-2,8-diylbis(diphenylphosphine oxide) (PPF) films, respectively. Particularly, the blue OLED of complex Ir1 showed a high EQEmax of 28% with CIE coordinates of (0.16, 0.21), which are among the highest efficiencies of blue phosphorescent OLEDs (PhOLEDs) with similar colors ever reported so far and demonstrate the great application potential for high-performance blue OLEDs.25,26
 |
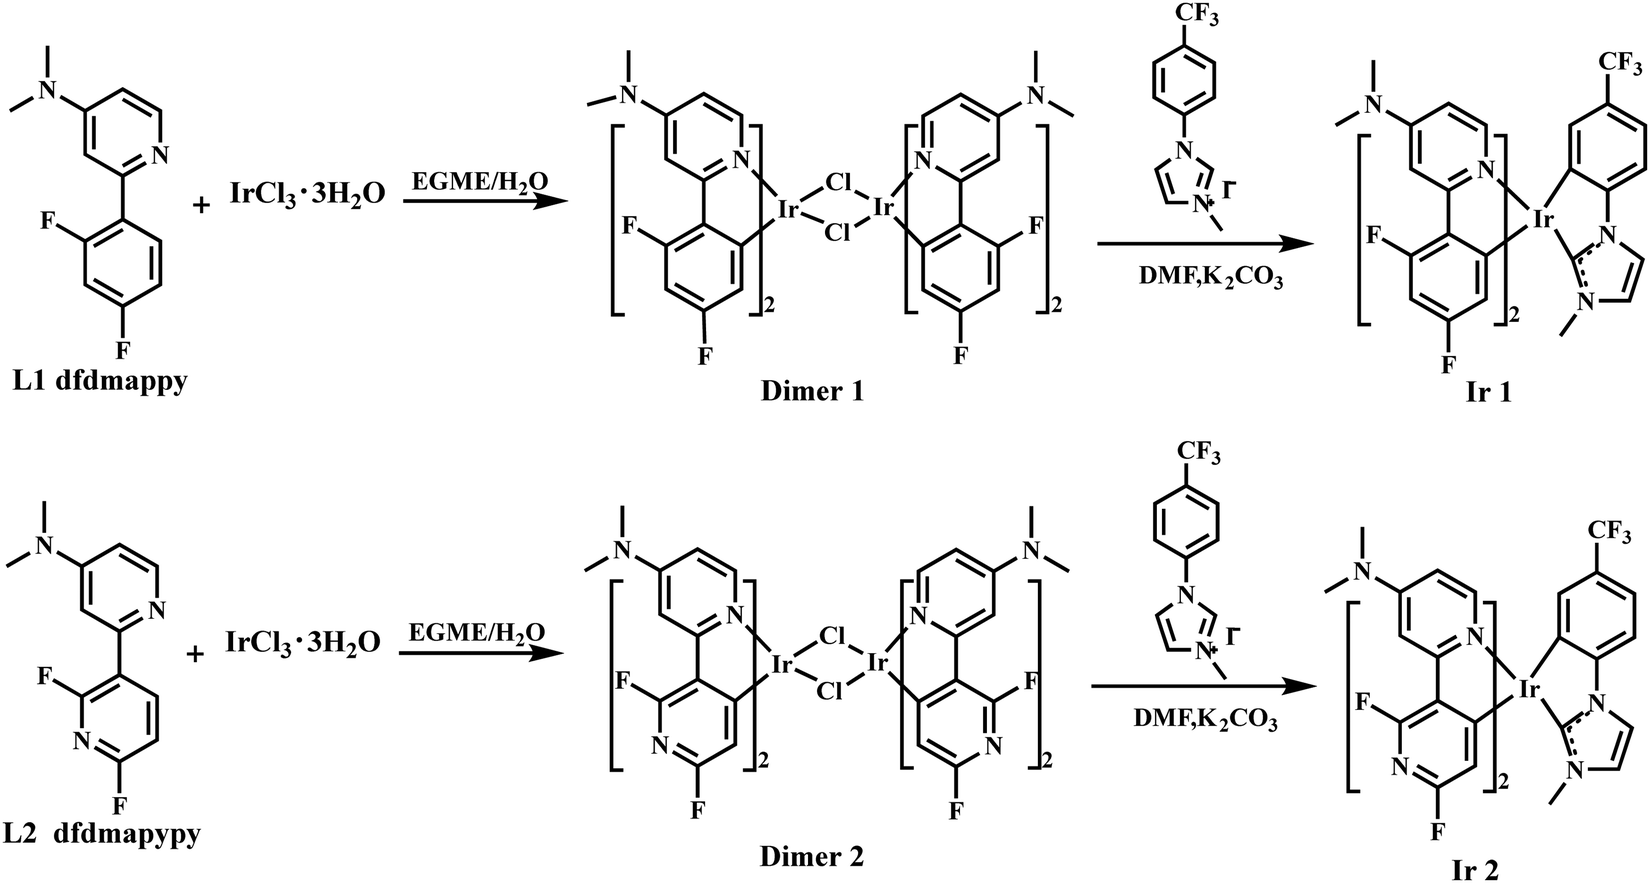
| | Scheme 1 Chemical structures and synthetic routes of complexes Ir1 and Ir2. | |
Results and discussion
Synthesis
The molecular structures and synthetic routes of complexes Ir1 and Ir2 are described in Scheme 1. The cyclometalating ligands L1 and L2 were prepared using 2-bromo-N,N-dimethylpyridin-4-amine and the corresponding boronic acid by the Suzuki coupling reaction according to the literature methods.25,27N-(4-trifluoromethyl)phenyl-N-methyl-imidazol-2-yl (phim, L3) was synthesized following the literature method.19 The cyclometalated iridium complexes Ir1 and Ir2 were synthesized using the typical two-step procedure, with L1 and L2 as the main cyclometalating ligands and L3 as the ancillary ligand, as shown in Scheme 1. Both complexes have good solubilities in common solvents and were fully purified by column chromatography and recrystallization for applications in OLEDs.
Theoretical calculations
To further explore the ground state and excited-state characteristics, the theoretical chemical simulation was implemented in complexes Ir1 and Ir2. The structure optimization and single-point energy calculation were carried out using the B3LYP functional and the 6-31G(d) basis set, except for Ir atoms using the LanL2DZ basis set for the molecular simulation. All calculations were performed using the Gaussian 09 software package. As shown in Fig. 1, the HOMOs of complexes Ir1and Ir2 mainly reside on the d orbitals of the Ir atoms (46%–49%), and less contributions from the ancillary ligands and cyclometalating ligands are observed. However, the HOMOs of FIrpic are mostly localized on the Ir atoms and the phenyl part of its primary ligands.28 Meanwhile, the LUMOs of both complexes are primarily dispersed on one of the cyclometalating ligands (78%–79%) with a small part on the other cyclometalated ligand (16%) and the ancillary ligand (4%–5%). However, the LUMO of FIrpic is mostly distributed over the ancillary ligand.28 The attachment of the electron-donating dma group on the cyclometalating ligand significantly pushes more electron density to the cyclometalating ligand so as to destabilize the frontier molecular orbitals of these Ir(III) complexes and results in shallow LUMOs at −1.04 and −1.38 eV for Ir1 and Ir2, respectively.
 |
| | Fig. 1 The distribution of the HOMOs/LUMOs of complexes Ir1 and Ir2. (The HOMO and LUMO of each complex are contributed by four parts, i.e. one cyclometalating ligand (purple line), the other cyclometalating ligand (blue line), ancillary ligand (black line) and Ir atom (red line), respectively). The numbers present the contribution proportion of each part to the corresponding orbital.). | |
We then performed TD-DFT calculations at the CAM-B3LYP level on the basis of the B3-LYP-optimized ground-state geometries to disclose the character of excited states. As presented in Table 1 and Table S1 (ESI†), TD-DFT calculations suggest that the T1 states of complexes Ir1 and Ir2 possess similar excited state characteristics. For complex Ir1, the T1 and T2 states, which are almost degenerate in energy, feature a mixed 3MLCT/3LLCT/3LC character. For the T1 state, the relatively high 3MLCT/3LLCT proportion compared to the 3LC character should be favorable for the single-peak emission. For complex Ir2, the T1 state possesses a similar complicated multiconfigurational character, i.e., mixed 3MLCT/3LLCT with the moderate 3LC character. For FIrpic, the T1 state exhibits mixed 3MLCT/3LLCT/3LC character and the 3LC character accounts for up to 65.62%, which indicates that ligand-centered 3π–π* states will dominate the emission. For complexes Ir1 and Ir2, the calculated 3MLCT percentages for the T1 state are 20.91 and 16.80%, respectively, which are larger than those of FIrpic (11.48%). Obviously, the 3MLCT/3LLCT transition in the T1 state of complexes Ir1 and Ir2 would make a major contribution to the emission. However, the content ratios of the charge transfer states (i.e.3MLCT and 3LLCT) to the 3LC state are moderate for both complexes, which should contribute to the good color purity and photophysical properties, including the accelerated Kr and improved PLQY observed in experimental measurements (vide infra). These theoretical calculation results indicate that the introduction of the dma group on the cyclometalating ligands and the strong ligand-field carbene phim is beneficial for tuning the intrinsic electronic characteristics of the lowest emitting triplet state, herein preferring the CT (3MLCT/3LLCT) character of the iridium(III)-based emitters so as to achieve a better color purity, a higher PLQY and a shorter excited state lifetime.
Table 1 TD-DFT calculation results of the complexes
| Complex |
E
T1
[eV] |
3MLCTb [%] |
3LLCTb [%] |
3LCb [%] |
|
Calculated energy levels of T1.
Contribution percentages of 3MLCT, 3LLCT, and 3LC to the T1 state.
|
|
Ir1
|
3.10 |
20.91 |
43.91 |
33.78 |
|
Ir2
|
3.21 |
16.80 |
49.79 |
33.41 |
|
FIrpic
|
2.91 |
11.48 |
21.90 |
65.62 |
Electrochemical properties
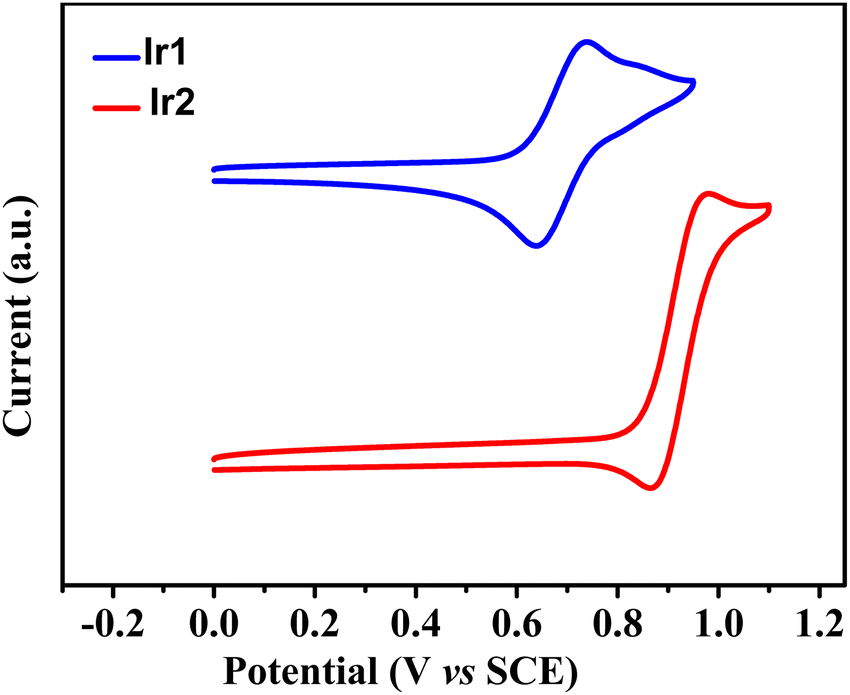
The electrochemical properties were assessed by cyclic voltammetry to further investigate the HOMO and LUMO energy levels of both complexes (Fig. 2). Complexes Ir1 and Ir2 exhibited a reversible oxidation process with onset potentials at 0.69 and 0.92 V, respectively, corresponding to the different HOMO energy levels of −5.09 eV for Ir1 and −5.32 eV for Ir2 (Table 2). The deeper HOMO of Ir2 than that of Ir1 coincided with the stronger electron-withdrawing ability of the cyclometalating ligand dfdmapypy due to the presence of the difluoropyridine ring, stabilizing the corresponding HOMO energy level, because the C-coordinating ring of the cyclometalating ligand, i.e., just this difluoropyridine ring has important contributions to the HOMO of the iridium complexes (vide infra). The LUMO energy levels of these complexes were estimated from the HOMO energy values and the band gap that were calculated from the UV-vis absorption edge wavelengths of the film samples as −2.22 and −2.41 eV, respectively. These suitably aligned HOMO and LUMO levels should be favorable for the efficient charge injection into the emitting dopant when these iridium complexes are used as emitters in OLEDs.
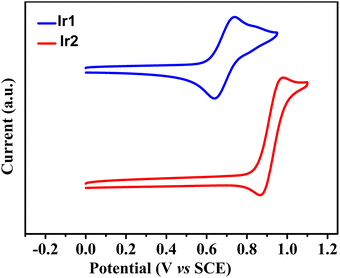 |
| | Fig. 2 Cyclic voltammograms of complexes Ir1 and Ir2. | |
Table 2 The experimentally obtained physical parameters of Ir1 and Ir2
| Complex |
λ
abs
[nm] |
λ
em
[nm] |
τ
[μs] |
PLQYbh [%] |
K
r
[105 S−1] |
K
nr
[104 S−1] |
HOMOd/LUMOe [eV] |
E
g
[eV] |
E
T
[eV] |
|
Measured in CH2Cl2 solutions (1.0 × 10⁻⁵ M) at room temperature.
Measured in 5 wt% doped PPF films.
Radiative decay rate kr = PLQY/τ, and nonradiative decay rate kr = (1 − PLQY)/τ.
Calculated from the empirical equation: EHOMO = −e(Eonsetox + 4.4)eV.
Calculated from ELUMO = Eoptg + EHOMO.
Estimated from the absorption edge of UV-visible spectra.
Estimated from the highest energy peak of PL spectra in 2-Me-THF at 77 K.
Measured using fac-Ir(ppy)3 as the standard sample (PLQY = 0.4) in the degassed CH2Cl2 solution.
|
|
Ir1
|
250,381,407 |
477/456 |
1.10 |
94/20 |
8.50 |
5.9 |
−5.09/−2.22 |
2.87 |
2.73 |
|
Ir2
|
248,368,401 |
469/452,471 |
3.33 |
61/32 |
1.83 |
11.7 |
−5.32/−2.41 |
2.91 |
2.74 |
Photophysical properties
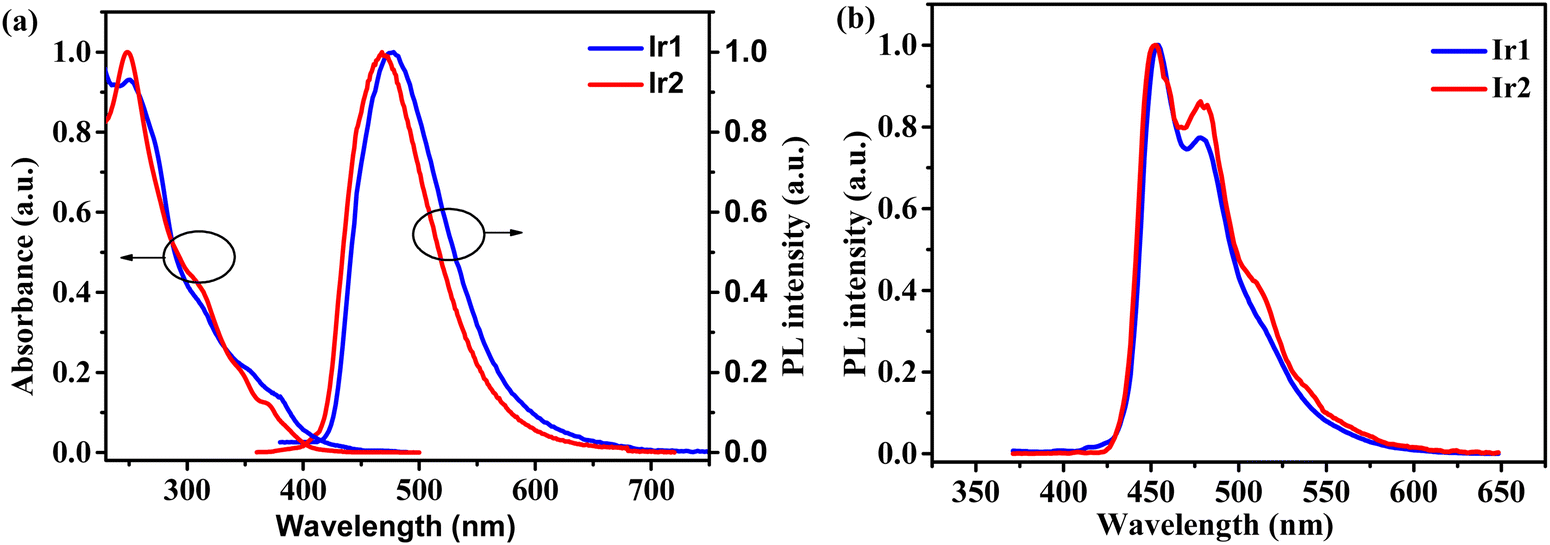
The UV-vis absorption and photoluminescence (PL) spectra of complexes Ir1 and Ir2 in dichloromethane solutions are shown in Fig. 3. The strong absorption bands below 340 nm could be assigned to the ligand-centered (LC) π–π* transitions. The medium absorption bands between 340 and 400 nm could be ascribed to the singlet metal-to-ligand charge transfer (1MLCT) and ligand-to-ligand (1LLCT) charge transfer transitions. The weak absorption bands above 400 nm could be attributed to the 3MLCT and 3LLCT transitions.17
 |
| | Fig. 3 (a) UV-vis absorption and PL spectra of complexes Ir1 and Ir2 in CH2Cl2 solutions (10−5 mol L−1) at RT and (b) their phosphorescence spectra in 2-Me-THF at 77 K. | |
In the dichloromethane solution, both complexes Ir1 and Ir2 emit sky-blue light with structureless and broad profiles and peaks at 477 and 469 nm, respectively, which evidently differ from the fine vibronic spectrum of FIrpic with peaks at 469 and 496 nm in CH2Cl2 (Fig. S1, ESI†). Meanwhile, the calculated emission maxima ΔE = E(T1) − E(S0) of complexes Ir1 and Ir2 at their corresponding optimized geometries (adiabatic electronic emission) are located at 425 and 426 nm, respectively (Table S3, ESI†). These values have acceptable relative errors of 10.9% and 9.2% compared to those experimentally measured values for Ir1 and Ir2. Importantly, the predicted energy difference between complexes Ir1 and Ir2 is relatively small, which coincides with that observed in Fig. 3. The structureless and single-peak emission feature of complexes Ir1 and Ir2 compared to the fine vibronic structure of FIrpic correlates with the dominating 3MLCT/3LLCT character in the lowest triplet excited state, as verified by the above theoretical calculation. The considerable CT character in the emitting triplet states is experimentally validated by the broad structureless PL spectra and the evident blue-shifts (15–25 nm) of the PL spectra at 77 K in 2-MeTHF in comparison with those at room temperature (Table 2 and Fig. 3).29 Complex Ir2 indeed has a larger HOMO–LUMO energy gap (Eg) and thus the blue shifted emission than complex Ir1 (Fig. 3a), which has been verified by both the electrochemical data or DFT calculation results. This is mainly because the stronger electron-withdrawing ability of the cyclometalating ligand dfdmapypy of Ir2 relative to dfdmappy of Ir1 could better stabilize the HOMO energy level (Fig. 2). In addition, the TD-DFT calculation results also show that complex Ir2 has a higher T1 energy level than complex Ir1. At a low temperature like 77 K, fine-resolved phosphorescence spectra were recorded for both complexes, as shown in Fig. 3b. The lowest triplet state (T1) energies of Ir1 and Ir2 were calculated from the highest-energy vibronic sub-band (i.e. E0–0 band) of the phosphorescence spectra as 2.73 and 2.74 eV, respectively. The slightly higher T1 energy of Ir2 that was experimentally obtained is practically in accord with that TD-DFT predicted trend (3.10 eV for Ir1 and 3.21 eV for Ir2). In the 5 wt% doped PPF films, complexes Ir1 and Ir2 emit bluer light with peaks at 456 and 452 nm (Fig. S2, ESI†) in comparison with those in solution, and show higher PLQYs of 0.94 and 0.61, respectively, versus 0.20 for Ir1 and 0.32 for Ir2 in degassed dichloromethane solutions (Table 2). The superior PLQYs in doped films should be because the large rigidity of the local environment in solid films can suppress the non-radiative inactivation process.30 The excited-state lifetimes of Ir1 and Ir2 were determined as 1.10 and 3.33 μs (Fig. S3, ESI†), respectively. According to the PLQY and τ, the radiative (Kr) and nonradiative (Knr) decay rates were calculated and are listed in Table 2. Complex Ir1 possesses a Kr of 8.50 × 10⁵ s−1, which is nearly five times larger than that (1.83 × 10⁵ s−1) of Ir2, and a smaller Knr of 5.9 × 10⁴ s−1 than that (11.7 × 10⁴ s−1) of Ir2, respectively. To explore the real reason of the lower emission efficiency for complex Ir2, we visualized the geometries and triplet spin-density distributions (TSDDs) of optimized T1 states, as shown in Fig. 4. The spin-density of the T1 state for Ir1 spreads over one cyclometalating ligand and the Ir atom, implying a MLCT characteristic of T1 state, while the TSDD of Ir2 distributes mostly on the iridium atom, indicating the metal-centered character of the corresponding T1 state. This must intrinsically result in phosphorescence quench by d–d* transitions of the iridium atom and the lower PLQY. To gain further insights into the non-radiation behavior induced by conformation changes in the excited state for these molecules, root-mean-square-deviation (RMSD) calculations were carried out to reflect the conformation changes between the ground state (S0) and the excited state (T1),31 as shown in Fig. 4b. For both complexes, the conformation changes between S0 and T1 states are mainly induced by the rotation of cyclometalating ligands. Compared with complex Ir1, the higher RMSD value of complex Ir2 indicates that the existence of more structural distortions in molecules could induce faster non-radiative transitions, which fit well with the calculated spin density distributions of complex Ir2 and leads to a relatively lower PLQY and larger Knr. For complex Ir1, the better photophysical properties suggest its great potential as a dopant for blue electrophosphorescent devices.
 |
| | Fig. 4 The geometries and triplet spin-density distributions (TSDDs) of optimized T1 states (a) and structural comparisons between S0 (blue) and T1 states (pink) (b) for complexes Ir1 and Ir2. | |
Electrophosphorescence properties
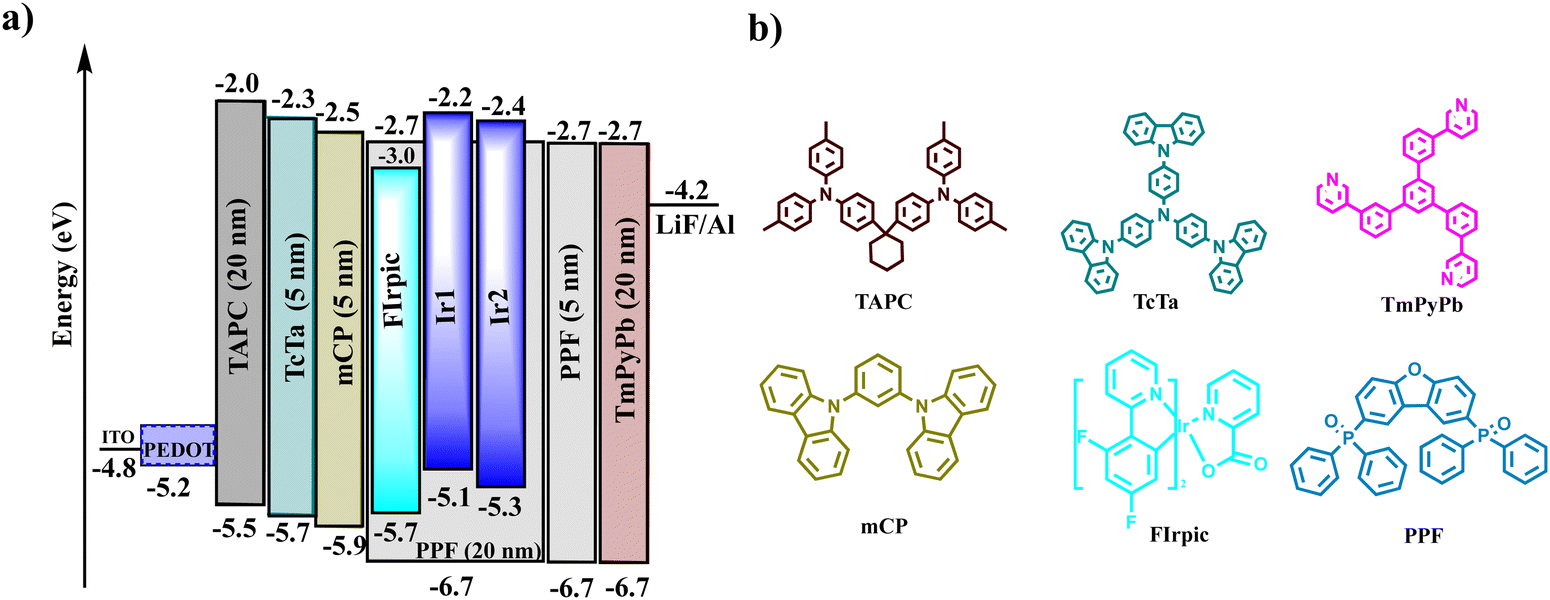
The electrophosphorescence of complexes Ir1 and Ir2 were studied by fabricating OLEDs by vacuum evaporation in the structure of ITO/PEDOT:PSS (40 nm)/1,1-bis[4-[N,N-di(ptolyl)amino]phenyl]cyclohexane (TAPC, 20 nm)/4,4′,4′′-tris(carbazol-9-yl)triphenylamine (TCTA, 5 nm)/1,3-di(9H-carbazol-9-yl)benzene (mCP, 5 nm)/dibenzo[b,d]furan-2,8-diylbis(diphenylphosphine oxide) (PPF):complex (5 wt%, 20 nm)/PPF (5 nm)/1,3,5-tri(m-pyrid-3-yl-phenyl)benzene (TmPyPB, 40 nm)/LiF (1 nm)/Al (200 nm). The chemical structures and HOMO and LUMO energy levels of the materials used in the devices are presented in Fig. 5. Indium tin oxide (ITO) and LiF/Al were used as the anode and the cathode, respectively; TAPC and TmPyPB acted as the hole transporting and electron-transporting layers, respectively; TCTA as the electron-blocking layer and mCP as the exciton blocking layer based on its moderate hole transporting properties and high T1 (2.9 eV) level. In particular, PPF was selected as the host and exciton blocking material to prevent exciton quenching because of its high T1 level. The doping concentration of Ir1 and Ir2 (devices D1 and D2) was chosen as 5 wt% in the PPF host after optimization. For comparison, the typical FIrpic was also used as the doped emitter to fabricate the device (D3) with an identical device structure.
 |
| | Fig. 5 Device configuration and energy level diagrams (a) and chemical structures of the materials used in the devices (b). | |
The EL spectra, current density–voltage–brightness (J–V–B) characteristics, and efficiency curves of complexes Ir1 and Ir2 based devices D1 and D2 are shown in Fig. 6, and these curves of the reference device D3 are shown in Fig. S4 in the ESI.† All the EL data are summarized in Table 3. As shown by the EL spectra in Fig. 6a, Ir1 and Ir2 exhibited blue emission with the peaks at 462 and 465 nm, which are blue-shifted by 7–10 nm relative to that of FIrpic (ELpeak = 472, 497 nm) (Fig. S4, ESI†). Moreover, both devices exhibited narrow EL spectra with a full width at half maximum (FWHMs) of 64–67 nm and the CIE coordinates of (0.16. 0.20) and (0.16, 0.21), which are slightly blue shifted in comparison with the FIrpic device with CIE coordinates of (0.16, 0.33). As observed in Fig. 6a, devices D1 and D2 based on Ir1 and Ir2 showed the expected single-peak EL spectra, which are almost identical to the PL spectra profiles in solutions (Fig. 3a), demonstrating that the electroluminescence of these devices originates from the luminescence of both complexes. As shown by the J–V–B characteristics in Fig. 6b, both devices D1 and D2 exhibited high electroluminescence performances. The OLEDs based on complexes Ir1 and Ir2 exhibited turn-on voltages (the voltage to deliver a brightness of 1 cd m−2) of 3.1 and 4.4 V. Device D1 exhibited a maximum luminance (Lmax) of 12040 cd m−2, which is much higher than those of devices D2 (4350 cd m−2) and D3 (10692 cd m−2). This may contribute to the dfdmappy cyclometalating ligand in complex Ir1, which could be favorable for more balanced and efficient charge carrier recombination in the EMLs. Impressively, the maximum current efficiency (CE, ηc) and power efficiency (PE, ηp) of device D1 were 44.0 cd A−1 and 42.0 lm W−1, corresponding to a maximum external quantum efficiency (EQEmax) of 28.0%. This EQEmax of Ir1 based device is not only almost double that (16.4%) of Ir2 device, but also 1.43 times higher than that of the FIrpic based reference device D3 (41.9 cd A−1, 35.2 lm W−1 and 19.6%). For complex Ir1, the EQEmax is even higher than or at least comparable to those of the most efficient doped blue OLEDs with a similar CIEy coordinate of ≈ 0.2, as shown in Table S4 (ESI†). The largely improved device performances for complex Ir1 should be attributed to the higher PLQY and better tailored excited states compared to the typical blue FIrpic. It is important to note that device D2 shows a lower current efficiency (25.1 cd A−1) and EQEmax (16.4%) than those of device D1, which should be closely associated with the lower PLQY (61%) of complex Ir2 (Table 2). For blue or deep blue phosphorescent OLEDs, serious efficiency roll-off at higher currents are usually observed.32,33 However, at the brightness of 100 and 1000 cd m−2, the efficiency of device D1 still remains as high as 25.5% and 21%, respectively, which are still comparable to the best reported values at 1000 cd m−2 for the doped blue OLEDs with a CIEy coordinate of ≈ 0.2 (Table S4, ESI†).24,34,35 The low efficiency roll-off should be credited to the shorter excited state lifetime of iridium phosphor Ir1 (1.1 μs), which definitely alleviates the triplet–triplet annihilation (TTA) or other exciton quenching processes in device D1.
 |
| | Fig. 6 The performance of devices based on complexes Ir1 and Ir2: (a) EL spectra, (b) current density–voltage–brightness (J–V–B) characteristics, and (c) CE and PE vs luminance curves and (d) EQE-luminance curves. | |
Table 3 EL performances of the Ir1 and Ir2 based OLEDs and the FIrpic based reference device
| Complex |
V
on
(V) |
L
max
(cd m−2) |
η
c (cd A−1) |
η
p (lm W−1) |
EQEc (%) |
λ
EL (nm) |
CIE (x, y) |
|
Turn-on voltage.
Maximum brightness.
In the order of maximum and then values at 100 and 1000 cd m−2.
|
|
FIrpic
|
3.4 |
10692 |
41.9 |
35.2 |
19.6/19.4/16.1 |
(472, 497) |
(0.16, 0.33) |
|
Ir1
|
3.1 |
12040 |
44.0 |
42.0 |
28.0/25.5/21.0 |
462 |
(0.16, 0.21) |
|
Ir2
|
4.4 |
4350 |
25.1 |
17.9 |
16.4/11.3/7.2 |
465 |
(0.16, 0.20) |
These desirable high EL properties together with the emission characteristics aforementioned further unveil the feasibility for developing high-performance blue phosphorescent complexes with desirable color purity and high EQEmax, e.g., tuning the triplet states excitation character by employing strong electron-donating groups on cyclometalating ligands or strong-field ligands to achieve CT states (i.e.3MLCT/3LLCT) dominated emission.
Conclusions
In summary, two sky-blue heteroleptic cyclometalated iridium(III) complexes have been developed, which resulted in high-performance blue OLEDs with a maximum EQE of 28.0% and CIE coordinates of (0.16, 0.21). Two molecular design strategies, i.e. incorporating the electron-donating dimethylamino group on the N-coordinating ring of the cyclometalating ligands and utilizing the high field-strength carbene ancillary ligand, were emphasized, which not only destabilized the non-radiative d–d* state and thus led to a high PLQY of up to 90%, but also realized CT state dominated emission and finally resulted in single-peak emission and improved blue color purity. An EQE of 28.0% is higher than or comparable to those of the most efficient blue phosphorescent OLEDs with a similar CIEy coordinate of ≈ 0.2 reported so far. Both the efficiencies and blue color purity of present iridium phosphors are much better than the famous sky-blue FIrpic as well. Furthermore, the present iridium phosphor exhibited low efficiency roll-off with high efficiencies of 25.5% and 21% at high brightness of 100 and 1000 cd m−2, indicating high efficiency stabilities. Considering their excellent color purity, short lifetimes, high efficiency and good stabilities, these iridium complexes may find practical applications as efficient blue emitters in OLED displays and lighting.
Experimental
General information and methods
The absorption and low temperature phosphorescence spectra were recorded using a PerkinElmer Lambda 650 spectrometer and a Hitachi F-7000 fluorescence spectrometer, respectively. The photoluminescence quantum yields (PLQY) of the related doped films were measured using a HAMAMATSU absolute PL quantum yield spectrometer (C11347). The photoluminescence (PL) spectra and transient fluorescence decays were obtained using an Edinburgh Instruments FLS1000 spectrometer. Cyclic voltammetry (CV) curves were recorded using an CHI610E electrochemical workstation in CH2Cl2 solution (10−3 M) for an anodic scan using a glass-carbon working electrode, a saturated calomel electrode (SCE) reference electrode and a Pt wire counter electrode.
Computational details
The ground state geometrical optimizations and single point energy calculations were carried out using the universally applicable B3LYP functional theory with the 6-31G(d) basis set used for C, H, F and N atoms and an effective core potential (ECP) with the LanL2DZ basis set for Ir atoms. The excited state characters of both complexes were calculated by the TD-DFT method at the CAM-B3LYP level based on the ground-state geometries. The excited state character analyses were performed using the Multiwfn program.36 Root-mean-square-deviation (RMSD) calculations were carried out by VMD (version 1.9.3).37
OLED fabrication and measurements
ITO glass substrates with a certain resistance were cleaned using detergents, and treated with ultraviolet ozone for 30 min. Then the PEDOT:PSS layers were deposited onto the ITO substrates at a speed of 2000 rpm for 1 min and heated at 120 °C for 15 minutes in air. The ITO glass substrates were then transferred into a vacuum chamber, where functional materials were evaporated at a pressure below 1 × 10⁻⁴ Pa. Each device shows an effective area of 3.0 × 3.0 mm2. The current density–voltage–brightness (J–V–B) characteristics and electroluminescence (EL) spectra were recorded using a Keithley 236 semiconductor system and a PR705 spectrophotometer, respectively. All the relevant device measurements were implemented in ambient air without further encapsulations.
Conflicts of interest
There are no conflicts of interest to declare.
Acknowledgements
We thank the National Natural Science Foundation of China (22078051 and U1801258), the Fundamental Research Fundamental Funds for the Central Universities (DUT22LAB610), and the Open Fund of the State Key Laboratory of Luminescent Materials and Devices (South China University of Technology, 2021-skllmd-03) for financial support of this work.
References
- D. L. Ma, S. Lin, W. Wang, C. Yang and C. H. Leung, Chem. Sci., 2017, 8, 878–889 RSC.
- W. W. Chan, S. Glotzer, Y. Gogotsi, J. H. Hafner, P. T. Hammond, M. C. Hersam, A. Javey, C. R. Kagan, A. Khademhosseini, N. A. Kotov, S. T. Lee, H. Mohwald, P. A. Mulvaney, A. E. Nel, P. J. Nordlander, W. J. Parak, R. M. Penner, A. L. Rogach, R. E. Schaak, M. M. Stevens, A. T. Wee, C. G. Willson, H. L. Tierney and P. S. Weiss, ACS Nano, 2015, 9, 11503–11505 CrossRef CAS PubMed.
- P. Tao, X. Lü, G. Zhou and W.-Y. Wong, Acc. Mater. Res., 2022, 3, 830–842 CrossRef CAS.
- N. Sinha, B. Pfund, C. Wegeberg, A. Prescimone and O. S. Wenger, J. Am. Chem. Soc., 2022, 144, 9859–9873 CrossRef CAS PubMed.
- M.-X. Mao, S. Xing, Y.-P. Zhang, Z.-Z. Qu, L. Yuan, J.-J. Hu, X.-J. Liao, Y. Zhao and Y.-X. Zheng, J. Mater. Chem. C, 2022, 10, 8650–8656 RSC.
- J. C. Bawden, P. S. Francis, S. DiLuzio, D. J. Hayne, E. H. Doeven, J. Truong, R. Alexander, L. C. Henderson, D. E. Gomez, M. Massi, B. I. Armstrong, F. A. Draper, S. Bernhard and T. U. Connell, J. Am. Chem. Soc., 2022, 144, 11189–11202 CrossRef CAS PubMed.
- X. Wang, J. Kuang, P. Wu, Z. Zong, Z. Li, H. Wang, J. Li, P. Dai, K. Y. Zhang, S. Liu, W. Huang and Q. Zhao, Adv. Mater., 2022, 34, e2107013 CrossRef PubMed.
- S. Haneder, E. Da Como, J. Feldmann, J. M. Lupton, C. Lennartz, P. Erk, E. Fuchs, O. Molt, I. Münster, C. Schildknecht and G. Wagenblast, Adv. Mater., 2008, 20, 3325–3330 CrossRef CAS.
- L. He, Z. Wang, L. Duan, C. Yang, R. Tang, X. Song and C. Pan, Dalton Trans., 2016, 45, 5604–5613 RSC.
- Z. Zhao, G. Yu, Q. Chang, X. Liu, Y. Liu, L. Wang, Z. Liu, Z. Bian, W. Liu and C. Huang, J. Mater. Chem. C, 2017, 5, 7344–7351 RSC.
- F. Wang, D. Liu, J. Li and M. Ma, ACS Appl. Mater. Interfaces, 2017, 9, 37888–37897 CrossRef CAS PubMed.
- F. Wang, D. Liu, J. Li and M. Ma, Adv. Funct. Mater., 2018, 28, 1803193 CrossRef.
- B. J. Powell, Coord. Chem. Rev., 2015, 295, 46–79 CrossRef CAS.
- H. Shin, Y. H. Ha, H. G. Kim, R. Kim, S. K. Kwon, Y. H. Kim and J. J. Kim, Adv. Mater., 2019, 31, e1808102 CrossRef PubMed.
- L. He, Y. Lan, D. Ma, X. Song and L. Duan, J. Mater. Chem. C, 2018, 6, 1509–1520 RSC.
- L. Zeng, B. Yang, D. Liu, H. Ni, H. Wang, K. Luo, W. Yu, W. Zhu and C. Yang, Dyes Pigm., 2020, 180, 108514 CrossRef CAS.
- J. Kang, R. Zaen, J. H. Lee, H. Hwang, K.-M. Park, S. C. Kim, J. Y. Lee and Y. Kang, Chem. Eng. J., 2022, 431, 134249 CrossRef CAS.
- J. Lee, H. F. Chen, T. Batagoda, C. Coburn, P. I. Djurovich, M. E. Thompson and S. R. Forrest, Nat. Mater., 2016, 15, 92–98 CrossRef CAS PubMed.
- A. K. Pal, S. Krotkus, M. Fontani, C. F. R. Mackenzie, D. B. Cordes, A. M. Z. Slawin, I. D. W. Samuel and E. Zysman-Colman, Adv. Mater., 2018, 30, e1804231 CrossRef PubMed.
- M. Du, Y. Wang, J. Wang, S. Chen, Z. Wang, S. Wang, F. Bai, Y. Liu and Y. Wang, J. Mater. Chem. C, 2019, 7, 5579–5583 RSC.
- M. Zhang, S. W. Zhang, C. Wu, W. Li, Y. Wu, C. Yang, Z. Meng, W. Xu, M. C. Tang, R. Xie, H. Meng and G. Wei, ACS Appl. Mater. Interfaces, 2022, 14, 1546–1556 CrossRef CAS PubMed.
- X. Li, J. Zhang, Z. Zhao, L. Wang, H. Yang, Q. Chang, N. Jiang, Z. Liu, Z. Bian, W. Liu, Z. Lu and C. Huang, Adv. Mater., 2018, 30, e1705005 CrossRef PubMed.
- R. Zaen, K. M. Park, K. H. Lee, J. Y. Lee and Y. Kang, Adv. Opt. Mater., 2019, 7, 1901387 CrossRef CAS.
- J. Kang, K.-M. Park, K. H. Lee, J. Y. Lee and Y. Kang, Dyes Pigm., 2021, 190, 109334 CrossRef CAS.
- K. S. Bejoymohandas, A. Kumar, S. Varughese, E. Varathan, V. Subramanian and M. L. P. Reddy, J. Mater. Chem. C, 2015, 3, 7405–7420 RSC.
- Z. Chen, L. Wang, S. Su, X. Zheng, N. Zhu, C. L. Ho, S. Chen and W. Y. Wong, ACS Appl. Mater. Interfaces, 2017, 9, 40497–40502 CrossRef CAS PubMed.
- H. J. Park, J. N. Kim, H. J. Yoo, K. R. Wee, S. O. Kang, D. W. Cho and U. C. Yoon, J. Org. Chem., 2013, 78, 8054–8064 CrossRef CAS PubMed.
- Y. Zhou, W. Li, Y. Liu, L. Zeng, W. Su and M. Zhou, Dalton Trans., 2012, 41, 9373–9381 RSC.
- T. Sajoto, P. I. Djurovich, A. Tamayo, M. Yousufuddin, R. Bau, M. E. Thompson, R. J. Holmes and S. R. Forrest, Inorg. Chem., 2005, 44, 7992–8003 CrossRef CAS PubMed.
- A. F. Henwood and E. Zysman-Colman, Top. Curr. Chem., 2016, 374, 36 CrossRef PubMed.
- M. Chen, S. Wang, X. Song and L. He, J. Phys. Chem. C, 2018, 122, 28256–28264 CrossRef CAS.
- H. H. Kuo, Y. T. Chen, L. R. Devereux, C. C. Wu, M. A. Fox, C. Y. Kuei, Y. Chi and G. H. Lee, Adv. Mater., 2017, 29, 1702464 CrossRef PubMed.
- W. Cheng, L.-D. Wang, Y.-Y. Zhou, Z.-Q. Bian, B.-H. Tong, Z.-W. Liu and S. Wang, Dyes Pigm., 2020, 177, 108257 CrossRef CAS.
- Z. Chen, S. Suramitr, N. Zhu, C.-L. Ho, S. Hannongbua, S. Chen and W.-Y. Wong, J. Mater. Chem. C, 2020, 8, 2551–2557 RSC.
- Y. Wu, C. Yang, J. Liu, M. Zhang, W. Liu, W. Li, C. Wu, G. Cheng, Q. Yang, G. Wei and C. M. Che, Chem. Sci., 2021, 12, 10165–10178 RSC.
- T. Lu and F. Chen, J. Comput. Chem., 2012, 33, 580–592 CrossRef CAS PubMed.
- W. Humphrey, A. Dalke and K. Schulten, J. Mol. Graphics, 1996, 14, 33–38 CrossRef CAS PubMed.
|
| This journal is © The Royal Society of Chemistry 2022 |
Click here to see how this site uses Cookies. View our privacy policy here. 
 *ab,
Jiuyan
Li
*ab,
Jiuyan
Li