 Open Access Article
The structural evolution, optical gap, and thermoelectric properties of the RbPb2Br5 layered halide, prepared by mechanochemistry†
Carmen
Abia
ab,
Carlos A.
López
 ac,
Javier
Gainza
 a,
João Elias F. S.
Rodrigues
 ad,
Mateus M.
Ferrer
e,
N. M.
Nemes
 af,
Oscar J.
Dura
 g,
José L.
Martínez
 a,
María T.
Fernández-Díaz
b,
Consuelo
Álvarez-Galván
 h,
Gergely
Németh
i,
Katalin
Kamarás
i,
François
Fauth
 j and
José A.
Alonso
 *a
*a
aInstituto de Ciencia de Materiales de Madrid, CSIC, Cantoblanco, 28049 Madrid, Spain. E-mail: ja.alonso@icmm.csic.es; calopez@unsl.edu.ar
bInstitut Laue Langevin, BP 156X, F-38042 Grenoble, France
cInstituto de Investigación en Tecnología Química (UNSL-CONICET) and Facultad de Química, Bioquímica y Farmacia, Almirante Brown 1455, (5700) San Luis, Argentina
dEuropean Synchrotron Radiation Facility (ESRF), 71 Avenue des Martyrs, 38000 Grenoble, France
eCCAF, PPGCEM/CDTec, Federal University of Pelotas, 96010-610 Pelotas, Rio Grande do Sul, Brazil
fDepartamento de Física de Materiales, Universidad Complutense de Madrid, E-28040 Madrid, Spain
gDepartamento de Física Aplicada, Universidad de Castilla-La Mancha, Ciudad Real, E-13071, Spain
hInstituto de Catálisis y Petroleoquímica, CSIC, Cantoblanco, 28049 Madrid, Spain
iInstitute for Solid State Physics and Optics, Wigner Research Centre for Physics, P. O. Box 49, Budapest, H-1525, Hungary
jCELLS–ALBA synchrotron Light Facility, Cerdanyola del Valles, Barcelona, E-08290, Spain
First published on 30th March 2022
Abstract
Rubidium di-lead pentabromide, RbPb2Br5, belongs to a family of layered lead-containing halides, with the common formula APb2X5 (where A = K, Rb, Cs; X = Cl, Br). The optical properties of RbPb2Br5 and rare-earth doped specimens are promising as low-phonon energy materials for tunable middle infrared and long-wavelength infrared laser sources, with suitable stability and resistance to wet conditions. In contrast to CsPb2Br5, the Rb counterpart has been barely studied and deserves further attention. Up to now, there have been no experimental reports on the transport properties such as the electronic conductivity, Seebeck coefficient or thermal transport. We describe here that this material can be prepared by ball milling in a straightforward way, yielding specimens with superior crystallinity. A structural investigation using synchrotron X-ray powder diffraction (SXRD) data combined with neutron powder diffraction (NPD) in a wide temperature range, from 15 to 573 K, was essential to evaluate the thermal evolution and to determine the Debye constants, yielding information on the relative Rb–Br and Pb–Br chemical bonds. In combination with DSC and TG measurements, no phase transitions were observed. Furthermore, an analysis of SXRD and NPD data (XRD-NPD) at room temperature reveals the directions of electron lone pair of Pb2+ ions lead atoms: its stereochemical effect is obvious in the [PbBr8] octahedral distortions. Diffuse reflectance UV-Vis spectroscopy yields an optical gap of 3.36 eV, close to that determined for a single-crystal material. Photoluminescence measurements indicate a lack of overlap between the excitation and emission spectra, due to the considerable Stokes shift, which prohibits self-absorption and thus enables applications in photovoltaics and biomedicine. The experimental information about the chemical bonds and band gap was studied via first-principles calculations. A maximum positive Seebeck coefficient of 3![[thin space (1/6-em)]](https://www.rsc.org/images/entities/char_2009.gif) 200 μV K−1 is obtained at 560 K, which is one order of magnitude higher than those reported for other halide perovskites.
200 μV K−1 is obtained at 560 K, which is one order of magnitude higher than those reported for other halide perovskites.
Introduction
Since 2012, hybrid halide perovskites containing both organic and inorganic cations have attracted attention for photovoltaic applications in view of their high power conversion efficiency, which reaches values above 22%, close to silicon-based solar cells.1 However, totally inorganic perovskite derivatives also depict interesting optical properties with a great potential for solar cell applications; it is the case of the cubic CsPbI3, due to its narrow bandgap of 1.73 eV.2 Such compounds are less sensitive to ambient oxygen and water, yet have a high fluorescence quantum yield. The main hindrance here for its widespread use resides on the difficult stabilization of the cubic α-CsPbI3 phase at room temperature, which undergoes a phase change to the undesirable orthorhombic (δ) phase (non-perovskite).3A recognized strategy to improve the stability in CsPbI3 concerns a partial or complete substitution of I by Br, which leads to a more stable orthorhombic CsPbBr3 perovskite.4–12 Bromide also acts by changing the bandgap according to its content. Such a perovskite shows a high and constant photoresponse, being also more stable than CsPbI3 to ambient atmosphere and humidity. However, CsPbBr3 presents a higher bandgap (2.3 eV), that would hinder its application in solar cell devices, although allowing its use in optoelectronic systems.13
Very recently, interesting alternative strategies have been developed to achieve higher photoefficiencies in these halide perovskites, which include structural ordering and different topologies for the octahedral arrangements in the case of Cs3Bi2Br914–19 and CsPb2Br5.20–24 From a topological view, the former has 0D dimensionality (i.e. no connection between octahedra) and the latter a 2D one, instead of the classical 3D arrangement of CsPbBr3 with corner-sharing [PbBr6] units. Cs3Bi2Br9 exhibits good stability, while CsPb2Br5 has added interest due to its layered structure for thin film fabrication and application in photovoltaic devices.24–26
Rubidium di-lead pentabromide, RbPb2Br5, belongs to this fascinating family of layered lead-containing halides, with the common formula APb2X5 (where A = K, Rb, Cs; X = Cl, Br). The crystal growth and emission properties of RbPb2Br5 were described in the nineties,27 and the electronic structure and optical properties were estimated more recently,28 finding this halide and rare-earth doped specimens to be promising as low-phonon energy materials for tunable middle infrared (mid-IR) and long-wavelength infrared (long-wave-IR) laser sources for remote sensing and other applications.29,30 In contrast to CsPb2Br5, the Rb counterpart has been barely studied and it deserves further attention. Despite the mentioned antecedents, up to now there are no experimental reports on the transport properties such as the electronic conductivity, Seebeck coefficient or thermal transport.
In this work, we have succeeded in the synthesis of a well-crystallized RbPb2Br5 specimen using a solvent-free mechano-chemical method, enabling an accurate structural study from synchrotron X-ray diffraction (SXRD) and neutron powder diffraction (NPD) in a wide temperature range. RbPb2Br5 is tetragonal, defined in the space group I4/mcm (#140),31 and does not experience any phase transition below the melting point.32 In this paper, we derive the Debye temperatures from the atomic displacement factors, yielding interesting trends for the relative strength of Rb–Br vs. Pb–Br chemical bonds, complemented by DFT-based calculations. An optical gap of 3.36 eV is determined from UV-Vis spectra. The characterization of this ball-milled specimen is complemented by DSC measurements and scanning microscopy. Transport properties reveal a Seebeck coefficient of 13![[thin space (1/6-em)]](https://www.rsc.org/images/entities/char_2009.gif) 000 μV K−1 at 440 K.
000 μV K−1 at 440 K.
Experimental methods
RbPb2Br5 was synthesized in the polycrystalline form by mechano-chemical synthesis (ball milling) from stoichiometric amounts of PbBr2 and RbBr. The total mass of reactants was 1.5 g, which were weighed and mixed with 20 zirconia balls (5 mm diameter) in a N2-filled glove-box. The reaction was carried out in a Retsch PM100 mill for 4 h at 450 rpm, in a sealed zirconia-lined jar in an N2 atmosphere. Laboratory XRD patterns were collected in a Bruker D5 diffractometer with Cu-Kα (λ = 1.5418 Å) radiation. The thermal evolution of the crystallographic structure was studied by SXRD, at room temperature (30 °C) and above (100, 200, 300, 400, and 500 °C). SXRD patterns were collected in high angular resolution mode (the so-called MAD set-up) on the MSPD diffractometer in an ALBA synchrotron in Barcelona, Spain, selecting an incident beam with 38 keV energy, λ = 0.325760 Å.33 The sample was contained in a 0.5 mm diameter quartz capillary that was rotating during the data acquisition. NPD patterns were sequentially collected using a D20 instrument, a high-flux diffractometer in the ILL reactor (Grenoble) with a wavelength of 1.540 Å, in the 15–396 K temperature interval, with a 5 K step and 30 min collection time for each diagram. NPD and SXRD patterns were analyzed using the Rietveld method using the FullProf program.34,35 Differential scanning calorimetry (DSC) measurements were carried out in the range 130 K to 520 K in a Mettler TA3000 system equipped with a DSC-30 unit. The heating and cooling rates were 10 K min−1, using about 70 mg of sample in each run. Field-effect Scanning Electron Microscopy (FE-SEM) images were obtained on a FEI-Nova microscope, with an acceleration potential of 5 kV, coupled to an energy-dispersive X-ray spectrometer (EDX), working at an acceleration voltage of 18 kV and 60 s of acquisition time. The optical diffuse reflectance spectrum was measured at room temperature using a UV-Vis spectrophotometer Varian Cary 5000. Photoluminescence spectra were measured on a HORIBA Jobin Yvon Fluorolog-3 spectrofluorometer (Nanolog). Solid powder samples were placed between two CaF2 plates and illuminated by a 450 W Xenon lamp at 45° incidence. The emission was detected using an R928P photomultiplier tube.The resulting powder obtained from ball milling was pressed into a pellet by hand using a cold press, while the sample was kept at room temperature throughout the whole process. The resistivity and thermal conductivity were measured in the pressed pellet, which was cut into a bar shape using a diamond saw to measure the Seebeck coefficient. The Seebeck coefficient was obtained by simultaneously measuring drop voltages across the sample and a constantan reference wire with an electrometer (Keithley 6517B) and nanovoltmeter (Keithley 2182A) under vacuum (10−3 mbar). Electrical conductivity measurements were carried out by using a HP 4284 LCR analyzer in the 20 Hz–1 MHz frequency range, with an applied ac voltage of 0.5 V. Electrodes were deposited on the pellet's flat surfaces by applying silver paste. The total thermal conductivity was calculated from the thermal diffusivity (α) using a Linseis LFA 1000 equipment, using the laser-flash technique. Both faces of the sample were covered with a thin graphite layer to ensure black body emissivity. The thermal conductivity (κ) was determined using κ = αcpd, where cp is the specific heat and d is the sample density.
Computational methods
A theoretical model based on Density Functional Theory (DFT) using the CRYSTAL17 package was performed to support the chemical environment of the system.36 The HSE06 hybrid functional was used since it generates similar results to the structural and electronic data of the experimental system.37 The atomic basis set was defined using Triple-Zeta valence with the polarization Gaussian basis (POB-TZVP) sets developed by Laun and co-workers.38 The Coulomb and exchange series in the CRYSTAL17 package is controlled by five thresholds (overlap and penetration for Coulomb integrals, the overlap for HF exchange integrals, and the pseudo-overlap), where the values defined for the calculations were 8, 8, 8, 8, and 16 (10−8, 10−8, 10−8, 10−8, and 10−16). The two shirking factors (Pack–Monkhorst method for the grid of k points and Gilat net for the sampling) were set to 6 and 6, respectively. In the structure optimization step, the gradient components and nuclear displacements were adjusted with tolerances on their root mean square of 0.0003 and 0.0012 a.u., respectively. The chemical environment was evaluated using “Quantum Theory: Atoms in Molecules” (QTAIM) using TOPOND, a program that is part of the crystal package.39Results and discussion
Initial characterization
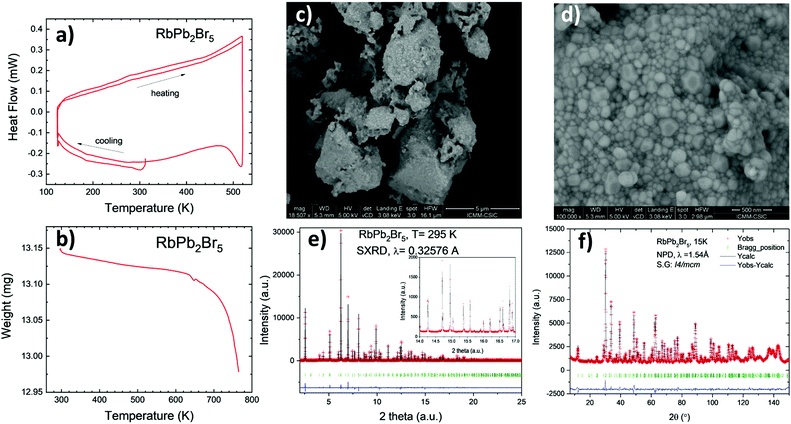
The sample was obtained as a white microcrystalline powder; the laboratory XRD pattern at room temperature exhibits a tetragonal symmetry, in agreement with previous reports, indexable in the space group I4/mcm. It belongs to the (NH4)Pb2Br5 structural type.40 The crystal structure was preliminary refined in this structural model from laboratory XRD data, as displayed in Fig. S1 (ESI†), obtaining as unit-cell parameters a = 8.4562(4) Å and c = 14.584(1) Å.Fig. 1a and b illustrate the DSC curves (in the heating and cooling runs) and the TG curve, respectively. No significant events are identified in the calorimetric curve in the 130–520 K temperature range, while the weight low above 600 °C indicated full decomposition of the sample, by Br loss.
Fig. 1c and d illustrates some FE-SEM images, giving insight into the microstructure of this product, synthesized by ball milling. An overall view with low magnification (18![[thin space (1/6-em)]](https://www.rsc.org/images/entities/char_2009.gif) 500×) shows irregular-shaped clusters of particles of different sizes (Fig. 1c). However, in a large magnification view (100
500×) shows irregular-shaped clusters of particles of different sizes (Fig. 1c). However, in a large magnification view (100![[thin space (1/6-em)]](https://www.rsc.org/images/entities/char_2009.gif) 000×), Fig. 1d unveils that they are indeed formed by tiny nano-particles of uneven form, with a typical size of 140–170 nm, which are grown during the ball milling process. EDX analysis coupled to the FE-SEM images yields an atomic composition close to 1
000×), Fig. 1d unveils that they are indeed formed by tiny nano-particles of uneven form, with a typical size of 140–170 nm, which are grown during the ball milling process. EDX analysis coupled to the FE-SEM images yields an atomic composition close to 1![[thin space (1/6-em)]](https://www.rsc.org/images/entities/char_2009.gif) :
:![[thin space (1/6-em)]](https://www.rsc.org/images/entities/char_2009.gif) 1
1![[thin space (1/6-em)]](https://www.rsc.org/images/entities/char_2009.gif) :
:![[thin space (1/6-em)]](https://www.rsc.org/images/entities/char_2009.gif) 3 for the Rb:Pb:I ratio. A typical EDX spectrum is included in Fig. S2 in the ESI;† other SEM images are included in Fig. S3 (ESI†).
3 for the Rb:Pb:I ratio. A typical EDX spectrum is included in Fig. S2 in the ESI;† other SEM images are included in Fig. S3 (ESI†).
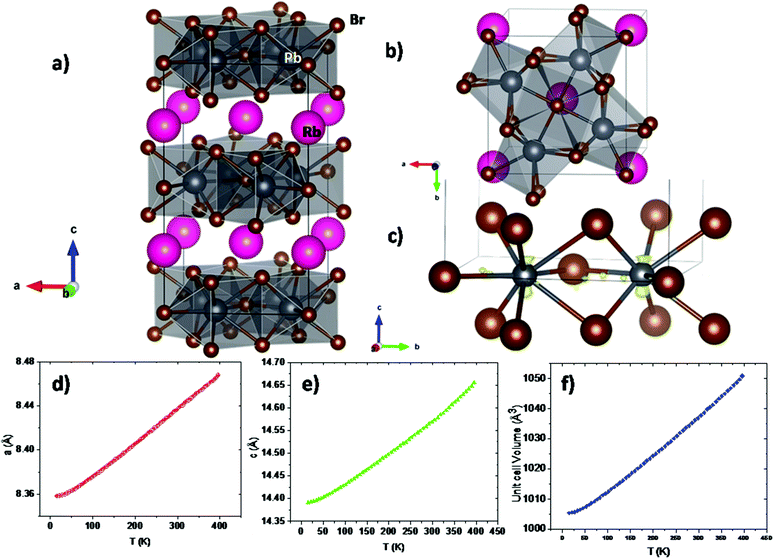
The synchrotron pattern collected at room temperature confirms the tetragonal symmetry in the I4/mcm space group (#140). The Rb1+ and Pb2+ ions are located in 4a (0,0,1/4) and 8h (x,x + 0.5,0) Wyckoff sites; Br1 and Br2, the two types of bromine, are located at 4c (0,0,0) and at 16l (x,y,z) respectively. The quality of the final refinement using this model is illustrated in Fig. 1e, and the main crystallographic results are listed in Table 1. Two views of the crystal structure are shown in Fig. 2a and b. The unit cell parameters refined at room temperature, of a = 8.44479(4) Å, c = 14.59265(7) Å, V = 1040.667(8) Å3, are comparable to those reported, a = 8.4455(1) Å, c = 14.5916(3) Å, V = 1040.77 Å3.40 The structure consists of layers of [PbBr8] polyhedra sharing edges and triangular faces, allowing for short Pb–Pb distances of 4.009(1) Å at RT across these faces. The layers are connected by Rb1+ ions, in ten-fold coordination with eight shorter (3.605(1) Å) and two longer (3.648 Å) Rb–Br bond lengths. In fact, the [PbBr8] polyhedra are strongly distorted, as derived from the stereochemical effect of the Pb2+ lone electron pair.
| Atom | x | y | z | U iso | Occ | |
|---|---|---|---|---|---|---|
R
p: 7.66%; Rwp: 9.29%; Rexp: 5.76%; χ2![[thin space (1/6-em)]](https://www.rsc.org/images/entities/char_2009.gif) : :![[thin space (1/6-em)]](https://www.rsc.org/images/entities/char_2009.gif) 2.72; RBragg: 5.15%. System: tetragonal, space group: I4/mcm, Z = 4. Unit-cell parameters: a = 8.44479(4) Å, c = 14.59265(7) Å and V = 1040.67(1) Å3. 2.72; RBragg: 5.15%. System: tetragonal, space group: I4/mcm, Z = 4. Unit-cell parameters: a = 8.44479(4) Å, c = 14.59265(7) Å and V = 1040.67(1) Å3. |
||||||
| Rb | 4a | 0.16783 (9) | 0.66783 (9) | 0 | 0.0290 (3) | 1 |
| Pb | 8h | 0 | 0 | 0.25 | 0.0333 (8) | 1 |
| Br1 | 4c | 0 | 0 | 0 | 0.0261 (8) | 1 |
| Br2 | 16l | 0.6557 (1) | 0.1557 (1) | 0.1351 (1) | 0.0301 (4) | 1 |
The crystal structure in the 15–396 K interval was additionally investigated from NPD data collected in the D20 diffractometer (ILL). No structural changes were observed, other than the expected thermal contraction of the unit-cell parameters upon cooling down the sample (Fig. 2d–f). The volume has a thermal expansion with temperature of 0.1198(12) Å3 K−1, while the a and c unit cell parameters increase as 2.93(2) × 10−4 Å K−1 and 6.85(8) × 10−4 Å K−1, respectively. The moderate absorption of neutrons by the heavy Rb and Pb atoms was suitable to study the thermal variation of the displacement factors in all the temperature range. The quality of the NPD Rietveld fit is illustrated for the 15 K pattern, included in Fig. 1f.
An analysis of SXRD and NPD data (XRD-NPD) was useful to obtain additional information about the electron lone pair of Pb2+ ions. This procedure uses the structural information refined from NPD data to perform difference Fourier syntheses using SXRD data, which contain information on the electron density in the crystal, as was reported earlier.41 The results are plotted in Fig. 2c, where the difference electron density is shown as a yellow isosurface. This picture reveals a non-negligible density up and down Pb2+ ions along the c-axis. We assume that the 6s2 electrons are delocalized between both c-axis directions. This delocalized character of the Pb2+ electron lobes does not yield a net polarization, in agreement with the centrosymmetric nature of the crystal structure.
Mean-square displacements
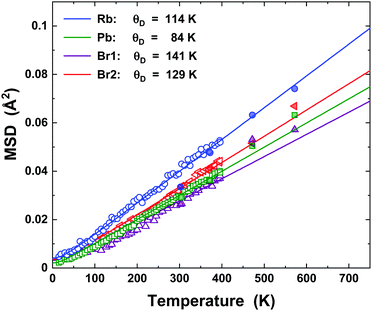
The mean-square displacements (MSDs) of the atomic species in RbPb2Br5 (Rb, Pb, Br1, and Br2) were derived as isotropic displacement parameters (Ueq, units of Å2) in the temperature range from 15 up to 573 K. The temperature dependence of the MSDs extracted from NPD (15–396 K) and SXRD (300–573 K) can be modelled in the framework of the Debye model,42,43i.e.where, dS2 concerns the intrinsic disorder, θD is the Debye temperature, m the atom's mass, kB the Boltzmann constant, ħ the reduced Planck constant, and T the absolute temperature. Rb showed an intrinsic disorder of ∼3.5 × 10⁻⁴ Å2, while such parameters were slightly below zero (∼10−4 Å2) for Pb, Br1, and Br2. Therefore, dS2 was fixed to zero for those elements. Fig. 3 depicts the temperature dependence of the MSDs for Rb, Pb, Br1, and Br2 and their respective fittings using the Debye model. From them, the Debye temperature values were derived, as follows: Rb (113 K), Pb (84 K), Br1 (141 K), and Br2 (129 K). The Debye temperature can provide information on the bonding stiffness by means of the harmonic one-particle potential OPP model,44,45 in which the harmonic potential depends on θ2D. Here, the force constant is evaluated by
where, k is the force constant in units of eV Å−2. The as-obtained k values are the following: 0.65(5) eV Å−2 for Rb, 0.86(3) eV Å−2 for Pb, 0.93(8) eV Å−2 for Br1, and 0.79(3) eV Å−2 for Br2. It means that the bonding nature of Rb–Br and Pb–Br are similar, but the latter one is slightly more rigid than the former one. It may indicate a tendency for a covalency in the Pb–Br bond pair. Based on the low values of Debye temperatures, typically below 150 K, RbPb2Br5 must have ultra-low values of thermal conductivity below 1 W m−1 K−1.
Topological analysis of the main Bond Critical Points (BCPs) of the theoretical model for RbPb2Br5 was performed in order to evaluate the above experimental estimates. The BCP parameters are listed in Table 2.
| Bond | Distance (Å) | ρ (×10−3) | ∇2ρ (×10−2) | G (×10−3) | V (×10−3) | H (×10−3) | |V|/G |
|---|---|---|---|---|---|---|---|
| Rb–Br | 3.68 | 6.20 | 2.22 | 4.36 | −3.17 | 1.19 | 0.73 |
| Pb–Br | 2.94 | 36.0 | 7.28 | 21.3 | −24.4 | −3.11 | 1.14 |
| Pb–Br | 3.16 | 22.1 | 4.94 | 12.5 | −12.7 | −0.20 | 1.02 |
| Pb–Br | 3.32 | 18.1 | 3.75 | 9.49 | −9.60 | −0.10 | 1.01 |
According to the parameters in Table 2, all the bonds present low values of ρ and positive values of ∇2ρ, which indicate a preponderant ionic character. On the other hand, the parameters between Rb–Br and Pb–Br bonds have some crucial differences. The H parameter of BCPs attributed to Rb–Br is positive, being negative for those attributed to the Pb–Br bonds. In addition, the |V|/G ratio of Rb–Br is less than 1, while in the Pb–Br BCPs it is greater than 1. These parameters of Pb–Br BCPs indicate that such bonds fall into a transient class showing a relevant covalent contribution.46 Therefore, the theoretical data exhibited a good agreement with the results obtained by Debye analysis, where the Rb–Br bond has a greater ionic character than the Pb–Br bond.
The Laplacian of the electronic density isolines at the (100) and (001) planes are depicted in Fig. 4. The bond Rb–Br along the (100) plane with isolines close to Rb atoms are very isolated, probably due to their predominant ionic character. The bond Pb–Br presented along the (001) plane has a distance of 3.16 Å. It is interesting to highlight the difference of the isoline profiles between Rb–Br and Pb–Br bonds. The isolines of Pb along the (001) plane show a certain entanglement degree with the Br isolines, which is due to the contribution of covalence of such bonds. It is important to make it clear that the assignment of covalence is a relative comparison with the Rb–Br bond, since both bonds have an ionic character.
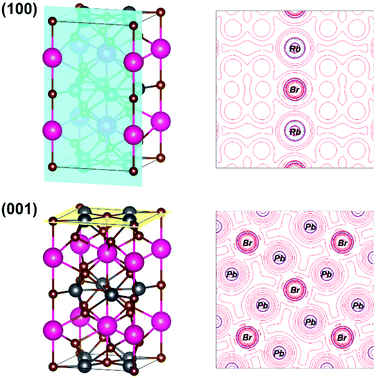 | ||
| Fig. 4 (100) and (001) planes and their respective Laplacians of electronic density (isolines) of the RbPb2Br5 halide model. | ||
Thermoelectric properties
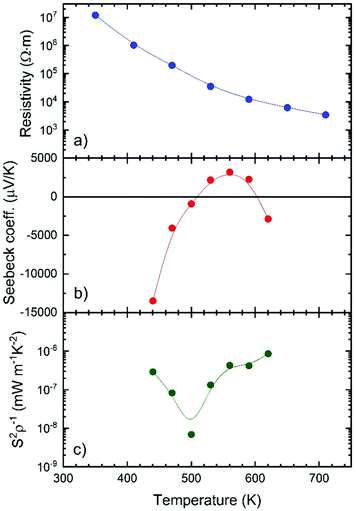
Fig. 5 shows the transport thermoelectric properties measured near room temperature: resistivity (Fig. 5a), Seebeck coefficient (Fig. 5b), and power factor (Fig. 5c). The resistivity is higher than 107 Ω m at 310 K, a really high value that is quite far from being competitive with other materials, such as some halide perovskites.47 However, this value is close to the ∼3.3 × 10⁶ Ω m resistivity reported for undoped MAPbBr3 single crystals.48 The resistivity also decreases with temperature, which is caused by the activation of minority carriers. The activation energy for the carriers in RbPb2Br5, calculated from the measured electrical conductivity, is 512 meV (Fig. S4, ESI†).The Seebeck coefficient strongly varies with temperature, adopting a negative value immediately above room temperature (e.g. −13![[thin space (1/6-em)]](https://www.rsc.org/images/entities/char_2009.gif) 000 μV K−1 at 440 K) and then changing its sign and reaching S = 3,200 μV K−1 at 560 K, and then becoming negative again at 620 K. The maximum positive value is about one order of magnitude higher than the Seebeck coefficients reported for other halide perovskites like CsSnBr3 and hybrid perovskites like MAPbBr3.47,48 Even these high Seebeck coefficient values are not enough to achieve a great power factor (S2σ), which remains low due to the high resistivity.
000 μV K−1 at 440 K) and then changing its sign and reaching S = 3,200 μV K−1 at 560 K, and then becoming negative again at 620 K. The maximum positive value is about one order of magnitude higher than the Seebeck coefficients reported for other halide perovskites like CsSnBr3 and hybrid perovskites like MAPbBr3.47,48 Even these high Seebeck coefficient values are not enough to achieve a great power factor (S2σ), which remains low due to the high resistivity.
The thermal conductivity κ (Fig. 6a) is, on the other hand, lower than that reported for other halide and hybrid perovskites,47,48 and remains always below 0.26 W m−1 K at all the measured temperatures, from 300 K up to 573 K. Such a value has intrinsic origin based on low Debye temperatures for Rb, Pb, and Br. We can combine these values in a zT figure of merit (Fig. 6b), defined as zT = S2σT/κ, that yields zT = 1 × 10⁻⁶ at 570 K, which is low compared with the state-of-the-art thermoelectric materials, but is comparable to other reported values for halide perovskites, like Bi-doped MAPbBr3, which shows a zT of 1.8 × 10⁻⁶ at 293 K.48
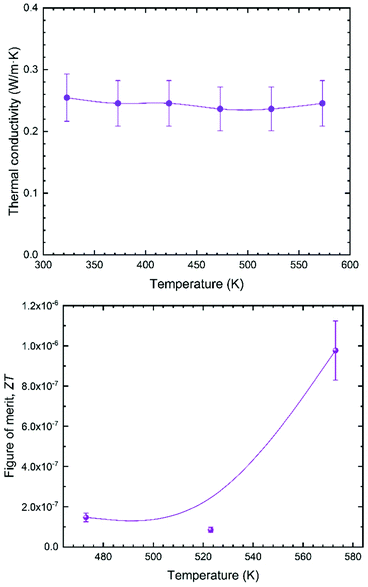 | ||
| Fig. 6 (a) Thermal conductivity of RbPb2Br5. (b) Thermoelectric figure of merit for the RbPb2Br5 halide, with a guiding curve to show its tendency. | ||
Optical gap by UV-Vis spectra and emission by photoluminescence spectra
The absorption capacity of the RbPb2Br5 powder was first investigated by diffuse reflectance UV/Vis spectroscopy. Fig. 7a depicts the optical absorption coefficient related to the Kubelka–Munk function [F(R) = (1 − R)2/2R, R being the reflectance versus wavelength in eV]. The band gap has been calculated by extrapolating the linear region to the abscissa. The value obtained for RbPb2Br5 (∼3.36 eV) is typical for this material, and close to those reported in the literature for a single crystal material, of 3.42–3.47 eV.49 The band structure and the density of states (DOS) of the RbPb2Br5 halide were evaluated from the theoretical model, as shown in Fig. S5a (ESI†). The band structure (a) shows an indirect transition N → Γ of 3.55 eV, a value close to the experimental band gap. The state contributions in each band is displayed in Fig. S5b (ESI†). The valence band is mainly constituted by the density of states related to Br atoms as well as the conduction band mainly by Pb states.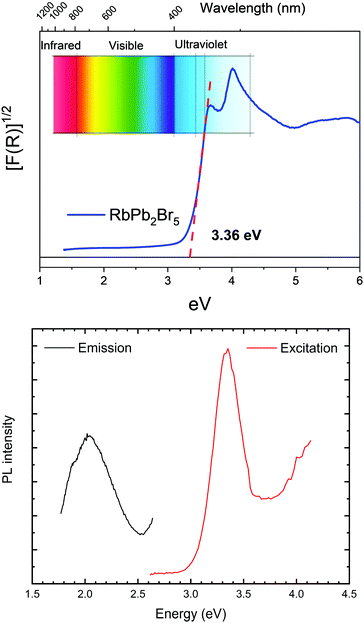 | ||
| Fig. 7 (a) Kubelka–Munk (KM) transformed diffuse reflectance spectrum of RbPb2Br5 halide. (b) Photoluminescence by emission and excitation. | ||
Afterwards, the emission spectrum was determined with 350 nm (3.54 eV, slightly above the band gap) excitation wavelength, obtaining maximum intensity at 600 nm (2.06 eV). The excitation spectrum was then measured by setting the detection monochromator to 600 nm and tuning the excitation wavelength between 300 and 500 nm. The excitation spectrum (red curve in Fig. 7b) follows the absorption determined by diffuse reflectance (Fig. 7a). The lack of overlap between the excitation and emission spectra (black curve in Fig. 7b), due to the considerable Stokes shift, prohibits self-absorption and thus enables applications in photovoltaics and biomedicine. A similar large Stokes shift was reported in RbSn2Br5.50
Conclusions
The RbPb2Br5 halide has been successfully prepared as a well-crystallized powder by mechano-chemical synthesis in an inert atmosphere. The crystal structure evolution has been revisited from high angular resolution SXRD and NPD data. The structure contains disported [PbBr8] polyhedra, where the lone electron pair of Pb2+ has been located using XRD and NPD techniques revealing that the 6s2 electrons are delocalized up and down of Pb2+ ions along the c-axis. The evolution of the displacement factors has been analysed in the framework of the Debye model, determining the Debye temperatures for the different atoms, as well as the relative stiffness of the Rb–Br vs. Pb–Br pair bonds, following the harmonic one-particle potential model. The bonding natures of Rb–Br and Pb–Br bonds are similar, but the Pb–Br bond is slightly more rigid than the former. It may indicate a tendency for a greater covalence in the Pb–Br bond pair. The thermoelectric properties are appealing, regarding a large Seebeck coefficient and a low thermal conductivity, although the large electrical resistivity leads to negligible figure of merit values. The optical band gap of 3.36 eV of this ball-milled specimen is similar to that reported for single crystal samples, being corroborated by ab initio calculations (indirect transition of 3.55 eV). The lack of overlap between the excitation and emission photoluminescence spectra enables applications in photovoltaics and biomedicine.Author contributions
C. A., J. E. F. S. R. and C. A. G. and prepared the sample; C. A., M. T. F. D., J. A. A. and C. A. L. collected and analysed the structural NPD data; J. A. A., C. A. L. and F. F. collected and analysed the SXRD data; J. G., N. M. N., O. J. D. and J. L. M. carried out the thermoelectric measurements; J. E. F. S. R. and M. M. F. performed the Debye analysis and ab initio calculations; C. A. G. carried out the optical measurements; G. N. and K. K. carried out photoluminescence measurements; all the authors participated in the discussion of results and redaction of the article.Conflicts of interest
There are no conflicts to declare.Acknowledgements
The Spanish Ministry of Science, Innovation and Universities supported this work through grant MAT2017-84496-R. The authors wish to express their gratitude to ALBA technical staff for making the facilities available for the Synchrotron X-ray powder diffraction experiment number 2020094572. J. G. thanks MICINN for granting the contract PRE2018-083398. C. A. is thankful for financial support from the Institut Laue-Langevin through the DA/SRH/GRI/AS/19-214 contract. G. N. and K. K. thank National Research, Development and Innovation Office of Hungary through Grant no. NKFIH FK-138411.References
- W. S. Yang, B.-W. Park, E. H. Jung, N. J. Jeon, Y. C. Kim, D. U. Lee, S. S. Shin, J. Seo, E. K. Kim, J. H. Noh and S. Il Seok, Science, 2017, 356, 1376–1379 CrossRef CAS PubMed.
- D. B. Straus, S. Guo and R. J. Cava, J. Am. Chem. Soc., 2019, 141, 11435–11439 CrossRef CAS PubMed.
- Z. Chen, L. Dong, H. Tang, Y. Yu, L. Ye and J. Zang, CrystEngComm, 2019, 21, 1389–1396 RSC.
- J. Peng, C. Q. Xia, Y. Xu, R. Li, L. Cui, J. K. Clegg, L. M. Herz, M. B. Johnston and Q. Lin, Nat. Commun., 2021, 12, 1531 CrossRef CAS PubMed.
- X. Li, W. Cai, H. Guan, S. Zhao, S. Cao, C. Chen, M. Liu and Z. Zang, Chem. Eng. J., 2021, 419, 129551 CrossRef CAS.
- L. Peng, A. Dutta, R. Xie, W. Yang and N. Pradhan, ACS Energy Lett., 2018, 3, 2014–2020 CrossRef CAS.
- B. J. Bohn, Y. Tong, M. Gramlich, M. L. Lai, M. Döblinger, K. Wang, R. L. Z. Hoye, P. Müller-Buschbaum, S. D. Stranks, A. S. Urban, L. Polavarapu and J. Feldmann, Nano Lett., 2018, 18, 5231–5238 CrossRef CAS PubMed.
- Y. Gao, L. Zhao, Q. Shang, Y. Zhong, Z. Liu, J. Chen, Z. Zhang, J. Shi, W. Du, Y. Zhang, S. Chen, P. Gao, X. Liu, X. Wang and Q. Zhang, Adv. Mater., 2018, 30, 1801805 CrossRef PubMed.
- J. Song, J. Li, L. Xu, J. Li, F. Zhang, B. Han, Q. Shan and H. Zeng, Adv. Mater., 2018, 30, 1800764 CrossRef PubMed.
- J. Duan, Y. Zhao, X. Yang, Y. Wang, B. He and Q. Tang, Adv. Energy Mater., 2018, 8, 1802346 CrossRef.
- Y. He, L. Matei, H. J. Jung, K. M. McCall, M. Chen, C. C. Stoumpos, Z. Liu, J. A. Peters, D. Y. Chung, B. W. Wessels, M. R. Wasielewski, V. P. Dravid, A. Burger and M. G. Kanatzidis, Nat. Commun., 2018, 9, 1609 CrossRef PubMed.
- C. A. López, C. Abia, M. C. Alvarez-Galván, B.-K. Hong, M. V. Martínez-Huerta, F. Serrano-Sánchez, F. Carrascoso, A. Castellanos-Gómez, M. T. Fernández-Díaz and J. A. Alonso, ACS Omega, 2020, 5, 5931–5938 CrossRef PubMed.
- P. Acharyya, K. Kundu and K. Biswas, Nanoscale, 2020, 12, 21094–21117 RSC.
- Y. Zhu, J. Zhu, H. Song, J. Huang, Z. Lu and G. Pan, J. Rare Earths, 2021, 39, 374–379 CrossRef CAS.
- Z. Ji, Y. Liu, W. Li, C. Zhao and W. Mai, Sci. Bull., 2020, 65, 1371–1379 CrossRef CAS.
- B. Yang and K. Han, Acc. Chem. Res., 2019, 52, 3188–3198 CrossRef CAS PubMed.
- M. Leng, Y. Yang, K. Zeng, Z. Chen, Z. Tan, S. Li, J. Li, B. Xu, D. Li, M. P. Hautzinger, Y. Fu, T. Zhai, L. Xu, G. Niu, S. Jin and J. Tang, Adv. Funct. Mater., 2018, 28, 1704446 CrossRef.
- B. Yang, J. Chen, F. Hong, X. Mao, K. Zheng, S. Yang, Y. Li, T. Pullerits, W. Deng and K. Han, Angew. Chem., Int. Ed., 2017, 56, 12471–12475 CrossRef CAS PubMed.
- C. W. M. Timmermans and G. Blasse, Phys. Status Solidi, 1981, 106, 647–655 CrossRef CAS.
- R. Wang, Z. Li, S. Li, P. Wang, J. Xiu, G. Wei, H. Liu, N. Jiang, Y. Liu and M. Zhong, ACS Appl. Mater. Interfaces, 2020, 12, 41919–41931 CrossRef CAS.
- Y.-Q. Zhou, J. Xu, J.-B. Liu and B.-X. Liu, J. Phys. Chem. Lett., 2019, 10, 6118–6123 CrossRef CAS PubMed.
- C. Wang, Y. Wang, X. Su, V. G. Hadjiev, S. Dai, Z. Qin, H. A. Calderon Benavides, Y. Ni, Q. Li, J. Jian, M. K. Alam, H. Wang, F. C. Robles Hernandez, Y. Yao, S. Chen, Q. Yu, G. Feng, Z. Wang and J. Bao, Adv. Mater., 2019, 31, 1902492 CrossRef PubMed.
- P. Acharyya, P. Pal, P. K. Samanta, A. Sarkar, S. K. Pati and K. Biswas, Nanoscale, 2019, 11, 4001–4007 RSC.
- J. Duan, Y. Zhao, B. He and Q. Tang, Angew. Chem., 2018, 130, 3849–3853 CrossRef.
- G. Tong, T. Chen, H. Li, W. Song, Y. Chang, J. Liu, L. Yu, J. Xu, Y. Qi and Y. Jiang, Sol. RRL, 2019, 3, 1900030 CrossRef.
- X. Tang, S. Han, Z. Zu, W. Hu, D. Zhou, J. Du, Z. Hu, S. Li and Z. Zang, Front. Phys., 2017, 5, 69 CrossRef.
- K. Nitsch, V. Hamplová, M. Nikl, K. Polák and M. Rodová, Chem. Phys. Lett., 1996, 258, 518–522 CrossRef CAS.
- A. A. Lavrentyev, B. V. Gabrelian, V. T. Vu, N. M. Denysyuk, P. N. Shkumat, A. Y. Tarasova, L. I. Isaenko and O. Y. Khyzhun, J. Phys. Chem. Solids, 2016, 91, 25–33 CrossRef CAS.
- K. Rademaker, E. Heumann, G. Huber, S. A. Payne, W. F. Krupke, L. I. Isaenko and A. Burger, Opt. Lett., 2005, 30, 729 CrossRef CAS PubMed.
- K. Rademaker, W. F. Krupke, R. H. Page, S. A. Payne, K. Petermann, G. Huber, A. P. Yelisseyev, L. I. Isaenko, U. N. Roy, A. Burger, K. C. Mandal and K. Nitsch, J. Opt. Soc. Am. B, 2004, 21, 2117 CrossRef CAS.
- O. Nazarenko, M. R. Kotyrba, M. Wörle, E. Cuervo-Reyes, S. Yakunin and M. V. Kovalenko, Inorg. Chem., 2017, 56, 11552–11564 CrossRef CAS PubMed.
- S. V. Mel’nikova, L. I. Isaenko, V. M. Pashkov and I. V. Pevnev, Phys. Solid State, 2006, 48, 2152–2156 CrossRef.
- F. Fauth, R. Boer, F. Gil-Ortiz, C. Popescu, O. Vallcorba, I. Peral, D. Fullà, J. Benach and J. Juanhuix, Eur. Phys. J. Plus, 2015, 130, 160 CrossRef.
- H. M. Rietveld, J. Appl. Crystallogr., 1969, 2, 65–71 CrossRef CAS.
- J. Rodríguez-Carvajal, Phys. B, 1993, 192, 55–69 CrossRef.
- R. Dovesi, A. Erba, R. Orlando, C. M. Zicovich-Wilson, B. Civalleri, L. Maschio, M. Rérat, S. Casassa, J. Baima, S. Salustro and B. Kirtman, Wiley Interdiscip. Rev.: Comput. Mol. Sci., 2018, 8, e1360 Search PubMed.
- A. V. Krukau, O. A. Vydrov, A. F. Izmaylov and G. E. Scuseria, J. Chem. Phys., 2006, 125, 224106 CrossRef PubMed.
- J. Laun, D. Vilela Oliveira and T. Bredow, J. Comput. Chem., 2018, 39, 1285–1290 CrossRef CAS PubMed.
- S. Casassa, A. Erba, J. Baima and R. Orlando, J. Comput. Chem., 2015, 36, 1940–1946 CAS.
- D. Becker and H. P. Beck, Z. Anorg. Allg. Chem., 2004, 630, 1924–1932 CrossRef CAS.
- C. A. López, E. Bâati, M. T. Fernández-Díaz, F. O. Saouma, J. I. Jang and J. A. Alonso, J. Solid State Chem., 2019, 276, 122–127 CrossRef.
- J. L. Feldman and G. K. Horton, Phys. Rev., 1963, 132, 644–647 CrossRef CAS.
- J.-L. Mi, M. Christensen, E. Nishibori and B. B. Iversen, Phys. Rev. B: Condens. Matter Mater. Phys., 2011, 84, 064114 CrossRef.
- B. T. M. Willis and A. W. Pryor, Thermal Vibrations in Crystallography, Cambridge University Press, 1975, vol. 50 Search PubMed.
- A. Nakatsuka, A. Yoshiasa, K. Fujiwara and O. Ohtaka, J. Mineral. Petrol. Sci., 2018, 113, 280–285 CrossRef CAS.
- C. Gatti, V. R. Saunders and C. Roetti, J. Chem. Phys., 1994, 101, 10686–10696 CrossRef CAS.
- H. Xie, S. Hao, J. Bao, T. J. Slade, G. J. Snyder, C. Wolverton and M. G. Kanatzidis, J. Am. Chem. Soc., 2020, 142, 9553–9563 CrossRef CAS PubMed.
- W. Tang, J. Zhang, S. Ratnasingham, F. Liscio, K. Chen, T. Liu, K. Wan, E. S. Galindez, E. Bilotti, M. Reece, M. Baxendale, S. Milita, M. A. McLachlan, L. Su and O. Fenwick, J. Mater. Chem. A, 2020, 8, 13594–13599 RSC.
- A. Y. Tarasova, L. I. Isaenko, V. G. Kesler, V. M. Pashkov, A. P. Yelisseyev, N. M. Denysyuk and O. Y. Khyzhun, J. Phys. Chem. Solids, 2012, 73, 674–682 CrossRef CAS.
- K. Kundu, P. Dutta, P. Acharyya and K. Biswas, Mater. Res. Bull., 2021, 140, 111339 CrossRef CAS.
Footnote |
| † Electronic supplementary information (ESI) available. See DOI: https://doi.org/10.1039/d2tc00653g |
| This journal is © The Royal Society of Chemistry 2022 |

