
Molecularly imprinted nanocomposites of CsPbBr3 nanocrystals: an approach towards fast and selective gas sensing of explosive taggants†
Eduardo
Aznar-Gadea
a,
Ivan
Sanchez-Alarcon
 a,
Ananthakumar
Soosaimanickam
a,
Pedro J.
Rodriguez-Canto
b,
F.
Perez-Pla
a,
Juan P.
Martínez-Pastor
a and
Rafael
Abargues
*a
a,
Ananthakumar
Soosaimanickam
a,
Pedro J.
Rodriguez-Canto
b,
F.
Perez-Pla
a,
Juan P.
Martínez-Pastor
a and
Rafael
Abargues
*a
aUniversity of Valencia, Instituto de Ciencia de los Materiales, Calle Catedrático José Beltrán 2, 3th Floor, Office 327, ICMUV, Paterna, Valencia P.O. Box 22085, Spain. E-mail: rafael.abargues@uv.es; Tel: +34963543622
bIntenanomat S.L., Paterna, Valencia, Spain
First published on 20th December 2021
Abstract
Chemical sensors based on metal halide perovskites have recently attracted tremendous interest because of their excellent photophysical properties. In this work, we report the synthesis of a solid-state luminescent gas sensor based on a nanocomposite of CsPbBr3 nanocrystals (NCs) embedded in a molecularly imprinted polymer (MIP) using 3-nitrotoluene (3-NT) and nitromethane (NM) as template molecules. The MIP sensor fabrication is straightforward and low-cost: the molecular imprinting process occurs inside the nanocomposite of CsPbBr3 NCs in polycaprolactone (PCL) during the baking step after spin-coating. The sensing capability of the MIP sensors was evaluated and compared to that of the non-imprinted polymer (NIP) by monitoring the photoluminescence (PL) upon exposure to vapours of different explosive taggants, nitro-containing molecules and some organic solvents. The nanocomposite sensors show a fast response time to analytes below 5 s. The molecular imprinting enhances the PL response of MIP sensors and a robust specificity to 3-NT, and an excellent selectivity towards nitro-containing molecules, particularly when NM is used as the template molecule. Chromatography confirms that molecular imprinting of CsPbBr3–PCL with NM provides two times more selective binding sites than 3-NT and four times more sites than non-imprinted polymer sensors. Surface topography also suggests that the molecular imprinting in NM MIP is higher than that in 3-NT MIP. These facts confirm that molecular imprinting successfully generates specific recognition sites, allowing fast detection of 3-NT below 3 s with a limit of detection as low as 0.218 μg mL−1.
Introduction
Fast, sensitive, and selective detection of explosives and explosive-like molecules has attracted considerable attention in military operations, homeland security, and environmental safety.1,2 High explosives such as 2,4,6-trinitrotoluene (TNT) or 1,3,5-trinitroperhydro-1,3,5-triazine (RDX) have a very low vapour pressure at room temperature (TNT = 5 × 10⁻⁶ mmHg and RDX = 3 × 10⁻⁹ mmHg at 25 °C), and their detection in the vapour phase is pretty difficult. Therefore, all manufactured explosives require the presence of explosive taggants to increase their vapour pressure (10−2–10−3 mmHg at 25 °C) to facilitate their detection.3 Some nitroaromatic molecules such as 2-nitrotoluene (2-NT), 3-nitrotoluene (3-NT), and 4-nitrotoluene (4-NT) are used as a taggant for TNT detection,4 whereas 2,3-dimethyl-2,3-dinitrobutane (DMDNB) is used as a taggant in plastic explosives such as C-4 (91% RDX) and Semtex (40–76% PRTN).5–9 Trained canines10 and conventional analytical techniques such as ion chromatography–mass spectrometry,11 liquid-chromatography–mass spectrometry,12 surface-enhanced Raman spectroscopy,13 X-ray diffraction,14 and electrochemical methods,15 have been used for the explosive detection and quantification. Although the sensitivity and selectivity of analytical techniques indicate the highest performance, most of them are expensive and require bulky and sophisticated instrumentation, which limits their portability and field analysis.16 An explosive sensor must be selective and sensitive and have a short response time. Additionally, it should be cost-effective, portable, and robust for routine use in the field.17Recently, we reported a molecularly imprinted Ag nanocomposite as a selective and sensitive platform to detect and quantify 3-NT. The sensor is based on Ag NPs embedded inside the polyethyleneimine (PEI) as a polymer matrix and 3-NT as a template to generate specific molecular recognition sites. In our approach, the synthesis of the Ag NPs and the molecular imprinting process take place simultaneously during the baking step. The resulting nanocomposite combines the optical properties of the Ag NPs with the specific characteristics of the MIP. However, Ag-PEI 3-NT MIP sensors present a slow response time, and, in consequence, their application would be limited to some specific fields, such as sentinels in cargo ship containers.18 Alternatively, fluorescence-based sensors for detecting explosives and taggants offer benefits such as short response time, low limit of detection (LOD) and high selectivity.19 The sensing mechanism is predominantly based on fluorescence quenching when the analyte molecules interact with the fluorophores.3 The state of the art indicates that conjugated polymers,20 nanoclusters,21 metal–organic frameworks,22 dendrimers,23 and luminescent quantum dots (QDs),24 among others,25 have been used to detect trace amounts of explosives or explosive-like molecules.
In recent years, metal halide perovskites (PVKs) have attracted tremendous interest because of their excellent optoelectronic properties such as large absorption co-efficient, long carrier lifetime, and large diffusion coefficient.26 Owing to their excellent properties and the possibility of processing them into thin films from solution, these materials are ideal candidates for use in applications such as lighting devices, photodetectors, photocatalysts and flexible solar cells.27 PVKs show an ionic-rich labile surface, but this apparent drawback could be helpful for sensing.28 Therefore, metal halide PVKs have been proposed to sense ozone,29 oxygen,30,31 humidity,32,33 metal ions,34 ammonia,35 nitro-compounds,36etc. PVKs show outstanding results as active materials in sensors with high selectivity and sensitivity. In general, the photo-induced electron transfer between the PVK and the analyte ultimately will cause variations in the PL features (intensity, mainly). Compared with bulk PVKs, nanocrystals (NCs) of metal halide PVKs are more interesting for sensing applications because they show superior optical properties, like very narrow photoluminescence (PL) and near-unity PL quantum yield (PLQY) due to the high tolerance to defects.37 The transduction mechanism of a PVK NC-based sensor is generally based on the quenching of the PL when the analyte reaches the PVK NC surface. The exact sensing mechanism behind PL quenching is still controversial: some authors propose a charge transfer mechanism between the PVK NCs and the analyte, and other authors propose trap-state generation in PVK NCs.38,39
In the past years, conventional chalcogenide nanocrystalline semiconductors and their composite structures, graphene and several organic compounds were employed to sense explosives.40–42 Similar to the traditional semiconductor nanomaterials, the explosive sensing capability of PVK nanostructures can be of potential interest, and the necessary efforts can be undertaken to find the possible ways to explore them for such applications. Because of the electron-withdrawing ability of the nitro group, the photo-induced charge transfer mechanism between PVK NCs and nitro explosives is speculated to help in the sensing characteristics. For instance, Muthu et al.43 used CH3NH3PbBr3 (MAPbBr3) NCs in toluene to detect 2,4,6-trinitrophenol (TNP) in the solution and vapour state at concentrations as low as 10−15 M. The authors observed about 65% fluorescence quenching after 1 hour of exposure to TNP. Still, the selectivity could be affected by the presence of 4-NP. Chen et al.38 prepared CsPbX3 (Br/I) NCs in cyclohexane and determined their use in detecting picric acid (PA) in organic solutions with high sensitivity and selectivity; after 1 min of exposure, the LOD to PA was about 0.8 nM; the electrostatic-assisted electron transfer was proposed as the origin of the measured PL quenching. Most of the research in the state-of-the-art literature is based on detecting explosives in solution because of their low vapour pressure, as previously mentioned. However, to develop optical sensors directly on-field, their primary purpose will be to detect explosives and explosive-like molecules in the vapour phase. Harvell et al.44 synthesized 3D, 2D and 0D dimensional CsPbBr3 NC films to detect vapours of DNT with high selectivity; the LOD to DNT was determined to be in the ppb range after 3 min of exposure.
One of the main drawbacks of NC thin films is the poor long-term stability of their PL, which makes it essential to stabilize the PVK NCs in ambient environments to improve reproducibility and repeatability to achieve reliable sensing results and avoid false positives. These are prerequisites for the integration for commercial purposes. An approach to enhance the stability of PL properties against moisture, heat and light is to embed PVK NCs into a polymer matrix to form a nanocomposite. Xin Shan et al.39 fabricated MAPbBr3 NC-poly(vinylidene fluoride) nanocomposites through a freeze-drying process to detect explosives in solutions like TNT, trinitroglycerin (TNG) and RDX. Similar to other findings, when the MAPbBr3 NC-PVDF composite was exposed to TNT, a strong PL quenching was observed after 10 min. The authors propose the introduction of trap-states by TNT on the surface of MAPbBr3 NCs to explain the PL quenching. However, these sensors suffer from low selectivity and sensitivity. A promising way to improve the sensitivity and selectivity of sensors is to use molecularly imprinted technology (MIT) to create specific molecular recognition sites in a polymer. In general, the conventional method consists in polymerizing the monomer and the cross-linkers in the presence of template molecules. In contrast, the sensor is prepared by mixing the polymer with the template via the encapsulation method, following a sol–gel or a hydrothermal method.45 When the template is removed from the polymer matrix, some nanocavities are generated in the polymer matrix with a similar size and shape to the template molecule and a chemical environment, which drive the molecular recognition phenomena.46 In this way, the resulting molecularly imprinted polymer (MIP) would recognize and bind selectively only those molecules with similar size, shape, and functional groups to the template molecule.
Huang et al.47 studied the role of CsPbBr3 NCs embedded in a siloxane-based molecularly imprinted polymer for sensing omethoate, an organophosphorus insecticide. The APTES-capped CsPbBr3 MIP sensor showed high sensitivity and selectivity, allowing the determination of omethoate in solution with a concentration of 18.8 ng mL−1.
Most of the explosive sensors reported up to now show good sensitivity and selectivity, mostly in solution. However, the development of explosive gas sensors is still necessary for the accurate detection of explosives and is still challenging.
In this work, we report a gas explosive MIP sensor based on CsPbBr3 NCs embedded in a polycaprolactone (PCL) matrix, using 3-nitrotoluene (3-NT) or nitromethane (NM) as template molecules. The MIP sensor fabrication is very fast and low-cost. A precursor solution of OAm/OA capped CsPbBr3 NCs, PCL, and template molecules is spin-coated onto a substrate to generate a thin film and baked. The template is removed in the drying process. Selective binding sites are generated in the solid-state sensor. The resulting nanocomposite combines the sensitivity of the CsPbBr3 NCs with the selectivity of the MIPs, showing a speedy sensing response upon exposure to analytes in the gas phase. We have demonstrated the vapour sensing capabilities of the CsPbBr3–PCL MIP sensor to some explosive taggants and other nitro containing compounds. Different cycles of 3-NT/air determined the partial reversibility of the sensing process in MIP sensors. FTIR and gas chromatography confirm the template removal in the MIP sensor after the baking and also that molecular imprinting with NM provides two times more selective binding sites than 3-NT and four times more than the reference sensor without MIT. Surface topography also suggests that the molecular imprinting in the NM MIP is higher than in the 3-NT MIP. These facts confirm that the specific recognition sites have been successfully generated, allowing the detection of 3-NT in the vapour phase under concentrations of around 0.218 μg mL−1 and a response time of a few seconds.
Experimental
Reagents and materials
Polycaprolactone (PCL, average molecular weight: 80![[thin space (1/6-em)]](https://www.rsc.org/images/entities/char_2009.gif) 000, pellets), cesium carbonate (99%), oleic acid (OA, 90%), 1-nitronaphthalene (1-NN, 98%), 2,3-dimethyl-2,3-dinitrobutane (DMDNB, 98%), 3-nitrotoluene (3-NT, 99%) and chlorobenzene (ClBz) were purchased from Sigma-Aldrich. Lead(II) bromide (98 + %), o-xylene, ethyl acetate (EtOAc), toluene, acetonitrile (ACN), chloroform, acetone, and methanol (MeOH) were purchased from Fisher Chemical. 4-Nitrotoluene (4-NT, 99%), 5-nitroisoquinoline (5-NI, 98%), nitromethane (NM, 99 + %), 4-nitrophenol (4-NP, 99%) and oleylamine (OAm, 80–90%) were purchased from ACROS Organics. 1-Octadecene (ODE, 90%) was purchased from Merck.
000, pellets), cesium carbonate (99%), oleic acid (OA, 90%), 1-nitronaphthalene (1-NN, 98%), 2,3-dimethyl-2,3-dinitrobutane (DMDNB, 98%), 3-nitrotoluene (3-NT, 99%) and chlorobenzene (ClBz) were purchased from Sigma-Aldrich. Lead(II) bromide (98 + %), o-xylene, ethyl acetate (EtOAc), toluene, acetonitrile (ACN), chloroform, acetone, and methanol (MeOH) were purchased from Fisher Chemical. 4-Nitrotoluene (4-NT, 99%), 5-nitroisoquinoline (5-NI, 98%), nitromethane (NM, 99 + %), 4-nitrophenol (4-NP, 99%) and oleylamine (OAm, 80–90%) were purchased from ACROS Organics. 1-Octadecene (ODE, 90%) was purchased from Merck.
Synthesis and purification of CsPbBr3 nanocrystals
The CsPbBr3 NCs were synthesized via the hot-injection method with some modifications.48 On the one hand, 0.16 g Cs2CO3, 10 mL 1-ODE and 5 mL OA are mixed into a 50 mL three-neck flask and heated under vacuum for 1 h at 120 °C, and the temperature is then increased to 150 °C under a N2 atmosphere to form a Cs-oleate precursor. On the other hand, a mixture of 0.55 g PbBr2 and 20 mL ODE is loaded into a 100 mL three-neck flask and dried under vacuum at 120 °C for 1 h. After that, 5 mL OAm and 5 mL OA is added under a N2 atmosphere, and the solution is heated to 160 °C for 1 h. Then, the solution is heated to 195 °C, and the Cs-oleate solution is swiftly injected and 1 min later, the reaction system is cooled in an ice-water bath. The CsPbBr3 NCs are purified by several successive centrifuging and redispersion steps with a mixture of n-hexane and EtOAc. The purification is an essential step to reach the isolation of the CsPbBr3 NCs for further embedding into a polymer to form thin films by spin-coating. Finally, the CsPbBr3 NCs are redispersed in o-xylene with a concentration of 32 mg mL−1.CsPbBr3–PCL nanocomposite preparation and sensor fabrication
CsPbBr3–PCL solution was prepared by dispersing CsPbBr3 NCs (28.5 mg) and PCL (200 mg, 4 wt%) in o-xylene (5 mL). The solution was mixed with 3-NT or NM in a ratio 4:1. The final composition achieved for PVK–PCL MIP solution was PCL (24 mg mL−1, 2.40 wt%), CsPbBr3 NCs (3.58 mg mL−1), and 3-NT (229.02 mg mL−1, 1.67 M) or NM (219.74 mg mL−1, 3.6 M) for 3-NT and NM MIP. NIP solution was prepared without template keeping the same concentrations of PCL and CsPbBr3.
The MIP- and NIP-based sensors are deposited by spin-coating a precursor solution onto a 0.5 cm2 glass slide substrate at 2000 rpm for 30 s and baked at 100 °C for 10 min to remove the solvent and the template. The film thickness of the sensors is measured to be around 180 nm on a mechanical profilometer (Veeco Dektak 150).
Characterization techniques
The absorbance spectra of the colloidal solution containing CsPbBr3 NCs in o-xylene and the nanocomposite films containing CsPbBr3 NCs are measured at room temperature using a UV-Visible spectrophotometer (V-770 UV-Visible/NIR Spectrophotometer, Jasco). The photoluminescence spectra of CsPbBr3 NCs embedded in the PCL host matrix are obtained upon the excitation of the sensors with a CW GaN laser (404 nm) for NIP and MIP nanocomposites. The CsPbBr3 NCs PLQY was determined to be 70% using an integrated sphere (Hamamatsu model C9920-0). The functional groups of the sensor were identified on a FT-IR spectrometer (ATR-FTIR Thermo Nicolet Nexus).Quantification of 3-NT was carried out by gas chromatography (GC) using a chromatograph (Agilent 6890+ series) coupled to a flame ionization detector (FID), equipped with a cross-linked 5% phenyl-methylsiloxane column (30 m × 0.32 mm × 0.25 μm film thickness). This technique provides information about the number of molecular recognition sites depending on the amount of 3-NT detected. Fig. S3 (ESI†) shows the calibration line obtained from blends prepared by mixing 3-NT solutions (0.05, 0.1, 0.5, 1, and 5 mM in chloroform) and chlorobenzene as the internal standard (10−4 M). The calibration line presented a good correlation (R = 0.999) between the analyte concentration and the detector response. Twenty films of NIP, 3-NT MIP, and NM MIP were prepared by spin-coating and baked at 100 °C. These films, which have internal average concentrations in the range of the calibration blends, were dissolved in chloroform and analysed by GC.
The CsPbBr3–PCL films were also characterized by XRD (XPERT Pro, Panalytical). The surface morphology of the films was studied by scanning electron microscopy (SEM, Hitachi S4800). In order to obtain the size and shape of the CsPbBr3 NCs embedded in the polymer, transmission electron microscopy (TEM) was carried out at an accelerating voltage of 100 kV using a JEOL 1010 microscope. TEM samples were prepared by ultrasonication in o-xylene of small pieces of CsPbBr3 NCs nanocomposite coated on coverslips with the sensor. This procedure led to a suspension of micrometre-sized fragments of nanocomposites that was dropped onto a carbon-coated Cu grid. The microstructural information and chemical composition of the CsPbBr3–PCL sensors were obtained by HR-TEM (Tecnai G2 F20 S-TWIN from FEI Company).
Sensing protocol
The sensing capability of the CsPbBr3–PCL films was measured by a homemade setup based on a CW GaN laser (404 nm) focused onto the sensor using a lens and positioning system to measure the fluorescence spectra in the same position to achieve accurate and reproducible PL intensity values. CsPbBr3–PCL sensors are introduced into a cuvette of 4.5 cm3, and are exposed to vapours of different organic volatile compounds. This process was carried out using air as a gas carrier at room temperature at different times pumped using a peristaltic pump at a constant flow of 0.57 μL min−1. The PL sensitivity and response time of the various sensors were obtained by means of the commercial spectrophotometric system NanoSPR103 (NANOSPR).Results and discussion
Synthesis and characterization of the CsPbBr3–PCL NIP/MIP sensor
The fabrication of MIP nanocomposites is depicted in Fig. 1A. First, an o-xylene solution containing PCL, CsPbBr3 NCs and 3-NT or NM is spin-coated onto a glass substrate and baked at 100 °C. The molecular imprinting process occurs by the evaporation of the template during the baking step (encapsulation method).45,49 PCL is a semicrystalline biodegradable polymer that exhibits a hydrophobic character and good processability due to the extraordinary blend of compatibility, low melting point and low glass transition temperature (−60 °C).50,51 Moreover, the electron pairs from the C![[double bond, length as m-dash]](https://www.rsc.org/images/entities/char_e001.gif) O bond in PCL can form an intermediate adduct with the under-coordinated lead atoms in the perovskite, enhancing the perovskite grain size, achieving the grain boundary regulation and obtaining high-quality perovskite films with low defect density and high flexibility.52–54
O bond in PCL can form an intermediate adduct with the under-coordinated lead atoms in the perovskite, enhancing the perovskite grain size, achieving the grain boundary regulation and obtaining high-quality perovskite films with low defect density and high flexibility.52–54
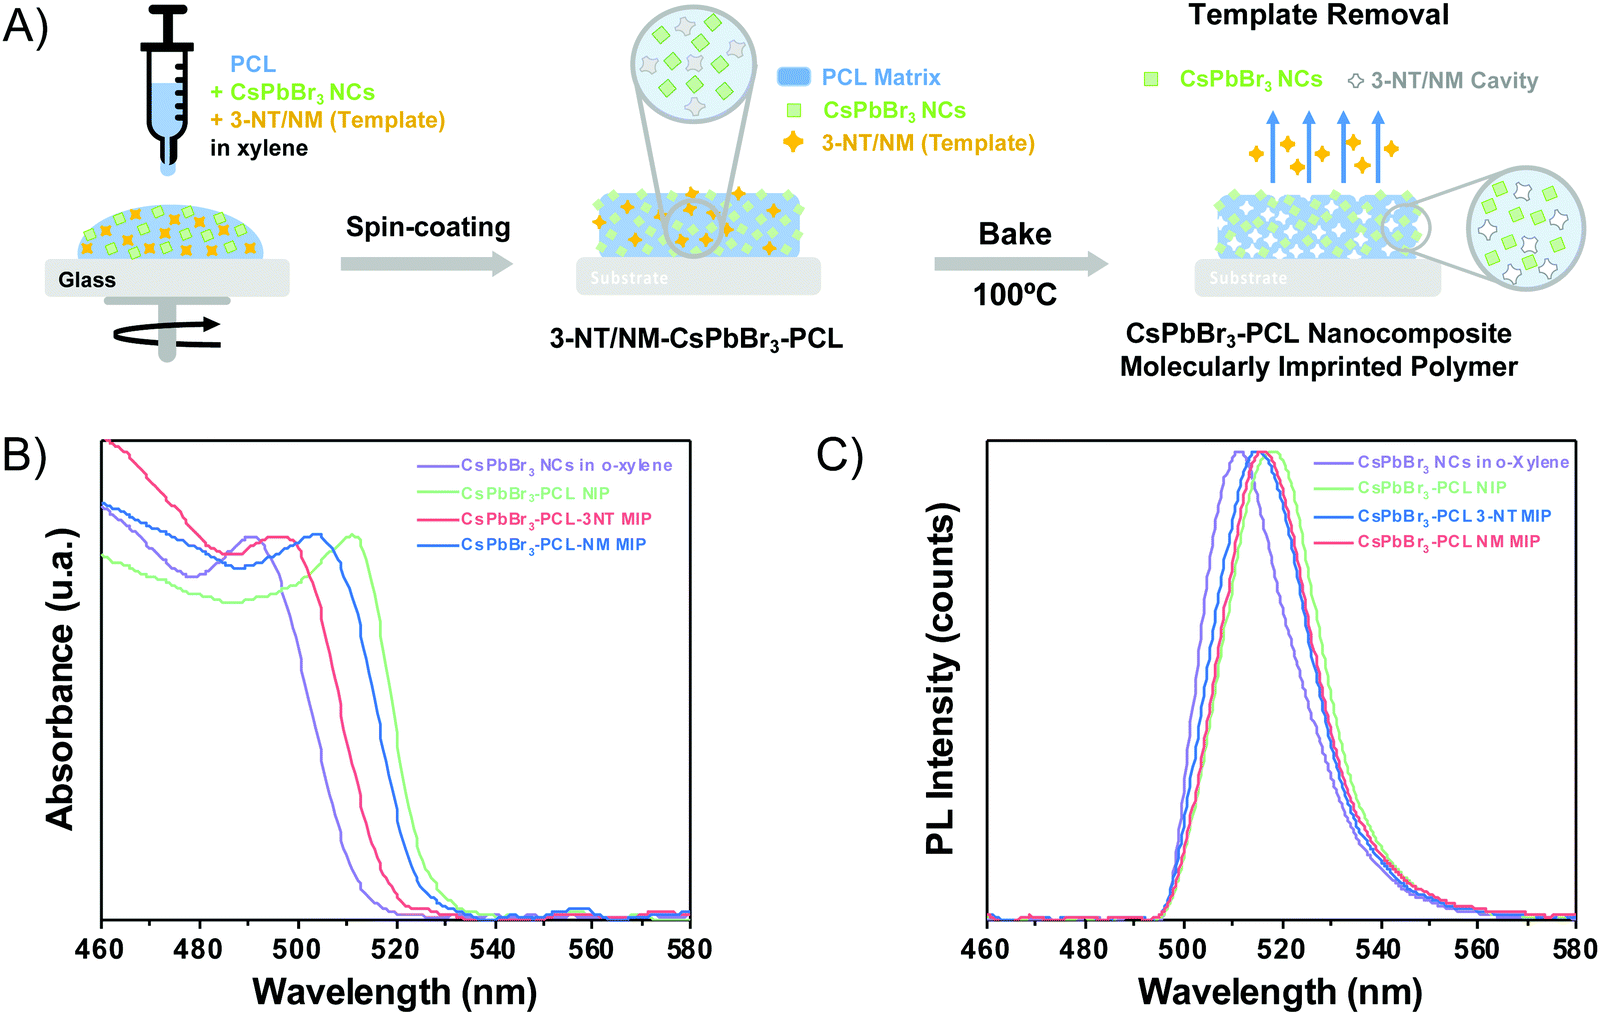 | ||
| Fig. 1 (A) Schematic steps of the fabrication of the CsPbBr3–PCL 3-NT or NM MIP sensor. (B) UV-vis absorbance spectra and (C) emission spectra of CsPbBr3 NCs in o-xylene (purple line) and embedded in the PCL polymer matrix without (green line), with 3-NT (blue line) and NM (red line) template. | ||
The optical properties (absorbance and PL) of the CsPbBr3 NC colloidal solution and the three thin films (i.e., the sensors) were examined. Fig. 1B shows the UV-Vis spectra of colloidal CsPbBr3 NCs in o-xylene and embedded in the polymer matrix. The exciton absorption resonance of the colloidal NCs is observed at 490 nm. When the CsPbBr3 NCs are embedded into PCL, the exciton peak is observed at 511 nm for NIP, 495 nm for 3-NT MIP, and 503 nm for NM MIP. The different exciton absorptions of CsPbBr3 NCs when they are embedded in PCL is attributed to the presence of the polymer and nanocavities in MIPs.
Fig. 1C illustrates the PL spectra of the colloidal CsPbBr3 NCs in o-xylene solution and in the different nanocomposite thin films measured upon excitation at 404 nm. The maximum emission band of the CsPbBr3 colloidal solution in o-xylene is around 511 nm with a 22 nm of FWHM. When the CsPbBr3 NCs are embedded in the PCL matrix, the emission spectra changes depending on the nanocomposite composition. The CsPbBr3–PCL NIP and CsPbBr3–PCL–3NT MIP were red-shifted to 513 nm with an FWHM of 21 nm and 512 nm with an FWHM of 21 nm, respectively, but the emission of the CsPbBr3–PCL–NM MIP was blue-shifted to 509 nm with an FWHM of 19 nm. In any case, the difference in the PL peak wavelength is significantly smaller than the one observed in the exciton absorbance. On the other hand, the shape of the emission bands of the nanocomposites is similar to that of the CsPbBr3 NCs in solution. This fact indicates that the NCs embedded into the polymer matrix are well-dispersed with no aggregation.
The different optical properties of NIP and MIP are ascribed to the various porosity levels generated during the molecular imprinting of the nanocomposite. As discussed below, molecular imprinting with NM results in CsPbBr3–PCL films with higher porosity than that imprinted by 3-NT. Therefore, CsPbBr3 NCs have different electronic surroundings in NIP, 3-NT MIP and NM–MIP, which can affect their optical properties (both absorbance and PL).45
Fig. 2A shows FTIR spectra of PCL, NIP, 3-NT MIP and NM MIP. We observed that all spectra are similar to that of PCL. The absorption bands at 2940 cm−1 and 2863 cm−1 are correlated with the asymmetric and symmetric stretching of PCL C–H alkyl chains. Moreover, the CO stretching vibration of the ester carbonyl group could be assigned to the peak at 1722 cm−1. Additionally, the peaks at 1238 cm−1 and 1161 cm−1 may be attributed to C–O–C asymmetric and symmetric stretching bands, respectively.55 We do not observe the presence of −NO2 groups in 3-NT MIP and NM–MIP nanocomposites. This indicates that the approach used to imprint the CsPbBr3–PCL nanocomposite molecularly is successful: both templates (3-NT and NM) are removed entirely after the baking step.
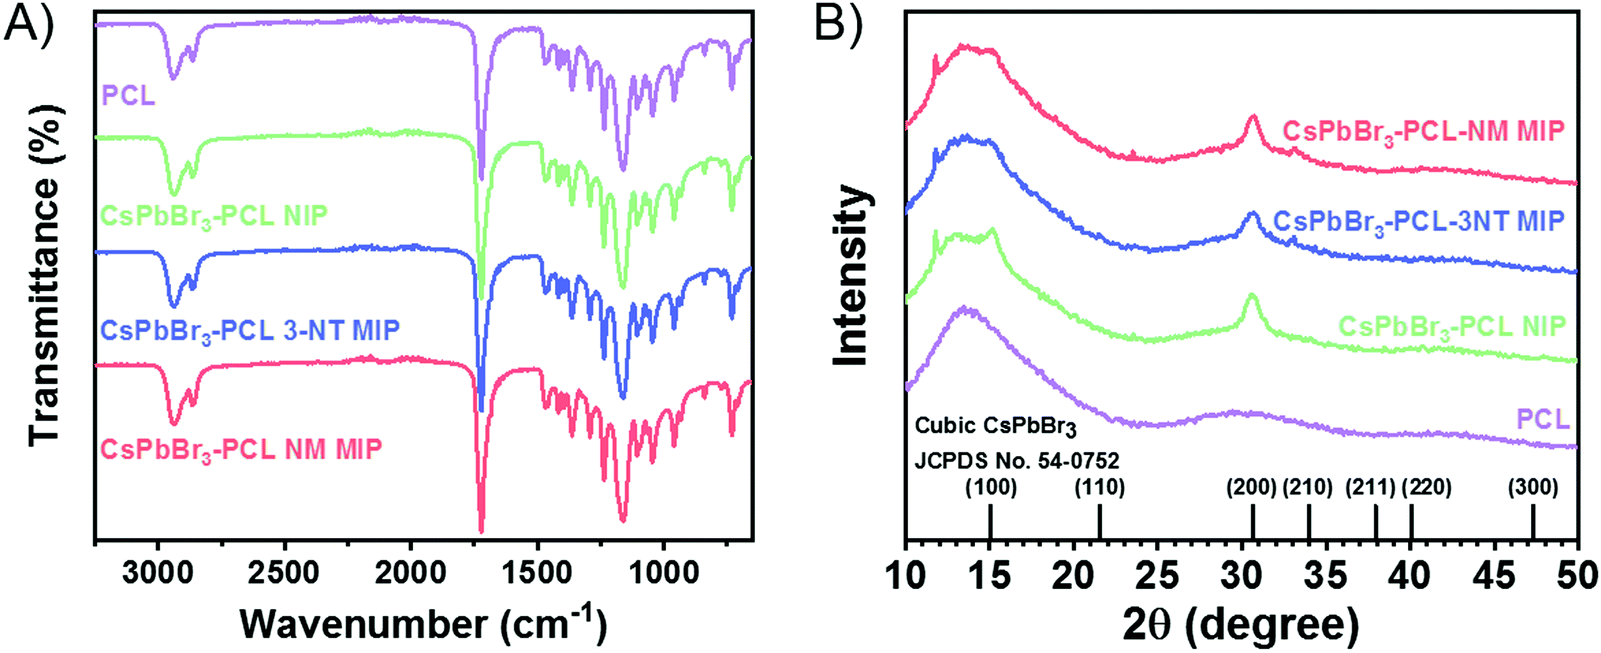 | ||
| Fig. 2 (A) FTIR and (B) XRD spectra for PCL, CsPbBr3–PCL NIP, CsPbBr3–PCL 3-NT MIP, and CsPbBr3–PCL NM MIP. | ||
Fig. 2B shows the XRD patterns of PCL and CsPbBr3–PCL nanocomposites. We observe two diffraction peaks at 15.1° and 30.5° that are assigned to the (100) and (200) planes of the cubic phase of the CsPbBr3 NCs. This confirms the presence of CsPbBr3 NCs embedded in the polymer matrix. The peak at 11.7° corresponds to the CsPb2Br5 phase56 and the broad diffraction centred at 13.5° is assigned to neat PCL. Moreover, we can determine the average size of the CsPbBr3 NCs in the different nanocomposites using the Scherrer equation to the (200) plane. The calculated sizes are 7.6 ± 0.5 nm for the NIP sensor, 7.2 ± 0.5 nm for the 3-NT MIP sensor and 7.3 ± 0.5 nm for the NM MIP sensor. These different NC sizes can also be consistent with the blueshifts of excitonic absorption from NIP to MIP shown in Fig. 1B. These results suggest that the dispersion of CsPbBr3 NCs into PCL for 3-NT and NM MIP decreases the NC size. Recently we reported that the ageing of CsPbBr3 NCs under ambient conditions might lead to an apparent reduction of the NC size.57 Therefore, it is plausible that cavities in the MIP nanocomposite can induce a similar effect.
The cubic morphology of the CsPbBr3 NCs is confirmed by TEM (Fig. 3A), revealing a uniform size distribution of CsPbBr3 NCs. From TEM images, we measured an average size of 7.4 ± 1.7 nm for the NIP, 7.0 ± 1.3 nm for 3-NT MIP and 7.3 ± 1.2 nm for NM MIP. These sizes are in good agreement with those deduced from XRD. Fig. 3B represents the size distribution of the 3-NT MIP sensor. From the HRTEM image (Fig. 3C), the measured interplanar distance of 5.6 Å for the 3-NT MIP sensor corresponds to the spacing of the (100) plane measured by XRD (5.8 Å). The elemental mapping of the CsPbBr3–PCL 3-NT MIP was also performed by HRTEM (Fig. 3D) and confirmed the presence of Cs, Pb and Br from the perovskite nanocrystals.
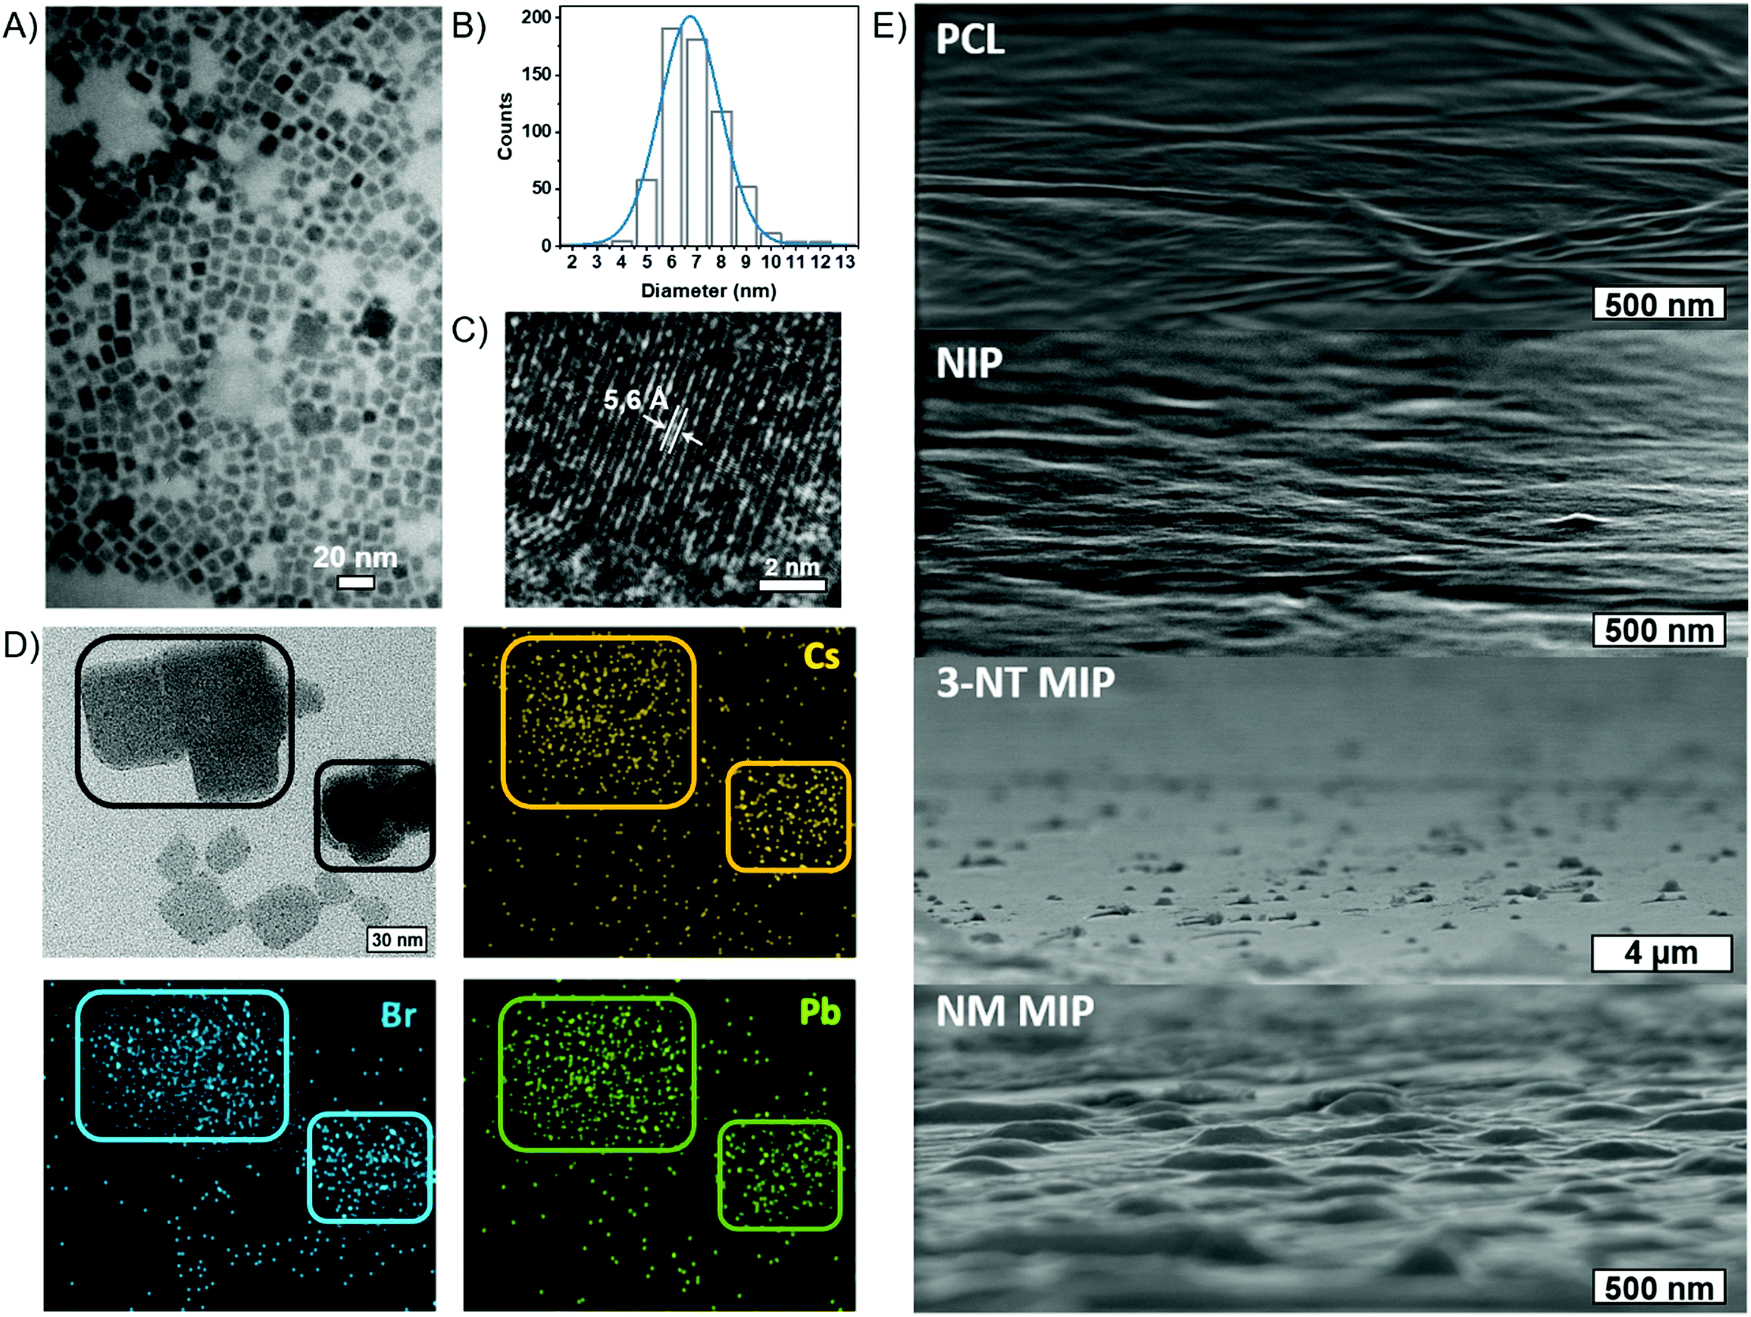 | ||
| Fig. 3 (A) TEM image (B) size distribution of CsPbBr3 NCs (C) HRTEM, and (D) HRTEM compositional mapping of CsPbBr3–PCL 3-NT MIP. (E) SEM images of the surface morphology of PCL, NIP, 3-NT MIP and NM MIP thin films. | ||
The surface morphology of the NIP, 3-NT MIP, and NM MIP thin films was characterized by SEM and compared to a PCL film (Fig. 3E). Both PCL and NIP films show a flat and smooth surface. The presence of CsPbBr3 NCs (average size 7 nm) inside the PCL matrix does not influence the surface topography. This reveals that CsPbBr3 NCs are homogeneously dispersed inside PCL, and they do not aggregate. On the other hand, both MIP sensors exhibit a rougher surface with some topographic defects like bumps. These defects are generated after the removal of the template and are therefore related to molecular imprinting. Specifically, the average size of the surface defects is 350 nm and 800 nm for NM MIP and 3-NT MIP sensors, respectively. Therefore, NM MIP shows a higher number of defects per area than 3-NT MIP. These results would suggest that the molecular imprinting in NM MIP is higher than in 3-NT MIP.
Sensing of 3-NT in the vapour phase
The sensing capability of the CsPbBr3–PCL MIP and NIP nanocomposites was evaluated by exposing the sensors to vapours of 3-NT using air as a gas carrier at a constant flow of 0.57 μL min−1. The scheme of the MIP sensing process is shown in Fig. 4A. Fig. 4B exhibits the PL spectra of the CsPbBr3–PCL 3-NT MIP thin film upon exposure to vapours of 3-NT for different times. Time intervals were chosen to provide enough time for the analyte to interact with the sensor. As can be observed, the interaction between the analyte and the CsPbBr3 NC surface is speedy, and after only 6 s, we can already measure a noticeable PL quenching (28.2% NIP, 27.9% 3-NT MIP and 16.4% NM MIP). Fig. 4C illustrates the real-time kinetic response of the CsPbBr3 nanocomposites upon exposure to vapours of 3-NT as a function of exposure time and 3-NT mass using the PL intensity as a response variable. Both MIP sensors exhibit a remarkably higher response to 3-NT than NIP sensors. This confirms that the molecular imprinting approach successfully creates specific molecular recognition sites facilitating the interaction and the diffusion process of the taggants to the CsPbBr3 NCs.46 This increases the porosity and permeability of the thin film. After 120 s of exposure, about 69% quenching is observed for both MIP sensors, while the PL quenching of the NIP sensor is only 53%. The progressive PL decay in all sensors is caused by the increase of the number of 3-NT molecules attached to the surface of the CsPbBr3 NCs. The response of all sensors to the laser without any gas exposure is negligible, which indicated a good shelf stability as is shown in Fig. S1 (†). The mechanism of the PL quenching when analyte molecules interact with the CsPbBr3 NC surface could be attributed due to an electronic energy transfer from the sensor (electron donor) to the 3-NT (electron acceptor) because the nitro group has a strong electron-withdrawing ability that makes the aromatic ring very electron-poor relative to benzene.18,38,43,47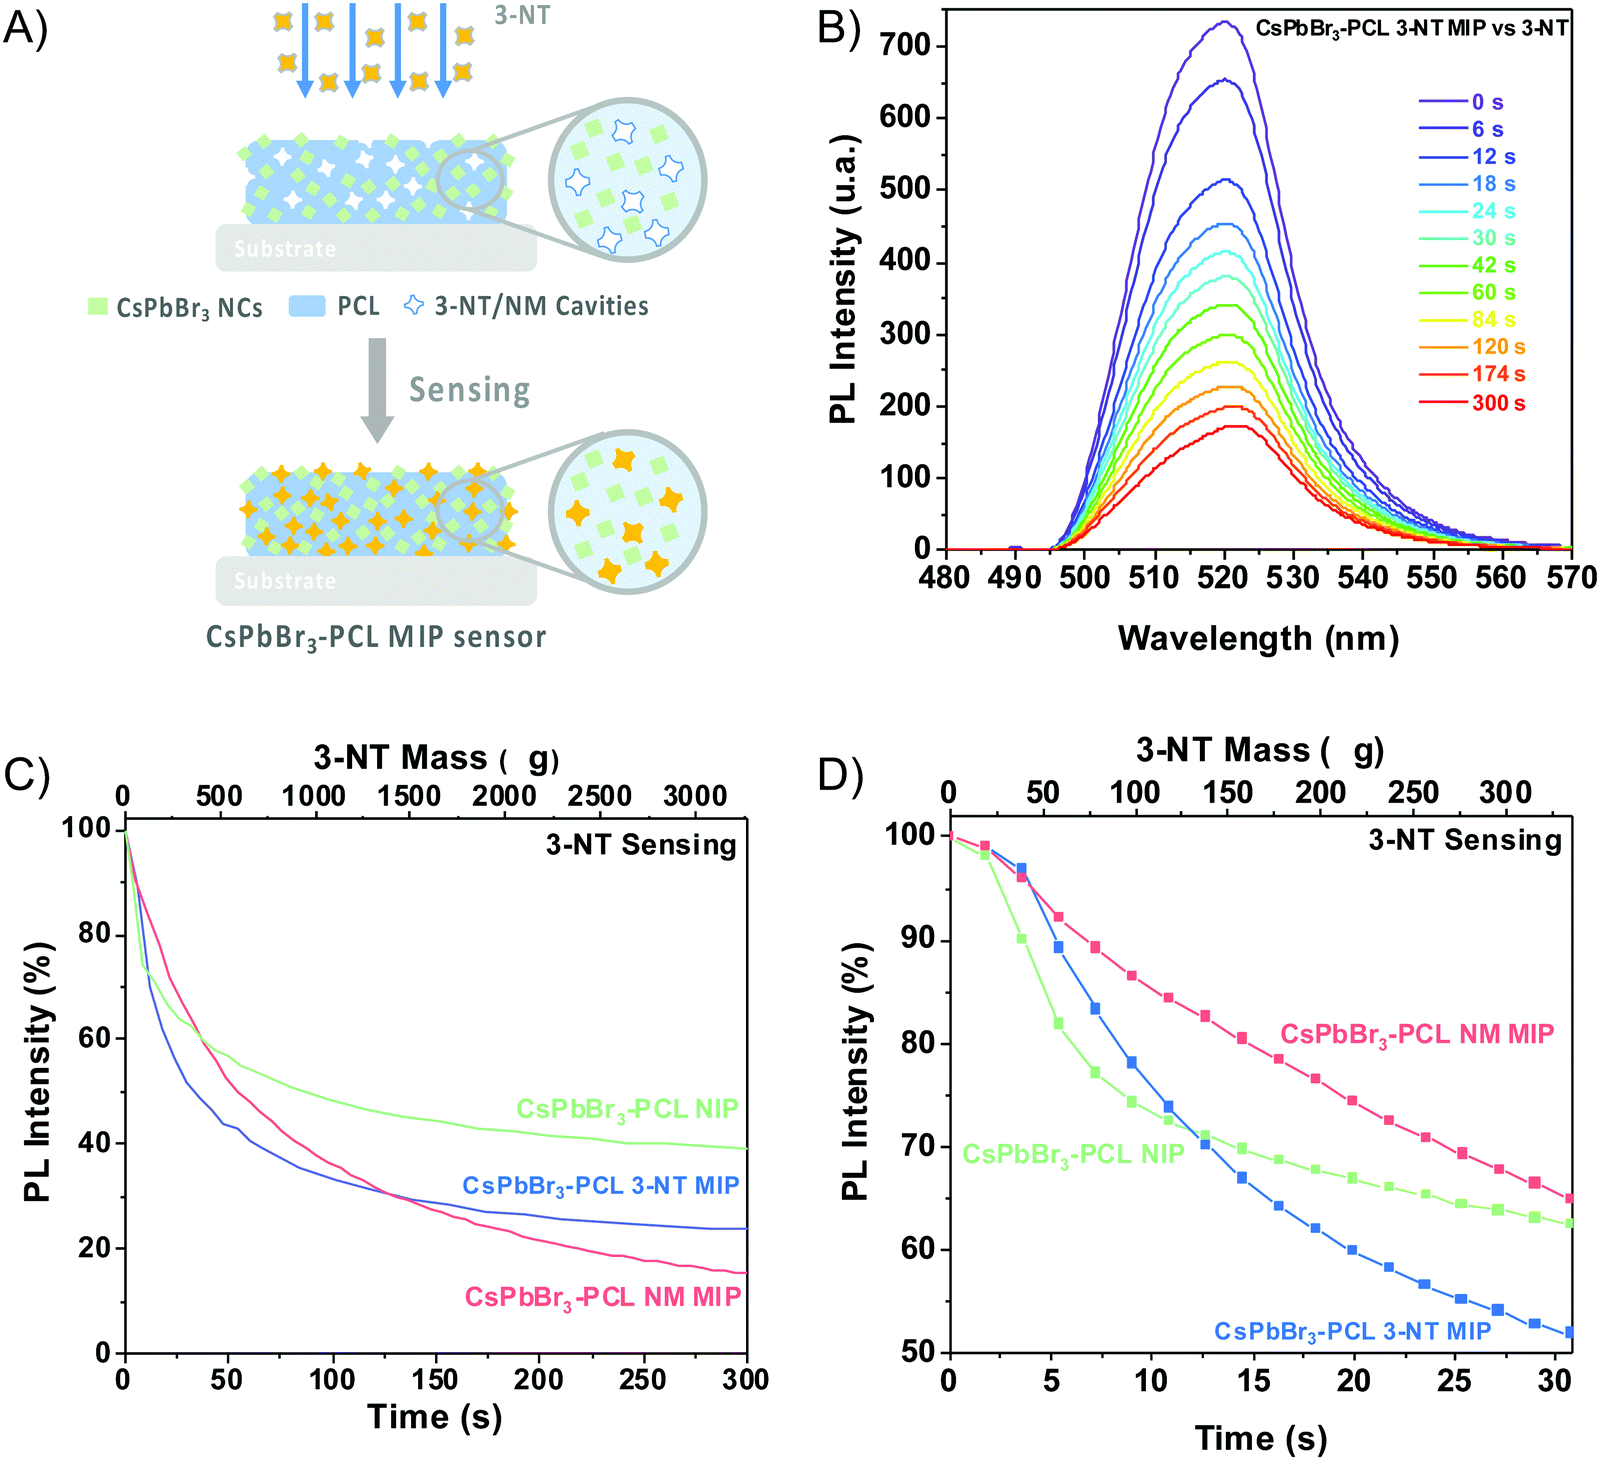 | ||
| Fig. 4 (A) Schematic representation of the MIP sensing process. (B) Fluorescence response of the CsPbBr3–PCL 3-NT MIP sensor to 3-NT vapours. (C) Time- and 3-NT mass-dependent PL intensity of NIP, CsPbBr3–PCL 3-NT MIP and, CsPbBr3–PCL NM MIP nanocomposites sensing 3-NT and (D) PL intensity as a function of the amount of 3-NT and time exposure. | ||
The PL quenching in this system can be fitted by the following exponential curve: PLt = PL∞ + A·e−k·t, where PLt is the PL intensity at a given time, PL∞ is the response when the sensor is saturated by the analyte, and k is the binding rate constant.
The results obtained from fitting the saturating function are listed in Table 1. The NM MIP sensor shows the highest response to 3-NT (PL∞ = −83.5%) followed by 3-NT MIP (PL∞ = −73.8%) and NIP (PL∞ = −60.3%). The adsorption of 3-NT molecules on the surface of the CsPbBr3 NCs is a strongly time-dependent phenomenon, which is determined by the vapour-phase analyte transport to the NCs and the subsequent chemical interaction rate.44 The analyte binding rate (slope of the curve at any point) is mainly determined by the number of accessible CsPbBr3 NCs (binding sites) embedded into the PCL matrix and the analyte concentration in the vapour phase, which is correlated to their vapour pressure. The molecular imprinting of the CsPbBr3–PLC nanocomposite with 3-NT or NM generates nano- or microcavities and increases the porosity of the sensor and the permeability. This is in good agreement with the surface topography shown in Fig. 3E. Consequently, the accessibility of analytes to the binding sites is strongly enhanced. Furthermore, the selectivity is enhanced because the sensors can recognize the target analytes.58 The response of the different sensors to the analyte is cumulative over time until almost no more binding sites are available.
| Sensor | PL∞ % | k μs−1 |
|---|---|---|
| CsPbBr3–PCL NIP | −60.3 ± 0.7 | 23.1 ± 2.0 |
| CsPbBr3–PCL 3-NT MIP | −73.8 ± 0.9 | 29.9 ± 1.9 |
| CsPbBr3–PCL NM MIP | −83.5 ± 0.5 | 14.3 ± 0.4 |
The maximum binding rate is achieved at the beginning of the sensing process when all the binding sites are empty. The limiting step of the process changes during the sensing. In the beginning, the limiting factor is mainly the analyte mass transport from the gas to the CsPbBr3 NC binding sites, while the interaction analyte-CsPbBr3 NCs controls the later stages. Fig. 4D shows the sensor's response within the first 30 s of the sensing process. As we can observe, the PL decays rapidly with increasing the amount of 3-NT up to 300 μg. Within the first 10 s, the NIP sensor shows a faster response than the 3-NT MIP and NM MIP sensors. This can be explained by the different porosities generated during the molecular imprinting (Fig. 5A). In the NIP sensor we can assume that 3-NT molecules should attach to those CsPbBr3 NCs at the surface of the nanocomposite film because there are no pores to circulate the vapour with analytes. This will produce a fast decrease of binding sites and saturation to PL∞. It is well known that we need a minimum number (tens or hundreds) of molecules bound to PVK NCs to generate surface defects and produce a change in the PL. When sensor films are more porous (MIP ones), vapours will circulate deeper in the film and more NCs will be accessible to the analytes (this leads to a higher PL∞), and hence the analyte/NC ratio is lower at a given time. For this reason, we expect a relatively slower sensor response. According to previous results, the porosities of the sensors follow the order NM MIP > 3-NT MIP > NIP. This would explain why NIP exhibits a shorter response time than 3-NT MIP and NM MIP. To evaluate the quenching efficiency of the analyte, the sensing results were fitted to the Stern–Volmer equation (Fig. S2, ESI†):
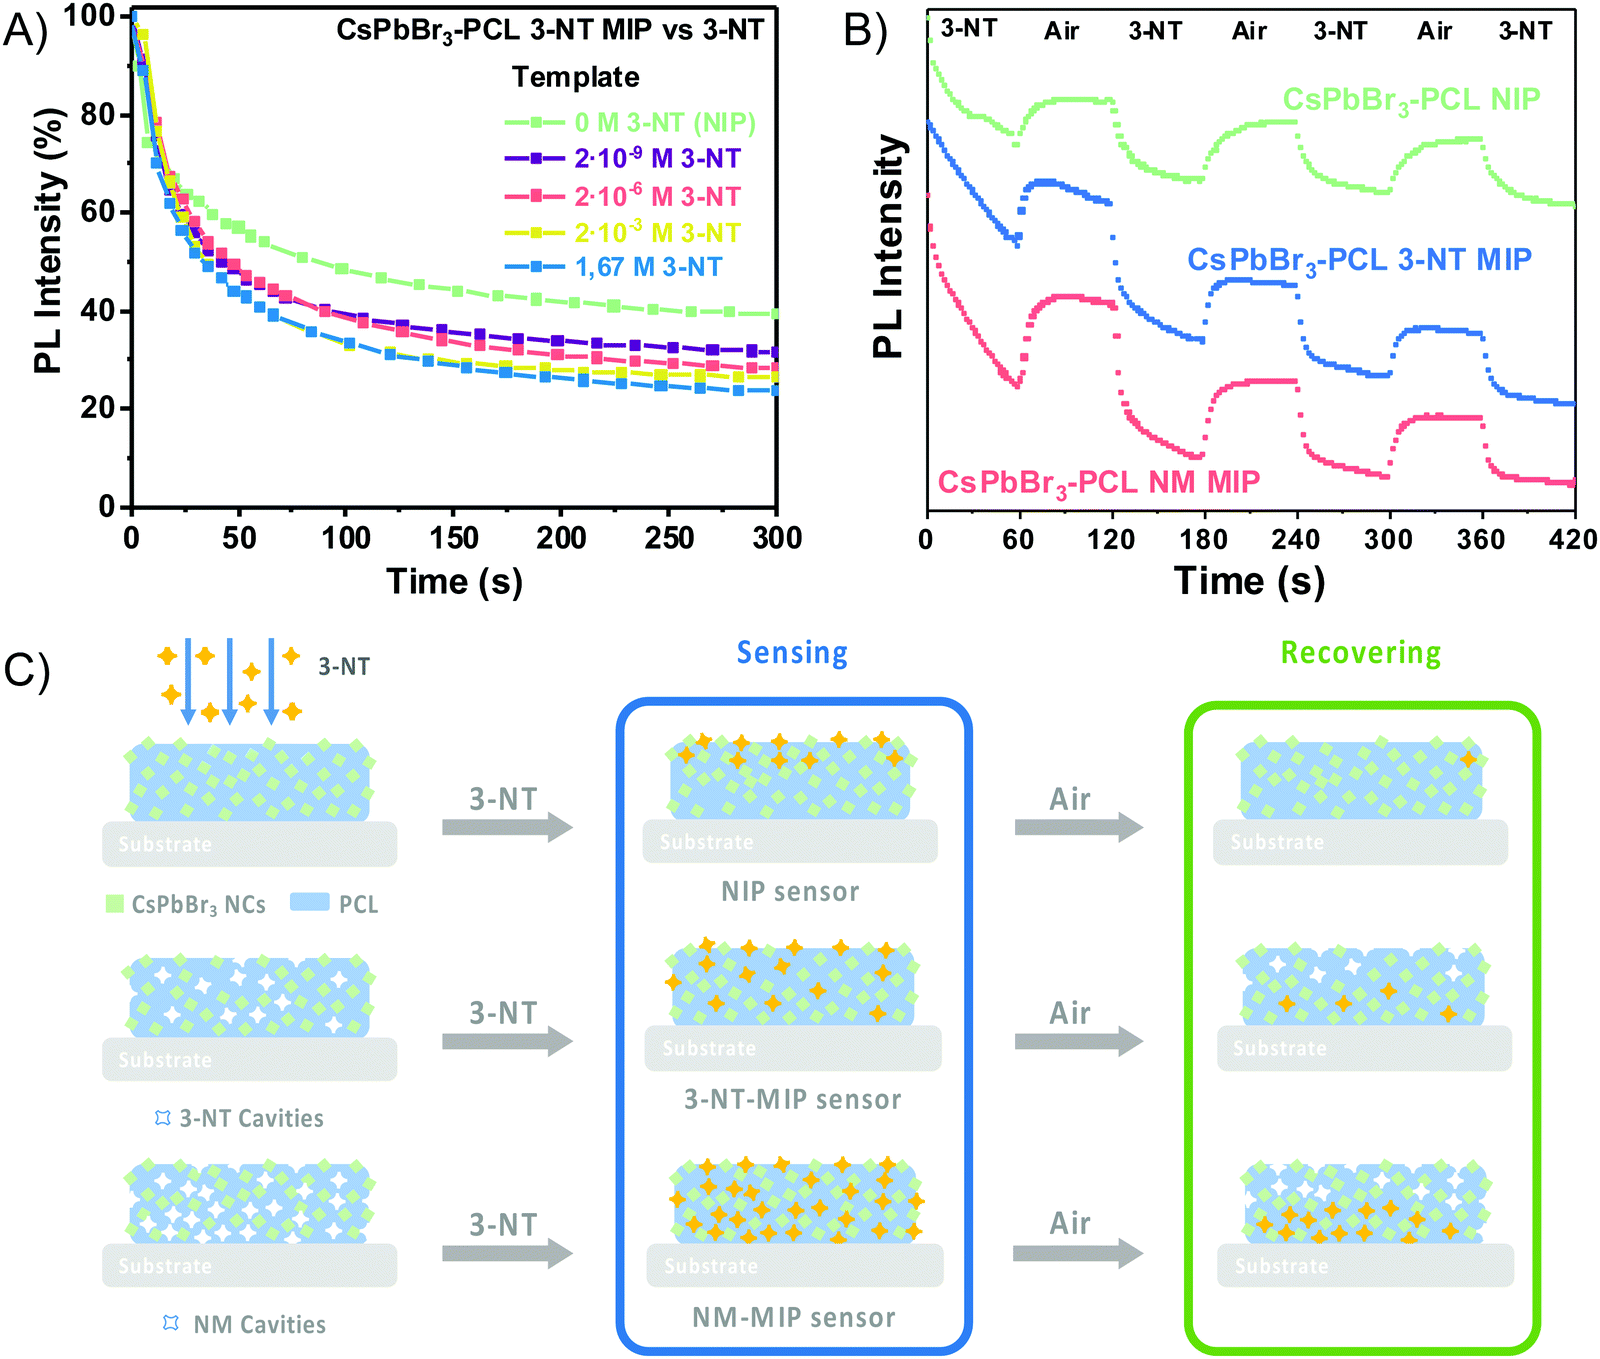 | ||
| Fig. 5 (A) Real-time response of the CsPbBr3–PCL nanocomposite imprinted with different concentrations of 3-NT upon exposure to 3-NT vapours. (B) Real-time response of the CsPbBr3–PCL NIP and CsPbBr3–PCL 3-NT and NM MIP sensors under repeated exposure cycles to 3-NT vapours (grey areas) and air (white areas). (C) Schematic representation of the NIP/MIP sensing process. | ||
As can be observed, the exposure of the CsPbBr3–PCL NIP and CsPbBr3–PCL 3-NT MIP to 3-NT vapours follows an exponential relationship, whereas a good linear correlation is shown with CsPbBr3–PCL NM MIP (R2 = 0.9996). This upward deviation from the linear Stern–Volmer law has been reported in many experimental systems depending on the underlying quenching mechanism: contact quenching and collisional quenching. On the other hand, non-linear Stern–Volmer plots can also occur in the case of purely collisional quenching if some of the fluorophores are less accessible than others.59 The linear Stern–Volmer relation of the NM MIP sensor suggests that the PL dropping mechanism is predominantly due to a collisional quenching between the CsPbBr3 NCs and the analyte. However, the exponential fitting of the NIP and 3-NT MIP data to 3-NT vapours may indicate that some PVK NCs are less accessible than others for 3-NT MIP and NIP sensors. This is in good agreement with the real-time kinetic results shown in Fig. 5B with as shown in the surface topography shown in Fig. 3A and gas chromatography (see below in Fig. 6). For that reason, the different number of accessible binding sites between in each sensor might be related to the deviation from the linearity. From Fig. 4D, we can also determine the limit of detection (LOD) of the sensors; this is the lowest analyte concentration to produce a reliably distinguished PL decay from the blank. LOD is determined to be 19.7 μg, which corresponds to 218 ppb, 1.59 μM or a PL quenching of 2% for the NIP sensor and 1% for both MIP sensors.
 | ||
| Fig. 6 Gas chromatograms of the CsPbBr3–PCL NIP and CsPbBr3–PCL 3-NT and NM MIP sensors (A) before and (B) after exposure to 3-NT vapours for 180 s. | ||
The sensitivity and the response time of the MIP sensor depend on the concentration of the template. Fig. 5A illustrates the influence of the template concentration on the 3-NT MIP sensor upon exposure to 3-NT vapours. After 300 s, the PL intensity decays from 60% for the NIP sensor (0 M 3-NT) to 76% for the 3-NT MIP sensor with 1.67 M 3-NT concentration, i.e., the highest response (PL quenching percentage) to 3-NT. However, this response is practically the same as that prepared from 2·× 10−3 M 3-NT (73%), whereas, for 2 × 10⁻⁶ M and 2 × 10⁻⁹ M 3-NT, the MIP sensor response at 300 s clearly decreases to 71% and 68%, respectively. The number of molecular recognition sites would increase with the template concentration. The maximum response is reached when the template concentration is 10−3 M. The number of molecular sites generated during the molecular imprint does not increase proportionally with 3-NT concentration: only a finite number of molecular sites are generated when the solution is formulated from 10−9 to 10−3 M 3-NT. Further increase does not result in more accessible selective sites. For that reason, the amount of 3-NT has an essential role in the sensing performance.
The reversibility of the sensors is also tested to have a deeper insight into the nature of the analyte binding between the CsPbBr3 NCs and 3-NT vapours. Every exposure cycle consists of an exposure to an analyte flow for 60 s followed by exposure to airflow for 60 s. Fig. 5B shows that the PL intensity decreases significantly when the sensor is exposed to 3-NT for 60 s. Afterwards, when exposed to airflow, they recover the PL of around 83%, 78% and 72% for NIP, 3-NT MIP and NM MIP, respectively. The reversibility is possible because the OAm and OA ligands (amino and carboxylate ligands) are remarkably labile, dynamic and are suitable leaving ligands. OAm and OA can be easily exchanged by other ligands, as already observed in PbS QDs.60 As a result, OAm and OA can exchange their position in the CsPbBr3 NC by the analyte. Once the analyte is removed, OAm and OA can return to the original positions.44,61
After four sensing and recovering cycles, the NIP sensor response decays and recovers approximately to the initial PL intensity after every cycle. The NIP sensor is almost reversible. Fig. 5C shows the possible mechanism. The reversibility of the NIP sensor is because 3-NT molecules are only adsorbed within the first few nanometres (Fig. 5C) of the 100 nm-thick film. As a result, 3-NT can be easily desorbed when exposed to an airflow with an average recovery time of 22 s. On the other hand, both 3-NT MIP and NM MIP sensors exhibit a certain hysteresis after every sensing and recovery cycle. Therefore 3-NT MIP and NM MIP sensors are partially reversible with an average recovery time of 12 and 14 s respectively. As suggested in Fig. 5C, after the molecular imprinting, the 3-NT molecules are adsorbed not only at the surface of the 100 nm-thick sensing films, but also deeper in the film due to the specific cavities generated after the template removal. Only those 3-NT molecules located at the surface are desorbed during every recovery cycle, but not those located at the bottom of the film.
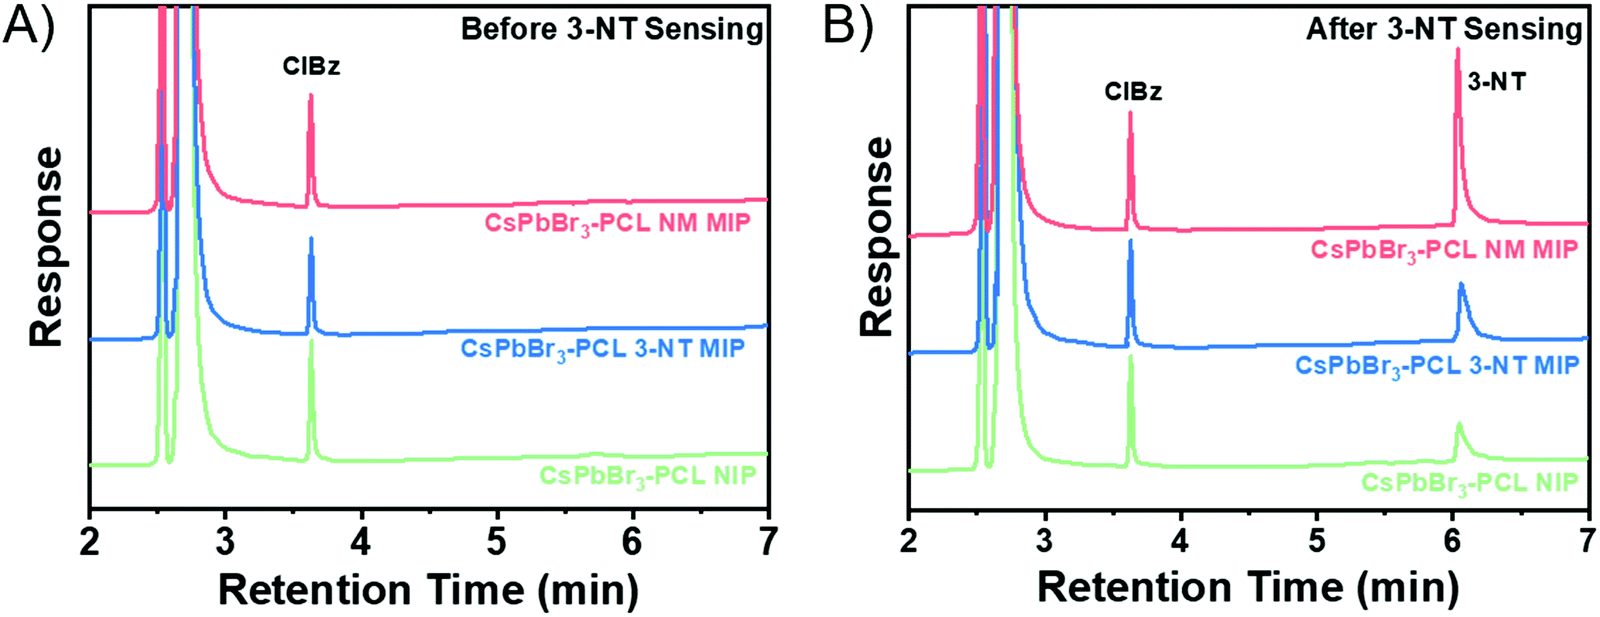
Gas chromatography was employed to measure quantitatively how effective the adsorption of 3-NT in NIP, 3-NT MIP and NM MIP sensor is. Gas chromatograms before sensing are shown in Fig. 6A. In the case of 3-NT MIP, chromatography confirms the complete removal of the template, in total agreement with the results obtained in the FTIR (Fig. 2A).
CsPbBr3–PLC NIP/MIP nanocomposite films were exposed to 3-NT vapours for 180 s and then analyzed by gas chromatography. The chromatograms of NIP, 3-NT MIP, and NM MIP after sensing are shown in Fig. 6B. The quantification was carried out by interpolation in the calibration curve (see Fig. S3 in the ESI†) of the peak areas of 3-NT measured in Fig. 6B. The quantity of 3-NT adsorbed by the sensors was 75 ng for NIP, 151 ng for 3-NT MIP and 285 ng for NM MIP. Chromatography confirms that molecular imprinting of CsPbBr3–PCL with NM provides two times more selective binding sites than 3–NT and four times more than NIP. This suggests that the molecular imprinting in NM MIP is higher than in 3-NT MIP, as shown in the surface topography (Fig. 3A). The sensing performance of 3-NT follows the order NM MIP > 3-NT MIP > NIP, which is consistent with the real-time kinetic results shown in Fig. 5B.
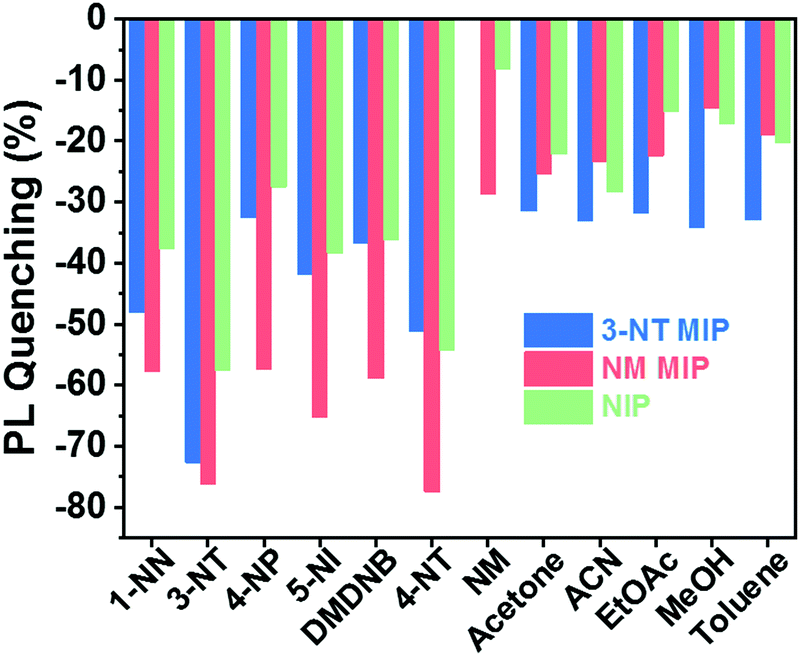
Fig. 7 shows the selective response of the NIP, 3-NT. MIP and NM MIP sensors to vapours of explosive taggants (3-NT, 4-NT, and DMDNB) and other NO2-containing molecules (4-NP, NM, 1-NN, and 5-NI) as well as to some common solvents (acetone, acetonitrile (ACN), ethyl acetate (EtOAc), methanol (MeOH), and toluene).
 | ||
| Fig. 7 Selectivity of the CsPbBr3–PCL sensor: 3-NT/NM MIP and NIP sensor response to different nitro-containing compounds and some common solvents after 180 s of exposure. | ||
Generally, the results show that 3-NT MIP (see Fig. S4 in ESI†) and NM MIP sensors interact more selectively with the explosive taggants and nitro-containing molecules than with common solvents. This trend is already observed for the NIP, but molecular imprinting significantly improves selectivity. This means that PCL shows specific permeability to nitro compounds. The NM analyte is an exception to this tendency. This low sensor response can be attributed to rapid analyte desorption from the CsPbBr3 NC surface due to the high volatility of NM. 3-NT MIP does not show sensitivity to NM.
The NM MIP sensor shows the highest response to nitro compounds, particularly when it is exposed to explosive taggants like 3-NT (76,3%) and 4-NT (77.5%). For the other nitro-containing analytes, the NM MIP exhibits a PL quenching of around 60%. In the case of NM, NM MIP shows remarkable selectivity to NM compared to NIP and 3-NT MIP sensors. In contrast, NM MIP shows a low affinity for common solvents, although NM MIP is the most porous sensor. On the other hand, 3-NT MIP shows a specific response to 3-NT (72.7%), whereas, for the rest of the nitro compounds, 3-NT MIP shows a similar response to that measured for NIP. This is especially striking for some compounds like 4-NT and 4-NP, which have similar sizes and shapes to 3-NT. The selectivity results confirm that molecular imprinting contributes to creating specific molecular recognition towards nitro compounds, more specifically 3-NT and 4-NP.
Conclusions
In the present study, we have developed two fluorescent MIP nanocomposites based on CsPbBr3 NCs embedded in PCL as a host matrix and 3-NT and NM as a template to sense and quantify trace amounts of 3-NT. Molecular imprinting takes place simultaneously during the baking step after the deposition. Both MIP sensors combine the high PL quantum yield of the CsPbBr3 NCs and the high selectivity provided by the MIP to show a higher quenching response (>75%) than our reference NIP sensors (>60%) after exposure to 3-NT for 3 min. Chromatography confirms that molecular imprinting of CsPbBr3–PCL with NM provides two times more selective binding sites than 3-NT and four times more than NIP. Surface topography also suggests that the molecular imprinting in NM MIP is higher than in 3-NT MIP. Consequently, our results show that 3-NT MIP and NM MIP sensors interact more selectively with the explosive taggants and nitro-containing molecules than with common solvents. This trend is already observed for the NIP, but molecular imprinting significantly improves the higher responsivity and selectivity. Particularly, NM MIP sensor exhibits the highest response to nitro compounds. These facts confirm that the specific recognition sites have been successfully generated, allowing a fast detection of 3-NT in the range of 2–3 s with a LOD as low as 0.218 μg mL−1.Conflicts of interest
There are no conflicts to declare.Acknowledgements
This work was supported through the NATO Science for Peace and Security Programme Project SPS (no. G5361). We acknowledge the support of the Spanish MINECO through projects: Retos-Colaboración 2016 Project Safetag (no. RTC-2016-5197-2) and Retos de la Sociedad Project Nirvana (no. PID2020-119628RB-C31) by MCIN/AEI/10.13039/501100011033. R. A. acknowledges the “Agencia Valenciana de la Innovació” for the Valorizació 2018 Project Hidronio (no. INNVAL10/18/032) and Valorizació 2021 Project CATIOX (no. INNVA1/2021/56). R. A. also thanks the Spanish MINECO for their Ramón y Cajal Fellowship (no. RYC-2015-18349). The authors would like to thank Dr Chegel and Dr Lopatynskyi for the fruitful discussions on XRD.References
- J. Ma, L. Lv, G. Zou and Q. Zhang, Fluorescent Porous Film Modified Polymer Optical Fiber via “Click” Chemistry: Stable Dye Dispersion and Trace Explosive Detection, ACS Appl. Mater. Interfaces, 2015, 7(1), 241–249, DOI:10.1021/am505950c.
- Z. Hu, S. Pramanik, K. Tan, C. Zheng, W. Liu, X. Zhang, Y. J. Chabal and J. Li, Selective, Sensitive, and Reversible Detection of Vapor-Phase High Explosives via Two-Dimensional Mapping: A New Strategy for MOF-Based Sensors, Cryst. Growth Des., 2013, 13(10), 4204–4207, DOI:10.1021/cg4012185.
- X. Sun, Y. Wang and Y. Lei, Fluorescence Based Explosive Detection: From Mechanisms to Sensory Materials, Chem. Soc. Rev., 2015, 44(22), 8019–8061, 10.1039/C5CS00496A.
- A. Roucou, I. Kleiner, M. Goubet, S. Bteich, G. Mouret, R. Bocquet, F. Hindle, W. L. Meerts and A. Cuisset, Towards the Detection of Explosive Taggants: Microwave and Millimetre-Wave Gas-Phase Spectroscopies of 3-Nitrotoluene, ChemPhysChem, 2018, 19, 1056–1067, DOI:10.1002/cphc.201701266.
- A. S. Loch, D. M. Stoltzfus, P. L. Burn and P. E. Shaw, High-Sensitivity Poly(Dendrimer)-Based Sensors for the Detection of Explosives and Taggant Vapors, Macromolecules, 2020, 53(5), 1652–1664, DOI:10.1021/acs.macromol.0c00060.
- Y. Salinas, R. Martínez-Máñez, M. D. Marcos, F. Sancenón, A. M. Costero, M. Parra and S. Gil, Optical Chemosensors and Reagents to Detect Explosives, Chem. Soc. Rev., 2012, 41, 1261–1296, 10.1039/C1CS15173H.
- M. S. Meaney and V. L. McGuffin, Luminescence-Based Methods for Sensing and Detection of Explosives, Anal. Bioanal. Chem., 2008, 391, 2557–2576, DOI:10.1007/s00216-008-2194-6.
- K. L. Hutchinson, D. M. Stoltzfus, P. L. Burn and P. E. Shaw, Luminescent Poly(Dendrimer)s for the Detection of Explosives, Mater. Adv., 2020, 1(4), 837–844, 10.1039/D0MA00249F.
- A. M. O’Mahony and J. Wang, Nanomaterial-Based Electrochemical Detection of Explosives: A Review of Recent Developments, Anal. Methods, 2013, 5(17), 4296, 10.1039/c3ay40636a.
- K. Furton, The Scientific Foundation and Efficacy of the Use of Canines as Chemical Detectors for Explosives, Talanta, 2001, 54(3), 487–500, DOI:10.1016/S0039-9140(00)00546-4.
- L. Barron and E. Gilchrist, Ion Chromatography-Mass Spectrometry: A Review of Recent Technologies and Applications in Forensic and Environmental Explosives Analysis, Anal. Chim. Acta, 2014, 806, 27–54, DOI:10.1016/j.aca.2013.10.047.
- R. Mu, H. Shi, Y. Yuan, A. Karnjanapiboonwong, J. G. Burken and Y. Ma, Fast Separation and Quantification Method for Nitroguanidine and 2,4-Dinitroanisole by Ultrafast Liquid Chromatography–Tandem Mass Spectrometry, Anal. Chem., 2012, 84(7), 3427–3432, DOI:10.1021/ac300306p.
- A. Hakonen, P. O. Andersson, M. Stenbæk Schmidt, T. Rindzevicius and M. Käll, Explosive and Chemical Threat Detection by Surface-Enhanced Raman Scattering: A Review, Anal. Chim. Acta, 2015, 893, 1–13, DOI:10.1016/j.aca.2015.04.010.
- K. Wells and D. A. Bradley, A Review of X-Ray Explosives Detection Techniques for Checked Baggage, Appl. Radiat. Isot., 2012, 70, 1729–1746, DOI:10.1016/j.apradiso.2012.01.011.
- X. Cetó, A. M. O’Mahony, J. Wang and M. del Valle, Simultaneous Identification and Quantification of Nitro-Containing Explosives by Advanced Chemometric Data Treatment of Cyclic Voltammetry at Screen-Printed Electrodes, Talanta, 2013, 107, 270–276, DOI:10.1016/j.talanta.2012.12.042.
- S. J. Toal and W. C. Trogler, Polymer Sensors for Nitroaromatic Explosives Detection, J. Mater. Chem., 2006, 16, 2871, 10.1039/b517953j.
- Z. Li, J. R. Askim and K. S. Suslick, The Optoelectronic Nose: Colorimetric and Fluorometric Sensor Arrays, Chem. Rev., 2019, 119, 231–292, DOI:10.1021/acs.chemrev.8b00226.
- E. Aznar-Gadea, P. J. Rodríguez-Canto, J. P. Martínez-Pastor, A. Lopatynskyi, V. Chegel and R. Abargues, Molecularly Imprinted Silver Nanocomposites for Explosive Taggant Sensing, ACS Appl. Polym. Mater., 2021, 3, 2960–2970, DOI:10.1021/acsapm.1c00116.
- Y. Yang, H. Wang, K. Su, Y. Long, Z. Peng, N. Li and F. Liu, A Facile and Sensitive Fluorescent Sensor Using Electrospun Nanofibrous Film for Nitroaromatic Explosive Detection, J. Mater. Chem., 2011, 21(32), 11895, 10.1039/c0jm04444j.
- S. J. Toal and W. C. Trogler, Polymer Sensors for Nitroaromatic Explosives Detection, J. Mater. Chem., 2006, 16(28), 2871, 10.1039/b517953j.
- N. Enkin, E. Sharon, E. Golub and I. Willner, Ag Nanocluster/DNA Hybrids: Functional Modules for the Detection of Nitroaromatic and RDX Explosives, Nano Lett., 2014, 14(8), 4918–4922, DOI:10.1021/nl502720s.
- Z. Hu, B. J. Deibert and J. Li, Luminescent Metal–Organic Frameworks for Chemical Sensing and Explosive Detection, Chem. Soc. Rev., 2014, 43(16), 5815–5840, 10.1039/C4CS00010B.
- K. L. Hutchinson, D. M. Stoltzfus, P. L. Burn and P. E. Shaw, Luminescent Poly(Dendrimer)s for the Detection of Explosives, Mater. Adv., 2020, 1, 837–844, 10.1039/D0MA00249F.
- W. J. Peveler, A. Roldan, N. Hollingsworth, M. J. Porter and I. P. Parkin, Multichannel Detection and Differentiation of Explosives with a Quantum Dot Array, ACS Nano, 2016, 10(1), 1139–1146, DOI:10.1021/acsnano.5b06433.
- Y. Ma, S. Wang and L. Wang, Nanomaterials for Luminescence Detection of Nitroaromatic Explosives, TrAC, Trends Anal. Chem., 2015, 65, 13–21, DOI:10.1016/j.trac.2014.09.007.
- J. S. Manser, J. A. Christians and P. V. Kamat, Intriguing Optoelectronic Properties of Metal Halide Perovskites, Chem. Rev., 2016, 116(21), 12956–13008, DOI:10.1021/acs.chemrev.6b00136.
- D. Yang, M. Cao, Q. Zhong, P. Li, X. Zhang and Q. Zhang, All-Inorganic Cesium Lead Halide Perovskite Nanocrystals: Synthesis, Surface Engineering and Applications, J. Mater. Chem. C, 2019, 7(4), 757–789, 10.1039/C8TC04381G.
- Y. Zhou and N. P. Padture, Gas-Induced Formation/Transformation of Organic–Inorganic Halide Perovskites, ACS Energy Lett., 2017, 2(9), 2166–2176, DOI:10.1021/acsenergylett.7b00667.
- G. Kakavelakis, E. Gagaoudakis, K. Petridis, V. Petromichelaki, V. Binas, G. Kiriakidis and E. Kymakis, Solution Processed CH 3 NH 3 PbI 3– x Cl x Perovskite Based Self-Powered Ozone Sensing Element Operated at Room Temperature, ACS Sens., 2018, 3(1), 135–142, DOI:10.1021/acssensors.7b00761.
- M.-A. Stoeckel, M. Gobbi, S. Bonacchi, F. Liscio, L. Ferlauto, E. Orgiu and P. Samorì, Reversible, Fast, and Wide-Range Oxygen Sensor Based on Nanostructured Organometal Halide Perovskite, Adv. Mater., 2017, 29(38), 1702469, DOI:10.1002/adma.201702469.
- W. Sun, C. Huang, R. Fan, S. Liu, Y. Wang, Y. Xiao, Q. Gan, S. Xiao and Q. Song, On-Chip-Integrated Methylammonium Halide Perovskite Optical Sensors, Adv. Opt. Mater., 2019, 7(6), 1801308, DOI:10.1002/adom.201801308.
- W. Xu, F. Li, Z. Cai, Y. Wang, F. Luo and X. Chen, An Ultrasensitive and Reversible Fluorescence Sensor of Humidity Using Perovskite CH 3 NH 3 PbBr 3, J. Mater. Chem. C, 2016, 4(41), 9651–9655, 10.1039/C6TC01075J.
- K. Ren, L. Huang, S. Yue, S. Lu, K. Liu, M. Azam, Z. Wang, Z. Wei, S. Qu and Z. Wang, Turning a Disadvantage into an Advantage: Synthesizing High-Quality Organometallic Halide Perovskite Nanosheet Arrays for Humidity Sensors, J. Mater. Chem. C, 2017, 5(10), 2504–2508, 10.1039/C6TC05165K.
- X. Sheng, Y. Liu, Y. Wang, Y. Li, X. Wang, X. Wang, Z. Dai, J. Bao and X. Xu, Cesium Lead Halide Perovskite Quantum Dots as a Photoluminescence Probe for Metal Ions, Adv. Mater., 2017, 29(37), 1700150, DOI:10.1002/adma.201700150.
- S. Ruan, J. Lu, N. Pai, H. Ebendorff-Heidepriem, Y.-B. Cheng, Y. Ruan and C. R. McNeill, An Optical Fibre-Based Sensor for the Detection of Gaseous Ammonia with Methylammonium Lead Halide Perovskite, J. Mater. Chem. C, 2018, 6(26), 6988–6995, 10.1039/C8TC01552J.
- J. Chen, Z.-H. Mo, X. Yang, H.-L. Zhou and Q. Gao, Exploration of Organic–Inorganic Hybrid Perovskites for Surface-Enhanced Infrared Spectroscopy of Small Molecules, Chem. Commun., 2017, 53(51), 6949–6952, 10.1039/C7CC02782F.
- J. Shamsi, A. S. Urban, M. Imran, L. De Trizio and L. Manna, Metal Halide Perovskite Nanocrystals: Synthesis, Post-Synthesis Modifications, and Their Optical Properties, Chem. Rev., 2019, 119(5), 3296–3348, DOI:10.1021/acs.chemrev.8b00644.
- X. Chen, C. Sun, Y. Liu, L. Yu, K. Zhang, A. M. Asiri, H. M. Marwani, H. Tan, Y. Ai, X. Wang and S. Wang, All-Inorganic Perovskite Quantum Dots CsPbX3 (Br/I) for Highly Sensitive and Selective Detection of Explosive Picric Acid, Chem. Eng. J., 2020, 379(May 2019), 122360, DOI:10.1016/j.cej.2019.122360.
- X. Shan, S. Zhang, M. Zhou, T. Geske, M. Davis, A. Hao, H. Wang and Z. Yu, Porous Halide Perovskite–Polymer Nanocomposites for Explosive Detection with a High Sensitivity, Adv. Mater. Interfaces, 2019, 6(3), 1801686, DOI:10.1002/admi.201801686.
- B. Zu, Y. Guo and X. Dou, Nanostructure-Based Optoelectronic Sensing of Vapor Phase Explosives – a Promising but Challenging Method, Nanoscale, 2013, 5(22), 10693, 10.1039/c3nr03792d.
- P.-C. Chen, S. Sukcharoenchoke, K. Ryu, L. Gomez de Arco, A. Badmaev, C. Wang and C. Zhou, 2,4,6-Trinitrotoluene (TNT) Chemical Sensing Based on Aligned Single-Walled Carbon Nanotubes and ZnO Nanowires, Adv. Mater., 2010, 22(17), 1900–1904, DOI:10.1002/adma.200904005.
- Y. Che, X. Yang, G. Liu, C. Yu, H. Ji, J. Zuo, J. Zhao and L. Zang, Ultrathin N-Type Organic Nanoribbons with High Photoconductivity and Application in Optoelectronic Vapor Sensing of Explosives, J. Am. Chem. Soc., 2010, 132(16), 5743–5750, DOI:10.1021/ja909797q.
- C. Muthu, S. R. Nagamma and V. C. Nair, Luminescent Hybrid Perovskite Nanoparticles as a New Platform for Selective Detection of 2,4,6-Trinitrophenol, RSC Adv., 2014, 4(99), 55908–55911, 10.1039/C4RA07884E.
- J. R. Harwell, J. M. E. Glackin, N. J. L. K. Davis, R. N. Gillanders, D. Credgington, G. A. Turnbull and I. D. W. Samuel, Sensing of Explosive Vapor by Hybrid Perovskites: Effect of Dimensionality, APL Mater., 2020, 8(7), 071106, DOI:10.1063/5.0011229.
- Y. Ma, S. Xu, S. Wang and L. Wang, Luminescent Molecularly-Imprinted Polymer Nanocomposites for Sensitive Detection, TrAC, Trends Anal. Chem., 2015, 67, 209–216, DOI:10.1016/j.trac.2015.01.012.
- Y. Zhang, J. Zhang and Q. Liu, Gas Sensors Based on Molecular Imprinting Technology, Sensors, 2017, 17(7), 1567, DOI:10.3390/s17071567.
- S. Huang, M. Guo, J. Tan, Y. Geng, J. Wu, Y. Tang, C. Su, C. C. Lin and Y. Liang, Novel Fluorescence Sensor Based on All-Inorganic Perovskite Quantum Dots Coated with Molecularly Imprinted Polymers for Highly Selective and Sensitive Detection of Omethoate, ACS Appl. Mater. Interfaces, 2018, 10(45), 39056–39063, DOI:10.1021/acsami.8b14472.
- L. Protesescu, S. Yakunin, M. I. Bodnarchuk, F. Krieg, R. Caputo, C. H. Hendon, R. X. Yang, A. Walsh and M. V. Kovalenko, Nanocrystals of Cesium Lead Halide Perovskites (CsPbX3, X = Cl, Br, and I): Novel Optoelectronic Materials Showing Bright Emission with Wide Color Gamut, Nano Lett., 2015, 15(6), 3692–3696, DOI:10.1021/nl5048779.
- Y. Zhao, Y. Ma, H. Li and L. Wang, Composite QDs@MIP Nanospheres for Specific Recognition and Direct Fluorescent Quantification of Pesticides in Aqueous Media, Anal. Chem., 2012, 84(1), 386–395, DOI:10.1021/ac202735v.
- V. Guarino; G. Gentile; L. Sorrentino and L. Ambrosio, in Encyclopedia of Polymer Science and Technology, Polycaprolactone: Synthesis, Properties, and Applications, John Wiley & Sons, Inc., Hoboken, NJ, USA, 2017, pp. 1–36 DOI:10.1002/0471440264.pst658.
- S. Salmieri and M. Lacroix, Physicochemical Properties of Alginate/Polycaprolactone-Based Films Containing Essential Oils, J. Agric. Food Chem., 2006, 54(26), 10205–10214, DOI:10.1021/jf062127z.
- Y. Lan, Y. Wang and Y. Song, Efficient Flexible Perovskite Solar Cells Based on a Polymer Additive, Flexible Printed Electron., 2020, 5(1), 014001, DOI:10.1088/2058-8585/ab5ce3.
- M. Yusoff, A. R. Bin, M. Vasilopoulou, D. G. Georgiadou, L. C. Palilis, A. Abate and M. K. Nazeeruddin, Passivation and Process Engineering Approaches of Halide Perovskite Films for High Efficiency and Stability Perovskite Solar Cells, Energy Environ. Sci., 2021, 14(5), 2906–2953, 10.1039/D1EE00062D.
- Y. Wang, Z. Zhang, M. Tao, Y. Lan, M. Li, Y. Tian and Y. Song, Interfacial Modification towards Highly Efficient and Stable Perovskite Solar Cells, Nanoscale, 2020, 12(36), 18563–18575, 10.1039/D0NR05136E.
- S. N. Gorodzha, M. A. Surmeneva and R. A. Surmenev, Fabrication and Characterization of Polycaprolactone Cross- Linked and Highly-Aligned 3-D Artificial Scaffolds for Bone Tissue Regeneration via Electrospinning Technology, IOP Conf. Ser.: Mater. Sci. Eng., 2015, 98(1), 012024, DOI:10.1088/1757-899X/98/1/012024.
- E. J. Lee, D.-H. Kim, R. P. H. Chang and D.-K. Hwang, Induced Growth of CsPbBr 3 Perovskite Films by Incorporating Metal Chalcogenide Quantum Dots in PbBr 2 Films for Performance Enhancement of Inorganic Perovskite Solar Cells, ACS Appl. Energy Mater., 2020, 3(11), 10376–10383, DOI:10.1021/acsaem.0c01152.
- H. Pashaei Adl, S. Gorji, G. Muñoz-Matutano, R. I. Sánchez-Alarcón, R. Abargues, A. F. Gualdrón-Reyes, I. Mora-Seró and J. P. Martínez-Pastor, Homogeneous and Inhomogeneous Broadening in Single Perovskite Nanocrystals Investigated by Micro-Photoluminescence, J. Lumin., 2021, 240, 1–8, DOI:10.1016/j.jlumin.2021.118453.
- W. Zhu, S. Tao, C. Tao, W. Li, C. Lin, M. Li, Y. Wen and G. Li, Hierarchically Imprinted Porous Films for Rapid and Selective Detection of Explosives, Langmuir, 2011, 27(13), 8451–8457, DOI:10.1021/la201055b.
- H. S. Geethanjali, D. Nagaraja, R. M. Melavanki and R. A. Kusanur, Fluorescence Quenching of Boronic Acid Derivatives by Aniline in Alcohols – A Negative Deviation from Stern–Volmer Equation, J. Lumin., 2015, 167, 216–221, DOI:10.1016/j.jlumin.2015.06.040.
- R. Abargues, J. Navarro, P. J. Rodríguez-Cantó, A. Maulu, J. F. Sánchez-Royo and J. P. Martínez-Pastor, Enhancing the Photocatalytic Properties of PbS QD Solids: The Ligand Exchange Approach, Nanoscale, 2019, 11(4), 1978–1987, 10.1039/C8NR07760F.
- W. Tan, Q. Yu, X. Ruan and X. Huang, Design of SnO2-Based Highly Sensitive Ethanol Gas Sensor Based on Quasi Molecular-Cluster Imprinting Mechanism, Sens. Actuators, B, 2015, 212, 47–54, DOI:10.1016/j.snb.2015.01.035.
Footnote |
| † Electronic supplementary information (ESI) available. See DOI: 10.1039/d1tc05169e |
| This journal is © The Royal Society of Chemistry 2022 |