A covalent organic polymer for turn-on fluorescence sensing of hydrazine†
Jiangpeng
Wang‡
a,
Canran
Wang‡
a,
Shan
Jiang
ab,
Wenyue
Ma
a,
Bin
Xu
 a,
Leijing
Liu
*a and
Wenjing
Tian
 *a
*a
aState Key Laboratory of Supramolecular Structure and Materials, Jilin University, Changchun 130012, P. R. China. E-mail: liuleijing@jlu.edu.cn; wjtian@jlu.edu.cn
bCollege of Chemistry and Chemical Engineering Liaoning Normal University, Dalian 116029, P. R. China
First published on 15th December 2021
Abstract
It is very important to detect hydrazine sensitively, efficiently, and selectively since hydrazine is a highly toxic organic molecule which will bring great threat to the health of human beings. Herein, a covalent organic polymer, COP-Ta, containing ynone reaction sites has been designed and successfully synthesized via the Sonogashira coupling reaction by using tetrakis(4-ethynylphenyl)ethene (TPE-Al) and terephthaloyl chloride (TPC). COP-Ta exhibits weak fluorescence in the solid state and uniform dispersion of ethanol. But when hydrazine is added into the uniform dispersion of ethanol, the fluorescence of the dispersion is significantly enhanced due to the chemical reaction between the ynone structure in COP-Ta and hydrazine, in which the ynone structure cyclizes to pyrazole, leading to the restriction of the intramolecular charge transfer effect, and the obvious increase of fluorescence from COP-Ta. As a turn-on fluorescence sensor for the detection of hydrazine, COP-Ta shows a high sensitivity (detection limit: 0.16 μM), a wide linear range (0–50 μM), and a high selectivity. COP-Ta can detect hydrazine under weakly acidic, neutral, and weakly alkaline conditions in aqueous solutions. In addition, COP-Ta has been applied to detect hydrazine in real water samples. More importantly, we have successfully applied this sensor for the detection of hydrazine in human blood serum, and achieved satisfactory detection performance. This demonstrates that the fluorescent covalent organic polymer containing the ynone structure can be used for the detection of hydrazine effectively and applied in the field of environmental protection.
1. Introduction
Hydrazine is an important chemical raw material with strong reducing properties. However, hydrazine is highly toxic. Although endogenous hydrazine cannot be produced in the human body, it can easily enter the human body through the eyes, mouth, and skin in the process of manufacture, transportation, and use of hydrazine. Hydrazine can seriously damage the liver, kidneys, lungs, and the human central nervous system, and even worse, it can cause cancer.1–4 Therefore, it is particularly important to develop a sensitive, efficient, and selective method for the detection of trace hydrazine.Traditionally, hydrazine is mainly detected by spectrophotometry,5 chemical titration,6 and an electrochemical method.7 However, these methods are complex in operation, of high cost, and time-consuming. In contrast, fluorescence spectroscopy has the advantages of simple operation, low cost, high sensitivity, small error, and rapid detection,8 and has a wide range of applications in the detection of metal ions, anions and biomolecules.9–12 So far, a variety of fluorescent probes, such as coumarin-,2,13,14 naphthalimide-,15 pyrazoline-,16,17 benzothiazole-,18 BODIPY-,19 fluorescein-,20,21 pyrene-,22 anthracene-,22 carbazole-,23 and flavone-based24 derivatives, have been developed for hydrazine detection. However, these fluorescent probes are low molar mass molecules. Fluorescent covalent organic polymers are promising candidates as fluorescent sensors due to their amplified response and superior sensitivity to analytes compared with low molar mass congeners,25 and their wide source, high thermal stability, and easily adjustable functions. There are some polymer-based fluorescent sensors for hydrazine.25–29 For example, in 2006, Swager and coworkers innovatively presented an amplified turn-on sensory scheme for hydrazine vapor using fluorescent conjugated polymers based on poly(phenylene ethynylene)s.26 In 2013, Tang's group developed a conjugated polymer containing the ynone structure for the detection of hydrazine, in which the ynone unit can react with hydrazine to change its electronic properties and emission behavior, and realize the sensing of hydrazine.25 In 2019, Rasheed et al. developed an alternating copolymer-based vesicle sensor polyethylene glycol diglycidyle ether-alt-dimercaptosuccinic acid grafted with rhodol (PEGDG-a-DMSA-g-RL) for the selective, sensitive and visual detection of hydrazine.27 In 2020, Feng and coworkers reported a highly sensitive conjugated polymer–copper(II) composite fluorescent sensor for detecting hydrazine in aqueous solutions with a detection limit of 0.54 nM, and a linear range of 0–0.07 μM.28 In addition, Rasheed et al. reported a polymersome-based sensor for the visual detection and quantification of hydrazine in water with a limit of detection value of 2 nM, and a linear range of 0–12 μM.29
Currently, although some fluorescent sensors based on polymers for hydrazine detection have been developed and achieved attractive progress, it is still necessary to further optimize the sensing performance and explore the detection mechanism. Moreover, the preparation process of most reported hydrazine detection sensors based on fluorescent covalent organic polymers is somewhat complex. Herein, we have designed and synthesized a new ynone-linked covalent organic polymer, COP-Ta, which has reactive sites in four extension directions of the tetraphenylethene (TPE) group for the detection of hydrazine. The sensor based on COP-Ta shows a high sensitivity, wide linear range, high selectivity, and fast response time. It can detect hydrazine under various conditions including weakly acidic, neutral, and weakly alkaline conditions in aqueous solutions. In addition, this sensor can detect hydrazine in real water samples. Furthermore, COP-Ta has been successfully applied to detect hydrazine in blood serum. These results indicate that COP-Ta shows great potential as a fluorescence sensor for the detection of hydrazine in aqueous solutions.
2. Experimental section
2.1 Materials
Tetra-(4-bromobenzene) ethylene was purchased from Shanghai Tensus Biotech Co., Ltd. Cuprous iodide, bis(triphenylphosphine)palladium(II) chloride, isoamide, hydroxylamine, triethylamine, and diisopropylamine were provided by Energy Chemical (Shanghai). Hydrazine hydrate (N2H4·H2O) was obtained from Sigma Aldrich. All the chemicals were used as received without any further purification.2.2 Characterization
The 1H NMR spectra were recorded at 298 K with a Bruker Avance III 510 spectrometer (500 MHz, Germany) using CDCl3 and deuterated DMSO as the solvent and tetrame-thylsilane (TMS) as the internal standard. Solid-state 1H and 13C NMR spectra were recorded with a BRUKER Avance NEO 600WB spectrometer using a cross-polarization magic angle rotation technology (CP/MAS). UV-vis absorption spectra were recorded with a Shimadzu UV-2550 spectrophotometer (Japan). Fluorescence spectra were acquired with a Shimadzu RF-5301 PC spectrometer. Quantum yields were measured using an integrating sphere (diameter, 150 mm), with a 365 nm excitation source (FLS980, Edinburgh Inc.). The time-of-flight mass spectra were measured using an Autoflex speed TOF/TOF mass system. The GC-MS spectra were recorded using an ITQ1100 mass system (Thermo Fisher). Fourier transform infrared (FTIR) spectra were recorded with a Vertex 80V spectrometer (Germany), using potassium bromide as the substrate. Scanning electron microscopy (SEM) images were obtained using a scanning electron microscope (SEM) (JEOL JSM 6700F, Japan). Transmission electron microscopy (TEM) images were obtained using a JEM-2100F instrument with an accelerating voltage of 200 kV. Powder X-Ray diffraction patterns were obtained using a Riguku D/MAX2550 diffractometer with Cu Ka radiation under the conditions of 40 kV and 200 mA. Thermogravimetric analysis (TGA) was performed with a Q500 thermal analyzer system at a heating rate of 10 °C min−1 from room temperature to 800 °C in a N2 atmosphere.2.3 Synthesis
![[thin space (1/6-em)]](https://www.rsc.org/images/entities/char_2009.gif) :
:![[thin space (1/6-em)]](https://www.rsc.org/images/entities/char_2009.gif) 5 V/V) as the eluent. The white product TPE-(Si)4 was obtained in a yield of about 85%. TPE-(Si)4 was well characterized by 1H NMR and MALDI-TOF MS analysis (Fig. S1 and S2, ESI†). 1H NMR (500 MHz, d-CDCl3) δ (TMS, ppm): 7.21–7.19 (d, J = 10 Hz, 8H), 6.89–6.88 (d, J = 5 Hz, 8H), 0.23 (s, 36H). MALDI-TOF MS calcd for TPE-(Si)4: 717.26, found: 717.01.
5 V/V) as the eluent. The white product TPE-(Si)4 was obtained in a yield of about 85%. TPE-(Si)4 was well characterized by 1H NMR and MALDI-TOF MS analysis (Fig. S1 and S2, ESI†). 1H NMR (500 MHz, d-CDCl3) δ (TMS, ppm): 7.21–7.19 (d, J = 10 Hz, 8H), 6.89–6.88 (d, J = 5 Hz, 8H), 0.23 (s, 36H). MALDI-TOF MS calcd for TPE-(Si)4: 717.26, found: 717.01.
![[thin space (1/6-em)]](https://www.rsc.org/images/entities/char_2009.gif) :
:![[thin space (1/6-em)]](https://www.rsc.org/images/entities/char_2009.gif) 3 V/V) as the eluent to give a light yellow product with a yield of about 80%. TPE-Al was well characterized by 1H NMR and MALDI-TOF MS analysis (Fig. S3 and S4, ESI†). 1H NMR (500 MHz, d-CDCl3) δ (TMS, ppm): 7.29–7.27 (d, J = 10 Hz, 8H), 6.97–6.96 (d, J = 5 Hz, 8H), 4.19 (s, 4H). MALDI-TOF MS calcd for TPE-Al: 428.53, Found: 428.11.
3 V/V) as the eluent to give a light yellow product with a yield of about 80%. TPE-Al was well characterized by 1H NMR and MALDI-TOF MS analysis (Fig. S3 and S4, ESI†). 1H NMR (500 MHz, d-CDCl3) δ (TMS, ppm): 7.29–7.27 (d, J = 10 Hz, 8H), 6.97–6.96 (d, J = 5 Hz, 8H), 4.19 (s, 4H). MALDI-TOF MS calcd for TPE-Al: 428.53, Found: 428.11.
2.4 Sensing
3. Results and discussion
3.1 Synthesis and characterization
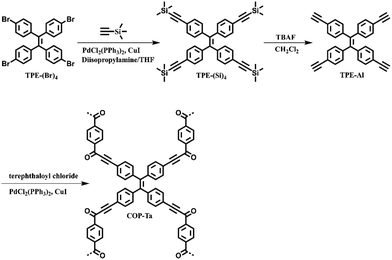
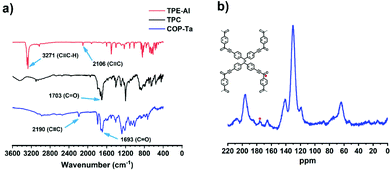
The synthesis procedure of COP-Ta is depicted in Scheme 1. COP-Ta was synthesized from tetrakis(4-ethynylphenyl)ethene (TPE-Al) and terephthaloyl chloride (TPC) via the Sonogashira coupling reaction. In order to verify the chemical structure of the as-prepared ynone-linked polymer, FT-IR and solid-state 13C NMR spectra were recorded. COP-Ta exhibits characteristic bands corresponding to C![[double bond, length as m-dash]](https://www.rsc.org/images/entities/char_e001.gif) O and C
O and C![[triple bond, length as m-dash]](https://www.rsc.org/images/entities/char_e002.gif) C stretching vibrations at 1693 cm−1 and 2190 cm−1 (Fig. 1a), respectively, implying that the Sonogashira coupling reaction occurred between TPE-Al and TPC. The 13C cross-polarization magic-angle spinning (CP/MAS) solid-state NMR spectra was also used to confirm the presence of carbonyl carbon, which gives the characteristic signal for the C
C stretching vibrations at 1693 cm−1 and 2190 cm−1 (Fig. 1a), respectively, implying that the Sonogashira coupling reaction occurred between TPE-Al and TPC. The 13C cross-polarization magic-angle spinning (CP/MAS) solid-state NMR spectra was also used to confirm the presence of carbonyl carbon, which gives the characteristic signal for the C![[double bond, length as m-dash]](https://www.rsc.org/images/entities/char_e001.gif) O bond at 176.09 ppm (Fig. 1b).
O bond at 176.09 ppm (Fig. 1b).
From the PXRD pattern, it can be observed that there is no obvious crystallization peak, indicating that COP-Ta is an amorphous polymer (Fig. S5, ESI†). The morphology of COP-Ta was characterized by SEM and TEM. The images demonstrate that COP-Ta possesses a random block morphology (Fig. S6a, ESI†) and a flaky stacking structure (Fig. S6b, ESI†). Moreover, the results of TGA show that the polymer has an excellent thermal stability (Fig. S7, ESI†).
3.2 Photophysical properties
Fig. 2 shows the UV absorption spectrum of COP-Ta in the solid state (Fig. 2a) and the fluorescence spectra in the solid state and dispersed in ethanol (Fig. 2b). COP-Ta exhibits a wide UV absorption band with the maximum located at 464 nm in the solid state. The fluorescence spectrum of COP-Ta in the solid state displays a maximum emission peak at 620 nm, showing weak reddish-brown fluorescence. Compared with the solid-state fluorescence spectrum, the spectrum of COP-Ta dispersed in ethanol shows a blue-shifted emission band with the emission peak at 543 nm, which results from the relatively weaker intermolecular interaction and aggregation effect.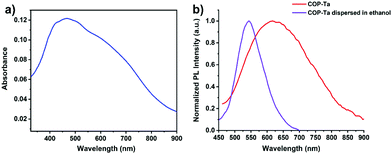 | ||
| Fig. 2 (a) The UV absorption spectrum of COP-Ta in the solid state. (b) Fluorescence spectra of COP-Ta in the solid state (red) and dispersed in ethanol (purple), respectively (λex = 365 nm). | ||
3.3 Fluorescence sensing for hydrazine
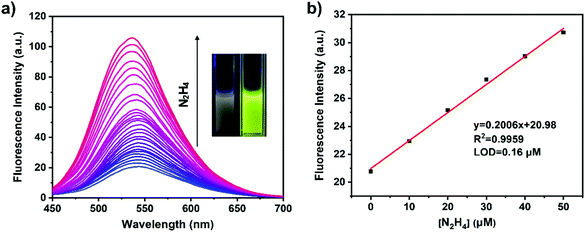
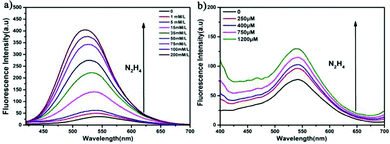
Because the ynone structure of COP-Ta can interact with hydrazine, COP-Ta is competent for the detection of hydrazine. In order to explore the recognition performance of hydrazine, the titration experiments of COP-Ta for hydrazine were carried out. As described in Fig. 3a, with the increase of hydrazine concentration from 0 to 200 mM, the fluorescence emission peak of COP-Ta suspension blue shifts from 543 to 534 nm, and the emission intensity increases gradually. A noticeable fluorescence change could be observed with the naked eye under a portable UV lamp (with λex = 365 nm). Moreover, when the very low concentration of 10 μM hydrazine solution was added, the fluorescence intensity of COP-Ta suspension increased significantly, indicating that COP-Ta has a high sensitivity to hydrazine. It is noteworthy that in a low concentration range of hydrazine solution, the fluorescence intensity of COP-Ta suspension increased obviously and rapidly with the increase of hydrazine concentration, until the concentration of hydrazine reached 1.5 mM, which indicates that COP-Ta has a good sensitivity for the detection of trace hydrazine. In addition, from the linear relationship between the fluorescence emission intensity of COP-Ta suspension at 543 nm and the hydrazine concentration (Fig. 3b), it can be clearly seen that the fluorescence intensity of COP-Ta shows a favorable linear relationship with the concentration of hydrazine solution in the hydrazine concentration range of 0–50 μM. The calculated detection limit of COP-Ta for hydrazine is as low as 0.16 μM, which is lower than the threshold limit value (10 ppb, 0.3125 μM) given by USEPA (United States Environmental Protection Agency). Furthermore, the quantum yield of COP-Ta before and after hydrazine addition has also been measured, and it was increased from 1.89% (before hydrazine addition) to 5.96% (after hydrazine addition).Table 1 shows the comparison between the COP-Ta based sensor and other reported fluorescent sensors based on polymers for hydrazine detection. Compared with other reported fluorescent sensors for hydrazine, the sensor developed by this work shows a decent detection limit, linear range of concentration values, and sensing range of pH, indicating that the fluorescent sensor based on COP-Ta has a satisfactory performance for hydrazine detection.
| Sensors | Detection limit (μM) | Linear range (μM) | Sensing range of pH | Ref. |
|---|---|---|---|---|
| Poly(arylene ynonylene) | — | — | — | 25 |
| An alternating copolymer-based vesicle sensor | 3.0 × 10⁻³ | 0–10 | Distilled and raw water | 27 |
| PPE-DPA-Cu2+ | 5.4 × 10⁻⁴ | 0–0.07 | 2–10 | 28 |
| Rhodol-conjugated polymersome | 2.0 × 10⁻³ | 0–12 | 6–12 | 29 |
| COP-Ta | 0.16 | 0–50 | 4–10 | This work |
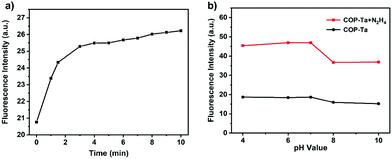
Time-dependent fluorescence changes of COP-Ta upon the addition of 50 μM hydrazine were investigated to further explore the sensing properties of COP-Ta. As shown in Fig. 4a, the fluorescence intensity of COP-Ta increases rapidly within 3 minutes, and then very slowly, and the reaction nearly reaches completion within 4 min. With the extension of reaction time, the fluorescence intensity tends to be flat after 8 minutes, and hardly increases up to 10 minutes. These data show the rapidity and sensitivity of COP-Ta for the detection of hydrazine.
Considering that the sensing performance of COP-Ta may be affected by the acidity and alkalinity of the solution, the influence of pH value on the fluorescence intensity of COP-Ta was investigated. As shown in Fig. 4b, the fluorescence intensity of COP-Ta has almost no change in the pH range from 4 to 10, which shows that COP-Ta has excellent pH stability. However, after adding hydrazine, the fluorescence intensity of COP-Ta significantly increases in the pH range of 4–10 compared with that before adding hydrazine, indicating that COP-Ta also shows better pH stability in terms of the response of hydrazine. Because the TPE and ynone groups of COP-Ta and the pyrazole group generated by the reaction after hydrazine addition are not easy to hydrolyze, the sensor based on COP-Ta can resist pH variation.
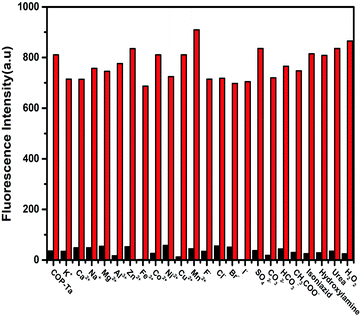
Because when COP-Ta is used for the detection of hydrazine in water, it may be interfered by other impurity components in water, such as metal ions, anions, and some common nitrogen-containing compounds, which can cause large deviations in the experimental results. Therefore, we selected some common metal cations, anions, and structural analogues of hydrazine as interfering components to explore the anti-interference and specific recognition performance of COP-Ta for hydrazine sensing. As indicated in Fig. 5, the fluorescence emission intensity of COP-Ta nearly does not change after the addition of various interfering components (black bar), indicating that COP-Ta has almost no response to these common interfering components in water. However, the addition of hydrazine led to a significant enhancement of fluorescent intensity (red bar), which proved that COP-Ta has high sensitivity and specific recognition ability for hydrazine detection. These results indicated that COP-Ta shows great potential as a fluorescence sensor for the detection of hydrazine in aqueous solutions.
3.4 Detection of hydrazine in real water and serum
To evaluate the feasibility of the probe COP-Ta to detect hydrazine in practical applications, we collected water samples from Qing Lake in Jilin University and human blood serum from the First Hospital of Jilin University. Real water samples were passed through a microfiltration membrane prior to the detection experiments. The serum was dissolved in 0.2 M PBS buffer solution. Then, the titration experiments of the probe COP-Ta to detect hydrazine were carried out in real water and human blood serum by adding different concentrations of hydrazine solutions into the samples under the same conditions. Fig. 6 shows the fluorescence response of COP-Ta at different hydrazine concentrations in real water and serum. It can be observed that with the increasing concentration of hydrazine, the fluorescence intensity of the systems increased steadily. The detection limits were calculated to be 0.68 mM and 37 μM, respectively. These results suggest that the probe can be potentially used for the detection of hydrazine in environmental water and biological fluid samples.3.5 Sensing mechanism for hydrazine
FT-IR and solid-state 13C NMR spectra of COP-Ta were recorded before and after adding hydrazine to explore the sensing mechanism of COP-Ta for hydrazine. As presented in Fig. 7a, the characteristic bands corresponding to C![[double bond, length as m-dash]](https://www.rsc.org/images/entities/char_e001.gif) O and C
O and C![[triple bond, length as m-dash]](https://www.rsc.org/images/entities/char_e002.gif) C stretching vibrations at 1647 cm−1 and 2190 cm−1 disappear after adding hydrazine. However, two new characteristic vibration bands appear at 3429 cm−1 and 1695 cm−1, which are assigned to NH and C
C stretching vibrations at 1647 cm−1 and 2190 cm−1 disappear after adding hydrazine. However, two new characteristic vibration bands appear at 3429 cm−1 and 1695 cm−1, which are assigned to NH and C![[double bond, length as m-dash]](https://www.rsc.org/images/entities/char_e001.gif) N. These results indicated that the ynone structure of COP-Ta had fully reacted with hydrazine.
N. These results indicated that the ynone structure of COP-Ta had fully reacted with hydrazine.
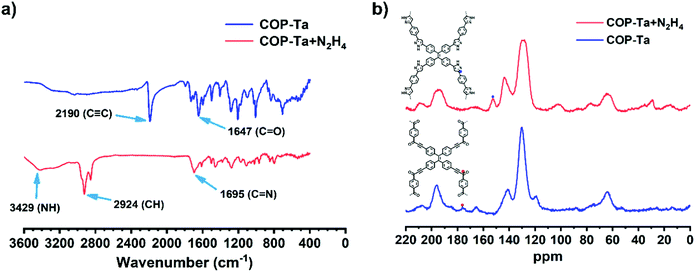 | ||
| Fig. 7 (a) FT-IR spectra and (b) solid-state 13C CP-MAS NMR of COP-Ta with (red) and without (blue) the addition of hydrazine. | ||
Moreover, from the comparison of 13C NMR spectra of COP-Ta before and after adding hydrazine (Fig. 7b), it can be found that the signal of the C![[double bond, length as m-dash]](https://www.rsc.org/images/entities/char_e001.gif) N bond at 153 ppm appears, which belongs to the C
N bond at 153 ppm appears, which belongs to the C![[double bond, length as m-dash]](https://www.rsc.org/images/entities/char_e001.gif) N bond of the substance after the addition of hydrazine. However, the signal peak at 176 ppm belonging to the C
N bond of the substance after the addition of hydrazine. However, the signal peak at 176 ppm belonging to the C![[double bond, length as m-dash]](https://www.rsc.org/images/entities/char_e001.gif) O bond of COP-Ta disappears. The solid-state 1H NMR spectrum of COP-Ta after hydrazine addition was also investigated (Fig. S8, ESI†), and the chemical shift in high field indicates the occurrence of the reaction between COP-Ta and hydrazine. These results further proved that the ynone structure in COP-Ta had completely reacted with hydrazine, and produced a new structure with the pyrazole group.
O bond of COP-Ta disappears. The solid-state 1H NMR spectrum of COP-Ta after hydrazine addition was also investigated (Fig. S8, ESI†), and the chemical shift in high field indicates the occurrence of the reaction between COP-Ta and hydrazine. These results further proved that the ynone structure in COP-Ta had completely reacted with hydrazine, and produced a new structure with the pyrazole group.
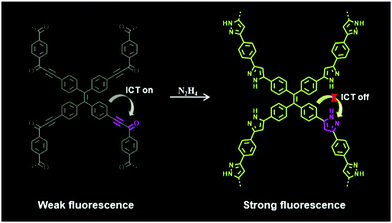
According to the data of FT-IR and 13C NMR, a reasonable detection mechanism of COP-Ta toward hydrazine is shown in Fig. 8. Because COP-Ta contains two groups – the electron-rich group TPE and the electron-withdrawing group ynone – the strong ICT process in COP-Ta leads to the quenched fluorescence of COP-Ta either in solid or ethanol suspension. In the presence of hydrazine, the ynone group in COP-Ta cyclizes to the electron-donating group pyrazole, which inhibits the ICT process from TPE to pyrazole, resulting in a significantly enhanced fluorescence.
4. Conclusions
In summary, we have synthesized a covalent organic polymer containing the TPE group and ynone structure, and successfully realized the selective and rapid sensing of hydrazine. The as-synthesized COP-Ta shows weak fluorescence in both solid and ethanol suspension, but exhibits a highly selective and sensitive luminescence response toward hydrazine in water. The fluorescence of COP-Ta turns on due to the inhibition of the ICT process in COP-Ta after the addition of hydrazine. Moreover, the presence of interfering components in water cannot affect its detection process, proving its potential as a turn-on fluorescence sensor for the detection of hydrazine. We applied this sensor for the detection of hydrazine in real water and human blood serum, and achieved satisfactory detection performance. The excellent selectivity and sensitivity are assigned to the interaction between hydrazine and the ynone structure, which has been confirmed by the results of FT-IR and solid-state 13C NMR. This work provides an effective method for the detection of hydrazine in aqueous solutions, which is of great significance for expanding the practical application of covalent organic polymers.Conflicts of interest
There are no conflicts of interest to declare.Acknowledgements
This work was financially supported by the National Natural Science Foundation of China (No. 21835001, 52073116 and 51773080).References
- A. R. Christopher and D. A. Steven, Chem. Res. Toxicol., 1997, 10, 328–334 Search PubMed.
- G. F. Wu, X. Tang, W. G. Ji, K. W. C. Lai and Q. X. Tong, Methods Appl. Fluoresc., 2017, 5, 1–7 Search PubMed.
- S. Garrod, M. E. Bollard, A. W. Nichollst, S. C. Connor, J. Connelly, J. K. Nicholson and E. Holmes, Chem. Res. Toxicol., 2005, 18, 115–122 Search PubMed.
- K. Bando, T. Kunimatsu, J. Sakai, J. Kimura, H. Funabashi, T. Seki, T. Bamba and E. Fukusaki, J. Appl. Toxicol., 2011, 31, 524–535 CrossRef CAS PubMed.
- A. D. Arulraj, M. Vijayan and V. S. Vasantha, Spectrochim. Acta, Part A, 2015, 148, 355–361 CrossRef CAS PubMed.
- Z. K. He, B. Fuhrmann and U. Spohn, Anal. Chim. Acta, 2000, 409, 83–91 CrossRef CAS.
- Y. Y. Tang, C. L. Kao and P. Y. Chen, Anal. Chim. Acta, 2012, 711, 32–39 CrossRef CAS PubMed.
- Z. C. Hu, B. J. Deibert and J. Li, Chem. Soc. Rev., 2014, 43, 5815–5840 RSC.
- Y. W. Sie, C. L. Li, C. F. Wan, J. H. Chen, C. H. Hu, H. B. Yan and A. T. Wu, Inorg. Chim. Acta, 2017, 467, 325–329 CrossRef CAS.
- Y. J. Chang, S. S. Wu, C. H. Hu, C. Cho, M. X. Kao and A. T. Wu, Inorg. Chim. Acta, 2015, 432, 25–31 CrossRef CAS.
- L. M. Liu and Z. Y. Yang, Inorg. Chim. Acta, 2018, 469, 588–592 CrossRef CAS.
- Q. Li, Y. Hu, H. N. Hou, W. N. Yang and S. L. Hu, Inorg. Chim. Acta, 2018, 471, 705–708 CrossRef CAS.
- S. Chen, P. Hou, J. Wang, L. Liu and Q. Zhang, Spectrochim. Acta, Part A, 2017, 173, 170–174 CrossRef CAS PubMed.
- P. Qu, X. Ma, W. Chen, D. Zhu, H. Bai, X. Wei, S. Chen and M. Xu, Spectrochim. Acta, Part A, 2019, 210, 381–386 CrossRef CAS PubMed.
- Y. Q. Hao, Y. T. Zhang, K. H. Ruan, W. S. Chen, B. B. Zhou, X. J. Tan, Y. Wang, L. Q. Zhao, G. Zhang, P. Qu and M. T. Xu, Sens. Actuators, B, 2017, 244, 417–424 CrossRef CAS.
- X. X. Zheng, S. Q. Wang, H. Y. Wang, R. R. Zhang, J. T. Liu and B. X. Zhao, Spectrochim. Acta, Part A, 2015, 138, 247–251 CrossRef CAS PubMed.
- L. Wang, F. Y. Liu, H. Y. Liu, Y. S. Dong, T. Q. Liu, J. F. Liu, Y. W. Yao and X. J. Wan, Sens. Actuators, B, 2016, 229, 441–452 CrossRef CAS.
- J. Zhou, R. Y. Shi, J. X. Liu, R. Wang, Y. F. Xu and X. H. Qian, Org. Biomol. Chem., 2015, 13, 5344–5348 RSC.
- Y. D. Lin and T. J. Chow, RSC Adv., 2013, 3, 17924–17929 RSC.
- S. Goswami, K. Aich, S. Das, S. B. Roy, B. Pakhira and S. Sarkar, RSC Adv., 2014, 4, 14210–14214 RSC.
- D. Y. Qu, J. L. Chen and B. Di, Anal. Methods, 2014, 6, 4705–4709 RSC.
- B. Roy, S. Halder, A. Guha and S. Bandyopadhyay, Anal. Chem., 2017, 89, 10625–10636 CrossRef CAS PubMed.
- W. D. Wang, Y. Hu, Q. Li and S. L. Hu, Inorg. Chim. Acta, 2018, 477, 206–211 CrossRef CAS.
- X. Q. Zhang, C. L. Shi, P. W. Ji, X. D. Jin, J. N. Liu and H. J. Zhu, Anal. Methods, 2016, 8, 2267–2273 RSC.
- J. Li, J. Z. Liu, J. W. Y. Lam and B. Z. Tang, RSC Adv., 2013, 3, 8193–8196 RSC.
- S. W. Thomas and T. M. Swager, Adv. Mater., 2006, 18, 1047–1050 CrossRef CAS.
- T. Rasheed, F. Nabeel, C. L. Li and Y. L. Zhang, J. Mol. Liq., 2019, 274, 461–469 CrossRef CAS.
- Z. R. Hu, T. Yang, J. L. Liu, Z. Q. Zhang and G. D. Feng, Talanta, 2020, 207, 120203 CrossRef CAS PubMed.
- F. Nabeel and T. Rasheed, J. Hazard. Mater., 2020, 388, 121757 CrossRef CAS PubMed.
Footnotes |
| † Electronic supplementary information (ESI) available: For ESI and other electronic format. See DOI: 10.1039/d1tc04335h |
| ‡ These authors contributed equally to this work. |
| This journal is © The Royal Society of Chemistry 2022 |

