
Bifunctional carbon dots as cocatalyst and reactor decorating an organic photocatalyst for H2 production from water-splitting in an emulsion†
Zhenyu
Wu
a,
Qiang
Hong
a,
Xiting
Wang
a,
Hong
Shi
a,
Tianyang
Zhang
a,
Yu
Zhao
*b,
Hui
Huang
 a,
Yang
Liu
*a and
Zhenhui
Kang
*ac
a,
Yang
Liu
*a and
Zhenhui
Kang
*ac
aInstitute of Functional Nano & Soft Materials (FUNSOM), Jiangsu Key Laboratory for Carbon-Based Functional Materials & Devices, Soochow University, 199 Ren'ai Road, Suzhou, 215123, Jiangsu, China. E-mail: zhkang@suda.edu.cn; yangl@suda.edu.cn
bDepartment of Information Technology, Suzhou Institute of Trade & Commerce, 287 Xuefu Road, Suzhou, 215009, Jiangsu, China
cMacao Institute of Materials Science and Engineering (MIMSE), MUST-SUDA Joint Research Center for Advanced Functional Materials, Macau University of Science and Technology, Taipa 999078, Macao, China
First published on 14th November 2022
Abstract
Generation of clean hydrogen (H2) energy by photocatalytic water-splitting is a prospective method for solving the global energy crisis and environmental pollution and the design of new generation catalysts is expected to combine the functions of catalysis and reactor. Here, we illustrate the synthesis of organic polymer photocatalyst p(DB) synthesized from 5,11-dihydroindolo[3,2-b]carbazole and 1,2-bis(4-bromophenyl)ethane. The carbon dots (CDs) are utilized to modify p(DB) and the optimal sample 5% CDs/p(DB) exhibits highly efficient H2 production under visible light in an o-xylene-in-water emulsion, whose average rate of H2 evolution reaches 140.88 μmol g−1 h−1. Furthermore, the transient photovoltage (TPV) and photoelectrochemical measurements suggest that the CDs improve the charge transfer process and the charge extraction ability of p(DB). Moreover, the CDs play the role of an emulsifying agent as well as providing chemical reaction sites for photocatalytic water-splitting. This work provides a deep understanding of the functions of CDs to integrate a cocatalyst and reactor.
Introduction
Currently, the resource depletion and environmental pollution caused by the energy structure dominated by fossil fuels are worldwide problems that need to be solved urgently.1–3 Hydrogen (H2), as one of the most promising sources of clean energy, has the advantages of high thermal efficiency and energy density, and is the most suitable energy carrier to replace traditional fossil energy.4–6 Among the various methods of H2 production, photocatalysis-driven water-splitting by solar energy is simple, green and sustainable, and is recognized as an efficient method for solving the global energy crisis.7–9Compared with inorganic semiconductors, organic semiconductors have wider and stronger absorbance in the range of visible light and the molecular structure, and their photoelectrical properties can be tuned flexibly and accurately by the design of the molecular structure.10–12 However, organic semiconductors still suffer from the short life and the low mobility of photogenerated charges.13–15 In addition, due to the hydrophobicity of most organic semiconductors, their photocatalytic performances are limited in water. In order to solve these problems, Krivtsov et al. constructed a quasi-homogeneous photocatalytic system with the water-soluble carbon nitride.16 In our previous work we constructed a phase transfer photocatalytic system, which coupled the separation process with the reaction process, contributing to the construction of macro-reactors.17
Since being reported in 2004, carbon dots (CDs) have attracted considerable attention due to their features of unique charge regulation, functionalized surface, stable and efficient reactive active sites and high chemical stability.18–20 In particular, in the field of photocatalysis, CDs have been frequently utilized as a cocatalyst due to these characteristics.21–23 It is worth further studying CDs to modify organic semiconductors as photocatalysts in water splitting. Recently, some works on the utilization of CDs to stabilize oil-in-water emulsions have been reported.24–26 Bi's group used biomass residue as the carbon source to prepare CDs, which exhibited superior surface activity and could highly stabilize the styrene-in-water emulsion.27 Tabor's group utilized the nanocomplex of graphene oxide and N-doped CDs to effectively stabilize the toluene–water interface.28 However, simultaneous utilization of CDs' properties as a cocatalyst and emulsion stabilizer has been scarcely reported.
Herein, the synthesis of organic polymer photocatalyst p(DB) is shown, which realized the photocatalytic water-splitting to generate H2 in an o-xylene-in-water emulsion with sodium dodecyl sulphate (SDS) as an emulsifying agent. Afterwards, p(DB) was modified with CDs and the optimal sample 5% CDs/p(DB) exhibited highly efficient H2 production under visible light in an o-xylene-in-water emulsion without addition of SDS, whose average rate of H2 evolution reached 140.88 μmol g−1 h−1. Transient photovoltage (TPV) and photoelectrochemical measurements were performed to identify the role of CDs in the regulation of charge transfer. In addition, the roles of CDs as the emulsifying agent and in providing chemical reaction sites for photocatalytic water-splitting were also investigated. This work provides a new understanding of the effects of CDs as both a cocatalyst and reactor in photocatalysis.
Experimental section
Materials
5,11-Dihydroindolo[3,2-b]carbazole was purchased from Innochem. 1,2-Bis(4-bromophenyl)ethane was purchased from TCI. SDS, methanol (99.9%), ethanol (99.8%) and o-xylene (98%) were purchased from Aladdin. Sodium hydride (NaH) was purchased from Energy-Chemical.Synthesis of carbon dots (CDs)
According to the reported methods, CDs were synthesized by electrolyzing graphite rods.23 After the graphite rods were electrolyzed for 15 days, the obtained CD solution was filtered through low-speed quantitative filter paper three times. Then, the solution was centrifuged at 10![[thin space (1/6-em)]](https://www.rsc.org/images/entities/char_2009.gif) 000 rpm three times and dried at 70 °C to give CD powder.
000 rpm three times and dried at 70 °C to give CD powder.
Synthesis of poly(5,11-dihydroindolo[3,2-b]carbazole-1,2-bis(4-bromophenyl)ethane) (p(DB))
A mixture of 4 mmol of 5,11-dihydroindolo[3,2-b]carbazole (1.02 g), 12 mmol of NaH (288 mg), and 30 mL degassed o-xylene was stirred at 120 °C for 1 h. Then, 4 mmol of 1,2-bis(4-bromophenyl)ethane (1.36 g) was added into this mixture. The resultant mixture was transferred to a flask and immersed in a preheated oil bath, which was maintained at 140 °C for 48 h under constant stirring. After that, 15 mL methanol was added to quench the polymerization reaction. When the mixture was cooled to room temperature, it was filtered with deionized water and the residue was further washed with deionized water several times. A brown product, poly(5,11-dihydroindolo[3,2-b]carbazole-1,2-bis(4-bromophenyl)ethane), was obtained by vacuum drying and the sample was named p(DB).Synthesis of x% CDs/p(DB) photocatalysts
Different mass ratios of p(DB) and CDs (100:1, 100:3, 100:5 and 100:7) were added to 100 mL ethanol, and the mixtures were ultrasonically treated for 10 min to mix them uniformly. After that, the solution was heated at 65 °C for 5 h under constant stirring. Finally, a brown powder was obtained after drying at 60 °C. According to the adding mass ratio of CDs, the samples were named x% CDs/p(DB) (x = 1, 3, 5 and 7).
Photocatalytic experiments of p(DB) and x% CDs/p(DB)
In the non-emulsion catalytic system, 10 mg p(DB) or x% CDs/p(DB) was added into 20 mL ultra-pure water and then treated by ultrasonication for 10 min, making the photocatalyst disperse uniformly. Then, the mixture was transferred to a 40 mL glass bottle. After being sealed, the bottle was irradiated under visible light (420 nm ≤ λ ≤ 700 nm, light intensity = 85.17 mW cm−2).In the emulsion catalytic system, for p(DB), 10 mg p(DB) was mixed with 2.5 mL o-xylene and treated by ultrasonication to form a uniform solution. After that, 20 mL ultra-pure water and different masses of SDS (0, 10, 25, 50, 75, and 100 mg) were added into the solution. For x% CDs/p(DB), 10 mg x% CDs/p(DB) was mixed with 2.5 mL o-xylene and treated by ultrasonication to form the uniform solution. After that, 20 mL ultra-pure water was added into the solution. Then, the mixture was treated by ultrasonication and stirred for 10 min to form a white emulsion. Afterwards, the emulsion was transferred to a 40 mL glass bottle. After being sealed, the bottle was irradiated under the same conditions mentioned above.
Results and discussion
Characterization of the organic photocatalyst
The synthetic route of p(DB) is shown in Fig. 1a and the detailed synthetic information is provided in the Experimental section. Briefly, the precursor was polymerized at 140 °C in o-xylene. After the polymerization reaction ended, the brown product was obtained after cooling, filtering, washing and drying. The structure of p(DB) was further identified by 1H nuclear magnetic resonance (NMR), displayed in Fig. 1b. The peak at 7.26 ppm is ascribed to the solvent, deuterated chloroform (CDCl3). The peak located at 3.12 ppm is caused by the group of –CH2–CH2– in the long chain structure of the polymer, while all of the peaks in the range of 6.59–7.18 ppm and 8.11–8.32 ppm are attributed to all the protons on the benzene rings. The morphology of the photocatalysts was characterized by scanning electron microscopy (SEM) and transmission electron microscopy (TEM). In Fig. 1c, the TEM image of CDs shows the uniform distribution of the CDs and the high-resolution TEM (HRTEM) image of CDs is displayed in the inset, and shows the 0.21 nm lattice spacing of the CDs, corresponding to the (100) crystal plane of graphitic carbon.29 In Fig. 1d, the particle size distribution of CDs suggests the particle size ranges from 1.25 to 4.75 nm and the average size is 3.31 nm. In Fig. S1,† the powder X-ray diffraction (XRD) pattern of CDs shows two broad peaks at around 22° and 39°, well corresponding to the (002) and (100) planes of graphitic carbon.30 Fig. S2† shows the SEM image of p(DB), where the photocatalyst exhibits an irregular solid shape. Fig. S3† demonstrates the TEM image of 5% CDs/p(DB), and the CDs on the surface of p(DB) are clearly marked by red circles. Furthermore, the inserted HRTEM image shows the lattice spacing of CDs with 0.21 nm on the surface of p(DB), indicating the successful combination of p(DB) and CDs. Fig. 1e shows the Fourier transform infrared (FT-IR) spectra of the photocatalysts, which were further used to investigate the surface functional groups on the photocatalysts. For CDs, the peak located at 3449.6 cm−1 is ascribed to the stretching vibration of O–H and the peaks at 1720.4 and 1249.8 cm−1 are caused by the stretching vibration of C![[double bond, length as m-dash]](https://www.rsc.org/images/entities/char_e001.gif) O and O–C–O, respectively.31 For p(DB) and 5% CDs/p(DB), the peak located at 3449.6 cm−1 is assigned to the stretching vibration of O–H/N–H.32 The two peaks at 2922.0 and 2850.6 cm−1 are caused by the stretching vibration of C–H on the benzene ring.33 The peaks caused by the stretching vibration of CC and C–N are located at 1596.9 and 1353.9 cm−1, respectively.34 The elemental composition and the chemical bonds of the photocatalysts were investigated by full X-ray photoelectron spectroscopy (XPS). The full XPS spectrum of 5% CDs/p(DB) in Fig. S4a† indicates that the composite is composed of elements of C, N and O. As displayed in Fig. 1f, the high-resolution spectrum of C 1s can be fitted into three peaks, where the peaks locate at 283.6, 284.6 and 289.4 eV, attributed to CC, C–C and C–O/CO/C–N bonds, respectively.35 The high-resolution spectrum of O 1s is shown in Fig. S4b,† and can be fitted into two peaks at 531.6 and 533.0 eV, assigned to CO and C–O bonds, respectively.36 The high-resolution spectrum of N 1s is shown in Fig. S4c,† where the peaks of pyrrolic (399.1 eV) and graphitic N (400.4 eV) can be fitted.34 Furthermore, the XPS survey of each single component was also performed. In Fig. S5a,† the full XPS spectrum of CDs suggests that it's composed of C and O elements. In Fig. S5b,† the high-resolution spectrum of C 1s can be deconvoluted into four peaks at 284.6 (CC bonds), 285.8 (C–C bonds), 288.8 (C–O bonds) and 289.4 eV (CO bonds), and in Fig. S5c,† the spectrum of O 1s can be deconvoluted into two peaks at 532.4 (CO bonds) and 532.8 eV (C–O bonds).37 Similarly, the full XPS spectrum of p(DB) shown in Fig. S6a† indicates that it's only composed of elements of C and N, and only CC (283.7 eV), C–C (284.7 eV) and C–N bonds (289.8 eV) can be fitted in the high-resolution spectrum of C 1s (Fig. S6b†), while the peaks of pyrrolic (399.0 eV) and graphitic N (399.3 eV) can be fitted in the high-resolution spectrum of N 1s (Fig. S6c†). Therefore, all the above results prove that the CDs and p(DB) are successfully compounded.
O and O–C–O, respectively.31 For p(DB) and 5% CDs/p(DB), the peak located at 3449.6 cm−1 is assigned to the stretching vibration of O–H/N–H.32 The two peaks at 2922.0 and 2850.6 cm−1 are caused by the stretching vibration of C–H on the benzene ring.33 The peaks caused by the stretching vibration of CC and C–N are located at 1596.9 and 1353.9 cm−1, respectively.34 The elemental composition and the chemical bonds of the photocatalysts were investigated by full X-ray photoelectron spectroscopy (XPS). The full XPS spectrum of 5% CDs/p(DB) in Fig. S4a† indicates that the composite is composed of elements of C, N and O. As displayed in Fig. 1f, the high-resolution spectrum of C 1s can be fitted into three peaks, where the peaks locate at 283.6, 284.6 and 289.4 eV, attributed to CC, C–C and C–O/CO/C–N bonds, respectively.35 The high-resolution spectrum of O 1s is shown in Fig. S4b,† and can be fitted into two peaks at 531.6 and 533.0 eV, assigned to CO and C–O bonds, respectively.36 The high-resolution spectrum of N 1s is shown in Fig. S4c,† where the peaks of pyrrolic (399.1 eV) and graphitic N (400.4 eV) can be fitted.34 Furthermore, the XPS survey of each single component was also performed. In Fig. S5a,† the full XPS spectrum of CDs suggests that it's composed of C and O elements. In Fig. S5b,† the high-resolution spectrum of C 1s can be deconvoluted into four peaks at 284.6 (CC bonds), 285.8 (C–C bonds), 288.8 (C–O bonds) and 289.4 eV (CO bonds), and in Fig. S5c,† the spectrum of O 1s can be deconvoluted into two peaks at 532.4 (CO bonds) and 532.8 eV (C–O bonds).37 Similarly, the full XPS spectrum of p(DB) shown in Fig. S6a† indicates that it's only composed of elements of C and N, and only CC (283.7 eV), C–C (284.7 eV) and C–N bonds (289.8 eV) can be fitted in the high-resolution spectrum of C 1s (Fig. S6b†), while the peaks of pyrrolic (399.0 eV) and graphitic N (399.3 eV) can be fitted in the high-resolution spectrum of N 1s (Fig. S6c†). Therefore, all the above results prove that the CDs and p(DB) are successfully compounded.
 | ||
| Fig. 1 Characterization of the as-prepared photocatalysts. (a) The synthetic route of p(DB). (b) 1H NMR spectrum of p(DB). (c) TEM image of CDs (inset: HRTEM image of CDs). (d) The size distribution of CDs. (e) The FT-IR spectra of p(DB), CDs and 5% CDs/p(DB). (f) The XPS spectra of C 1s of 5% CDs/p(DB). | ||
The energy band structures of p(DB) and CDs were investigated by cyclic voltammetry (CV).38 In Fig. 2a, using the formulae provided in the ESI,† the highest occupied molecular orbital (HOMO) and the lowest unoccupied molecular orbital (LUMO) can be calculated. For p(DB), the HOMO and LUMO were calculated to be −5.67 and −3.46 eV, respectively. The HOMO and LUMO of CDs were calculated to be −6.05 and −3.93 eV, respectively in Fig. S7.† The schematic diagram of the energy band structure of p(DB) and CDs is drawn and presented in Fig. 2b. From the perspective of thermodynamics, both p(DB) and CDs simultaneously meet the HOMO and LUMO positions of the water oxidation reaction (WOR) into O2 (−5.63 eV vs. Ev) and hydrogen evolution reaction (HER, −4.4 eV vs. Ev).39 What's more, the heterojunction formed between p(DB) and CDs is beneficial for electron transfer. As shown in Fig. 2c, electrochemical impedance spectroscopy (EIS) measurements were also performed to estimate the carrier transmission ability of the photocatalysts.40 With the addition of CDs, all the semicircle arcs of x% CDs/p(DB) become smaller than that of p(DB), suggesting that CDs decrease the charge transfer resistance. In addition, the semicircle arc of 1% CDs/p(DB) is the smallest while those of 3%, 5% and 7% CDs/p(DB) are similar, indicating that the improvement of charge transfer by CDs reaches saturation. Fig. 2d displays the transient photocurrent response (TPR) curves of the photocatalysts for five cycles. The transient photocurrents of x% CDs/p(DB) are all higher than that of p(DB). Furthermore, with the increase of the amounts of CDs, the phenomenon of the rapid attenuation of transient photocurrent is improved, indicating that the introduction of CDs not only provides more photogenerated charges, but also stabilizes them.
 | ||
| Fig. 2 Electrochemical tests for the photocatalysts. (a) The CV curve of p(DB). (b) The diagram of energy band structure of p(DB) and CDs. (c) The EIS spectra of p(DB) and x% CDs/p(DB). (d) The TPR curves of p(DB) and x% CDs/p(DB). | ||
Photocatalytic performances of the photocatalysts
After the characterization of the photocatalysts, photocatalytic experiments were performed to explore the photocatalytic properties of these catalysts. Firstly, the photocatalytic properties of p(DB) in ultra-pure water were explored. 10 mg p(DB) was mixed with 20 mL ultra-pure water. After ultrasonication and sealing treatment, the bottles were irradiated under visible light. Fig. 3a shows the H2 production of p(DB) versus time in ultra-pure water (detailed data in Tables S1 and S2†). In 12 h, only 2.64 μmol H2 was produced by p(DB). Moreover, the linear fit was applied to estimate the average rate of H2 evolution of p(DB) in ultra-pure water, which was calculated to be 22.91 μmol g−1 h−1. In order to verify the reason for the poor performance of p(DB) in ultra-pure water, other characterization experiments were performed. The results of contact angle (CA) measurements are displayed in Fig. S8,† where the left and right CAs of p(DB) with water are 124.7° and 124.5°, indicating that the surface of p(DB) is hydrophobic. Moreover, the SEM image was utilized to explore the morphology of p(DB) after dispersing it in water and drying. As shown in Fig. S9,† the p(DB) agglomerates into particles with a size of 40–60 nm. Therefore, the hydrophobicity and agglomeration in water are the main reasons for the poor photocatalytic performances of p(DB) in ultra-pure water. Next, the photocatalytic properties of p(DB) in an o-xylene-in-water emulsion were investigated. 10 mg p(DB) was first dissolved in 2.5 mL o-xylene and then mixed with 20 mL ultra-pure water. Afterwards, a certain mass of SDS (0, 10, 25, 50, 75 or 100 mg) was added into the mixture. After ultrasonication to form the emulsion and sealing treatment, the bottles were irradiated under the same conditions mentioned above. Stability is one of the factors to verify the formation of an emulsion.41 As shown in Fig. S10a,† when no SDS was added, though the emulsion was continuously stirred at 180 rpm, the separation between oil and water is obvious. In Fig. S10b,† when 10 mg SDS was added, the oil and water obviously separated after 10 min. However, when the mass of SDS reached 25 mg or more, as displayed in Fig. 3b and S10c–e,† the emulsions continuously stirred at 180 rpm could keep stable for at least 12 h, which is long enough for the photocatalytic experiments. In addition, dynamic light scattering (DLS) measurements were performed to study the change of droplet size of these emulsions to verify their stability. As shown in Fig. S11,† when the mass of SDS is 25, 50, 75 and 100 mg, respectively, the droplet sizes of the emulsions can keep stable for at least 12 h. Next, the histogram comparison of H2 production of p(DB) in 12 h with the change of mass of SDS is displayed in Fig. 3c. The evolution of H2 increases when the mass of SDS changes from 0 to 25 mg, reaching the optimal H2 evolution (9.11 μmol) when the mass of SDS is 25 mg. Then, it decreases when the mass of SDS is over 25 mg. Similarly, the average rates of H2 evolution under this condition were calculated in Fig. S12† and the detailed information is provided in Tables S3 and S4.† The optimal mass of SDS is 25 mg, where the average rate of H2 evolution reaches 75.83 μmol g−1 h−1. It's worth noting that, in Fig. 3d, the photocatalytic performance of p(DB) in the o-xylene-in-water emulsion when no SDS is added is even worse than that in pure water. In pure water, p(DB) generates H2 with an average rate of 22.91 μmol g−1 h−1 while in the o-xylene-in-water emulsion without any SDS added, p(DB) generates H2 only at a rate of 16.75 μmol g−1 h−1. We assume that the smaller contact area with water is the main reason for the worse photocatalytic performance of p(DB) in the o-xylene-in-water emulsion without SDS. In ultra-pure water, p(DB) is in contact with water in the form of small particles. However, in the o-xylene-in-water emulsion, without an emulsifying agent, the emulsion formed by stirring and ultrasonication is unstable. The organic phase will soon separate from the aqueous phase, which causes only a small amount of p(DB) to react with water at the oil–water interface. Meanwhile, the improved performance of H2 evolution after adding SDS can be ascribed to two main factors. First, compared with the interfaces between the agglomerated p(DB) and water or interfaces between oil and water after their separation, nano-sized emulsion droplets can provide larger oil–water interfaces for photocatalytic reactions. Second, nano-sized emulsion droplets increase the local concentration of the photocatalyst, which facilitates the photocatalytic reactions.42 In addition, the reason why the H2 evolution rises first and then drops with the increase of SDS is that when the mass of SDS is 10 mg, the o-xylene-in-water emulsion cannot be well stabilized and when the mass of SDS is 50 mg or more, a large quantity of SDS exists at the oil–water interfaces of the emulsion droplets. This affects the contact between p(DB) and water, leading to the decreased H2 evolution. Therefore, there exists an optimal mass of SDS which not only can well stabilize the o-xylene-in-water emulsion, but also ensures that p(DB) has good contact with water at the oil–water interfaces of the emulsion droplets. Moreover, according to the pseudo-phase ion exchange (PIE) model, the change trend of H2 evolution with the mass of SDS can be explained from the perspective of reaction kinetics.43 Because photocatalytic water-splitting occurs at oil–water interfaces, the rate constant for the reaction occurring in the bulk water phase is larger than that in the micellar pseudo-phase. When the concentration of micelles ([M]) is larger than the critical micelle concentration, the apparent rate constant of H2 (Kobs) is a monotonically decreasing function with [M]. In addition, the larger mass of SDS results in a larger [M]. Therefore, the monotonic decrease of Kobs occurs when the mass of SDS is more than 25 mg. However, when the mass of SDS is 10 mg, stable micelles are not formed, which means that the PIE model is not valid in this case. | ||
| Fig. 3 Photocatalytic performances of p(DB) under different reaction conditions. (a) Production of H2versus time in ultra-pure water. (b) The change of the emulsion with time when the mass of SDS is 25 mg (the emulsion was continuously stirred at 180 rpm). (c) Production of H2 in an o-xylene-in-water emulsion with the change of mass of SDS. (d) Comparison of production of H2versus time in an o-xylene-in-water emulsion (the masses of SDS are 0 and 25 mg). | ||
The photocatalytic properties of x% CDs/p(DB) in water or emulsion were investigated (the reaction conditions are the same as mentioned above). The stability of the emulsions was first studied before photocatalytic experiments. As displayed in Fig. S13a and b,† when the mass ratios of CDs/p(DB) are 1% and 3%, the oil phase separates from the aqueous phase after the emulsions were prepared, indicating that small amounts of CDs cannot well stabilize the emulsion. As displayed in Fig. S13c and d,† when the mass ratios of CDs/p(DB) are 5% and 7%, the emulsions continuously stirred at 180 rpm keep stable for at least 12 h. In addition, the DLS in Fig. S14† suggests the stability of droplet sizes of 5% and 7% CDs/p(DB). Fig. 4a shows the histogram comparison of H2 production of x% CDs/p(DB) in ultra-pure water in 12 h. When the mass ratio of CDs/p(DB) is 1%, the H2 production in 12 h reaches 5.53 μmol, which is ca. 2.1 times higher than that of p(DB) in water. However, after the mass ratio of CDs/p(DB) reaches 3% or more, the H2 production in 12 h decreases obviously, indicating that excess CDs occupy the active sites of p(DB), thus leading to worse photocatalytic performances. Next, the H2 evolution versus time of x% CDs/p(DB) in ultra-pure water is shown in Fig. 4b, where the linear fit was performed to investigate the average rate of H2 evolution (detailed data listed in Tables S1 and S2†). The average rate of 1% CDs/p(DB) reaches 49.12 μmol g−1 h−1 and the average rate of p(DB) is only 22.91 μmol g−1 h−1. These photocatalytic performances are consistent with the results of EIS and TPR, where 1% CDs/p(DB) has a smaller semicircle arc and higher transient photocurrent compared with 3, 5 and 7% CDs/p(DB). After the photocatalytic experiments in ultra-pure water, the photocatalytic properties of x% CDs/p(DB) in the o-xylene-in-water emulsion were explored. The histogram comparison of H2 production of x% CDs/p(DB) in 12 h in the o-xylene-in-water emulsion is shown in Fig. 4c. Entirely different from the tendency of results in ultra-pure water, the H2 production first rises with the increase of mass ratio of CDs from 1% to 5%, and then drops when the mass ratio of CDs reaches 7%. The photocatalytic performance reaches its best when the mass ratio of CDs is 5%, which produces 17.28 μmol H2. Compared with that of p(DB) in the o-xylene-in-water emulsion without addition of SDS (2.01 μmol) and with addition of optimal 25 mg SDS (9.11 μmol), the performance improves by ca. 8.6 and 1.9 times, respectively. Also, the H2 evolution versus time of x% CDs/p(DB) in the emulsion is shown in Fig. 4d (detailed information in Tables S5 and S6†), where the average rate of H2 evolution for 5% CDs/p(DB) in the o-xylene-in-water emulsion can reach 140.88 μmol g−1 h−1. What is more, the photocatalytic properties of CDs in water and emulsion were examined in order to exclude the possibility that CDs themselves can produce H2 under irradiation. As displayed in Fig. S15,† whether in water or emulsion, no H2 was detected even after 12 h of irradiation. Therefore, the preliminary explanation for the phenomena is proposed. In the o-xylene-in-water emulsion, CDs not only play the role of a cocatalyst, but also serve as an emulsifying agent owing to the rich functional groups on them. CDs stabilize the o-xylene-in-water emulsion and simultaneously act as a reactor for photocatalytic water-splitting. When the ratio of CDs/p(DB) is small, the o-xylene-in-water emulsion cannot be well stabilized. When the ratio of CDs/p(DB) is too large, excess CDs occupy both the active sites of p(DB) and the oil–water interfaces of the emulsion droplets, thus going against the reactions. Next, the AQE of 5% CDs/p(DB) was calculated at different wavelengths in the o-xylene-in-water emulsion (detailed information in Table S7†). As shown in Fig. 4e, AQE decreases with the increase of wavelength, which matches well with the UV-vis spectrum of 5% CDs/p(DB), indicating that the photocatalytic reaction is driven by light. Finally, the stability tests of 5% CDs/p(DB) in the emulsion were performed, the results of which are shown in Fig. 4f. After five photocatalytic cycles, the H2 production of 5% CDs/p(DB) in 12 h remains 15.45 μmol, indicating the good stability of 5% CDs/p(DB) in the o-xylene-in-water emulsion.
 | ||
| Fig. 4 Photocatalytic performances of x% CDs/p(DB) under different reaction conditions. (a) Production of H2 in ultra-pure water in 12 h. (b) Production of H2versus time in ultra-pure water. (c) Production of H2 in an o-xylene-in-water emulsion in 12 h. (d) Production of H2versus time in an o-xylene-in-water emulsion. (e) The UV-vis absorbance spectrum and the corresponding AQE of 5% CDs/p(DB) in an o-xylene-in-water emulsion under different incident lights with wavelengths of 365, 420, 500, 590 and 660 nm. (f) The stability tests of 5% CDs/p(DB) in an o-xylene-in-water emulsion. | ||
Exploration of the mechanism of the photocatalyst
TPV measurements were performed to explore the role of CDs in charge regulation during the process of photocatalysis.44–46Fig. 5a is the TPV curves of p(DB) and 5% CDs/p(DB) powder. The photovoltage intensity of 5% CDs/p(DB) is higher than that of p(DB), indicating that the introduction of CDs may provide more electrons during the photocatalytic process. As depicted in Fig. 5b, the attenuation constants (τ) are used to estimate the rate of charge recombination of the photocatalysts.47–49 The τ of p(DB) and 5% CDs/p(DB) are 0.389 and 0.275 ms, respectively, suggesting that CDs to some extent accelerate the charge recombination process and improve the charge transfer process at the interface of the composite photocatalyst. This result is consistent with the conclusion of EIS measurements. In Fig. 5c, the charge extraction rate (tmax) and maximum electron extraction of p(DB) and 5% CDs/p(DB) are also used to explore the effects of CDs on charge regulation.48,50 The tmax of p(DB) and 5% CDs/p(DB) were calculated to be 0.144 and 0.164 ms, respectively, indicating that the rate of charge extraction of the two photocatalysts is similar. However, their ability for charge extraction, which can be estimated from the area of the shaded part (A), is clearly different. The A of 5% CDs/p(DB) (A2 = 0.121) is almost 2 times larger than that of p(DB) (A1 = 0.062), proving that the introduction of CDs greatly improves the ability of the photocatalyst to extract charges. Finally, the effective electron concentrations (EEC) are used to understand the effect of tmax, τ and A better, which can be calculated by the equation Aτ/tmax.42 The EEC of p(DB) and 5% CDs/p(DB) are 0.167 and 0.203, respectively and the histogram comparison of all four parameters is directly shown in Fig. 5d. Therefore, although CDs accelerate the process of charge recombination, their contributions to improving the process of charge transfer and ability for charge extraction play a key role in improving the photocatalytic performance. | ||
| Fig. 5 The TPV measurements of the photocatalysts. (a) Comparison of the TPV curves of p(DB) and 5% CDs/p(DB). (b) The attenuation constants (τ) of the charge recombination process. (c) The charge extraction rate (tmax) and maximum electron extraction of p(DB) and 5% CDs/p(DB). (d) The histogram comparison of τ, tmax, A and EEC. | ||
DLS measurements were used to measure the diameters of the emulsion droplets to further explore the emulsification of CDs. The change of diameters of the p(DB) o-xylene-in-water emulsion droplets with mass of SDS is shown in Fig. 6a. The diameters decrease with the increase of mass of SDS. The decreasing diameters further prove the increasing concentration of micelles and the better emulsification. According to the photographs under these conditions shown in Fig. 6c, when the mass of SDS is 0 or 10 mg, the separation of oil and water is apparent. Only when the mass of SDS reaches 25 mg and more, the white emulsion without separation of oil and water forms. Considering the DLS and photographs, although excess SDS makes the emulsion more stable and emulsification better, it makes the emulsion droplets too small to be beneficial for photocatalytic reactions. Many SDS molecules exists at the oil–water interfaces of droplets which hinders the contact between p(DB) and water and further hinders the photocatalytic reactions. Furthermore, the larger concentration of SDS that leads to the larger concentration of micelles is not beneficial for the reaction kinetics according to the PIE model.43 In Fig. 6b, when SDS is replaced with CDs, the diameters of the emulsion droplets increase with the increase of CDs content instead, suggesting that more water is combined in the emulsion droplets. In addition, the increasing diameters prove the decreasing concentration of micelles. And the rate constant for the reaction occurring in the bulk water phase is still larger than that in the micellar pseudo-phase because of the excellent proton adsorption function of CDs.51 According to the PIE model, the apparent reaction kinetics should increase monotonously.43 However, the monotonous increase only occurs when the ratio of CDs/p(DB) changes from 1% to 5%. This can be ascribed to the factor that apart from serving as the emulsifying agent, CDs also act as the cocatalyst and excessive CDs will occupy the active sites on p(DB), resulting in a worse photocatalytic performance. The photographs of the emulsions under these conditions in Fig. 6d indicate that when the ratio of CDs/p(DB) changes from 0% to 3%, the separation of oil and water gradually disappears and the emulsification reaches its best when the ratio of CDs/p(DB) is 5%. However, when the ratio of CDs/p(DB) is 7%, the emulsion turns black, proving that the CDs are excessive.
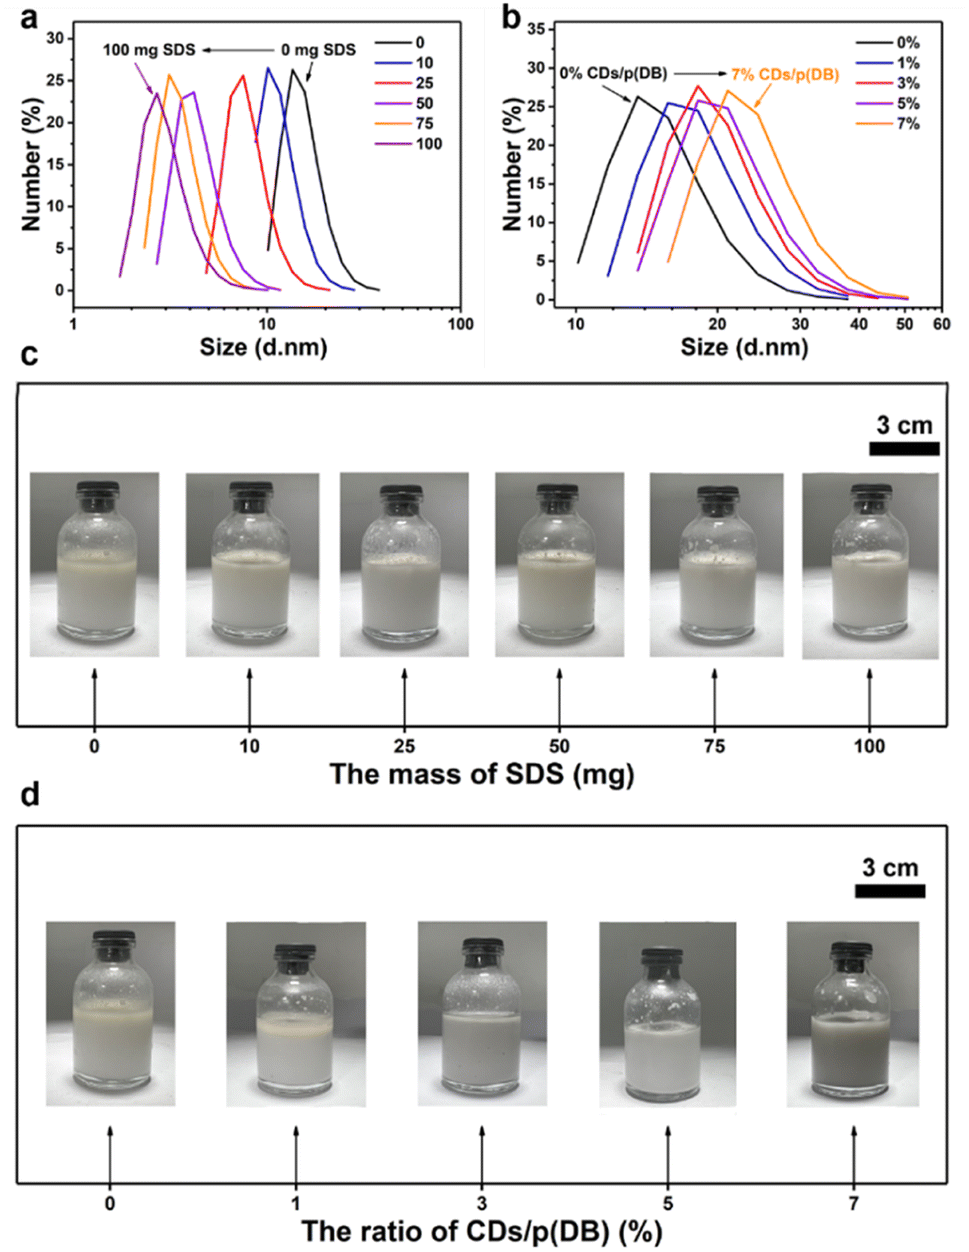 | ||
| Fig. 6 (a) The DLS of the p(DB) in an o-xylene-in-water emulsion with addition of different masses of SDS. (b) The DLS of the x% CDs/p(DB) in an o-xylene-in-water emulsion (x = 0, 1, 3, 5 and 7). (c) The photographs of p(DB) in o-xylene-in-water emulsions with the change of the mass of SDS. (d) The photographs of x% CDs/p(DB) in the o-xylene-in-water emulsion (x = 0, 1, 3, 5 and 7). The ratio of o-xylene and water and the mass of photocatalysts in the emulsion remain the same as in the photocatalytic experiments (o-xylene: 2.5 mL, water: 20 mL, photocatalysts: 10 mg). | ||
The electron transfer numbers of p(DB) or 5% CDs/p(DB) in the photocatalytic half reaction were verified using a rotating-ring disc electrode (RRDE).52 As depicted in Fig. S16a,† the ring current of p(DB) doesn't change while the disk current improved when light was applied to the electrode. Using formula (5) in the ESI,† the electron transfer numbers of p(DB) were calculated to be four. Similarly, in Fig. S16b,† the electron transfer number of 5% CDs/p(DB) was also determined to be four. These results both indicate the four-electron reaction for water oxidation into oxygen. As shown in Fig. S17,† linear scanning voltammetry (LSV) tests were used to identify the H+ reduction active sites.53 Compared with p(DB), CDs exhibit a smaller onset potential and higher diffusion-limited current density, proving that H+ reduction active sites were on CDs. Next, the type of emulsion was further verified by adding p(DB) or 5% CDs/p(DB) emulsions into o-xylene or ultra-pure water. The O/W type emulsion will disperse uniformly in the aqueous phase while condensing into droplets in the oil phase. In contrast, the W/O type emulsion will disperse uniformly in the oil phase while condensing into droplets in the aqueous phase. As displayed in Fig. S18,† both p(DB) and 5% CDs/p(DB) emulsions condense into droplets in o-xylene while dispersing uniformly in the water phase after stirring, suggesting that both the types of emulsion are O/W type.
Based on all the exploration experiments, the mechanism of p(DB) or 5% CDs/p(DB) mediated photocatalytic water-splitting is proposed. As shown in Fig. S19,† when SDS is used as the emulsifying agent, it can stabilize the emulsion droplets. Under visible light irradiation, at the interfaces of oil and water, the electrons on the valence band (VB) of p(DB) are excited to the conduction band (CB) and react with H2O to generate H2 and the holes on the VB react with H2O to generate O2. As shown in the left part of Fig. 7, when 5% CDs/p(DB) is used as the photocatalyst, under visible light irradiation, at the interfaces of oil and water, the electrons in the VB of p(DB) are excited to its CB and then transfer to CDs, where H2O reacts with electrons to generate H2, and in the VB of p(DB), the holes oxidize H2O into O2. In addition, CDs improve the charge transfer process and the ability for charge extraction during the photocatalytic process. As shown in the right part of Fig. 7, CDs also serve as an emulsifying agent, where CDs directly combine with water molecules and provide chemical reaction sites for photocatalytic water-splitting. Therefore, CDs play the roles of both cocatalyst and reactor.
 | ||
| Fig. 7 Schematic diagram of mechanisms of 5% CDs/p(DB) mediated photocatalytic water-splitting in an o-xylene-in-water emulsion. | ||
Conclusions
In summary, organic polymer photocatalyst p(DB) was synthesized and it realized photocatalytic water-splitting in an o-xylene-in-water emulsion with SDS as an emulsifying agent. Then, CDs were used to modify p(DB). The optimal sample 5% CDs/p(DB) exhibited highly efficient H2 production through photocatalytic water-splitting in an o-xylene-in-water emulsion without addition of SDS, whose average rate of H2 evolution reached 140.88 μmol g−1 h−1. TPV and photoelectrochemical measurements showed that the CDs improved the charge transfer process and the charge extraction ability of p(DB). In addition, it was discovered that CDs play the role of an emulsifying agent, directly providing chemical reaction sites for photocatalytic water-splitting. This work provides deep insights into bifunctional CDs as a cocatalyst and reactor.Author contributions
Zhenyu Wu carried out laboratory research on the performance testing for the photocatalytic activity of the samples. Qiang Hong carried out laboratory research on the synthesis of the samples. Xiting Wang carried out laboratory research on performance testing, wrote the draft, and revised the manuscript. Hong Shi revised the draft and contributed to writing the theory section of the manuscript. Tianyang Zhang revised the draft and contributed to the characterization of the catalysts. Yu Zhao revised the draft and contributed to the characterization of the catalysts. Hui Huang revised the manuscript, guided the performance test, and supervised the work. Yang Liu guided the overall work, was involved in funding acquisition, and supervised the work. Zhenhui Kang guided the overall work, was involved in funding acquisition, contributed to writing, and supervised the work.Conflicts of interest
The authors declare no conflict of interest.Acknowledgements
This work is supported by the National Key R&D Program of China (2020YFA0406101 and 2020YFA0406104), National MCF Energy R&D Program of China (2018YFE0306105), Innovative Research Group Project of the National Natural Science Foundation of China (51821002), National Natural Science Foundation of China (51725204, 51972216, 52272043, 52271223, 52202107, and 52201269), Natural Science Foundation of Jiangsu Province (BK20220028, BK20190041, BK20210735, and 21KJB430043), Key-Area Research and Development Program of Guangdong Province (2019B010933001), Collaborative Innovation Center of Suzhou Nano Science & Technology, the 111 Project, and Suzhou Key Laboratory of Functional Nano & Soft Materials.Notes and references
- B. Yan, L. Zhang, Z. Tang, M. Al-Mamun, H. Zhao and X. Su, Appl. Catal., B, 2017, 218, 743–750 CrossRef CAS.
- Y. Liu, Y. Zhao, Q. Wu, X. Wang, H. Nie, Y. Zhou, H. Huang, M. Shao, Y. Liu and Z. Kang, Chem. Eng. J., 2021, 409, 128184 CrossRef CAS.
- J. Liu, Y. Liu, N. Liu, Y. Han, X. Zhang, H. Huang, Y. Lifshitz, S.-T. Lee, J. Zhong and Z. Kang, Science, 2015, 347, 970–974 CrossRef CAS PubMed.
- Y. Zhao, C. Ding, J. Zhu, W. Qin, X. Tao, F. Fan, R. Li and C. Li, Angew. Chem., Int. Ed., 2020, 59, 9653–9658 CrossRef CAS.
- J. Liang, X. Yang, Y. Wang, P. He, H. Fu, Y. Zhao, Q. Zou and X. An, J. Mater. Chem. A, 2021, 9, 12898–12922 RSC.
- J. Kosco, F. Moruzzi, B. Willner and I. McCulloch, Adv. Energy Mater., 2020, 10, 2001935 CrossRef CAS.
- Z. Lin, W. Li and G. Yang, Appl. Catal., B, 2018, 227, 35–43 CrossRef CAS.
- Z. Li, H. Fang, Z. Chen, W. Zou, C. Zhao and X. Yang, Appl. Catal., B, 2022, 312, 121374 CrossRef CAS.
- X. Zhu, Z. Song, Z. Wang, W. Liu, B. Hong, J. Bao, C. Gao and S. Sun, Appl. Catal., B, 2020, 274, 119010 CrossRef CAS.
- Y. Liu, J. Wu and F. Wang, Appl. Catal., B, 2022, 307, 121144 CrossRef CAS.
- Z. Wu, X. Wang, Y. Li, H. Zhao, J. Wang, H. Huang, Y. Liu and Z. Kang, Appl. Catal., B, 2022, 305, 121047 CrossRef CAS.
- A. F. Saber, A. M. Elewa, H.-H. Chou and A. F. M. El-Mahdy, Appl. Catal., B, 2022, 316, 121624 CrossRef CAS.
- Y. Chen, D. Jiang, Z. Gong, Q. Li, R. Shi, Z. Yang, Z. Lei, J. Li and L.-N. Wang, J. Mater. Sci. Technol., 2020, 38, 93–106 CrossRef.
- Q. Yang, M. Luo, K. Liu, H. Cao and H. Yan, Appl. Catal., B, 2020, 276, 119174 CrossRef CAS.
- Y. Fu, X. Zhu, L. Huang, X. Zhang, F. Zhang and W. Zhu, Appl. Catal., B, 2018, 239, 46–51 CrossRef CAS.
- I. Krivtsov, D. Mitoraj, C. Adler, M. Ilkaeva, M. Sardo, L. Mafra, C. Neumann, A. Turchanin, C. Li, B. Dietzek, R. Leiter, J. Biskupek, U. Kaiser, C. Im, B. Kirchhoff, T. Jacob and R. Beranek, Angew. Chem., Int. Ed., 2020, 59, 487–495 CrossRef CAS PubMed.
- Y. Zhao, X. Li, X. Fan, H. Wang, Y. Liu, Y. Chen, T. Yang, J. Ye, H. Huang, H. Li, X. Zhang, Y. Liu, H. Lin, Y. Zhao and Z. Kang, Appl. Catal., B, 2022, 314, 121499 CrossRef CAS.
- J. Zhao, C. a. Liu, H. Wang, Y. Fu, C. Zhu, H. Huang, F. Liao, Y. Liu, M. Shao and Z. Kang, Catal. Today, 2020, 340, 152–160 CrossRef CAS.
- B. Yao, H. Huang, Y. Liu and Z. Kang, Trends Chem., 2019, 1, 235–246 CrossRef CAS.
- X. Wu, J. Zhao, L. Wang, M. Han, M. Zhang, H. Wang, H. Huang, Y. Liu and Z. Kang, Appl. Catal., B, 2017, 206, 501–509 CrossRef CAS.
- X. Gu, Z. Chen, Y. Li, J. Wu, X. Wang, H. Huang, Y. Liu, B. Dong, M. Shao and Z. Kang, ACS Appl. Mater. Interfaces, 2021, 13, 24814–24823 CrossRef CAS.
- Y. Zhou, F. Yu, Z. Lang, H. Nie, Z. Wang, M. Shao, Y. Liu, H. Tan, Y. Li and Z. Kang, Chem. Eng. J., 2021, 426, 130709 CrossRef CAS.
- Y. Zhou, Y. Sun, C. Zhu, Y. Liu, X. Dai, J. Zhong, Q. Chen, H. Tian, R. Zhou and Z. Kang, J. Mater. Chem. A, 2018, 6, 8955–8961 RSC.
- B. Gong, W. Liu, X. Chen, H. Tan, X. Zhang, H. Wang, D. Yu, G. Li and Z. Song, Carbohydr. Polym., 2017, 165, 13–21 CrossRef CAS PubMed.
- X. Zhai, J. Gao, X. Wang, S. Mei, R. Zhao, Y. Wu, C. Hao, J. Yang and Y. Liu, Chem. Eng. J., 2018, 345, 209–220 CrossRef CAS.
- D. Yu, G. Li, F. Kong, H. Wang, W. Liu, Z. Song, X. Meng and J. R. H. Zhao, Appl. Clay Sci., 2020, 191, 105608 CrossRef CAS.
- R. Ren, Z. Zhang, P. Zhao, J. Shi, K. Han, Z. Yang, D. Gao and F. Bi, J. Dispersion Sci. Technol., 2019, 40, 627–633 CrossRef CAS.
- H. C. W. Parks, T. M. McCoy and R. F. Tabor, Adv. Mater. Interfaces, 2019, 6, 1900392 CrossRef.
- X. Wang, X. Wang, Y. Ma, Q. Wu, Z. Wang, Y. Tao, Y. Zhao, B. Wang and J. Cao, Laser Photonics Rev., 2021, 15, 2000412 CrossRef CAS.
- C. Zhu, C. a. Liu, Y. Fu, J. Gao, H. Huang, Y. Liu and Z. Kang, Appl. Catal., B, 2019, 242, 178–185 CrossRef CAS.
- K. Wei, H. Nie, Y. Li, X. Wang, Y. Liu, Y. Zhao, H. Shi, H. Huang, Y. Liu and Z. Kang, J. Colloid Interface Sci., 2022, 616, 769–780 CrossRef CAS PubMed.
- Y. Fu, C. a. Liu, M. Zhang, C. Zhu, H. Li, H. Wang, Y. Song, H. Huang, Y. Liu and Z. Kang, Adv. Energy Mater., 2018, 8, 1802525 CrossRef.
- S. Clouser, A. C. S. Samia, E. Navok, J. Alred and C. Burda, Top. Catal., 2008, 47, 42–48 CrossRef CAS.
- X. Wang, M. Zhang, Y. Ma, J. Wu, Y. Wang, H. Huang, Y. Liu and Z. Kang, Appl. Surf. Sci., 2022, 583, 152540 CrossRef CAS.
- S. Ratso, I. Kruusenberg, A. Sarapuu, P. Rauwel, R. Saar, U. Joost, J. Aruväli, P. Kanninen, T. Kallio and K. Tammeveski, J. Power Sources, 2016, 332, 129–138 CrossRef CAS.
- V. Datsyuk, M. Kalyva, K. Papagelis, J. Parthenios, D. Tasis, A. Siokou, I. Kallitsis and C. Galiotis, Carbon, 2008, 46, 833–840 CrossRef CAS.
- X. Wang, W. Bian, Y. Ma, Y. Liu, Z. Wang, C. Shi, H. Lin, Y. Liu, H. Huang and Z. Kang, J. Colloid Interface Sci., 2021, 591, 281–289 CrossRef CAS PubMed.
- F. Li, Y. Liu, B. Mao, L. Li, H. Huang, D. Zhang, W. Dong, Z. Kang and W. Shi, Appl. Catal., B, 2021, 292, 120154 CrossRef CAS.
- A. A. Ismail and D. W. Bahnemann, Sol. Energy Mater. Sol. Cells, 2014, 128, 85–101 CrossRef CAS.
- J. Wang, Y. Liu, Y. Han, K. Bao, T. He, H. Huang, Y. Liu and Z. Kang, J. Mater. Chem. A, 2022, 10, 15074–15079 RSC.
- S. F. Wong, J. S. Lim and S. S. Dol, J. Pet. Sci. Eng., 2015, 135, 498–504 CrossRef CAS.
- T. Shen, S. Zhou, J. Ruan, X. Chen, X. Liu, X. Ge and C. Qian, Adv. Colloid Interface Sci., 2021, 287, 102299 CrossRef CAS.
- M. N. Khan and I. I. Fagge, Prog. React. Kinet. Mech., 2018, 43, 1–20 CrossRef CAS.
- Y. Li, Y. Zhao, J. Wu, Y. Han, H. Huang, Y. Liu and Z. Kang, J. Mater. Chem. A, 2021, 9, 25453–25462 RSC.
- H. Nie, K. Wei, Y. Li, Y. Liu, Y. Zhao, H. Huang, M. Shao, Y. Liu and Z. Kang, Chin. Chem. Lett., 2021, 2283–2286 CrossRef CAS.
- Q. Wu, J. Cao, X. Wang, Y. Liu, Y. Zhao, H. Wang, Y. Liu, H. Huang, F. Liao, M. Shao and Z. Kang, Nat. Commun., 2021, 12, 483 CrossRef CAS.
- Q. Liang, S. Zhao, Z. Li, Z. Wu, H. Shi, H. Huang and Z. Kang, ACS Appl. Mater. Interfaces, 2021, 13, 40754–40765 CrossRef.
- Y. Zhao, Y. Liu, Z. Wang, Y. Ma, Y. Zhou, X. Shi, Q. Wu, X. Wang, M. Shao, H. Huang, Y. Liu and Z. Kang, Appl. Catal., B, 2021, 289, 120035 CrossRef CAS.
- Y. Han, J. Wu, Y. Li, X. Gu, T. He, Y. Zhao, H. Huang, Y. Liu and Z. Kang, Appl. Catal., B, 2022, 304, 121944 Search PubMed.
- Q. Liang, L. Liu, Z. Wu, H. Nie, H. Shi, Z. Li and Z. Kang, J. Mater. Chem. A, 2021, 9, 9105–9112 RSC.
- H. Li, W. Kong, J. Liu, N. Liu, H. Huang, Y. Liu and Z. Kang, Carbon, 2015, 91, 66–75 CrossRef CAS.
- Q. Wu, Y. Liu, J. Cao, Y. Sun, F. Liao, Y. Liu, H. Huang, M. Shao and Z. Kang, J. Mater. Chem. A, 2020, 8, 11773–11780 RSC.
- Y. Liu, Y. Zhao, Y. Sun, J. Cao, H. Wang, X. Wang, H. Huang, M. Shao, Y. Liu and Z. Kang, Appl. Catal., B, 2020, 270, 128184 CrossRef.
Footnote |
| † Electronic supplementary information (ESI) available. See DOI: https://doi.org/10.1039/d2ta07562h |
| This journal is © The Royal Society of Chemistry 2023 |