
 Open Access Article
 This Open Access Article is licensed under a
 Creative Commons Attribution 3.0 Unported Licence
Voltage hysteresis loop as a fingerprint of slow kinetics Co2+-to-Co3+ transition in layered NaxCox/2Ti1−x/2O2 cathodes for sodium batteries†
Daria
Mikhailova
 *a,
Mikhail V.
Gorbunov
a,
Hoang Bao
An Nguyen
a,
Björn
Pohle
a,
Sebastian
Maletti
b and
Christian
Heubner
c
*a,
Mikhail V.
Gorbunov
a,
Hoang Bao
An Nguyen
a,
Björn
Pohle
a,
Sebastian
Maletti
b and
Christian
Heubner
c
aLeibniz Institute for Solid State and Materials Research (IFW) Dresden e.V., Helmholtzstr. 20, D-01069 Dresden, Germany. E-mail: d.mikhailova@ifw-dresden.de
bTU Dresden, Institute of Materials Science, Helmholtzstr. 6, 01069 Dresden, Germany
cFraunhofer Institute for Ceramic Technologies and Systems IKTS, Winterbergstr. 28, 01277 Dresden, Germany
First published on 21st November 2022
Abstract
Sodium transition metal oxides are one of the most promising cathode materials for future sodium ion batteries. Chemical flexibility of layered Na-oxides including cobalt enables its partial substitution by other redox-active or non-active metals, often leading to structural stabilization. Sharing the same structural positions with other transition metals in layered oxides, Co can be double- or triple-charged, and as Co3+ can adopt a low-spin (LS), intermediate-spin (IS), high-spin (HS) state, or a combination of them. Using Ti4+ in the structure together with Co2+ results in a reduced number of phase transformations compared to Ti-free compositions. However, a large potential hysteresis of about 1.5–2.5 V between battery charge and discharge is observed, pointing a first-order cooperative phase transition. Based on several examples, we found that Na extraction from NaxCox/2Ti1−x/2O2 materials with high-spin HS-Co2+, crystallizing in the P2 or O3 structure, mostly results in valence and spin-state transition of Co, leading to the formation of a second phase with a low-spin LS-Co3+, and a much smaller unit cell volume. We elucidated a kinetic origin of the potential hysteresis, which can be minimized by increasing temperature or reduction of the current density during battery cycling with P2- and O3-Na0.67Co0.33Ti0.67O2 materials. The slow kinetics of the structural phase transition, especially upon Na-insertion, hampers the application of classical methods of electrochemical thermodynamics, such as determining the entropic potential dE/dT. We showed that the entropic potential depends only on the Na-content in NaxCo0.33Ti0.67O2 during battery charge or discharge, what additionally confirms a kinetic nature of the potential hysteresis.
Introduction
Sodium-ion batteries (SIBs), first explored in close analogy to lithium-ion batteries (LIBs) in the 1980s, have come back into the spotlight because of their great potential as successors to lithium batteries in low-cost electrical energy storage.1 Since they belong to the same alkali group, Na-containing materials and their electrochemistry have many similarities with Li, so SIB development is based on the success story of the LIB technology. Within a short period of time, a variety of cathode and anode materials have been explored, and some of them have shown promise for practical SIBs. However, as our understanding increases, it is becoming clear that analogous electrode materials in SIBs and LIBs and their electrochemical behavior have less in common than expected.The high redox potential of cobalt and its ability to change the oxidation state from +2 to +4 make cobalt-containing layered oxides promising cathode materials for SIBs with a high theoretical specific capacity, and a high energy density.2–5 Various NaxCoO2 layered oxides with different crystal structures having octahedral (O) or prismatic (P) oxygen surrounding of Na atoms demonstrate plenty of phase transformations during Na-extraction and insertion, associated with formation and ordering of Na-vacancies, and change in the lattice symmetry.2 Due to a relatively big size of Na cations in comparison to Li, and multiple phase transformations, such cobalt-containing oxides have poor rate capability of sodiation and desodiation because of a high energy barrier for the phase boundary movement. In most cases, the observed specific capacity is significantly lower than the theoretical one, suggesting only partial redox activity of cobalt.2,4 Furthermore, the preparation procedure of NaxCoO2 is hard to control since the material is very sensitive to the Na-content and synthesis temperature, resulting in multi-phase samples.6,7 At least three different structures, O3, P3 and P2, are usually obtained for NaxCoO2 compositions by a solid-state synthesis.7,8 This impedes scaling-up of the material production as well. Therefore, for a commercial application in electrochemical energy storage devices, improvements in electrochemical performance are needed, including suppression of irreversible and very slow phase transformations, and extension of solid-solution regions. A common way to enhance the structural stability and to reduce the number of phase transformations implies a cation replacement in metal–oxygen layers due to a high chemical flexibility of the layered structure. Different redox-active and inactive transition metals were already implemented to partially substitute Co in NaxCoO2 oxides.3,9–11 Particularly, the partial substitution by Mn, Fe, and Ti has been shown to improve the electrochemical performance of NaxCoO2 in Na-batteries. In case of the Mn-doping, P2-Na0.67Co0.67Mn0.33O2 (ref. 12 and 13) and P2-Na0.67Co0.5Mn0.5O2 (ref. 14) were studied in detail regarding electrochemical properties, structural changes and charge compensation mechanism during (de)sodiation. It was shown that Na-removal from Na0.67Co0.67Mn0.33O2 to at least x(Na) = 0.40 occurs as a single-phase process, and a subsequent Na-insertion up to x(Na) = 0.9 proceeds as a solid-solution process as well. Low-spin Co3+ and Mn4+ cations were confirmed in the pristine material, while only Co3+ participated in the redox process during Na-removal.12 Partial replacement of Co by Ti stabilizes the crystal structure resulting in less phase varieties after solid-state synthesis and less phase transformations upon (de)sodiation.11,15–21 For application as a cathode in Na-batteries, replacement of Co with Ti up to 50 at% is reasonable, while a higher substitution degree would lower the specific capacity. During Na-extraction, a change in the oxidation state of Co from Co2+ to Co4+ occurs to compensate the charge deficit in the structure.17,19
Electrochemical behavior of P2, O3 and P3 Na-oxides with Co and Ti is quite different. While P2-Na0.67Co0.5Ti0.5O2 provides a capacity of about 100 mA h g−1 without noticeable cell polarization,16 O3 and P3 phases show a much higher specific capacity of almost 200 mA h g−1 accompanied by large hysteresis of the cell voltage of about 2 V during battery charging and discharging.17,19
Various explanations for this phenomenon have been proposed. First, a large difference in Co–O bond lengths in initial O3-NaCo0.5Ti0.5O2 and de-sodiated P3-Na0.33Co0.5Ti0.5O2 was emphasized,17,19,22 which originates from different spin-states of cobalt in both phases: while high-spin HS-Co2+ was observed in O3-NaCo0.5Ti0.5O2, a low-spin LS-Co3+ was present in P3-Na0.33Co0.5Ti0.5O2.17 This spin-state transition of Co was further confirmed by DFT calculations.19 Second, two reaction paths with different intermediate states were proposed for Na-removal from O3-NaCo0.5Ti0.5O2, and Na-insertion into P3-Na0.33Co0.5Ti0.5O2,19,22 leading to a potential hysteresis.
A composition-induced spin-state transition phenomenon has never been reported for layered Li-oxides with Co due to a much smaller structural lattice and generally shorter Co–O distances, which force Co to adopt the low-spin state already in the fully lithiated state (“chemical pressure”). Due to the similar ionic radii of Co2+ and Li+, synthesis of substituted compositions results mostly in a rock-salt structure with cation mixing. In case of the bigger Na cations, the crystal lattice is more expanded along the c-axis, and Na and transition metal cations do not share crystallographic positions. Consequently, an intermediate or a high-spin state of Co can be stabilized in the sodiated state. Na-extraction from the structure results in a lattice shrinkage, which can lead to a spin-state transition of Co. Although a noticeable potential hysteresis was also observed for some layered Li, Co-oxide cathodes as for example Li-rich xLi2MnO3·(1−x) LiCoO2, an involvement of oxygen anions in the redox reaction (oxygen redox) was proposed as the reason.23,24
However, details regarding the phase transitions in layered Na,Co-oxides are still not completely understood, although they are very important for the targeted design of cobalt-containing materials for battery application. In this work, we discuss thermodynamic and kinetic aspects of phase transformations in layered Na,Co,Ti-oxides including spin-state transition under operation in Na-batteries. Two Na0.67Co0.33Ti0.67O2 compounds with different P2 and O3 structures were selected for detailed room-temperature structural and temperature-dependent electrochemical investigations using classical diffraction and thermodynamic methods. These materials can easily be (de)-sodiated in Na-batteries, thus representing optimal model systems to study correlations between phase transformations upon Na-removal, spin-state transition, and temperature- and time-dependent electrochemical behavior. The presence of diamagnetic Ti4+ cations in the structure, randomly sharing positions with Co2+, prevents any strong magnetic interactions between Co ions.
Experimental
P2- and O3-Na0.67Co0.33Ti0.67O2 materials were prepared by solid-state reactions using stoichiometric amounts of Na2CO3 (Fluka, >99.0%), TiO2 (Sigma Aldrich) and Co(CH3COO)2·4H2O (Alfa Aesar, >99.0%). Powdered mixtures of reactants were placed in alumina crucibles and heated up to 600 °C for 15 h in air. After that, powders were ground, pressed into pellets and annealed at 900 °C (O3) and 940 °C (P2) for 25 h in air. The synthesis temperatures were adopted from the work.25 In order to obtain materials with high crystallinity, P2 was quenched to room temperature from 900 °C, while the O3 material from 800 °C. After heat treatment, the samples were immediately transferred to an Argon-filled glovebox.For phase analysis and determination of cell parameters, powder X-ray diffraction was carried out using the STOE STADI P diffractometer with Co-Kα1 radiation (λ = 1.78896 Å) in a transmission mode. To avoid air contact, samples were sealed between polyimide sheets. For both materials, structural parameters were determined by Rietveld analysis based on all available reflections using the program Fullprof implemented in the WinPLOTR software.26
Electrochemical investigations
Electrochemical tests were performed in two-electrode Swagelok-type cells using a VMP3 potentiostat (Biologic Instruments). Electrodes were prepared by pressing a mixture of the active material with Super P carbon (BASF) as a conductive additive and poly(tetrafluoroethylene) (PTFE, Aldrich) as a binder, in the 80![[thin space (1/6-em)]](https://www.rsc.org/images/entities/char_2009.gif) :10:10 weight ratio onto an aluminium current collector. Sodium anodes were home-made by rolling pieces of metallic sodium (Alfa Aesar, 99.95%) into plates and cutting out as disks. A glass fiber cloth (Whatman, GF/D), soaked with electrolyte, served as separator. A home-made electrolyte contained 1 M NaClO4 (ACS, 98.0–102.0%) dissolved in a mixture of propylene carbonate (PC, BASF) and ethylene carbonate (EC, BASF) in the 1:1 ratio with adding 5% fluoroethylene carbonate (FEC, BASF).
:10:10 weight ratio onto an aluminium current collector. Sodium anodes were home-made by rolling pieces of metallic sodium (Alfa Aesar, 99.95%) into plates and cutting out as disks. A glass fiber cloth (Whatman, GF/D), soaked with electrolyte, served as separator. A home-made electrolyte contained 1 M NaClO4 (ACS, 98.0–102.0%) dissolved in a mixture of propylene carbonate (PC, BASF) and ethylene carbonate (EC, BASF) in the 1:1 ratio with adding 5% fluoroethylene carbonate (FEC, BASF).
For measurements of the entropic potential dE/dT, electrodes were prepared by mixing the active material powders with polyvinylidenfluorid PVDF 5130 (Solvay) and carbon black (Super P, Imerys) in N-methyl-2-pyrrolidone (NMP, 99.5%, GPR Rectapur®) in a 77/11.5/11.5 weight ratio and casting the mixture onto an Al foil (MTI). The electrodes were assembled against Na metal (99%, Alfa Aesar) as counter and reference electrode using an electrolyte of 1 M NaClO4 (>99.9%, Sigma Aldrich) in PC:FEC 98:2 (Sigma Aldrich). Electrochemical thermodynamic tests were carried out in CR2032 coin cells, using two glass microfiber separators (Whatman GF/C), soaked with electrolyte. The electrochemical measurements were performed in a climate test chamber (BIND9020-0199, Binder) using a multichannel potentiostat (VMP3, Biologic). First, the cells were subjected to a formation procedure by cycling three times between 0.2 V and 4.4 V to establish stable conditions. Afterwards, the cells were charged stepwise to different states of charge (SoC) by applying a constant current of 0.1C, corresponding to deintercalation of 1 Na per formula unit during 10 h, for 20 min. After each charging step, the cells were allowed to relax for 12 h. At each SoC, the entropic potential dE/dT was determined by temperature-dependent measurements of the equilibrium potential. Therefore, the temperature was varied linearly between 15 and 35 °C at a rate of dT/dt = 0.5 K min−1, while recording the open-circuit potential. This procedure was repeated for each charge step until the cut-off potential of 4.4 V was reached. Subsequently, a similar procedure was carried out for the discharging process.
Operando X-ray diffraction
Operando X-ray diffraction measurements on P2- and O3-Na0.67Co0.33Ti0.67O2 were performed in a transmission mode, using laboratory STOE STADI P diffractometer with Mo K-α1 radiation (λ = 0.7093 Å). The home-built experimental setup represents a single coin cell holder connected to a one-channel VMP3 potentiostat. For experiments, dedicated in situ coin cells 2032 with windows of 4 mm diameter on both sides, closed by Kapton foil, were used.In order to characterize the P2- and O3–Na0.67Co0.33Ti0.67O2 pristine materials, a pattern was recorded before the electrochemical process (Na-removal and -insertion) was started. The electrochemical cell was then successively charged and discharged in galvanostatic mode at a current corresponding to the intercalation or deintercalation of 1 Na per formula unit during 20 h (0.05C rate). All diffraction patterns were analysed by Fullprof implemented into the software package FullProf Suite.26 The Al-foil as current collector on the cathode side served as an internal standard during the measurements, and the refined lattice parameter of Al provided an independent control of the reliability of the obtained model parameters. Two different sample shifts, for the oxide and for the Al-foil, were considered in the analysis procedure.
Operando X-ray absorption measurements
Operando X-ray absorption experiments were carried out at the beamline P65 at PETRA III extension (DESY, Hamburg, Germany) in transmission and fluorescence setup. An 8-fold coin cell holder, coupled with a Biologic Instruments potentiostat, was used for electrochemical cycling.27 For EXAFS data analysis, the measured spectrum below the pre-edge was fitted linearly while the post-edge background contribution was fitted to a quadratic polynomial. This background μ0(E) was subtracted from the absorption spectrum μ(E) and the resulting data were normalized according to χ(E) = {μ(E) − μ0(E)}/Δμ0(E), where Δμ0(E) denotes the measured jump in absorption at the edge. The normalized spectrum was converted into k space using k = [2m(E − E0)/ℏ2]1/2. By weighting χ(k) with k3, contributions of higher k numbers were amplified. The resulting k3χ(k) function was Fourier-transformed into the R space, allowing determination of interatomic distances. Least-square fits were performed using the FEFF6 code.28Magnetization measurements
Magnetization measurements of pristine, charged and discharged P2-and O3-Na0.67Co0.33Ti0.67O2 materials were performed using a SQUID magnetometer (MPMS) from Quantum Design. The temperature dependences of the magnetization were measured both in zero-field-cooled (ZFC) and in field-cooled (FC) mode between T = 2 and 330 K at 6 T. Magnetic susceptibilities in the paramagnetic region were analysed in terms of the modified Curie–Weiss law with a temperature-independent paramagnetic contribution χ0:χ = C/(T − θ) + χ0, where the Curie constant C = NAμeff2/3kB yields the paramagnetic effective moment μeff.
Results and discussion
Solid state synthesis and preliminary characterization
According to the composition stability diagram for O3 and P2 structural modifications of NaxCo2+x/2Ti4+1−x/2O2,25 a material with the Na0.67Co0.33Ti0.67O2 stoichiometry can adopt both O3 and P2 structures by temperature variation during synthesis. We found that the P2 structure needs a higher synthesis temperature of 940 °C in air and a fast cooling to room temperature from 900 °C. For preparation of the O3 phase, a lower temperature of 900 °C in air was used. The sample was quenched to room temperature from 800 °C. According to the XRD analysis, these synthesis conditions provided single-phase materials, crystallizing in P63/mmc (P2-phase) and R![[3 with combining macron]](https://www.rsc.org/images/entities/char_0033_0304.gif) m (O3-phase) space groups, see Fig. 1. Structural data for both materials, presented in Table 1, disclosed for the P2 phase a shorter average (Co, Ti)–O distance of 1.985(3) Å and a longer Na–O distance of 2.485(4) Å in trigonal NaO6-prisms in comparison to (Co, Ti)–O of 2.024(1) Å and Na–O of 2.409(2) Å in NaO6-octahedra in the O3-phase. The structural transformation O3 → P2 at high temperatures is caused by the lattice energy changes, arisen from the stronger metal–oxygen bonding in P2 than in O3, and the entropy factor. In the P2-lattice, Na-cations are distributed on two crystallographic sites in contrast to the O3-lattice with only one Na site (Table 1), leading to a higher entropy value.29 The Na+ diffusion pathways in both structures are different, namely a NaO6-octahedron → NaO4-tetrahedron – NaO6-octahedron through narrow triangular faces in O3, and a more voluminous NaO6-prism(1) → NaO6-prism(2) – NaO6-prism(1) through rectangular faces together with longer Na–O bonds in P2. This must result in a higher ionic conductivity and a lower energy barrier for Na-diffusivity in the P2 material, in accordance with the reported experimental data.28 However, as it was shown by theoretical calculations, Na-diffusivity in P2-type NaxMO2 structures is strongly Na-concentration dependent, being superior for x(Na) < 0.67 and inferior for x(Na) > 0.67 compared to O3-NaxMO2.30 The O3-type structure, in contrast, is less Na-content dependent30
m (O3-phase) space groups, see Fig. 1. Structural data for both materials, presented in Table 1, disclosed for the P2 phase a shorter average (Co, Ti)–O distance of 1.985(3) Å and a longer Na–O distance of 2.485(4) Å in trigonal NaO6-prisms in comparison to (Co, Ti)–O of 2.024(1) Å and Na–O of 2.409(2) Å in NaO6-octahedra in the O3-phase. The structural transformation O3 → P2 at high temperatures is caused by the lattice energy changes, arisen from the stronger metal–oxygen bonding in P2 than in O3, and the entropy factor. In the P2-lattice, Na-cations are distributed on two crystallographic sites in contrast to the O3-lattice with only one Na site (Table 1), leading to a higher entropy value.29 The Na+ diffusion pathways in both structures are different, namely a NaO6-octahedron → NaO4-tetrahedron – NaO6-octahedron through narrow triangular faces in O3, and a more voluminous NaO6-prism(1) → NaO6-prism(2) – NaO6-prism(1) through rectangular faces together with longer Na–O bonds in P2. This must result in a higher ionic conductivity and a lower energy barrier for Na-diffusivity in the P2 material, in accordance with the reported experimental data.28 However, as it was shown by theoretical calculations, Na-diffusivity in P2-type NaxMO2 structures is strongly Na-concentration dependent, being superior for x(Na) < 0.67 and inferior for x(Na) > 0.67 compared to O3-NaxMO2.30 The O3-type structure, in contrast, is less Na-content dependent30
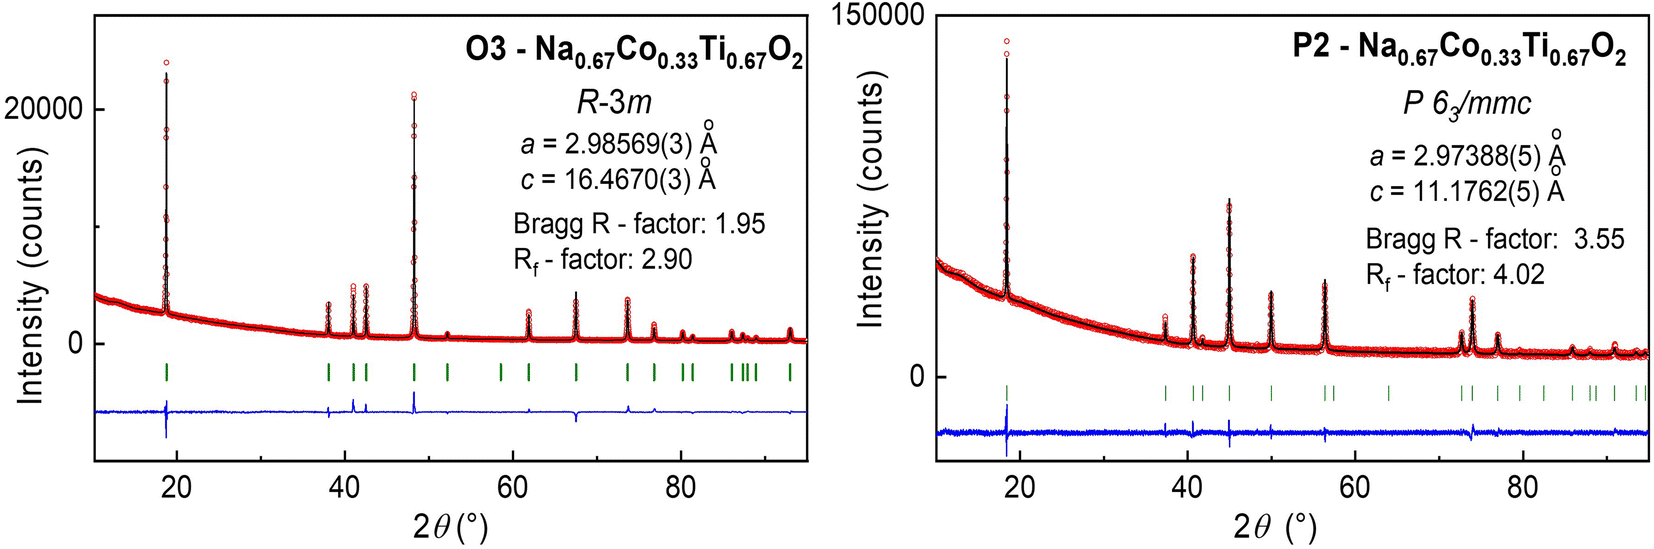 | ||
| Fig. 1 Experimental XRD patterns of O3- and P2-Na0.67Co0.33Ti0.67O2 (red spheres) together with the calculated one (black line) and the difference between them (blue line). Green marks correspond to the position of Bragg reflections, determined by Rietveld analysis. Structural parameters of both Na0.67Co0.33Ti0.67O2 modifications are presented in Table 1. | ||
| O3-Na0.67Co0.33Ti0.67O2 | P2-Na0.67Co0.33Ti0.67O2 | |
|---|---|---|
| Space group |
Rm |
P63/mmc |
| a (Å), c (Å) | 2.98569(3), 16.4670(3) | 2.97388(5), 11.1762(5) |
| V (Å3) | 127.126(3) | 85.600(4) |
| V/f.u. (Å3) | 42.375(1) | 42.800(2) |
| Z | 3 | 2 |
| Co,Ti (x, y, z) | 3a (0, 0, 0) | 2a (0, 0, 0) |
| B (Å2) | 2.61(4) | 3.2(1) |
| Na1 (x, y, z) | 3b (0, 0, 0.5) | 2b (0, 0, 0.25) |
| n(Na1) | 0.666(4) | 0.188(6) |
| Na2 (x, y, z) | — | 2c (0.33, 0.66, 0.25) |
| n(Na2) | — | 0.420(10) |
| B (Å2) | 3.5(1) | 3.1(4) |
| O1 (x, y, z) | 6c (0, 0, 0.2689(1)) | 4f (0.6667, 0.3333, 0.0892(5)) |
| B (Å2) | 2.63(5) | 2.3(1) |
| (Co, Ti) – O (Å) | 2.024(1) × 6 | 1.985(3) × 6 |
| Na–O (Å) | 2.409(2) × 6 | 2.485(4) × 6 |
| Bragg R-factor, % | 1.95 | 3.55 |
| R f-factor, % | 2.90 | 4.02 |
Electrochemical properties
Since the crystal structure of both compounds is Na-deficient, they can be used for Na-removal (as a cathode) as well as for Na-insertion (as an anode) in Na-batteries, with nearly the same specific capacity in the assumption that Co2+ is reversibly oxidized to Co3+ during desodiation, while half of Ti4+ ions are reversibly reduced to Ti3+. The electrochemical characteristics of the two materials during desodiation (charging) and sodiation (discharging) are in principle very similar. Both materials show a large hysteresis of the cell voltage between charging and discharging between 4.2 and 0.2 V (see Fig. 2). Such a large potential hysteresis upon Na-removal and insertion, already reported for NaxCo0.5Ti0.5O2 materials in our previous work,17 was supposed to be associated with a phase transition, accompanied by a spin-state transition of high-spin HS-Co2+ to low-spin LS-Co3+. Generally, we can expect a similar scenario for other Co2+/Ti4+ ratios and particularly for Na0.67Co0.33Ti0.67O2, although a small difference in the crystal structures of P2 and O3 could have a certain impact on the transition and the electrochemical behavior. In the first cycles, both structures provide very similar overall specific capacity (Fig. 2a). The P2 structure exhibits a higher capacity in the low potential window between 0.2 and 2.6 V, while the O3 structure shows a higher value in the high-voltage region. Separate measurements of P2 and O3 in the low-potential window of 0.2–2.6 V, reflecting their Na-intercalation ability, provided reversible capacities of 65 mA h g−1 and 45 mA h g−1, respectively. Note that at potentials below 1 V, carbon black, which is added as a conductive component to the composite electrode, incorporates some sodium ions as well, see Fig. S1.†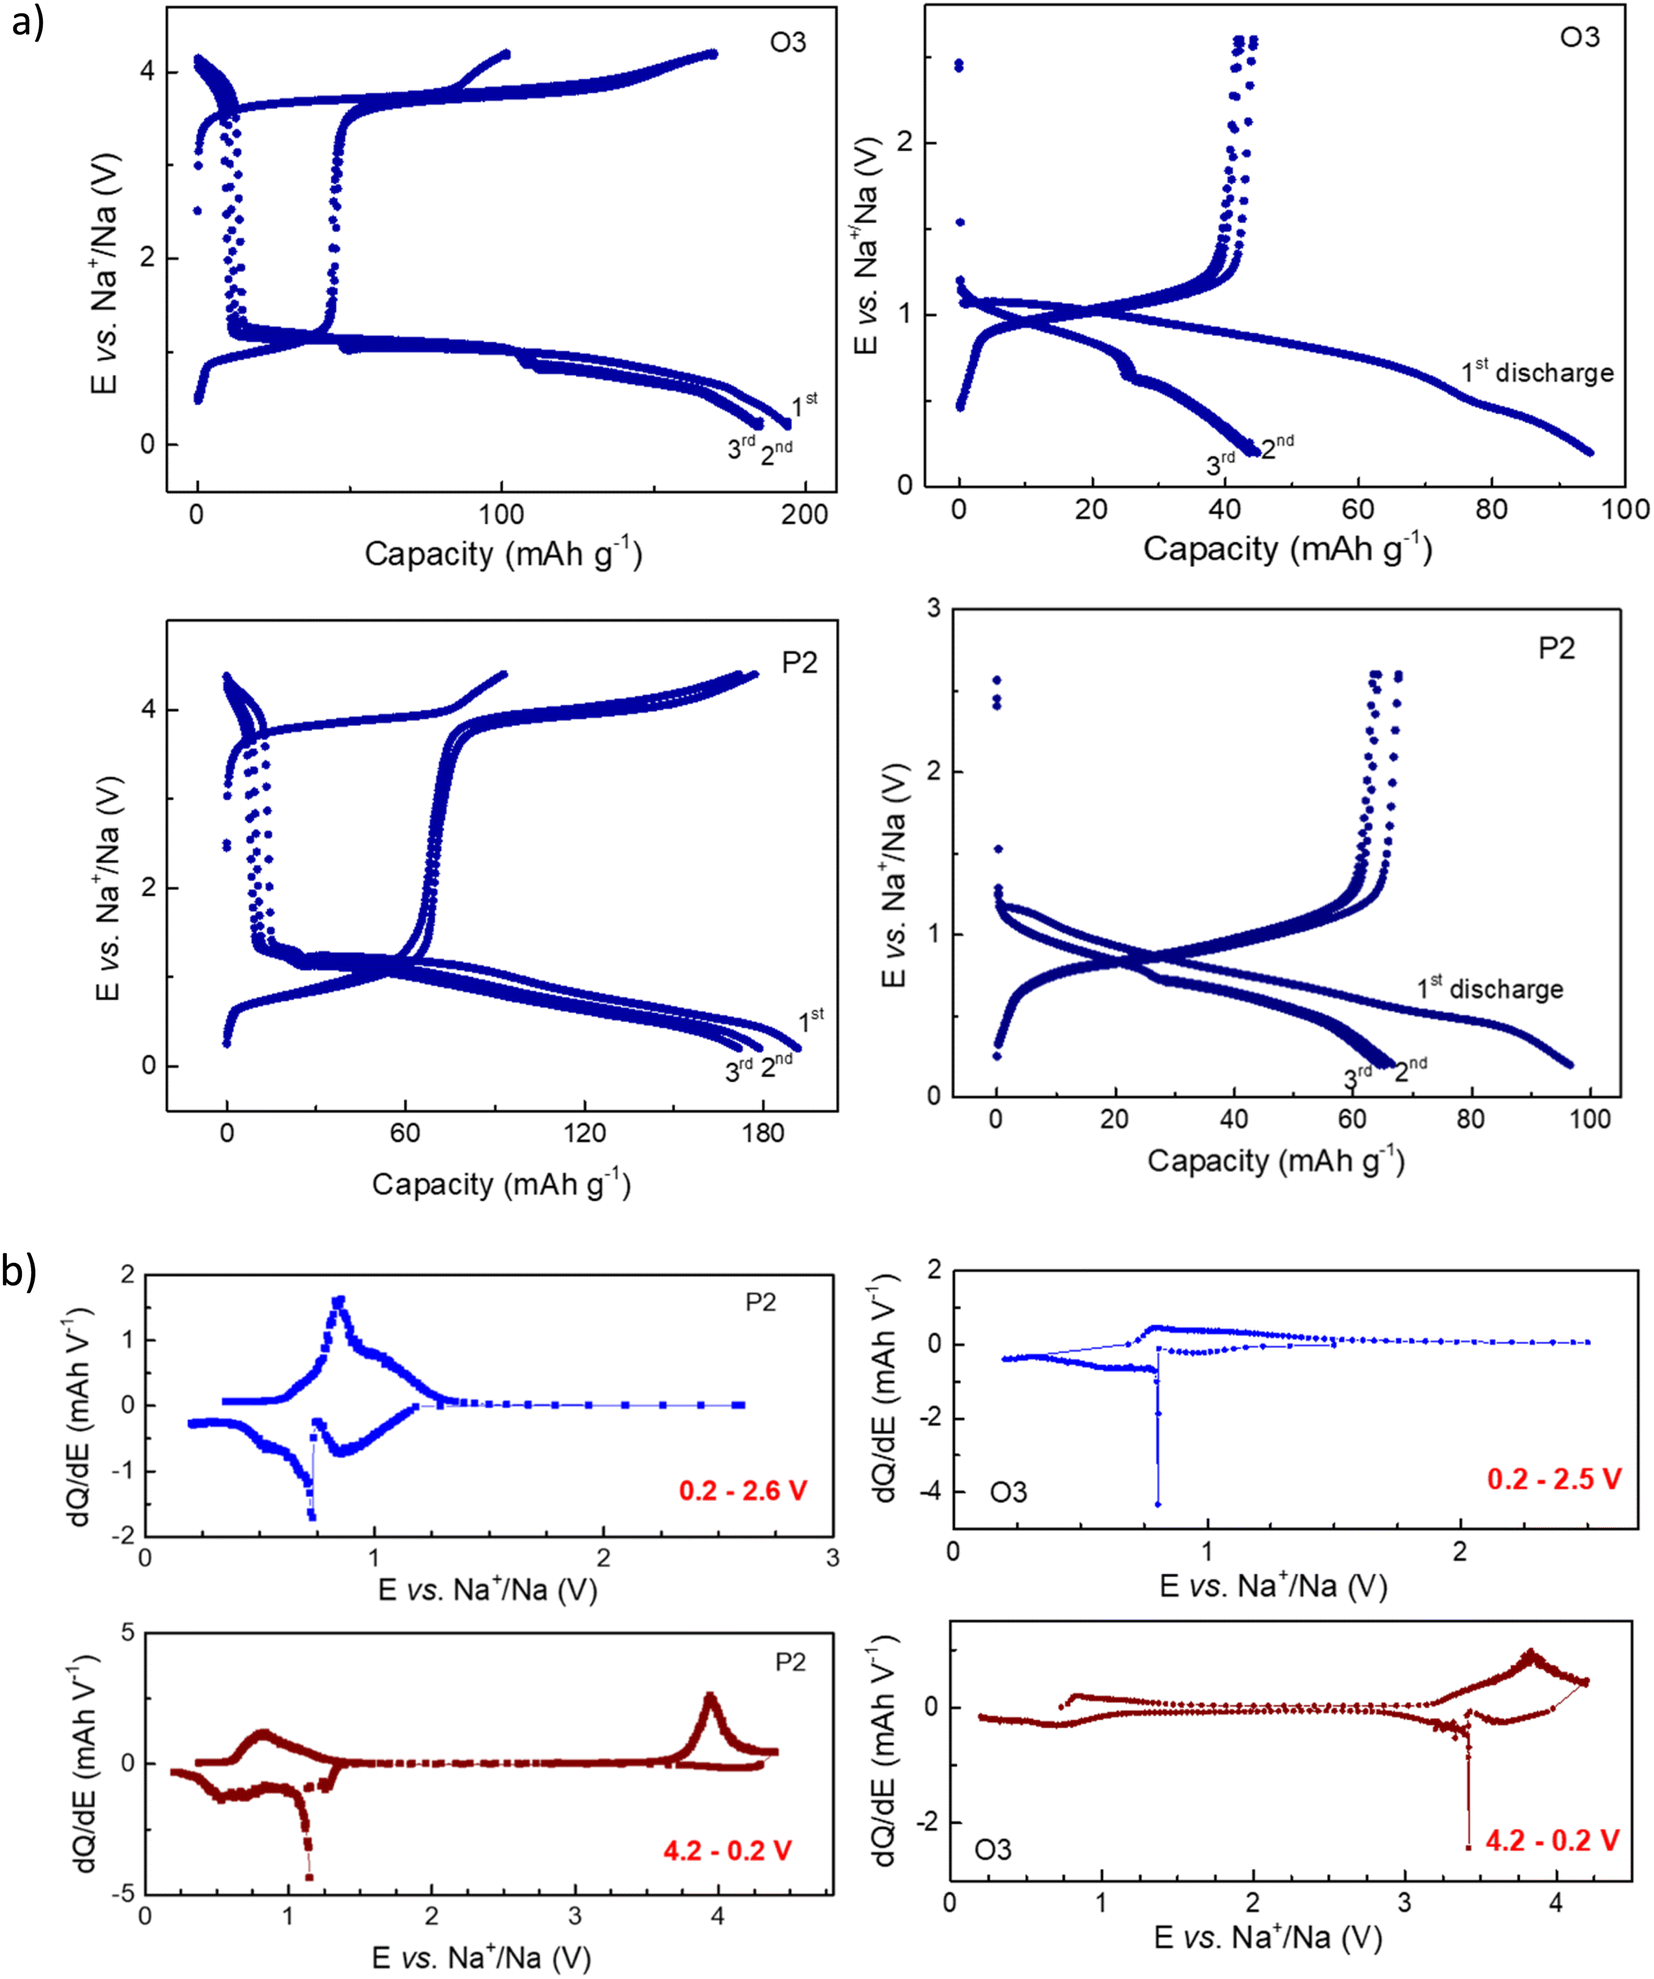 | ||
| Fig. 2 (a) Examples of electrochemical cycling of O3- and P2-Na0.67Co0.33Ti0.67O2 with 0.1C in Na-batteries in the potential range between 4.2 and 0.2 V (cell charge was applied first) and 0.2 V and 2.6 V (first discharge). For the last case, only Ti is supposed to be redox-active. (b) dQ/dE differential curves for O3 and P3 phase plotted from the graphs (a) for the second cycle. | ||
The difference in the electrochemical activities of P2 and O3 phases in the potential range of 4.2–0.2 V, can clearly be seen in differential capacity plots dQ/dE (Fig. 2b). During sodiation, O3 shows redox activity around 3.5 V, although the major process takes place around 1 V, whereas for P2, the redox reaction during Na-insertion sets first at cell potentials around 1 V.
As mentioned above, the potential hysteresis observed for P2- and O3-Na0.67Co0.33Ti0.67O2 strongly resembles the behavior of previously reported NaxCo0.5Ti0.5O2. Therefore, at the next step, the underlying reaction mechanisms and temperature dependence of the electrochemical properties of these two phases were investigated and compared with those of NaxCo0.5Ti0.5O2, with the purpose to elaborate special characteristics of the systems responsible for the large potential hysteresis loop.
Reaction mechanisms in P2- and O3-Na0.67Co0.33Ti0.67O2 modifications
Using O3-NaCo0.5Ti0.5O2, we have shown that during sodiation upon cell discharge Co was reduced to Co2+, while Ti remained in the structure as Ti4+, even down to cell potentials close to 0 V vs. Na+/Na.17 In contrast, for Na0.67Co0.33Ti0.67O2, increase of the Na content higher than x(Na) > 0.67, must result in reduction of Ti4+. Since the intercalation process after charge of Na0.67Co0.33Ti0.67O2 to 4.2 V begins below 1.6 V, two possible scenarios can be realized here, either (i) Co- and Ti-based redox processes are independent and well-separated on the potential scale, or (ii) Co-reduction occurs simultaneously with the Ti-reduction during sodiation. Operando diffraction experiments not only provide information about the crystallographic phases that participate in the redox process, but also enable analysis of interatomic distances, which indirectly reflect the valence states of metals.Crystal structure evolution of P2- and O3-Na0.67Co0.33Ti0.67O2 during Na-removal and insertion
 | ||
| Fig. 3 Results of operando XRD measurements for the P2 phase. (a) Part of a waterfall-plot of diffraction patterns, and corresponding electrochemical curve, (b) a and c cell parameters and unit cell volumes of P2- and P2*-phase changes during Na-removal and insertion, (c) relative amount of P2-phase in the “NaxCo0.33Ti0.67O2”-material during battery charge and discharge. | ||
During desodiation, the lattice parameter c of the initial P2 phase, which strongly correlates with the Na occupancy number in the structure, slightly changes. The difference between the highest c-value and initial c0-value for P2, calculated as Δc/c0, is 0.17%. It is much smaller than the value of 1.5%, calculated for the P3-NaxCo0.5Ti0.5O2 material, showing a single-phase de-intercalation mechanism,17 in which all structural changes are originated from the Na-removal. Therefore, a quasi-constant composition of P2 can be assumed. Lattice parameters of the new P2* phase change more at the beginning of the formation up to about 40 wt% in the material. This is concerned primarily with nucleation and growth processes of the new phase. Starting from the composition corresponding to about 50% wt% of each phase in the material, lattice parameters of P2* do not change notably anymore. Hence, a quasi-constant composition of P2* can be proposed as well.
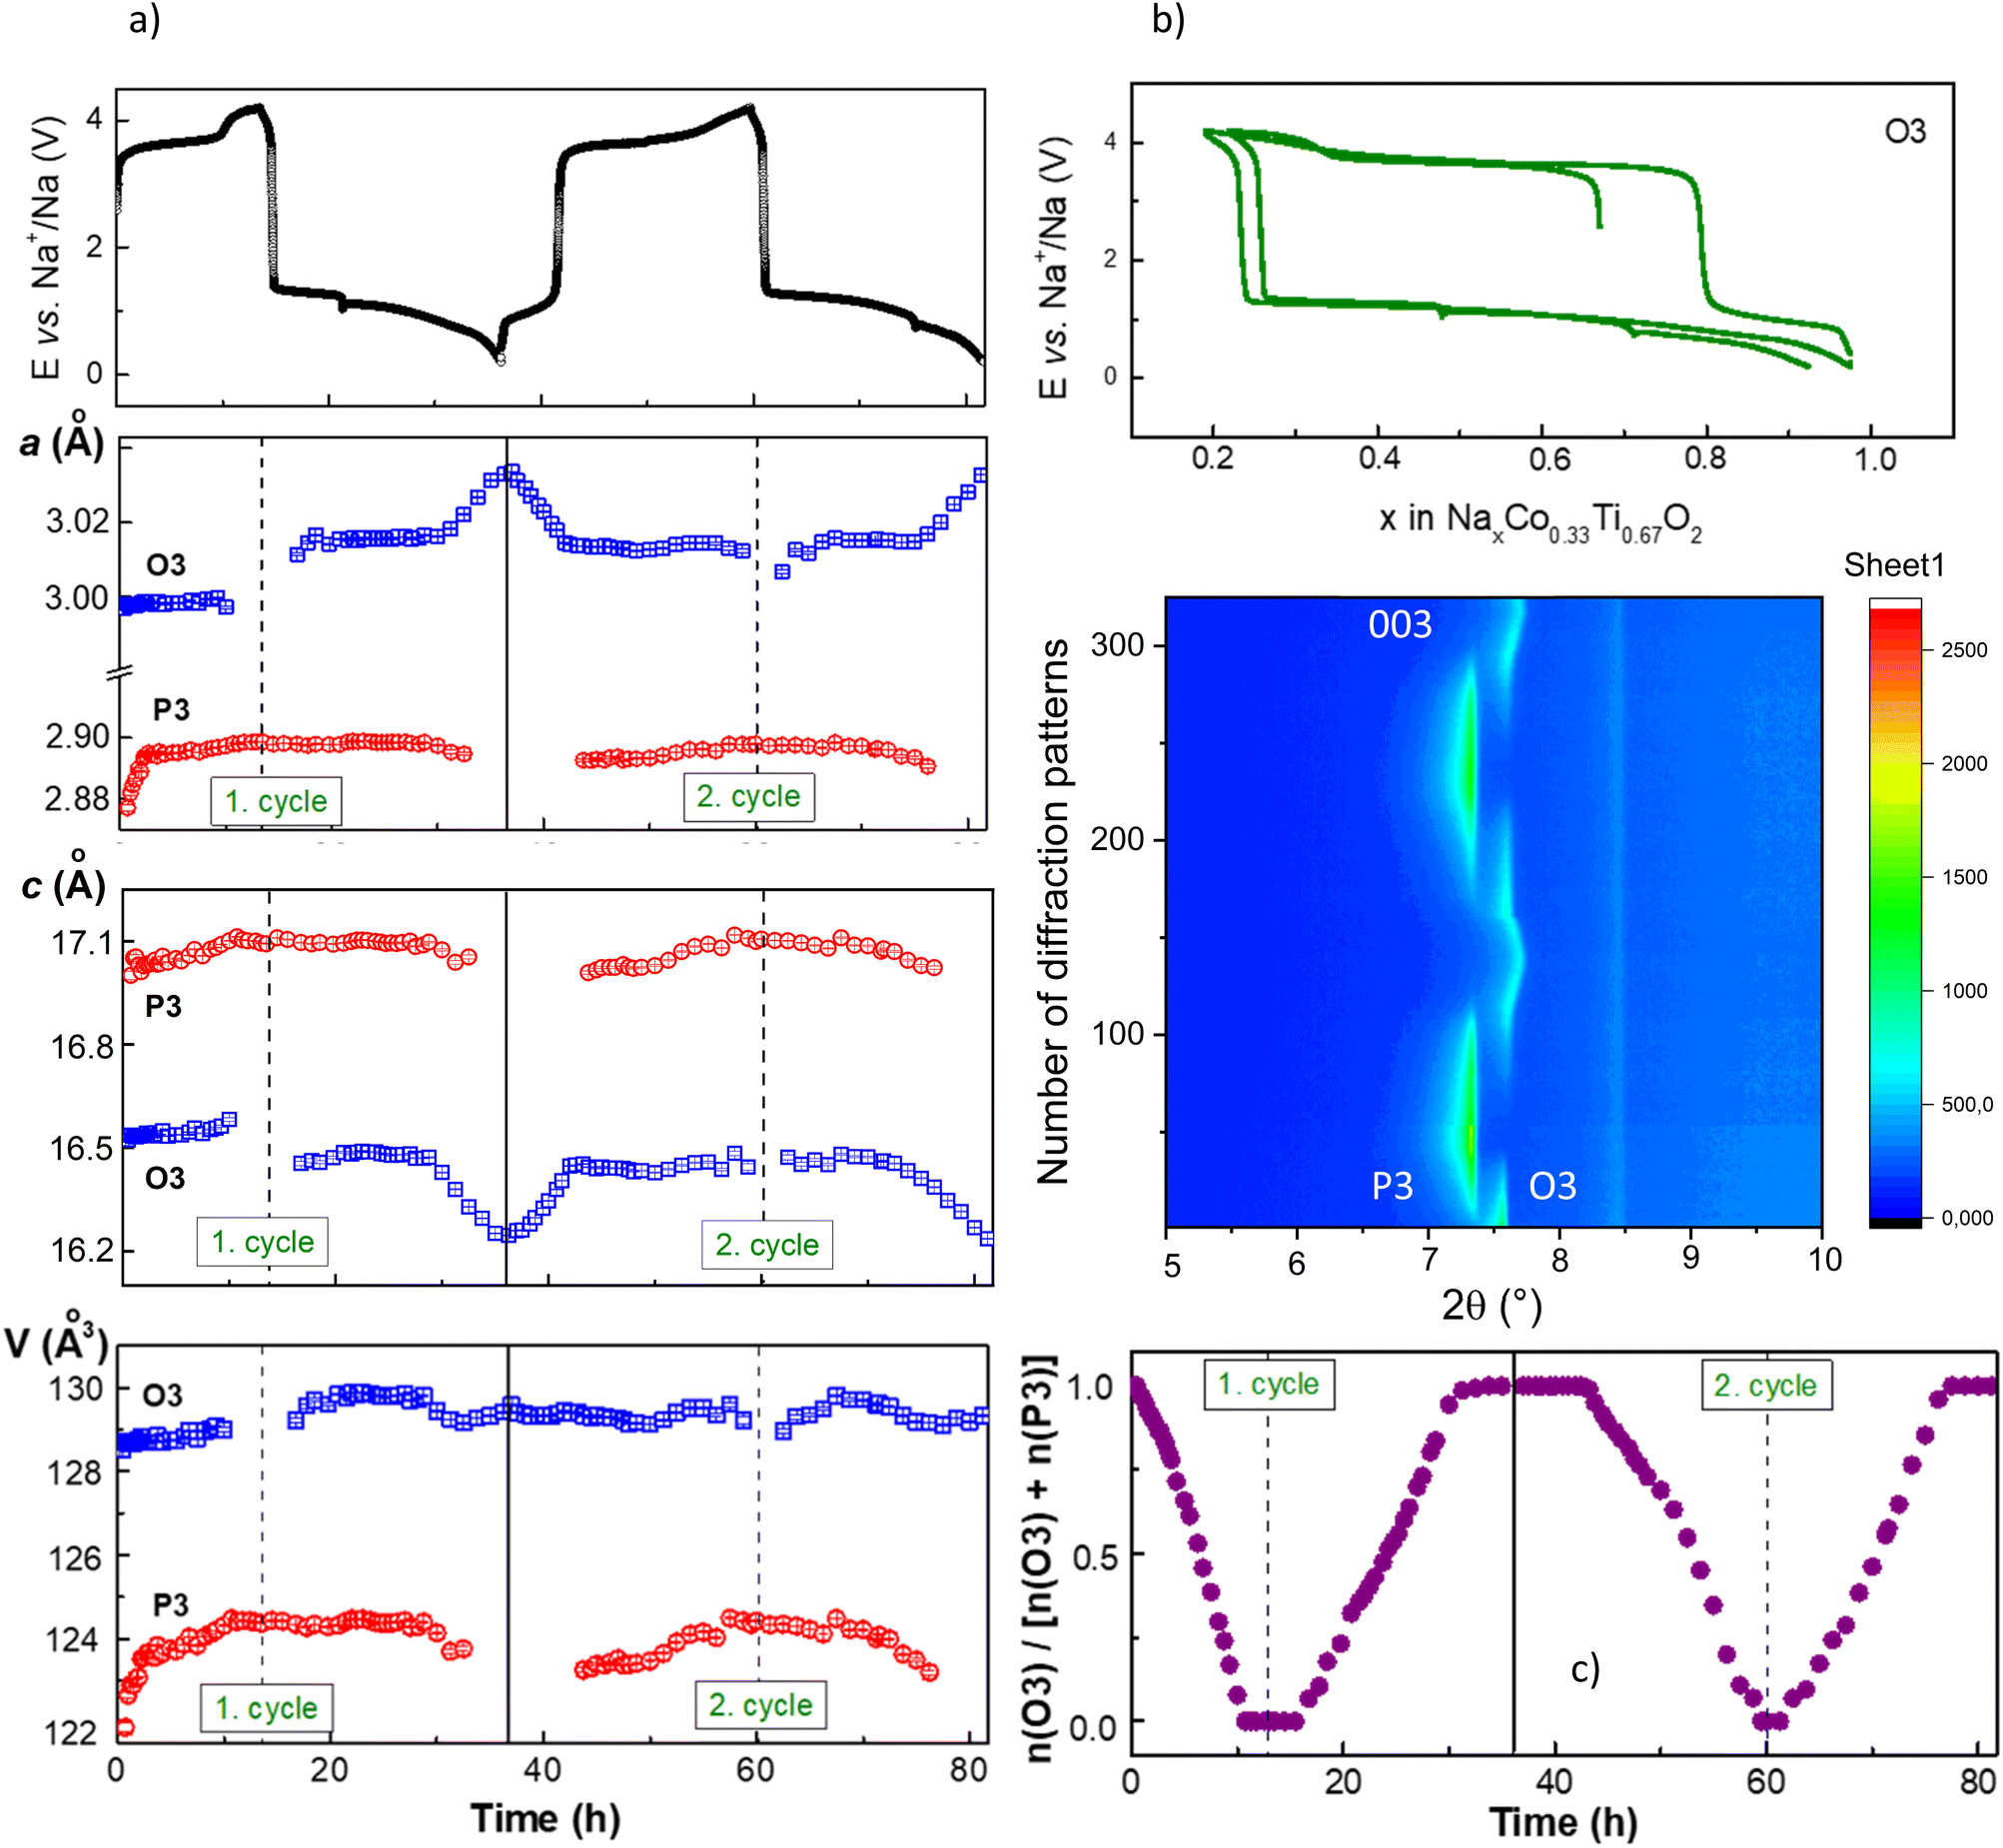 | ||
| Fig. 4 Results of operando XRD measurements for the O3 phase. (a) the a and c cell parameter changes and unit cell volumes of O3- and P3-phase during Na-removal and insertion, (b) part of a waterfall-plot of diffraction patterns, and the corresponding electrochemical curve, (c) the relative amount of O3 in the “Na0.67−xCo0.33Ti0.67O2”-material during cell charge and discharge. | ||
After extraction of 0.05 Na, reflections of a second phase with P3 symmetry appeared in the diffraction patterns. The transition of the O3 into the P3 phase can be envisaged like sliding of the oxygen layer across the Na layer by (1/3, 1/3, 0).6 Both O3 and P3 phases co-exist during the entire charging process. The P3 phase has a smaller lattice parameter a and a bigger parameter c, similar to the new P2* phase in case of the P2 material. At the end of the charging process, the initial O3 structure disappears completely, and the electrode potential increases sharply. Analysis of the data revealed a very small change in the lattice parameter c of the O3 phase, while more noticeable changes in the lattice parameters a and c of the P3 phase were observed. During the discharge process, the reflections of the O3 phase appeared after the electrode potential decreased to 1.3 V and about 0.1 Na was inserted into the material. Interestingly, the cell metrics of the O3 phase slightly differ from the pristine ones, pointing that the O3 phase has a slightly higher Na-content during discharging, like the P2 material. Therefore, a two-phase reaction mechanism with almost constant composition of the O3 and P3 phases can be deduced.
Upon discharge, at the total Na-content of 0.8 (Na0.8Co0.33Ti0.67O2), the O3 material is already single-phase, in contrast to the P2 material with only 60% of the initial phase. A bigger mismatch between the pristine and the formed phases may decelerate the phase transformation. However, analysis of the cell volume per formula unit, which corresponds to V/2 for the P2/P2* and V/3 for the O3/P3 phases, gives a smaller difference of 1.50 Å3 for the P2 material compared with 1.67 Å3 for the O3 material. Therefore, despite the lower mismatch between the unit cell volume in the initial and formed structure, and supposed enhanced Na-diffusion properties, P2 shows more impeded kinetics upon sodiation than O3, since the phase transformation P3 → O3 is completed while P2* → P2 is still occurring. Interestingly, the nucleation mechanism of P2* and P3 phases is different. Just formed P2* structure is larger at the beginning of crystal growth than in the “equilibrium” state while P3 structure is smaller, as can be seen from the unit cell volumes at the beginning of formation at cell discharging.
Evaluation of the local cobalt environment
Valence and spin states of cobalt in O3 and P2 with various Na-contents were evaluated. Since Co and Ti cations in both NaxCo0.33Ti0.67O2 materials share the same crystallographic site in the structure, XRD analysis cannot give a direct information about geometry of CoO6 octahedra and particularly about Co–O bond lengths, which are directly related to the valence and spin state of Co. However, such information can be obtained from the XAS analysis. Ex situ XAS studies of O3- and P2-materials in different sodiation states showed Co2+ at the beginning of charge, and almost a Co3+ state at 4.2 V, if we examine the energy positions at 0.8 normalized intensity31 and compare them with the Co2+/Co3+ reference materials (Fig. 5 left). | ||
| Fig. 5 Normalized Co–K edge absorption spectra of O3- and P2-NaxCo0.33Ti0.67O2 in different states of charge, together with CoO, Co3O4 and Co(AcAc)3 as Co2+, Co2+/Co3+ and Co3+ reference materials, respectively (left). Right: experimental and simulated Fourier transformations of the k3-weighted Co–K EXAFS data for the P2 material in selected states of sodiation. | ||
The results of EXAFS fits for the P2 material are shown in Fig. 5 (left), while for the O3 material in Fig. S2.† The Co–O distances of 2.09 and 2.10 Å in the initial O3 and P2 are very close to 2.12 Å of cubic CoO with high-spin (HS) Co2+,32 while a Co–O bond length of 1.92 Å of both materials after charge is very close to the distance of 1.93 Å in LaCoO3 with Co3+ and a trigonal Rc structure.33 In the O3-NaxCo0.5Ti0.5O2 material after charge, the Co–O bond length of 1.89 Å corresponded to low-spin (LS) Co3+.17 Therefore, we can also expect the presence of LS-Co3+ in charged NaxCo0.33Ti0.67O2. Note, both P2 and O3 materials in a fully sodiated state after a complete charge–discharge cycle reached the Co–O distances of the initial state (Table 2).
| Sample | Shell | R (Å) | ΔE (eV) | σ 2 (Å2) | R-factor |
|---|---|---|---|---|---|
| Pristine O3-Na0.67Co0.33Ti0.67O2 | Co–O | 2.085 | 1.933 | 0.007 | 0.015 |
| Co–(Co, Ti) | 2.96 | 0.01 | |||
| Pristine P2-Na0.67Co0.33Ti0.67O2 | Co–O | 2.097 | −1.808 | 0.007 | 0.021 |
| Co–(Co, Ti) | 2.97 | 0.02 | |||
| Charged O3-Na0.33Co0.33Ti0.67O2 | Co–O | 1.920 | −0.883 | 0.003 | 0.018 |
| Co–(Co, Ti) | 2.86 | 0.01 | |||
| Charged P2-Na0.33Co0.33Ti0.67O2 | Co–O | 1.924 | −5.815 | 0.003 | 0.019 |
| Co–(Co, Ti) | 2.88 | 0.01 | |||
| 1 cycle O3-Na1.0Co0.33Ti0.67O2 | Co–O | 2.097 | 1.345 | 0.005 | 0.0065 |
| Co–(Co, Ti) | 2.97 | 0.02 | |||
| 1 cycle P2-Na1.0Co0.33Ti0.67O2 | Co–O | 2.103 | −2.519 | 0.006 | 0.018 |
| Co–(Co, Ti) | 2.97 | 0.02 |
Magnetization measurements
Magnetization of P2 and O3 in certain states of sodiation in the temperature range of 2–330 K was measured to estimate the spin state of Co cations, see Fig. 6. Above 100 K, the magnetization curves of materials excluding P2-Na0.33Co0.33Ti0.67O2 obey a modified Curie–Weiss law with a temperature-independent paramagnetic contribution χ0:χ = C/(T − θ) + χ0, where the Curie constant C = NAμeff2/3kB yields the paramagnetic effective moment μeff; the results of calculations are presented in Table 3.
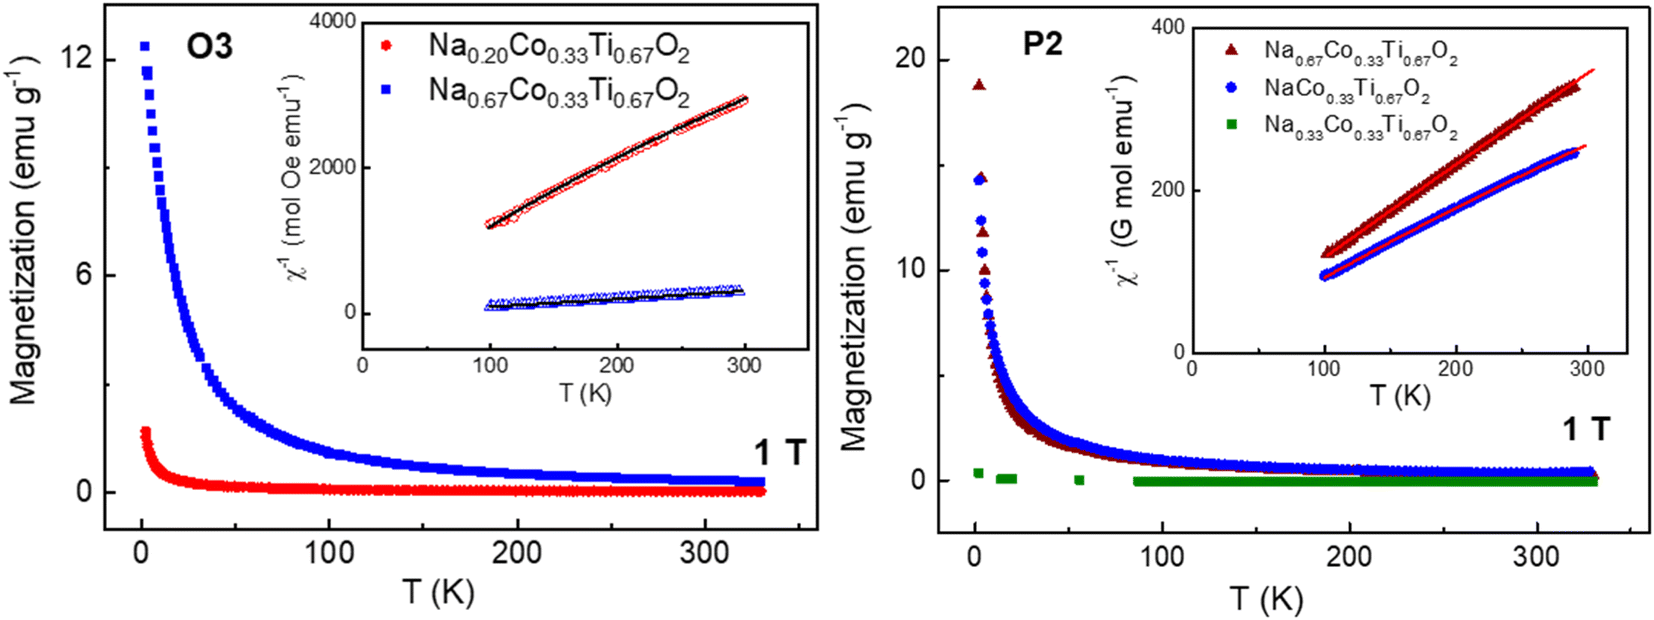 | ||
| Fig. 6 Temperature dependences of magnetization and magnetic susceptibility (inset) together with paramagnetic curves calculated by the Curie–Weiss equation, for O3 and P2 materials in different states of sodiation at the field strength of 1 T. | ||
| Material | μ eff (exp), μB/f.u. | θ, K | χ 0, emu per mol | T range for fit, K | μ eff (theor), μB/f.u. |
|---|---|---|---|---|---|
| O3-Na0.67Co0.33Ti0.67O2 | 2.70(2) | 16.3(1) | 0 | 100–300 | 2.22 (HS-Co2+) |
| O3-Na0.18Co0.33Ti0.67O2 | 0.83(2) | −13(1) | 5.77(3) × 10−5 | 100–300 | 0.69 (LS-Co3+ + LS-Co4+) |
| P2-Na0.67Co0.33Ti0.67O2 | 2.59(2) | 0 | 1.03(6) × 10−4 | 100–300 | 2.22 (HS-Co2+) |
| P2-Na0.33Co0.33Ti0.67O2 | Not a Curie–Weiss paramagnet | 100–300 | 0 | ||
| P2-Na1.0Co0.33Ti0.67O2 | 2.83(2) | 2.2(2) | 5.26(9) × 10−4 | 100–300 | 2.44 (HS-Co2+ + Ti3+) |
Both pristine O3 and P2 materials have a paramagnetic moment slightly higher than the spin-only calculation (S = 3/2), which can be referred to a strong unquenched orbital component often discussed for octahedrally coordinated HS-Co2+ in the literature.28,34–36 Furthermore, according to our expectations, the fully sodiated material with x(Na) = 1 shows a higher paramagnetic moment than the pristine and desodiated ones, since diamagnetic Ti4+ cations (d0) are partially reduced to paramagnetic Ti3+ (d1). The material with the P2-Na0.33Co0.33Ti0.67O2 composition does not show a temperature dependence of magnetization typical for a paramagnetic behavior, which can result from a non-magnetic low-spin Co3+ (S = 0). In contrast, overoxidized O3 material with the Na0.18Co0.33Ti0.67O2 composition becomes magnetic again, because of the presence of some amount of Co4+ (d5, S = 1/2). The magnetization measurements thus clearly demonstrate a transition of HS-Co2+ into LS-Co3+ and LS-Co4+ upon desodiation, and a transition back to HS-Co2+ upon sodiation.
Kinetic and thermodynamic considerations
Structural phase transformations in electrode materials during battery operation can be characterized in terms of enthalpy and entropy changes, if a linear temperature dependence of the equilibrium cell potential is available. According to the Gibbs' phase rule, if the cathode contains only one phase (for example O3-NaxCo0.33Ti0.67O2), the system exhibits one degree of freedom, f = 1, being mono-variant. It means that the cell potential depends on the amount of Na in the phase and varies with the Na concentration at a constant temperature. If the cathode contains two phases like O3-NaxCo0.33Ti0.67O2 and P3-NayCo0.33Ti0.67O2, the system is nonvariant (f = 0) and the cell potential is constant at fixed temperature and pressure, independently from the total amount of Na in the system.Operando XRD measurements have shown that upon desodiation of O3 and P2 materials, the second phase is formed already when a small Na amount is extracted, and a plateau-like dependence of the cell potential vs. Na content was observed, as expected for a two-phase coexistence.37 Of course, the sodium content in the pristine and new phase must be different. A moderate temperature change of the cell (between 0 °C and 40 °C in the temperature-dependent experiments) will influence the sodium content of both phases; however, the plateau-like behavior of the potential must retain in the two-phase region.
Hysteresis effects coming along with a spin-state transition (spin-crossover) in solids is a well-known phenomenon widely discussed in the literature in various fields. It involves a first-order phase transition, in which kinetics of nucleation and growth of the second phase play the major role.38 The presence of a large hysteresis reflects a non-equilibrium state arising from kinetic reasons, which make this process irreversible.39 In this case, studies of rate-dependent distortions of the hysteresis loop might be even more important than applying of conventional equilibrium thermodynamic approaches commonly used in electrochemistry, which might become meaningless or difficult to interpret in processes with a large kinetic impact.
To approach these issues, we studied the cell potential for the O3 and P2 cathodes as a function of temperature, current density (rate of (de)sodiation), and Na-composition using three different approaches: (i) a very slow galvanostatic charge–discharge cycling of P2 and O3 with 0.01C at constant temperatures between 0 °C and 40 °C, (ii) galvanostatic intermittent titration (GITT) with a long relaxation time of 8 h at 10–60 °C, and (iii) measurements of a temperature dependent open circuit voltage (OCV) at fixed Na-contents (entropic potential).
The GITT results, representing a cell potential development after a current pulse of 0.2C for 15 min followed by a relaxation time of 8 h, vs. Na content (Fig. 7a as an example for the O3 phase), still show some hysteresis behavior, although a hysteresis loop becomes noticeably smaller with the temperature. Interestingly, a much higher difference in the potentials between the immediate value and after relaxation time is observed during sodiation than desodiation. At x(Na) = 0.67, which corresponds to pure Co2+ in the composition, the cell potential values for charge and discharge overlap at all temperatures. A qualitative estimation of Na+ diffusion coefficients in P2 and O3 phases at 25 °C by GITT measurements gave values of about 10−8 to 10−9 cm2 s−1 for charging and below 10−10 cm2 s−1 during discharging, see Fig. S3.†
 | ||
| Fig. 7 Dependence of the cell potential of a Na-battery: (a) with the O3-cathode in GITT experiments with a current pulse of 0.2C for 15 min, corresponding to Δx(Na) = 0.05, and a relaxation time of 8 h at temperatures 10–60 °C, and (b) with the O3-and P2-cathode in GCPL experiments at 0.01 current density at temperatures 0°–40 °C. Potential hysteresis in GITT measurements is depicted as dotted lines. | ||
From slow GCPL measurements of O3 and P2 materials, the difference between the charge and discharge voltage curves becomes smaller with the temperature as well, see Fig. 7b. Moreover, for both materials, the charging potential (desodiation) demonstrates a weaker temperature dependence than the sodiation process. This coincidences with the GITT data, showing a weaker time-dependence of the voltage during charge, as well as with operando measurements of P2 and O3, showing a longer two-phase co-existence range during cell discharge in comparison to cell charge. Therefore, both O3 and P2 undergo an asymmetric potential hysteresis during (de)sodiation.
Further, we studied composition and temperature dependence of the open circuit voltage (OCV) of O3 and P2 to determine thermodynamic functions of sodium metal insertion into these materials. From the thermodynamic considerations applied to the electrochemical cell, the utilizable electrical energy corresponds to the reaction free energy for the cell discharge reaction ΔG0 = ΔG0(NaxCo0.33Ti0.67O2)reduction + ΔG0(Na)oxidation, where E0 is the equilibrium cell voltage, which is equal to the difference between the equilibrium potentials of the cathode and anode, F is the Faraday constant, and z is the number of charge per charge carrier (z = 1 for alkali cations).40 The cell discharge reaction can be represented as insertion of 1 mol Na into infinitive amount of the cathode oxide. The temperature dependence of the cell voltage ΔE at a constant cell pressure corresponds to reaction entropy.
| ΔG0 = −zFE0 = ΔH0 − TΔS0 | (1) |
 | (2) |
Accordingly, the entropy change caused by the cell reaction can be obtained by determining the temperature dependence of the OCV for a fixed composition.
The entropy change caused by the half-cell reaction is determined by difference in partial molar entropy between Na in the Na-metal anode and Na in the cathode. As the partial molar entropy of Na in the Na-metal anode does not change with the state of charge of the battery cell, any composition dependence is determined by changes of the partial molar entropy of Na in the cathode. Sodiation of the NaxCo0.33Ti0.67O2 cathode can be considered as the reaction P3 + Na → O3 with coexistence of P3/O3 phases, followed by a single-phase O3-region at high Na concentrations of 0.8–1.0. Since the lattice parameters of both O3 and P3 phases do not change considerably during (de)sodiation according to the operando XRD studies, we can assume the constant compositions O3-Na0.67Co0.33Ti0.67O2 and P3-Na0.33Co0.33Ti0.67O2 for the coexisting region.
Fig. 8a depicts exemplarily OCV measurements during linear temperature variation for various Na-compositions of the O3 material. While for x = 0.97 and x = 0.31, the changes in OCV correspond to the temperature changes, hardly any direct correlation exists in the case of x = 0.71. This becomes even more clear when plotting the OCV against the respective temperature (Fig. 8b). The linear relationship between the OCV and temperature for x = 0.97 and x = 0.31 enables determination of the entropic potential dE/dT, while an anomalous but reproducible hyperbolic correlation for x = 0.71 obviously does not allow reliable calculation. A correlation between the Na-compositions, for which a linear relationship between the OCV and respective temperature allowed entropy determination, and position of these compositions on the charging/discharging electrochemical curve is shown in Fig. 8c. The anomalous temperature behavior of the OCV was noticed for the compositions, which correspond to the nucleation and begin of crystal growth of the second phase with the changed oxidation and spin-state of Co. In this state, the system could be very sensitive to temperature variations, e.g. with respect to the stability of nuclei of the newly formed phase or the phase equilibrium itself. Outside this range, reliable linear fits could be performed and corresponding entropic potentials, dE/dT, were determined (Fig. 8d).
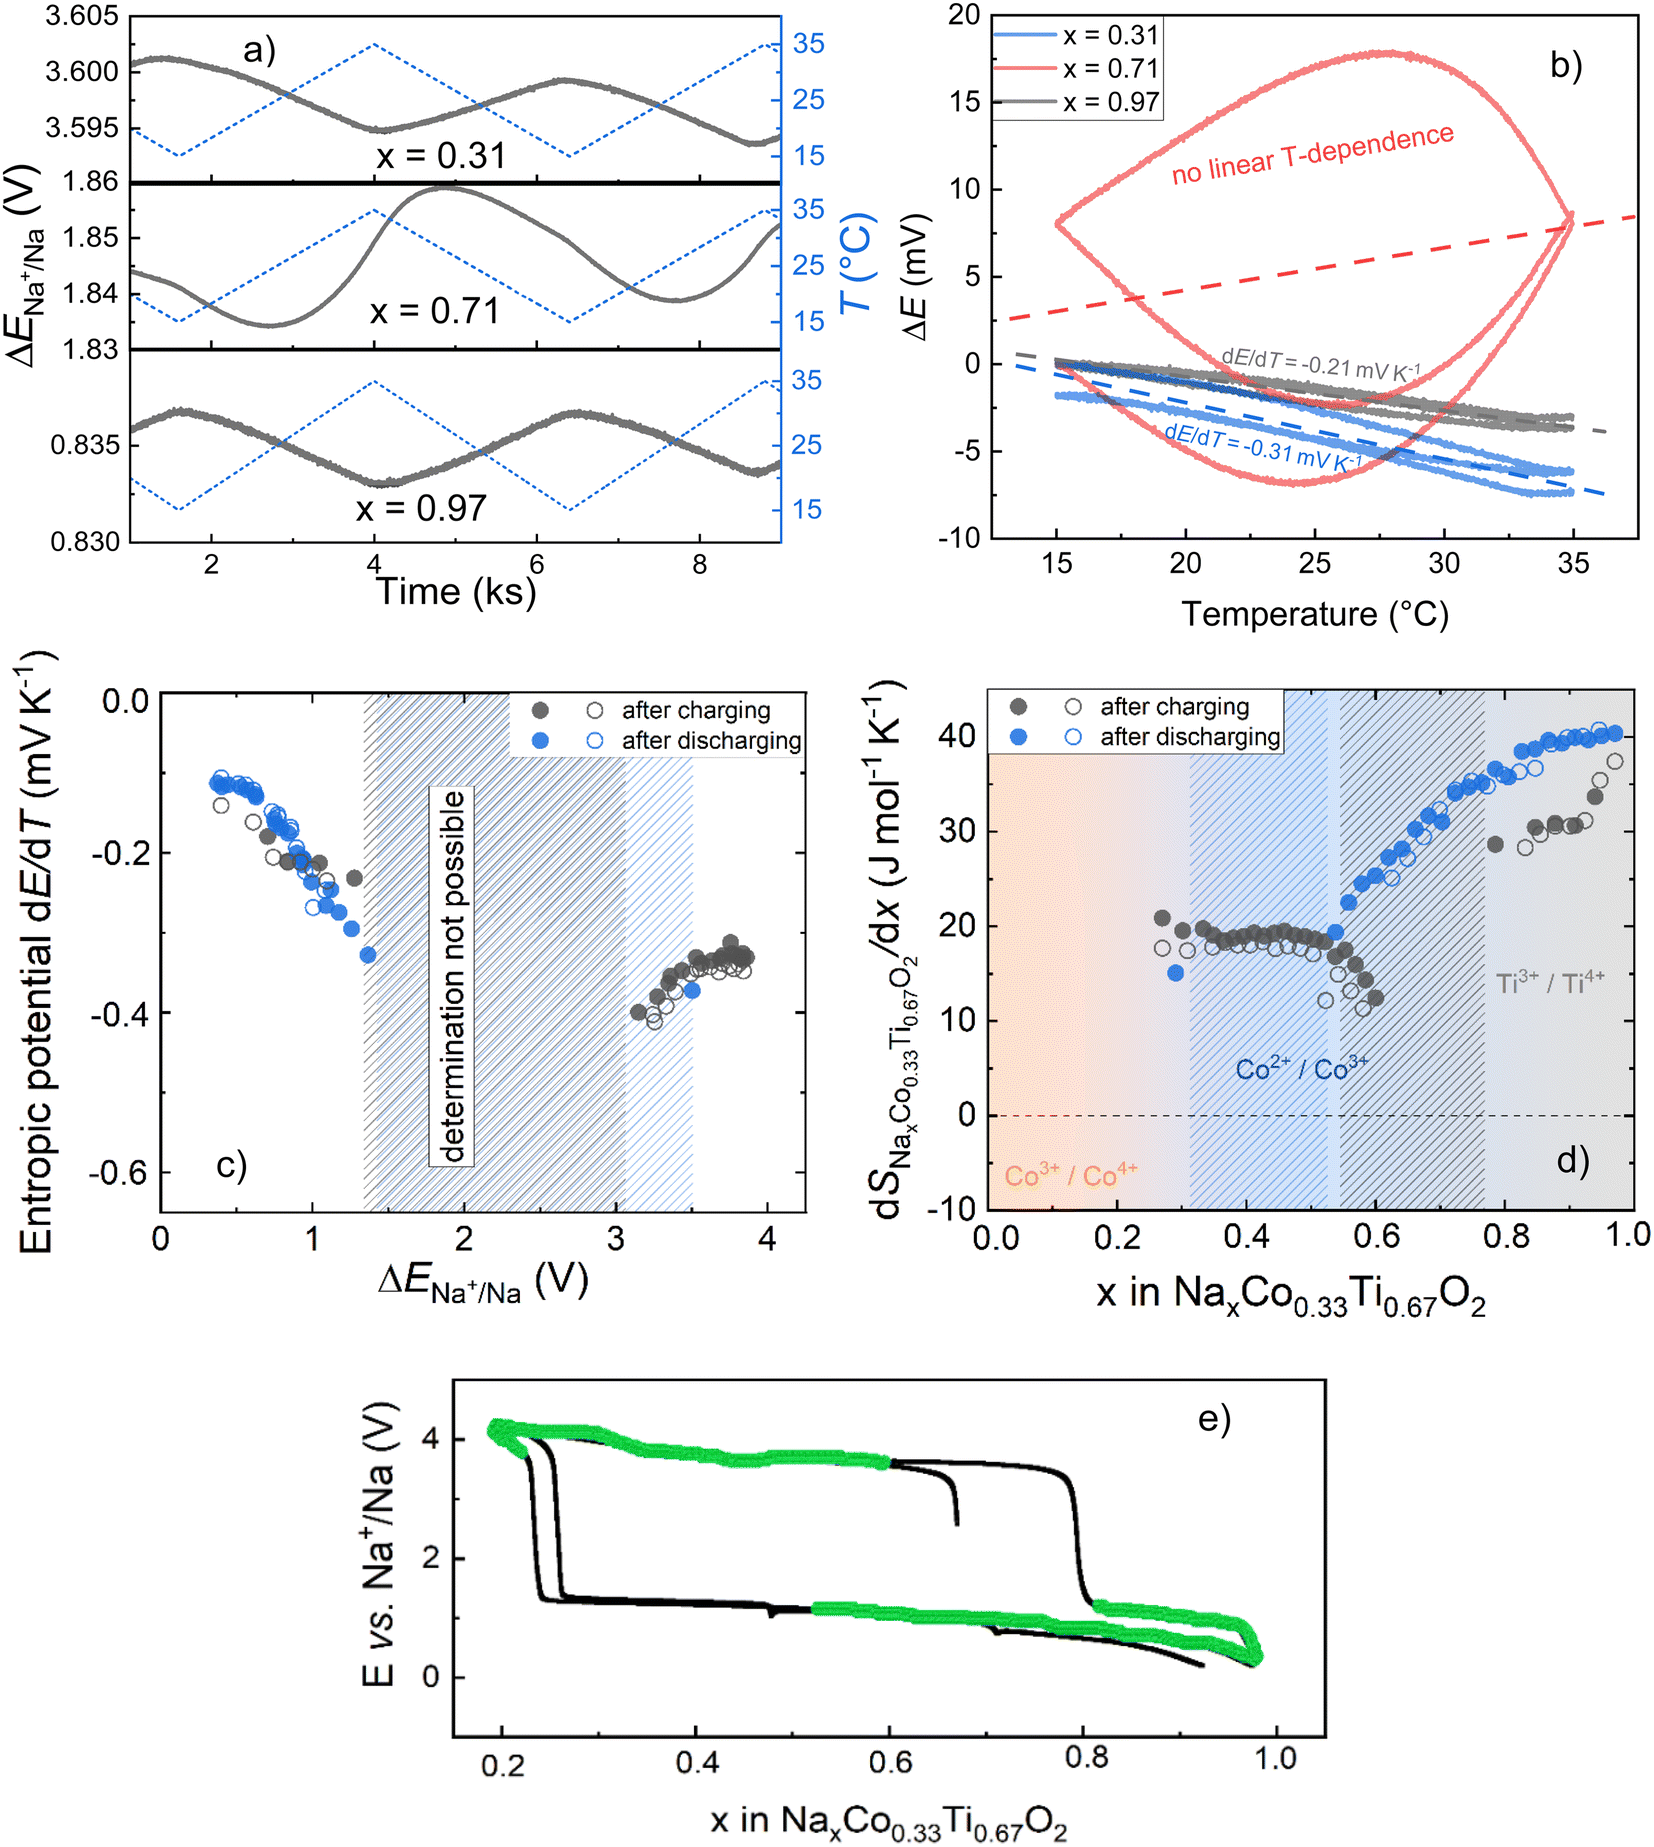 | ||
| Fig. 8 (a) OCV measurement of O3-NaxCo0.33Ti0.67O2|Na half-cells at different compositions (x = 0.31, 0.71 and 0.97) during linear temperature variations. (b) Temperature dependence of the OCV determined from the measured data and associated linear fits (dashed lines) to determine dE/dT and ΔrS0, respectively. Note that for reasons of comparability, the initial OCV value was subtracted in each case. (c) Entropic potential of the O3-NaxCo0.33Ti0.67O2 I Na half-cells plotted against OCV, and (d) the composition dependence of the partial molar entropy change of O3-NaxCo0.33Ti0.67O2 with respect to x for two identical cells. The entropic potential dE/dT was determined by temperature-dependent measurements of the equilibrium potential for each SoC, in case of a linear temperature dependence of OCV. Shaded areas indicate anomalous temperature dependence of OCV either after charging or discharging, in which reliable entropy determination was not always possible. (e) Composition-dependent charge–discharge curves of O3-NaxCo0.33Ti0.67O2 with marked composites (green color), for which entropy determination in OCV measurements was possible. | ||
The potential dependence of the entropic potential dE/dT, obtained after charging and discharging steps for two similar cells (O3-phase vs. Na-metal) is in reasonable agreement. Based on these data, the change in partial molar entropy of the cathode material with respect to the sodium composition is determined from the relation:41
 | (3) |
Note that S0Na is the entropy of the metallic sodium electrode, which is always positive and depends only on temperature; at room temperature (298 K) S0Na was reported to be 51 J mol K−1. When considering the composition dependence of the partial molar entropy change (Fig. 8e), a significant hysteresis is observed between values obtained after charging and discharging steps at formally identical x in O3-NaxCo0.33Ti0.67O2. A plateau-l0069ke region with approximately 20 J mol−1 K−1 is found for 0.4 < x < 0.6 after charging steps, which is to be expected for the two-phase O3/P3 region. However, entropy determination after discharging steps could not be performed in this stoichiometry range due to the anomalous temperature behavior of the OCV.
This indicates different states present after charging and discharging at formally the same composition. It can be caused by insufficient adjustment of the equilibrium state (relaxation) or a ‘path dependence’ as has been observed previously42 for the olivine-like NaFePO4 and is typically related to different phase transformation paths caused by a mechanical stress or lattice mismatch between the existing and the forming phase. For NaFePO4, Na-extraction is accompanied by formation of the Na0.7FePO4 intermediate phase, which is discussed in numerous structural studies, while Na-insertion into FePO4 occurs as a classical two-phase reaction process with coexistence of only initial and formed phases. However, for O3-NaxCo0.33Ti0.67O2, the phase transformation is symmetric without any hints for crystalline intermediate products. Therefore, some insufficient adjustment of the equilibrium state is most likely the reason for the observed non-linear phenomena, which appears when either the P3 phase starts to form during charge, or when the amount of the P3 phase is predominated in the two-phase region during discharge.
Very slow kinetics associated with LS-Co3+ was already reported for metal complexes in ligand exchange reactions proceeding in liquid media.43,44 It was theoretically predicted and confirmed by numerous experimental results that the reaction speed of the ligand exchange relates to a lower crystal field energy splitting in the intermediate state in comparison with the initial state and decreases depending on the electronic structure of transition metal ions as d5 > d4 > d8 ∼ d3 > d6 (d4, d5 and d6 systems are in a low-spin state).43 Therefore, low-spin metal complexes with d6 configuration like LS-Co3+ show an extremely high kinetics stability (inertness) independently on the thermodynamic stability of the reaction products. In case of NaxCo0.33Ti0.66O2 cathodes, oxidation of HS-Co2+ to LS-Co3+via a two-phase reaction route is much faster and less temperature-dependent than reduction of LS-Co3+ to HS-Co2+, likely metal complexes with LS-Co3+.
For 0.62 < x < 0.77, entropy values could not be determined after charging steps due to the anomalous temperature behavior of the OCV (s: Fig. 8a and c). This composition range corresponds to the transition between the single-phase region (O3) with only Ti-redox activity, and the two-phase region O3/P3 with the Co-redox activity. For the 0.77 < x < 1 range, associated with only Ti4+/Ti3+ redox, the partial molar entropy change is larger than for the two-phase region O3/P3, and further increases with increasing Na-content. Entropy values determined after discharging steps in this composition range are higher than after charging steps, again indicating insufficient adjustment of the equilibrium state.
Basically, there are three main contributions to the entropy of O3-NaxCo0.33Ti0.67O2, which might be sensitive to the Na-composition, namely the configurational, vibrational, and electronic entropy: ΔS = ΔSconf + ΔSel + ΔSvib.38,41,45
The configurational entropy gives information about the distributional variability of Na and vacancies in the host structure. In a simplified ideal solid solution model with Na atoms moving freely between a given number of empty sites of the rigid “Co0.33Ti0.67O2” host without changing interactions, the change in configurational entropy with respect to the Na-composition is given by:
 | (4) |
Within two-phase regions, the contribution from  is constant and given by the difference configurational entropy of the participating phases. In the case of O3-Na0.33Co0.33Ti0.67O2 – P3-Na0.66Co0.33Ti0.67O2 coexistence, the configurational entropy of these phases is identical. Thus,
  should be zero for the composition range 0.33 < x < 0.66. For 0.77 < x < 1, associated with Ti4+/Ti3+ redox, according to eqn (4), a dramatic decrease in configurational entropy should occur with increasing Na content as the distribution variability of Na and vacancies in the host structure becomes negligible. However, the experimental measurements clearly show an increase in the partial molar entropy change (Fig. 8e). This indicates that an additional entropy contribution overcompensates the impact of configurational entropy.
The electronic molar entropy ΔSel is sensitive to the charge and spin state of ions. Spin and orbital contribution to the entropy variation upon a spin-state charge (spin crossover) can be estimated according to ΔSspin = Rln[(2SHS + 1)/(2SLS + 1)] and ΔSorb = Rln[(2LHS + 1)/(2LLS + 1)].38 In most cases, ΔSorb is neglectable due to a lowered local symmetry of cations as a result of structural distortion. The spin contribution to the entropy in case of LS-Co3+ → HS-Co3+ transition would be 13.38 J mol−1 K−1, while 5.76 J mol−1 K−1 in case of LS-Co2+ → HS-Co2+. Therefore, electronic entropy would favor the HS-Co3+ state in the P3 phase, which, however, was not observed experimentally.
The vibrational entropy ΔSvib is associated with changes of vibrational frequencies in the crystal lattice.38 It is much higher in HS than in LS states as well, providing the highest contribution to the total entropy difference between the two states, which usually varies between 40 and 80 J mol−1 K−1.38
To summarize, the HS state is entropically favored due to the higher electronic and vibrational contribution, being stabilized at higher temperatures, whereas the LS state is enthalpically favored due to a stronger bonding (shorter metal–ligand distances) and a bigger crystal field splitting energy, CFSE, being stable at lower temperatures.39
Increasing temperature of the two-phase O3/P3 composition must shift the reaction towards P3 phase formation while lowering temperature shifts to the O3 formation. At the same time, higher temperature supports HS-Co3+ in the P3 phase leading to a faster kinetics of the sodiation reaction and smaller potential hysteresis, which we observed experimentally. For the O3 phase, temperature variations are less crucial due to a very high thermodynamic stability of HS-Co2+ in octahedral oxygen surrounding. Indeed, a temperature-controllable co-existence of octahedrally coordinated HS-Co3+ and LS-Co3+ in complex oxides is a well-known phenomenon reported elsewhere,46 whereas existence of CoO6-octahedra with LS-Co2+ under ambient conditions has never been experimentally confirmed.43,44
Close to the single-phase stability region of O3-NaxCo0.33Ti0.67O2 at high Na-concentrations, the experimental measurements clearly show an increase in the reaction entropy. This indicates an additional entropy contribution exceeding the above-discussed impacts. As Na-insertion into NaxCo0.33Ti0.67O2 for x > 0.67 corresponds to the partial reduction of Ti4+ to Ti3+, one can expect a significant increase in electronic conductivity, similar to an insulator-to-metal transition reported for Li4Ti5O12 spinel during lithiation to Li7Ti5O12.47 Such an insulator-to-metal transition is usually accompanied by an entropy rise of 10–15 J mol−1 K−1 due to a high contribution of the electronic degree of freedom (62–67% of the total entropy of transition) because of an increased amount of free charge carriers, and an increased vibrational degree of freedom (around 33%) as it was elaborately discussed for VO2.48 Therefore, further entropy gain may be expected in the Ti4+/Ti3+ redox activity region due to a possible composition-induced narrowing the band gap of O3-NaxCo0.33Ti0.67O2 at the Fermi level because of the Ti4+ to Ti3+ reduction, and corresponding elongation of Ti–O bond distances, visible from the rising lattice parameter a in this range of compositions (Fig. 3).
Comparison of the partial molar entropy for O3 and P2 gives very similar values at x(Na) = 0.67, which, however, become 7–9 J mol−1 K−1 higher for the P2 material in the two-phase composition range (see Fig. S4†), probably originating from a slightly variation in the Na-composition of the P2* phase as visible in Fig. 3. In contrast, in the single -phase region of the Ti4+/Ti3+ charge compensation mechanism, the change of the partial molar entropy for both materials is similar.
Discussion
Members of the layered NaxCo2+x/2Ti4+1−x/2O2 series with x = 0.67 (this work) and x = 0.50 (ref. 17) show a very similar electrochemical and structural behavior during cycling in Na-batteries. Particularly, a large hysteresis of the cell potential between charging and discharging (Na-removal and insertion) even at very low current density of 0.01C, and a reversible structural transformation of the initial O3 or P2 into the P3 or P2* Na-poor phase with a much lower unit cell volume.The driving force for the potential hysteresis cannot be solely the difference in the Co–O bond lengths of 0.2 Å in Na-rich and Na-poor phases as proposed in works:19,22 the interatomic distance is an important, but not the dominating factor which leads to the hysteresis behavior. Literature contains numerous examples of two-phase reaction mechanisms upon Li+/Na+/K+ extraction, which proceed without any potential hysteresis. One of the most famous examples is the olivine-type family of Li-cathodes. LiFePO4 undergoes a two-phase transformation with a change in the unit cell volume from 293 Å3 (lithiated phase) to 272 Å3 (Li-free phase), corresponding to the 7.2% lattice mismatch.49–51 LiFePO4 is well-known for a very low cell polarization and superior rate capability in Li-ion batteries. A higher lattice mismatch of 8.9% between two phases was observed for LiMnPO4 during Li-extraction (302 Å3vs. 275 Å3).52 The olivine-like structure with Na exhibits even a higher difference in the unit cell volume upon transition NaFePO4 → Na0.7FePO4 → NaFePO4 varying from 320 Å3 to 309 Å3 and to 281 Å3, or 3.4% and 12.2% lattice mismatch53. The average Fe–O distance in the olivine-like NaFePO4 is 2.20 Å, in contrast to 2.015 Å in the completely desodiated FePO4 form.53
None of these materials exhibits significant potential hysteresis during charging and discharging. Therefore, a large difference of 0.18–0.20 Å in the metal–oxygen distance of the electrode cannot alone be responsible for the big potential hysteresis in the cell.
According to the previously reported DFT calculations for O3–NaCo0.5Ti0.5O2 material with a similarly large potential hysteresis, the hysteresis phenomena should originate from the different reaction pathways during cell charge and discharge. Oxidation and spin-state transformation of Co upon Na-removal was represented as a sequence of processes HS-Co2+ → HS-Co3+ → LS-Co3+, since a direct transformation of HS-Co2+ to LS-Co3+ is spin-forbidden.19,22 A time-consuming process was attributed to the oxidation HS-Co2+ → HS-Co3+, while the transition HS-Co3+ → LS-Co3+ was assumed to be fast. Upon Na-insertion (cell discharge), cobalt cations undergo transformations LS-Co3+ → LS-Co2+ → HS-Co2+. The slowest reaction step here should correspond to the cobalt redox LS-Co3+ → LS-Co2+ as well, while spin transition LS-Co2+ → HS-Co2+ supposes to occur immediately.19 Furthermore, corresponding electrochemical potentials ascribed to HS-Co2+ → HS-Co3+ → LS-Co3+ and LS-Co3+ → LS-Co2+ → HS-Co2+ were calculated, which could evoke an impression of a thermodynamically-induced potential hysteresis.
Our low-current galvanostatic measurements clearly prove a kinetic reason for the observed hysteresis phenomenon. Indeed, a long relaxation time of 12 h in GITT measurements significantly reduced the magnitude of the potential hysteresis. Therefore, applying a sufficient relaxation time can lead to a complete annihilation of the hysteresis. The same conclusion can be drawn based on entropy determination measurements in the composition range, in which kinetics plays a less important role, and entropy values are very close during sodiation and desodiation. Moreover, operando XRD studies of O3 and P2 materials after one completed charge–discharge cycle showed almost the same crystal structure as the pristine one.
Based on literature data, we can suggest another sodiation mechanism of the P3-phase alternatively to LS-Co2+ intermediate formation discussed in ref. 19 and 22. It is well-known that in numerous Co-oxides, LS-Co3+ and HS-Co3+ coexist in octahedral oxygen surrounding, and the spin-state ratio of cations is temperature-dependent, as it was reported for the perovskite-like LaCoO3 in the temperature range of 20–650 K.46 Analogously, one can suggest a coexistence of LS-Co3+ (major concentration) and HS-Co3+ (very minor concentration) in P3–Na0.33Co0.33Ti0.67O2, as a quasi-equilibrium state. Since only HS-Co3+ can be reduced to HS-Co2+, the redox reaction kinetics is defined by the concentration of HS-Co3+ in the material.
A combination of charge and spin-state transformations HS-Co2+ → LS-Co3+ has never been registered in layered oxides with Li. Such a transformation is exclusively the property of the layered Na-oxides arising from the larger ionic radii of Na+ in comparison to Li+ for oxygen surrounding. Indeed, a conventional solid-state synthesis of layered structures with Li and transition metals with a big ionic radius close to the radius of Li+ (0.76 Å) as Ni2+ (0.69 Å), HS-Co2+ (0.745 Å), HS-Fe2+ (0.78 Å) or HS-Mn2+ (0.83 Å) will lead to a cation mixing and, as a result, to disordered three-dimensional rock-salt structures.54 Much bigger Na+ cations (1.02 Å for oxygen octahedra) prevent a cation mixing during synthesis at ambient pressure, thus facilitating the layered structure formation with cation separation. During desodiation in the charging process, Co2+ transforms to Co3+, for charge balancing. The Co3+ cations can adopt different spin states, which will be reflected in the average Co–O bond distances, since the ionic radii of HS-Co3+ (r = 0.61 Å) and LS-Co3+ (r = 0.545 Å) are different. In addition, an intermediate spin-state of Co3+ (IS–Co3+) in oxides is often discussed in the literature as well. Applying external measures as elevated pressure or low temperature, or creating an internal “chemical pressure” in the crystal structure through a cation/anion replacement can change spin state of Co3+ from the high-spin to the low-spin due to the shrinkage of the structure. The spin state degree of freedom of Co is a result of balancing between the crystal field splitting and Hund's rule exchange energy. Pure low-spin (LS) Co3+ is very common in oxides, for example in LiCoO2 and NaCoO2, while pure high-spin (HS) Co3+ exists only in systems with a relatively weak crystal field like YBa2Co4O7 with CoO4 tetrahedrons55 or Sr2CoO3Cl with CoO5 pyramids.56 HS-Co3+ in CoO6 octahedra was reported for systems with a temperature-controlled mixture of HS and LS like LaCoO3,46 or in a system with an oxygen deficiency such as GdBaCo2O5.5.57 In the last case, half of Co3+ cations have an octahedral oxygen surrounding showing a mixed HS- and LS state while the other half with HS occupies pyramidal CoO5 sites.
According to the spectroscopic studies combined with theoretical calculations, the critical Co–O bond length in oxides for the transition LS-Co3+ → HS-Co3+ corresponds to 1.93 Å.58 A lower bond length facilitates the existence of Co3+ in LS state. The Co–O distance of 1.93 Å was evaluated from XAS studies of P2-Na0.67Co0.67Mn0.33O2,12 and presence of a low-spin state of Co3+ was confirmed by both the magnetic measurements and ESR analysis.13 Determination of the Co–O bond lengths in O3- and P2-Na0.33Co0.33Ti0.67O2 from our XAS experiments provides 1.920 and 1.924 Å, very close to the boundary between HS-Co3+ and LS-Co3+.
Recently, a low-level substitution approach for structure stabilization of layered oxides was discussed in the literature based on sodium manganese oxides NaxMnO2 as examples.59,60 Implementation of a small amount of bigger Li+ cations instead of Mn in MnO2 blocks,59 or partial replacement of Na+ with larger K+ between the MnO2 layers60 leads to significant improvement of the electrochemical performance. In the first example, a Jahn–Teller structural distortion upon Mn3+/Mn4+ redox is mitigated due to the noticeable shrinkage of MnO6-octahedra in the doped material, while a facilitated Na-diffusion and suppression of a phase transformation during battery charge was registered in the K-doped material. A similar strategy could be applied for Co-containing oxides using doping with larger cations, which can alleviate structural contraction during desodiation.
Conclusion
In the present work, we considered layered Na-oxides with two redox-active cations, Co and Ti, as electrode materials for Na-batteries. The redox activity of these cations is usually characterized by two well-separated cell potentials. The Co-oxidation (Co2+ → Co3+ and Co3+ → Co4+) occurs typically at potentials close to or above 3 V vs. Na+/Na, referring the material to cathodes while Ti4+/Ti3+ redox process takes place below 1.5 V, as common for anode materials. Since O3- and P2-Na0.67Co0.33Ti0.67O2 are Na-deficient, Na-removal up to Nax≈0.33Co0.33Ti0.67O2 and Na-insertion up to Nax≈1.0Co0.33Ti0.67O2 was studied.For both materials, Na-removal from the fully sodiated state to the Nax≈0.3Co0.33Ti0.67O2 composition occurs as a two-step process, with a slope-like region at 1.5 V (single-phase process) and a plateau around 3.8 V (two-phase process). Desodiation at ca. 3.8 V proceeds as a two-phase reaction with a nearly constant composition of the participating phases. The O3 phase undergoes a transition to P3 through a gliding of metal–oxygen layers in the O3 structure. The P2 phase transforms into a P2* phase, which is isostructural to P2 but has a higher distance between metal–oxygen layers in the c-direction, and shorter metal–oxygen bonds within the layers. In both materials, oxidation and reduction of cobalt cations is accompanied by the charge and spin transition HS-Co2+ ↔ LS-Co3+. Cell metrics of the second phases with LS-Co3+ in the O3 and P2 materials are about 3.6–3.9% smaller than of pristine phases.
Na-insertion into desodiated P3- and P2*-Nax≈0.3Co0.33Ti0.67O2 takes place at 1.3 V first as a two-phase process. The phase transformation P3 → O3 in the O3 material is completed already at a total x(Na)-content of about 0.7, whereas P2* is still presented in the material together with P2 at x(Na) > 0.8, pointing less reactivity of P2 in comparison to O3.
The reason for the overpotential of 2.5 V during cycling of O3- and P2-Na0.67Co0.33Ti0.67O2 at 0.1C is a very slow kinetics related to the nucleation and growth of the second phase with the different valence- and spin-state of Co, especially for the LS-Co3+ → HS-Co2+ transition. The reduction of LS-Co3+ to HS-Co2+ during Na-intercalation occurs probably either through LS-Co2+ or HS-Co3+ as intermediate spin states, having a very low rate constant. The potential difference between cell charge and discharge can be minimized either by increasing working temperature or decreasing current, applied to the battery.
The extremely slow kinetics of the phase transition results in a very long time needed to reach the equilibrium state, thus influencing thermodynamic measurements. Especially long time is required at Na-contents corresponding to the onset of the phase transformation: the measurements of the entropic potential were not possible for compositions with the second phase part of less than 20–30%, independently on cell charging or discharging. The partial entropy of Na-intercalation into both desodiated O3 (∼20 J mol−1 K−1) and P2 (∼27 J mol−1 K−1) is nearly composition-independent on the field of Co3+/Co2+ charge compensation, and it is growing for the compositions corresponding to the Ti4+/Ti3+ redox.
Author contributions
Daria Mikhailova: writing – original draft, conceptualization, methodology, validation, data curation. Mikhail Gorbunov: methodology, investigation, validation. Björn Pohle: methodology, investigation. Hoang Bao An Nguyen: methodology, investigation. Sebastian Maletti: methodology, investigation, validation. Christian Heubner: conceptualization, methodology, writing – review & editing, data curation.Conflicts of interest
There are no conflicts to declare.Acknowledgements
DM and BP acknowledge the Federal Ministry of Education and Research (BMBF), the project “HeNa” (03XP0390C).References
- J.-Y. Hwang, S.-T. Myung and Y.-K. Sun, Sodium-ion batteries: present and future, Chem. Soc. Rev., 2017, 46, 3529–3614, 10.1039/C6CS00776G.
- R. Berthelot, D. Carlier and C. Delmas, Electrochemical Investigation of the P2–NaxCoO2 Phase Diagram, Nat. Mater., 2011, 10, 74–80, DOI:10.1038/nmat2920.
- M. H. Han, E. Gonzalo, G. Singh and T. Rojo, comprehensive review of sodium layered oxides: powerful cathodes for Na-ion batteries, Energy Environ. Sci., 2015, 8, 81–102, 10.1039/c4ee03192A.
- B. Venkata Rami Reddy, R. Ravikumar, C. Nithya and S. Gopukuma, High performance NaxCoO2 as a cathode material for rechargeable sodium batteries, J. Mater. Chem. A, 2015, 3, 18059–18063, 10.1039/C5TA03173G.
- K. Kubota, S. Kumakura, Y. Yoda, K. Kuroki and S. Komaba, Electrochemistry and Solid-State Chemistry of NaMeO2 (Me = 3d Transition Metals), Adv. Energy Mater., 2018, 8, 1703415, DOI:10.1002/aenm.201703415.
- Y. Lei, X. Li, L. Liu and G. Ceder, Synthesis and Stoichiometry of Different Layered Sodium Cobalt Oxides, Chem. Mater., 2014, 26, 5288–5296, DOI:10.1021/cm5021788.
- M. Bianchini, J. Wang, R. J. Clément, B. Ouyang, P. Xiao, D. Kitchaev, T. Shi, Y. Zhang, Y. Wang, H. Kim, M. Zhang, J. Bai, F. Wang, W. Sun and G. Ceder, The interplay between thermodynamics and kinetics in the solid-state synthesis of layered oxides, Nat. Mater., 2020, 19, 1088–1095, DOI:10.1038/s41563-020-0688-6.
- T. Zhou, D. Zhang, T. W. Button, A. J. Wrighta and C. Greaves, Influence of cooling rate on the structure and composition of NaxCoO2 (x ∼ 0.65), J. Mater. Chem., 2009, 19, 1123–1128, 10.1039/b813612b.
- X. Wang, M. Tamaru, M. Okubo and A. Yamada, Electrode Properties of P2-Na2/3MnyCo1−yO2 as Cathode Materials for Sodium-Ion Batteries, J. Phys. Chem. C, 2013, 117, 15545–15551, DOI:10.1021/jp406433z.
- K. Kubota, T. Asari, H. Yoshida, N. Yaabuuchi, H. Shiiba, M. Nakayama and S. Komaba, Understanding the Structural Evolution and Redox Mechanism of a NaFeO2 –NaCoO2 Solid Solution for Sodium-Ion Batteries, Adv. Funct. Mater., 2016, 26, 6047–6059, DOI:10.1002/adfm.201601292.
- S. Mun Kang, J.-H. Park, A. Jin, Y. Hwa Jung, J. Mun and Y.-E. Sung, Na+/Vacancy Disordered P2-Na0.67Co1−xTixO2: High-Energy and High-Power Cathode Materials for Sodium Ion Batteries, ACS Appl. Mater. Interfaces, 2018, 10, 3562, DOI:10.1021/acsami.7b16077.
- J.-H. Cheng, C.-J. Pan, J.-F. Lee, J.-M. Chen, M. Guignard, C. Delmas, D. Carlier and B.-J. Hwan, Simultaneous Reduction of Co3+ and Mn4+ in P2-Na2/3Co2/3Mn1/3O2 as Evidenced by X-ray Absorption Spectroscopy during Electrochemical Sodium Intercalation, Chem. Mater., 2014, 26, 1219–1225, DOI:10.1021/cm403597h.
- D. Carlier, J. H. Cheng, R. Berthelot, M. Guignard, M. Yoncheva, R. Stoyanova, B. J. Hwang and C. Delmas, The P2-Na2/3Co2/3Mn1/3O2 phase: structure, physical properties and electrochemical behavior as positive electrode in sodium battery, Dalton Trans., 2011, 40, 9306, 10.1039/C1DT10798D.
- Y.-E. Zhu, X. Qi, Xi. Chen, X. Zhou, X. Zhang, J. Wei, Y. Hu and Z. Zhou, A P2-Na0.67Co0.5Mn0.5O2 cathode material with excellent rate capability and cycling stability for sodium ion batteries, J. Mater. Chem. A, 2016, 4, 11103, 10.1039/c6ta02845d.
- N. Sabi, A. Sarapulova, S. Indris, H. Ehrenberg, J. Alami and I. Saadoune, Effect of Titanium Substitution in a P2-Na2/3Co0.95Ti0.05O2 Cathode Material on the Structural and Electrochemical Properties, ACS Appl. Mater. Interfaces, 2017, 9, 37778–37785, DOI:10.1021/acsami.7b11636.
- N. Sabi, S. Doubaji, K. Hashimoto, S. Komaba, K. Amine, A. Solhy, B. Manoun, E. Bilal and I. Saadoune, Layered P2-Na2/3Co1/2Ti1/2O2 as a high-performance cathode material for sodium-ion batteries, J. Power Sources, 2017, 342, 998–1005, DOI:10.1016/j.jpowsour.2017.01.025.
- S. Maletti, L. Giebeler, S. Oswald, A. A. Tsirlin, A. Senyshyn, A. Michaelis and D. Mikhailova, Irreversible made reversible: increasing electrochemical capacity by understanding the structural transformations of NaxCo0.5Ti0.5O2, ACS Appl. Mater. Interfaces, 2018, 10, 36108–36119, DOI:10.1021/acsami.8b11609.
- N. Sabi, A. Sarapulova, S. Indris, S. Dsoke, Z. Zhao, M. Dahbi, H. Ehrenberg and I. Saadoune, Evidence of a Pseudo-Capacitive Behavior Combined with an Insertion/Extraction Reaction Upon Cycling of the Positive Electrode Material P2-NaxCo0.9Ti0.1O2 for Sodium-ion Batteries, ChemElectroChem, 2019, 6, 892–903, DOI:10.1002/celc.201801870.
- E. Watanabe, W. Zhao, A. Sugahara, B. Mortemard de Boisse, L. Lander, D. Asakura, Y. Okamoto, T. Mizokawa, M. Okubo and A. Yamada, Redox-Driven Spin Transition in a Layered Battery Cathode Material, Chem. Mater., 2019, 31, 23582365, DOI:10.1021/acs.chemmater.8b04775.
- N. Sabi, A. Sarapulova, S. Indris, S. Dsoke, V. Trouillet, L. Mereacre, H. Ehrenberg and I. Saadoune, Investigation of “Na2/3Co2/3Ti1/3O2” as a multi-phase positive electrode material for sodium batteries, J. Power Sources, 2021, 481, 229120, DOI:10.1016/j.jpowsour.2020.229120.
- B. Pohle, M. V. Gorbunov, Q. Lu, A. Bahrami, K. Nielsch and D. Mikhailova, Structural and Electrochemical Properties of Layered P2-Na0.8Co0.8Ti0.2O2 Cathode in Sodium-Ion Batteries, Energies, 2022, 15, 3371, DOI:10.3390/en15093371.
- M. Okubo, K. Kawai, Z. Ma and A. Yamada, Square-Scheme Electrochemistry in Battery Electrodes, Acc. Mater. Res., 2022, 3(1), 33–41, DOI:10.1021/accountsmr.1c00155.
- K. Ariyoshi, T. Inoue and Y. Yamada, Elucidation of the origin of voltage hysteresis in xLi2MnO3 (1-x)LiCoO2 using backstitch charge-discharge method, Electrochim. Acta, 2020, 334, 135623, DOI:10.1016/j.electacta.2020.135623.
- K. Ariyoshi, T. Inoue and Y. Yamada, Voltage decay for lithium-excess material of Li[Li1/5Co2/5Mn2/5]O2 during cycling analyzed via backstitch method, J. Solid State Electrochem., 2022, 26, 1519–1526, DOI:10.1007/s10008-022-05184-0.
- Y.-J. Shin, M.-H. Park, J.-H. Kwak, H. Namgoong and O. H. Han, Ionic conduction properties of layer-type oxides NaxMIIx/2TiIV1−x/2O2 (M=Ni, Co; 0.60≤x≤1.0), Solid State Ionics, 2002, 150, 363–372 CrossRef CAS.
- T. Roisnel and J. Rodriguez-Carvajal, WinPLOTR: a Windows tool for powder diffraction pattern analysis, Mater. Sci. Forum, 2001, 378–381, 118–123 CAS.
- M. Herklotz, J. Weiss, E. Ahrens, M. Yavuz, L. Mereacre, N. Kiziltas-Yavuz, C. Draeger, H. Ehrenberg, J. Eckert, F. Fauth, L. Giebeler and M. Knapp, A novel high-throughput setup for in situ powder diffraction on coin cell batteries, J. Appl. Crystallogr., 2016, 49, 340–345, DOI:10.1107/S1600576715022165.
- J. J. Rehr, J. de Mustre Leon, S. I. Zabinsky and R. C. Albers, Theoretical X-ray Absorption Fine Structure Standards, J. Am. Chem. Soc., 1991, 113, 5135–5140, DOI:10.1021/ja00014a001.
- Y.-J. Shin and M.-Y. Yi, Preparation and structural properties of layer-type oxides NaxNix/2Ti1−x/2O2 (0.60≤x≤1.0), Solid State Ionics, 2000, 132, 131–141 CrossRef CAS.
- Y. Mo, S. P. Ong and G. Ceder, Insights into Diffusion Mechanisms in P2 Layered Oxide Materials by First-Principles Calculations, Chem. Mater., 2014, 26, 5208–5214, DOI:10.1021/cm501563f.
- V. V. Poltavets, M. Croft and M. Greenblatt, Charge transfer, hybridization and local inhomogeneity effects in NaxCoO2·yH2O: An x-ray absorption spectroscopy study, Phys. Rev. B: Condens. Matter Mater. Phys., 2006, 74, 125103, DOI:10.1103/PhysRevB.74.125103.
- D. Taylor, Thermal expansion data: I. Binary oxides with the sodium chloride and wurtzite structure, MO, Trans. J. Br. Ceram. Soc., 1984, 83, 5–9 Search PubMed.
- O. Haas, R. P. W. J. Struis and J. M. McBreen, Synchrotron X-ray absorption of LaCoO3 perovskite, J. Solid State Chem., 2004, 177(3), 1000–1010, DOI:10.1016/j.jssc.2003.10.004.
- N. Narayanan, D. Mikhailova, A. Senyshyn, D. M. Trots, R. Laskowski, P. Blaha, K. Schwarz, H. Fuess and H. Ehrenberg, Temperature and composition dependence of crystal structures, magnetic and electronic properties of double perovskites La2−xSrxCoIrO6 (0 ≤ x ≤ 2), Phys. Rev. B: Condens. Matter Mater. Phys., 2010, 82, 024403, DOI:10.1103/PhysRevB.82.024403.
- D. Mikhailova, B. Schwarz, A. Senyshyn, A. M. T. Bell, Y. Skourski, H. Ehrenberg, A. A. Tsirlin, S. Agrestini, M. Rotter, P. Reichel, J. M. Chen, Z. Hu, Z. M. Li, Z. F. Li and L. H. Tjeng, Magnetic properties and crystal structure of Sr3CoIrO6 and Sr3NiIrO6, Phys. Rev. B: Condens. Matter Mater. Phys., 2012, 86, 134409, DOI:10.1103/PhysRevB.86.134409.
- D. Mikhailova, C. Y. Kuo, P. Reichel, A. A. Tsirlin, A. Efimenko, M. Rotter, M. Schmidt, Z. Hu, T. W. Pi, L. Y. Jang, Y. L. Soo, S. Oswald and L. H. Tjeng, Structure, magnetism, and valence states of cobalt and platinum in quasi one-dimensional oxides A3CoPtO6 with A = Ca, Sr, J. Phys. Chem. C, 2014, 118, 5463–5469, 10.1039/c4dt01893a.
- G. Ceder and A. Van der Ven, Phase diagrams of lithium transition metal oxides: investigations from first principles, Electrochim. Acta, 1999, 45, 131–150, DOI:10.1016/S0013-4686(99)00199-1.
- W. Nicolazzi and A. Bousseksou, Thermodynamical aspects of the spin crossover phenomenon, C. R. Chim., 2018, 21, 1060–1074, DOI:10.1016/j.crci.2018.10.003.
- S. Brooker, Spin crossover with thermal hysteresis: practicalities and lessons learnt, Chem. Soc. Rev., 2015, 44, 2880, 10.1039/c4cs00376d.
- J. O. Besenhard, Handbook of Battery Materials, Wiley-VCH, Weinheim, 1999, p. 618 Search PubMed.
- S. W. Baek, M. Saber, A. Van der Ven and L. Pilon, Thermodynamic Analysis and Interpretative Guide to Entropic Potential Measurements of Lithium-Ion Battery Electrodes, J. Phys. Chem. C, 2022, 126, 6096–6110, DOI:10.1021/acs.jpcc.1c10414.
- C. Heubner, S. Heiden, M. Schneider and A. Michaelis, In-situ preparation and electrochemical characterization of submicron sized NaFePO4 cathode material for sodium-ion batteries, Electrochim. Acta, 2017, 233, 78–84, DOI:10.1016/j.electacta.2017.02.107.
- F. Basolo and R. C. Johnson, Coordination Chemistry, Science Reviews, 1986, p. 143 Search PubMed.
- R. G. Wilkins, Kinetics and Mechanism of Reactions of Transition Metal Complexes, Weinheim, VCH, 2nd edn, 1991, p. 482, DOI:10.1002/bbpc.19920960429.
- F. Friedrich, S. Pieper and H. A. Gasteiger, Entropy Measurements of Li-Ion Battery Cells with Li- and Mn-Rich Layered Transition Metal Oxides via Linear Temperature Variation, J. Electrochem. Soc., 2021, 168, 120502, DOI:10.1149/1945-7111/ac3938.
- M. W. Haverkort, Z. Hu, J. C. Cezar, T. Burnus, H. Hartmann, M. Reuther, C. Zobel, T. Lorenz, A. Tanaka, N. B. Brookes, H. H. Hsieh, H.-J. Lin, C. T. Chen and L. H. Tjeng, Spin State Transition in LaCoO3 Studied Using Soft X-ray Absorption Spectroscopy and Magnetic Circular Dichroism, Phys. Rev. Lett., 2006, 97, 176405, DOI:10.1103/PhysRevLett.97.176405.
- C. Y. Ouyang, Z. Y. Zhong and M. S. Lei, Ab initio studies of structural and electronic properties of Li4Ti5O12 spinel, Electrochem. Commun., 2007, 9, 1107–1112, DOI:10.1016/j.elecom.2007.01.013.
- J. Paras and A. Allanore, Electronic entropy contribution to the metal insulator transition in VO2, Phys. Rev. B, 2020, 102, 165138, DOI:10.1103/PhysRevB.102.165138.
- G. Rousse, J. Rodriguez-Carvajal, S. Patoux and C. Masquelier, Magnetic Structures of the Triphylite LiFePO4 and of Its Delithiated Form FePO4, Chem. Mater., 2003, 15, 4082–4090, DOI:10.1021/cm0300462.
- A. Yamada, H. Koizumi, Si. Nishimura, N. Sonoyama, R. Kanno, M. Yonemura, T. Nakamura and Y. Kobayashi, Room-temperature miscibility gap in LixFePO4, Nat. Mater., 2006, 5, 357–360, DOI:10.1038/nmat1634.
- T. Yoshinari, T. Mori, K. Otani, T. Munesada, K. Yamamoto, T. Uchiyama, K. Fukuda, Y. Koyama, R. Hagiwara, Y. Orikasa and Y. Uchimoto, Quantitative Elucidation of the Non-Equilibrium Phase Transition in LiFePO4via the Intermediate Phase, Chem. Mater., 2019, 31, 7160–7166, DOI:10.1021/acs.chemmater.9b00834.
- L. Esmezjan, D. Mikhailova, M. Etter, J. Cabana, C. P. Grey, S. Indris and H. Ehrenberg, Electrochemical Lithium Extraction and Insertion Process of Sol-Gel Synthesized LiMnPO4via Two-Phase Mechanism, J. Electrochem. Soc., 2019, 166, A1257–A1265, DOI:10.1149/2.1311906jes.
- P. Moreau, D. Guyomard, J. Gaubicher and F. Boucher, Structure and Stability of Sodium Intercalated Phases in Olivine FePO4, Chem. Mater., 2010, 22, 4126–4128, DOI:10.1021/cm101377h.
- K. Kang, D. Carlier, J. Reed, E. M. Arroyo, G. Ceder, L. Croguennec and C. Delmas, Synthesis and Electrochemical Properties of Layered Li0.9Ni0.45Ti0.55O2, Chem. Mater., 2003, 15, 4503–4507, DOI:10.1021/cm034455+.
- N. Hollmann, Z. Hu, M. Valldor, A. Maignan, A. Tanaka, H. H. Hsieh, H.-J. Lin, C. T. Chen and L. H. Tjeng, Electronic and magnetic properties of the kagome systems YBaCo4O7 and YBaCo3MO7 (M = Al, Fe), Phys. Rev. B: Condens. Matter Mater. Phys., 2009, 80, 085111, DOI:10.1103/PhysRevB.80.085111.
- Z. Hu, H. Wu, M. W. Haverkort, H. H. Hsieh, H.-J. Lin, T. Lorenz, J. Baier, A. Reichl, I. Bonn, C. Felser, A. Tanaka, C. T. Chen and L. H. Tjeng, Different Look at the Spin State of Co3+ Ions in a CoO5 Pyramidal Coordination, Phys. Rev. Lett., 2004, 92, 207402, DOI:10.1103/PhysRevLett.92.207402.
- Z. Hu, H. Wu, T. C. Koethe, S. N. Barilo, S. V. Shiryaev, G. L. Bychkov, C. Schußler-Langeheine, T. Lorenz, A. Tanaka, H. H. Hsieh, H.-J. Lin, C. T. Chen, N. B. Brookes, S. Agrestini, Y.-Y. Chin, M. Rotter and L. H. Tjeng, Spin-state order/disorder and metal–insulator transition in GdBaCo2O5.5: experimental determination of the underlying electronic structure, New J. Phys., 2012, 14, 123025, DOI:10.1088/1367-2630/14/12/123025.
- Y.-Y. Chin, H.-J. Lin, Z. Hu, C.-Y. Kuo, D. Mikhailova, J.-M. Lee, S.-C. Haw, S.-A. Chen, W. Schnelle, H. Ishii, N. Hiraoka, Y.-F. Liao, K.-D. Tsuei, A. Tanaka, L. H. Tjeng, C.-T. Chen and J.-M. Chen, Relation between the Co-O bond lengths and the spin state of Co in layered Cobaltates: a high-pressure study, Sci. Rep., 2017, 7, 3656, DOI:10.1038/s41598-017-03950-z.
- Y. Liu, C. Wang, S. Zhao, L. Zhang, K. Zhang, F. Li and J. Chen, Mitigation of Jahn–Teller distortion and Na+/vacancy ordering in a distorted manganese oxide cathode material by Li substitution, Chem. Sci., 2021, 12, 1062, 10.1039/d0sc05427e.
- C. Wang, L. Liu, S. Zhao, Y. Liu, Y. Yang, H. Yu, S. Lee, G.-H. Lee, Y.-M. Kang, R. Liu, F. Li and J. Chen, Tuning local chemistry of P2 layered-oxide cathode for high energy and long cycles of sodium-ion battery, Nat. Commun., 2021, 12, 2256, DOI:10.1038/s41467-021-22523-3.
Footnote |
| † Electronic supplementary information (ESI) available. See DOI: https://doi.org/10.1039/d2ta07972k |
| This journal is © The Royal Society of Chemistry 2023 |