
 Open Access Article
 This Open Access Article is licensed under a
 Creative Commons Attribution 3.0 Unported Licence
Mechanism of coupled phase/morphology transformation of 2D manganese oxides through Fe galvanic exchange reaction†
Raquel
Aymerich-Armengol
 *a,
Paolo
Cignoni
b,
Petra
Ebbinghaus
a,
Julia
Linnemann
b,
Martin
Rabe
a,
Kristina
Tschulik
b,
Christina
Scheu
*a and
Joohyun
Lim
*c
*a,
Paolo
Cignoni
b,
Petra
Ebbinghaus
a,
Julia
Linnemann
b,
Martin
Rabe
a,
Kristina
Tschulik
b,
Christina
Scheu
*a and
Joohyun
Lim
*c
aMax-Planck-Institut für Eisenforschung GmbH, Max-Planck-Straße 1, 40237, Düsseldorf, Germany. E-mail: r.aymerich@mpie.de; c.scheu@mpie.de
bFaculty of Chemistry and Biochemistry, Chair of Analytical Chemistry II, Ruhr University Bochum, 44780 Bochum, Germany
cDepartment of Chemistry, Institute for Molecular Science and Fusion Technology, Kangwon National University, Chuncheon, Gangwon 24341, Republic of Korea. E-mail: jlim@kangwon.ac.kr
First published on 7th November 2022
Abstract
Nanostructured manganese oxides have a rich variety of morphologies and crystal phases which can undergo transformations during synthesis and application. Although these structural features are crucial for their performance, the mechanisms behind such transitions are not well understood. Herein, we describe the mechanism of transformation from layered 2D δ-MnO2 nanosheets to the scarcely reported γ-MnO2 nanocone morphology. Despite the common purpose of introducing Fe dopants to enhance the conductivity of layered manganese oxides, the Fe galvanic exchange reaction was found responsible for such coupled phase/morphology transition. Electrochemical characterization confirmed a distinct electrochemical behaviour of the nanocones, emphasizing the need to unravel the mechanism of 2D MnO2 transformation. Such mechanistic insights were gained by systematic and rigorous electron microscopy studies. The effect of the local chemical composition was determined by energy dispersive X-ray spectroscopy while electron energy loss spectroscopy unravelled the key influence of the oxidation state of Mn ions within nanosheets and nanocones. We propose and demonstrate a Mn2+-mediated oxidative mechanism of coupled morphology/phase transformation subjected to the equilibrium of Fe and Mn ions during galvanic exchange reaction. These findings contribute to the understanding of the growth and morphology/phase transformations of manganese oxide nanostructures, providing insights for the rational design of nanomaterials.
Introduction
Nanostructured manganese oxides (MnO2) are promising candidates for energy storage (e.g. batteries and supercapacitors),1 environmental (e.g. pollutant removal),2 and catalysis applications (e.g. oxygen evolution reaction).3 Their properties are strongly dependent on the structure, which shows high complexity due to the variety of nanomorphologies, crystal structures (distinguishing between tunnel- and layer-like structure types), chemical compositions and stoichiometries.3–5The introduction of dopants is conducted to further improve the properties of MnO2.5,6 First described by Oh et al.,7 the galvanic exchange reaction can be performed to introduce Fe dopant in nanostructured oxides, including 2D MnO2 nanosheets.8 The presence of Fe enhances the electric conductivity of the MnO2 material, which is a requirement for electrochemical applications. According to previous reports, dopant percentages of Fe up to 5 at% optimized the specific capacitance of MnO2.9–11
Morphology and/or phase transitions can occur not only during synthesis, but also during post-synthesis procedures such as dopant modification and application of the nanostructures.12,13 It has been reported that the presence of certain cations can stabilize specific crystal structures, thus causing phase transformations that are often coupled with structural changes. This is the case for the layer-to-tunnel polymorphic transitions of MnO2, which benefit from the presence of cations of similar size occupying the tunnel void.14–16 Specific examples of layer-to-tunnel transformations are those triggered by the sorption of Mn2+. Two mechanisms were hypothesized to explain them: on the one hand, auto-catalytic oxidation of the adsorbed Mn2+ on the MnO2 surface would account for transition to Mn3+ enriched oxides.17 On the other hand, comproportionation between Mn2+ ions and Mn4+ of MnO2 would also explain Mn3+ presence.18,19
Although understanding these transformations is of upmost importance for the design of high-performing materials, the mechanisms behind them are not yet completely unravelled.20 For instance, Tu et al. observed a coupled phase/morphology transition upon Mn2+ addition from layered birnessite to several different MnO2 structures.17 However, their synthesis methodology required several days and the exact mechanism behind the layer-to-tunnel transformation could not be proven due to lack of local structural analyses. Among the nanostructures yielding from the layer-to-tunnel transformation, MnO2 nanocones were obtained. The nanocones consist of a hexagonal pyramid morphology with faceted faces and a ramsdellite γ-MnO2![[thin space (1/6-em)]](https://www.rsc.org/images/entities/char_2009.gif) 21 or the closely related ε-MnO222 crystal structure. This nanostructure has since rarely been reported either arising from self-assembly of α-MnOOH nanorods21,23 or other direct wet chemical synthesis.22 Furthermore, no electrochemical structure–property relationship study was pursued for the nanocone structure.
21 or the closely related ε-MnO222 crystal structure. This nanostructure has since rarely been reported either arising from self-assembly of α-MnOOH nanorods21,23 or other direct wet chemical synthesis.22 Furthermore, no electrochemical structure–property relationship study was pursued for the nanocone structure.
In this work, we achieve rapid phase transformation of layered MnO2 to γ-MnO2 nanocones by in situ generation of Mn defects and Mn2+ ions within 2D manganese oxide nanosheets using Fe galvanic exchange reaction. To investigate the phase transformation mechanism, extensive local structural and chemical characterization of the nanostructures was conducted by electron microscopies (scanning electron microscopy (SEM), (scanning) transmission electron microscopy ((S)TEM) and spectroscopic techniques (energy dispersive X-ray (EDS), electron energy loss spectroscopy (EELS) and Raman spectroscopy). The results allowed us to describe a Mn2+-mediated oxidative mechanism for the nanosheet to nanocone morphology via galvanic exchange reaction. Our findings shed light into the mechanism behind coupled phase/morphology transitions of MnO2, which is crucial for building structure–property relationships of functional nanomaterials.
Experimental section
Materials
The materials used during synthesis were tetramethylammonium hydroxide (TMAOH, 25 wt% in water, Sigma-Aldrich), hydrogen peroxide (H2O2, 30 wt%, Merck), manganese chloride (MnCl2·4H2O, >98%, Sigma-Aldrich), hydrochloric acid (HCl, 37 wt%, VWR), iron sulphate (FeSO4·7H2O, >98%, Sigma-Aldrich), tetramethylammonium chloride (TMACl, >98%, Sigma-Aldrich) and ethanol (EtOH, >99.8%, Carl Roth).To prepare the working electrodes 1-methyl-2-pyrrolidone (NMP, >99%, Alfa Aesar) and Nafion® 117 solution (≈5% in mixture of lower aliphatic alcohols, Sigma-Aldrich) were used. The electrolyte for the electrochemical measurements was prepared from potassium sulphate (K2SO4, AnalaR NORMAPUR, VWR).
Synthesis
Electrochemical characterization
Cyclic voltammograms (CVs) were recorded with a three electrodes setup connected to a BioLogic VSP-300 potentiostat. A homemade Ag/AgCl, 3 M KCl electrode (E = 0.210 V vs. SHE) equipped with 0.5 M K2SO4 double junction was used as a reference electrode and a graphite rod (d = 8 mm) was used as a counter electrode. The CVs were acquired using an analog scan rate of 25 mV s−1 between 0.0 – 0.8 V vs. Ag/AgCl, 3 M KCl with a 0.5 M K2SO4 solution as an electrolyte. The working electrodes were prepared on a glass slide substrate (0.2 mm thickness, 18 mm diameter) coated with a 200 nm layer of gold and with an 8 nm Ti adhesion layer. 10 μL of a dispersion of 10 mg ml−1 of the active material and a 1 mg ml−1 of Nafion® in NMP were drop cast in the middle of the electrode slide in four 1.5 μL and two 2.0 μL steps. The functionalized electrodes were loaded in a custom-made teflon cell leaving exposed to the electrolyte solution the central area of the working electrode (d = 10 mm).25 A schematic of the cell is shown in Fig. S1.† The potentials were converted to the SHE scale for graph preparation.Structural characterization
:1000 and then analyzed with the ICP-MS.
Results and discussion
Transformation of MnO2 through Fe galvanic exchange reaction
2D MnO2 nanosheets (HMO) were synthesized through a wet chemical reaction and subsequently assembled with protons by adding HCl, as explained in the Experimental section. The electrostatic interaction of the hydrated protons with the negatively charged nanosheets produces 3D assemblies (Fig. 1a) of individual nanosheets (Fig. 1b). Fe dopant was subsequently introduced to the assembled MnO2 with Fe2+ precursor to HMO ratios of 1:5, 3:5, 5:5 and 12.5:5 in weight and let 24 h to age. Electron micrographs of these materials, respectively named FMO1, FMO2, FMO3 and FMO4, are shown in Fig. S3.† All materials presented similar 3D assemblies of nanosheets.
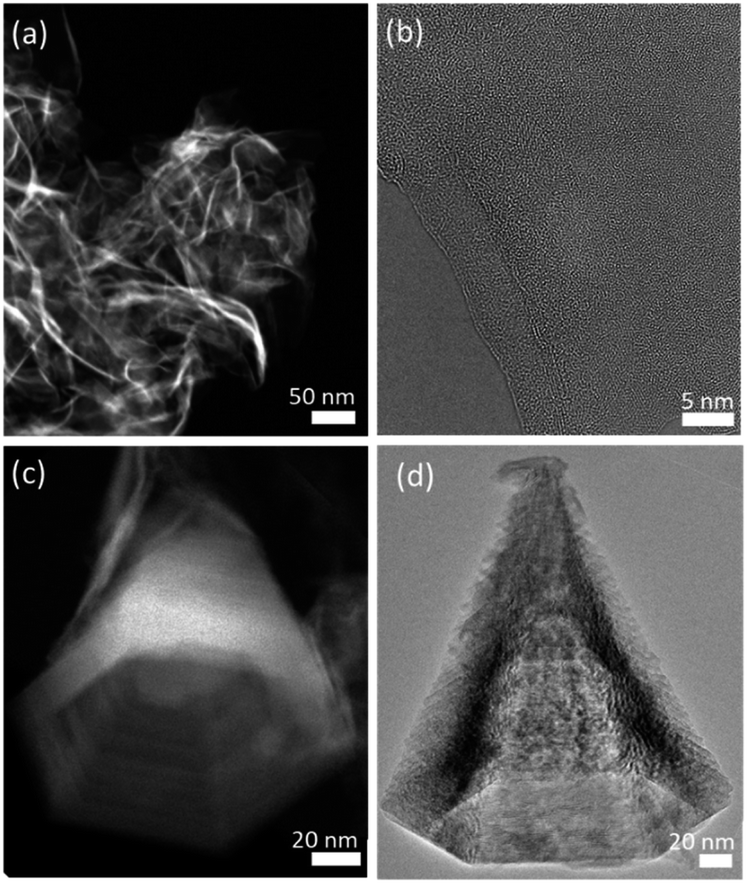 | ||
| Fig. 1 (a) Scanning transmission electron microscopy high angle annular dark field (STEM-HAADF) micrograph of HMO 3D nanosheets assembly composed by individual nanosheets shown by HRTEM in (b). (c) STEM-HAADF and (d) TEM images of FMO2 hollow nanocones. | ||
As demonstrated by Lim et al.,8 after Fe introduction and reaction at 90 °C the Fe cations are not only present in the interlayer space replacing the hydrated protons but are also partially incorporated to the MnO2 lattice in Mn substitutional sites by galvanic exchange. For the MnO2/Mn2+ and Fe3+/Fe2+ couples, the galvanic exchange reaction is described via:
| MnO2 + 2Fe2+ + 4H+ → Mn2+ + 2Fe3+ + 2H2O |
Besides, our results show that the Fe galvanic exchange reaction also resulted in a morphology transformation of the initial HMO nanosheet assemblies to nanocones (Fig. 1c and d) in FMO1 and FMO2 as indicated with arrows in Fig. S3a–d.† Interestingly, this morphology was only observed in the materials with relatively lower amount of Fe2+ ions used, thus indicating that the transformation is sensitive to the ratio of Fe2+ ions used during galvanic exchange reaction.
The nanocones clearly show the characteristic hexagonal pyramid shape with faceted faces. The average nanocone lengths of FMO1 and FMO2 are 230 ± 89 nm and 279 ± 100 nm with corresponding basal widths of 87 ± 32 nm and 184 ± 73 nm, respectively (Fig. S4†). Furthermore, unlike these hollow shaped nanocones, nanocones with a closed tip could be distinguished as minority (Fig. S5†). This can be a result of the pyramidal growth of nanocones one inside the other and subsequent break of the structure into individual cones.22
Since the pH is known to affect the morphology/phase transformation of manganese oxides17 the pH of the MnO2 and Fe solutions was measured prior to galvanic exchange reaction. In all cases, the pH was close to neutral (pH ≈ 7) (Fig. S6a†). Strong changes in pH could force different morphology/phase transitions as a result from the galvanic exchange reaction, as seen in Fig. S6b† for the case of conducting FMO3 in basic pH (pH ≈ 10.5, adjusted with TMAOH). Fig. S6c† demonstrates that the presence of TMA cations is not responsible for the different transition, as FMO3 experiments with equivalent presence of TMA+ in neutral pH do not modify the nanosheet morphology.
Evaluation of the capacitance properties of nanosheets and nanocones
CVs of 2D MnO2 (HMO) and a FexMn1–xO2 nanocone-rich material (1M-FMO2, see Section 5) were measured in the potential range of 0.21–1.01 V vs. the standard hydrogen electrode (SHE). SEM micrographs of the two electrodes can be found in Fig. S7.† To investigate the effect of the morphology transformation on the capacitive properties, the specific differential capacitance was calculated from the CV data obtained in three distinct measurements, averaged and plotted against the potential (Fig. 2). Despite the presence of ohmic-drop-related distortions of the CVs (particularly for 1M-FMO2) obstructing a quantitative comparison between both data sets, higher specific capacitance of HMO is observed in most part of the analyzed potential range.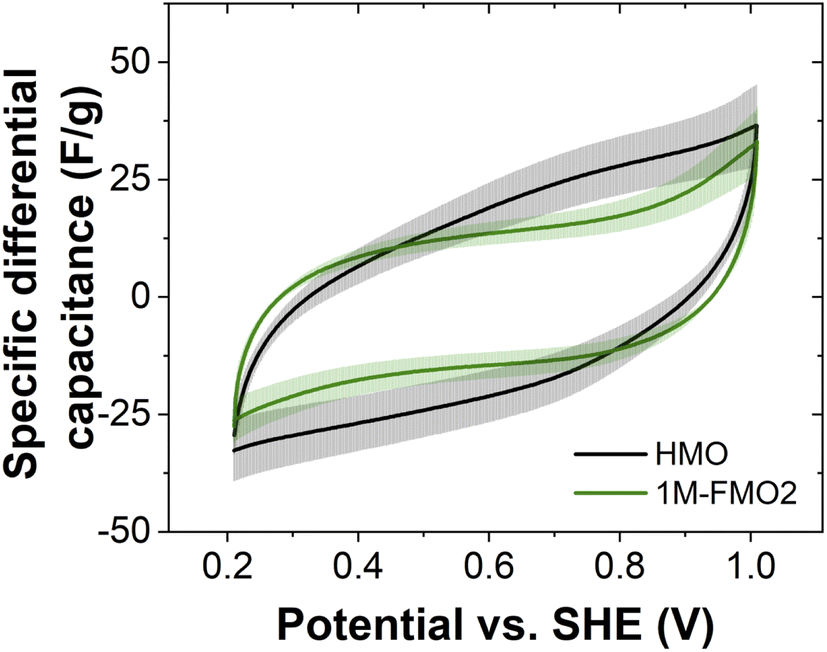 | ||
| Fig. 2 Averaged specific differential capacitance of 2D MnOx nanosheets (HMO) and nanocone-rich FexMn1–xO2 (1M-FMO2) sample. The standard deviation was used to obtain the error bar reported in the plot. | ||
We hypothesize that this difference may arise from a different accessibility of the material for charge compensating ions. The hexagonal pyramid morphology of the nanocones present in 1M-FMO2 likely results in a decreased accessible surface area when compared to the 2D nanosheet morphology of HMO. The Fe content could also play a role in the differences and mechanism of the capacitive (dis-)charging (Fig. S8†). Furthermore, the lower capacitances could also indicate a transition to a different crystal structure with less favorable capacitance properties than δ-MnO2.27,28 The distinctive capacitance behavior of the nanocones compared to that of nanosheets highlights the importance of understanding the paths of morphology transitions for the rational design of functional materials. To gain mechanistic insights, the transformation was further studied by thorough characterization of the nanostructures.
Composition and oxidation state analyses
EDS was conducted in STEM mode on all the FMO materials to determine the Fe contents of the different nanostructures, i.e. assembled nanosheets or nanocones. The results are summarized on Fig. 3a. The average at% Fe of the assembled nanosheets were 20, 20, 56 and 75% for FMO1, FMO2, FMO3 and FMO4, respectively. Although the Fe content on FMO3 and FMO4 was relatively homogeneous, FMO1 and FMO2 showed higher scattering of Fe concentration from various regions of analysis. Smaller 3D nanosheet assemblies (<500 nm) tend to possess higher Fe content than larger assemblies. Additionally, in case of larger assemblies, nanosheets in outer area (or surface) showed higher Fe content than those in inner part (or core) (Fig. S9†). From this we believe that upon low amount of Fe2+, these ions could not diffuse into the inner part of the thicker nanosheet assemblies.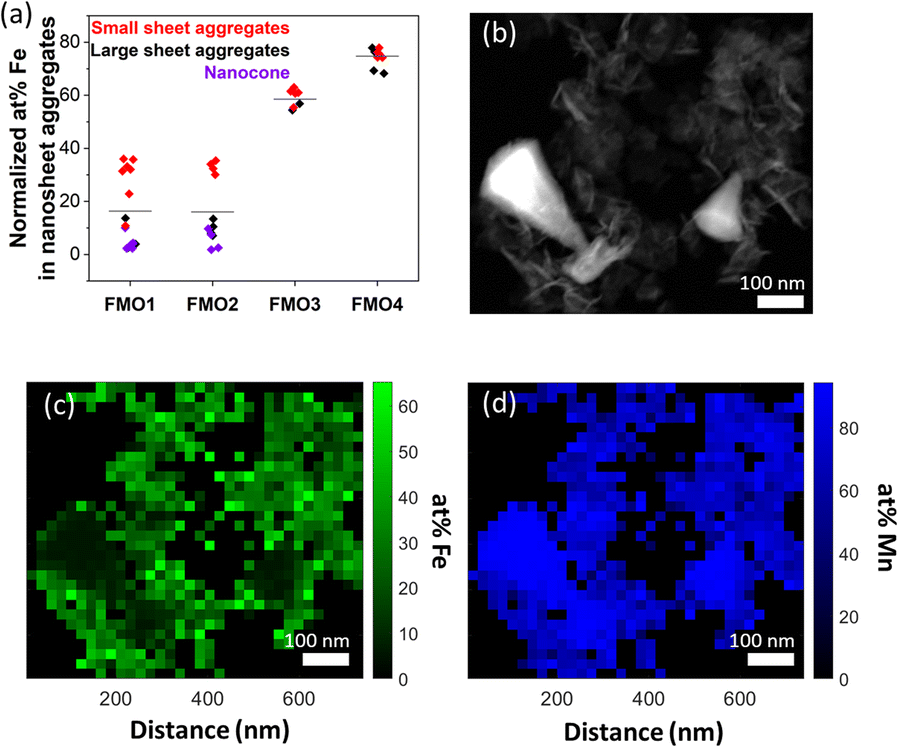 | ||
| Fig. 3 (a) Normalized at% Fe with respect to at% Mn for each material. (b–d) HAADF micrograph and corresponding EDS mapping after PCA analysis showing the distribution of Fe and Mn on nanosheets and nanocones in FM02. | ||
Analyses of the nanocone structure in both FMO1 and FMO2 revealed that those barely contain an average of 5 at% Fe, a much lower value compared to the 20 at% Fe of the assembled nanosheets of the same samples. Local differences of up to a ∼50 at% Fe between nanocones and nanosheets are shown quantitatively with a principle component analysis (PCA) of the EDS map data29 on Fig. 3b–d. This suggests that nanocones may consist of a different crystal structure than the assembled nanosheets by terms of chemical component as well as morphology.
EELS measurements were conducted in STEM mode on all the FexMn1−xO2 (FMO) materials to determine the oxidation state of the metal ions in the structure. The intensity ratios between L2 and L3 white lines (I(L3)/I(L2)) as well as the Fe L2,3 and Mn L2,3 peak positions are indicators of the average oxidation state of the element, with shifts towards larger energy losses indicating higher oxidation states.30,31 However, the Fe L3 peak position is maintained stable at ∼710.2 eV for all materials while the Fe I(L3)/I(L2) ratio only suffers from a slight change (Fig. S10,†Table 1). All the intensity ratio values are close to the reported I(L3)/I(L2) ≈ 5.1 for α-Fe2O3,32 thus suggesting a dominance of Fe3+ oxidation state in all nanosheet specimens. This result is consistent with the galvanic exchange reaction transforming all Fe2+ precursor to Fe3+.
| Material | Fe L3 (eV) | Fe I(L3)/I(L2) | Mn L3 (eV) | Mn I(L3)/I(L2) | |
|---|---|---|---|---|---|
| HMO nanosheet | — | — | 641.5 | 2.9 | |
| FMO1 | Nanosheet | 710.2 | 5.4 | 641.1 | 3.2 |
| Nanocone | — | — | 642.2 | 2.3 | |
| FMO2 | Nanosheet | 710.2 | 5.4 | 641.1 | 3.1 |
| Nanocone | — | — | 642.4 | 2.4 | |
| FMO3 nanosheet | 710.2 | 5.2 | 640.8 | 3.4 | |
| FMO4 nanosheet | 710.2 | 5.5 | 640.7 | 3.5 | |
Unlike Fe, the oxidation state of Mn varies. Fig. 4a contains the Mn L3 EELS spectra for assembled nanosheets of HMO, FMO1, FMO2, FMO3 and FMO4. The spectra show a shift of Mn L3 between the materials with Fe (Table 1) and HMO, indicating that upon galvanic exchange there are enhanced contributions of lower Mn valences (Mn3+/Mn2+) due to the partial substitution of Mn4+ by Fe3+. These qualitative results were also confirmed by I(L3)/I(L2) ratios, the reference values of which decrease from I(L3)/I(L2)MnO ≈ 4.0, I(L3)/I(L2)Mn2O3 ≈ 2.5 to I(L3)/I(L2)MnO2 ≈ 1.9.30 The calculated ratios shown in Fig. 4a and Table 1 increase from 2.9 to 3.5 with Fe, thus showing more reduction following the higher Fe content.
 | ||
| Fig. 4 (a) Left-Y axis: EELS Mn L3 white line of the nanosheets of each material. Right-Y axis: intensity ratio of Mn L3 and L2 peaks (b) Left-Y axis: EELS Mn L2,3 white lines of nanosheets and nanocones of FMO1 and FMO2. Right-Y axis: intensity ratio of Mn L3 and L2 peaks for FMO1 and FMO2 nanocones and nanosheets. (c and d) HAADF and corresponding EELS mapping after PCA analysis showing the local energy loss corresponding to Mn L3 of the nanosheets and nanocones. | ||
The value of I(L3)/I(L2)HMO ≈ 2.9 indicates that the Mn ions in HMO before addition of Fe are already in a very low valence, with significant Mn2+/Mn3+ contributions. This is compatible with a birnessite structure containing hydrated cations in the interlayer to compensate Mn3+/Mn4+ or Mn2+/Mn4+ of the structure, characteristic of the synthesis methodology.33,34
EELS spectra show a Mn L3 peak shift as high as ∼1.1 eV for FMO1 and ∼1.3 eV for FMO2 between nanocones and nanosheets (Fig. 4b, Table 1). This difference is also seen by local PCA of an EELS mapping of a nanocone and nanosheets29 (Fig. 4c and d) with data displaying the energy loss of the Mn L3 peak maximum as indicator of oxidation state. Such results clearly reveal that Mn ions in the nanocones are more oxidized than those in assembled nanosheets. This is confirmed by the distinct changes of intensity ratios from I(L3)/I(L2)FMO1 ≈ 3.2 and I(L3)/I(L2)FMO2 ≈ 3.1 for nanosheets to I(L3)/I(L2)FMO1 ≈ 2.3 and I(L3)/I(L2)FMO2 ≈ 2.4 for nanocones. The magnitude of the difference between Mn oxidation state in assembled nanosheets and nanocones can neither be explained solely by the different Fe content nor by a difference in their thicknesses (Fig. S2†). Therefore, these results strongly indicate the oxidation of the Mn ions during morphology transformation from 2D MnO2 nanosheet to nanocones.
Crystal structure
To elucidate the crystal structure of the materials, confocal Raman spectroscopy measurements were conducted (Fig. 5). All the spectra show four active modes: ν1 (721.6–744.9 cm−1), ν2 (636.2–643.0 cm−1), ν3 (566.9–573.0 cm−1), and ν4 (487.1–500.8 cm−1) (Table S1†). These modes can be assigned to the layered birnessite δ-MnO2 structure for all FMO1, FMO2, FMO3 and FMO4 despite the different Fe contents.8,34,35 X-ray diffraction (XRD) also confirmed such phase in HMO (Fig. S11†).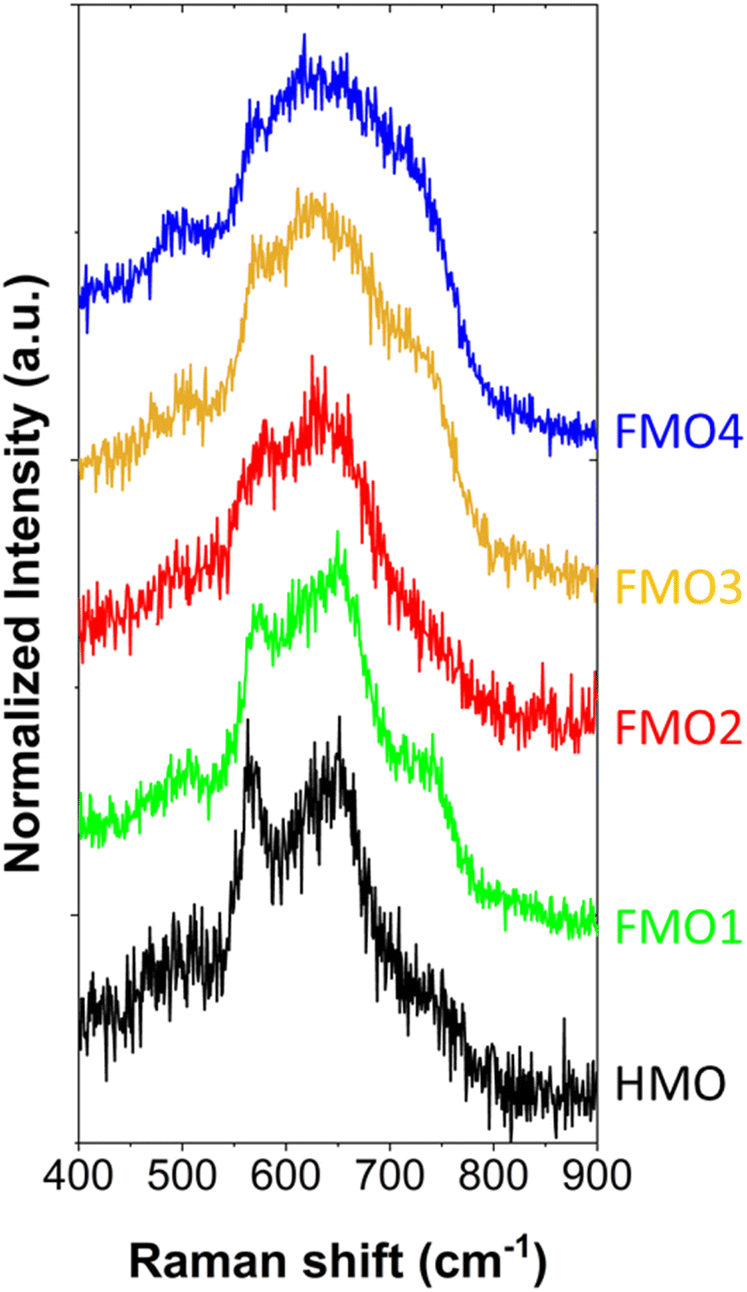 | ||
| Fig. 5 Raman spectra of HMO, FMO1, FMO2, FMO3 and FMO4. | ||
Moreover, Raman v1 and v2 modes appear broader in the materials with higher Fe contents (FMO3 and FMO4). This result is compatible with a higher extend of galvanic exchange reaction with higher Fe ratios, which induces the formation of more Mn defects and Mn2+ cations. Such defects reduce the order of the lattice, resulting in a polycrystalline structure with smaller grain sizes which broaden the Raman peaks.34 The smaller grain size of the materials with higher Fe content was also confirmed by TEM imaging the materials (Fig. S12†).
Local crystal structure investigations of the nanocones and the nanosheets were conducted by HRTEM, Fast Fourier Transform (FFT) (Fig. 6a–f and S13†) and selected area aperture electron diffraction (SAED) (Fig. 6g and h). The data indicates that the assembled nanosheets of HMO as well as nanosheets containing Fe (FMO1, FMO2, FMO3 and FMO4) show a polycrystalline birnessite structure (Fig. S14†) while nanocones are highly crystalline e.g. much larger crystal size. The nanocone patterns could be assigned to the γ-MnO2 ramsdellite crystal structure (orthogonal phase with a = 4.51, b = 9.26, c = 2.86, space group Pbnm (62)), in agreement with previous reports.21 The nanocone planes were determined to be the (1–10) for the facets of the nanocone with a twinning along the 〈021〉 direction and the (100) facet on the base. This confirms that a coupled morphology and phase transition occurs upon Fe galvanic exchange reaction.
 | ||
| Fig. 6 (a and b) HRTEM micrograph and corresponding FFT pattern of a HMO nanosheet. (c–f) HRTEM micrographs and FFT patterns corresponding to two facets of a FMO2 nanocone. (g and h) TEM micrograph and corresponding SAED pattern of a FMO2 nanocone. | ||
Nanocone growth mechanism from galvanic exchange reaction
With the results of the morphological and chemical analyses of FexMn1−xO2 nanosheets and nanocones, we hypothesize the following mechanism for the coupled morphology/phase transformation (Fig. 7). During the galvanic exchange reaction, Fe2+ reduces Mn4+, yielding Fe3+ and Mn2+. The fate and equilibrium of these cations is key for obtaining one morphology or the other. As demonstrated by the EDS analyses, when the initial Fe2+ to MnO2 nanosheets ratio is high, the only outcome are nanosheets with large Fe contents (FMO3 and FMO4). This means the Fe3+ occupies most of the available positions in the lattice, interlayer, and adsorption sites on the surface of MnO2 nanosheets while Mn2+ is dissolved in aqueous solution, yielding FexMn1−xO2 nanosheets as the only product. The partial dissolution of Mn4+ to Mn2+ as a consequence of Fe galvanic exchange reaction was demonstrated by performing ICP-MS on the solutions after reaction of MnO2 with Fe. The results showed larger amounts of Mn ions in the materials with larger amounts of Fe precursor (Table S2†).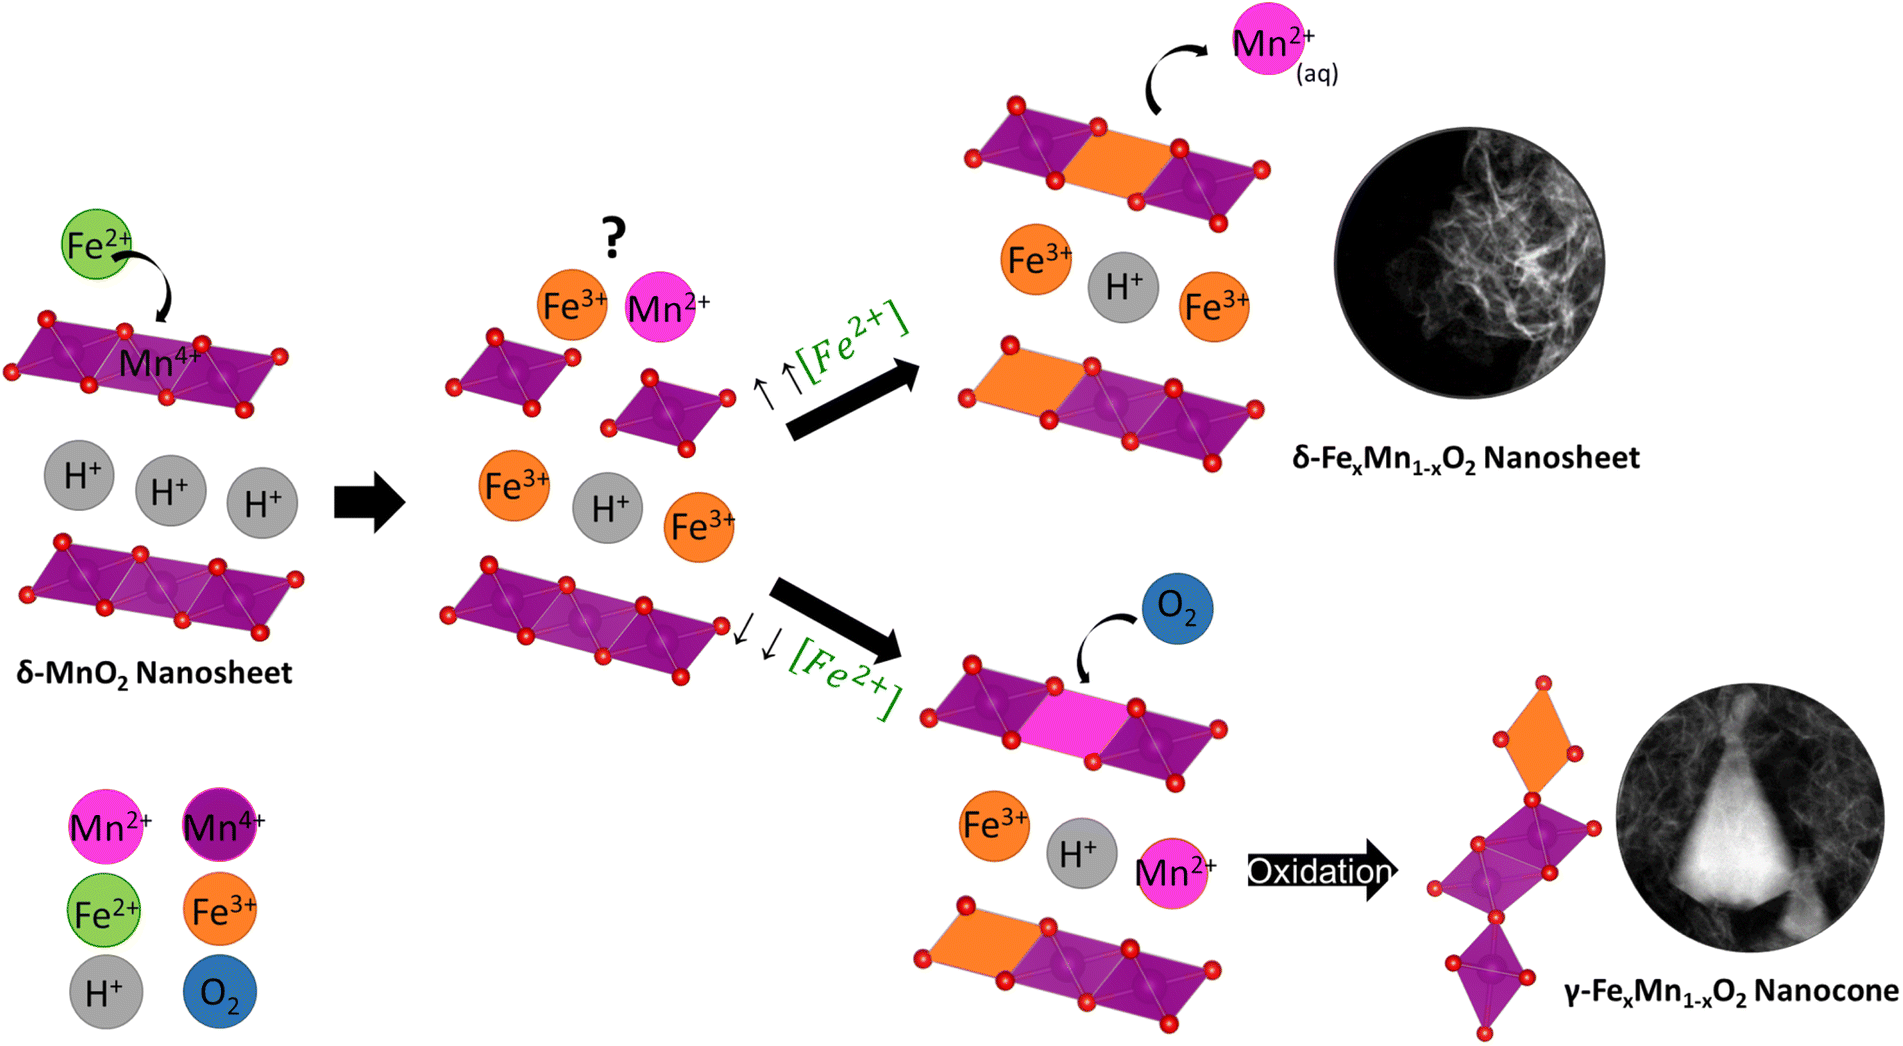 | ||
| Fig. 7 Schematic mechanism governing the synthesis of FexMn1−xO2 nanosheets and nanocones through galvanic exchange reaction. | ||
The morphological and EDS analyses revealed the phase transformation at lower Fe2+ to MnO2 nanosheets ratio. At such conditions, a competition between Fe3+ and Mn2+ for the lattice and interlayer sites can occur and Mn2+ will also partially occupy those sites instead of completely dissolving in solution. Upon aging for 24 h of the materials, these Mn2+ cations will be re-oxidized by atmospheric and water-dissolved oxygen, yielding γ-MnO2 nanocones with low Fe contents and higher Mn oxidation states, as demonstrated by EDS and EELS analyses. Since the oxidation state of the starting layered MnO2 nanosheet is lower than that of the nanocone product, a comproportionation mechanism for this transformation can be discarded.
To confirm the key role of the in situ Mn2+ formation we tried to reproduce the results of FMO2 by substituting Fe2+ for an equivalent molar percentage of Mn2+ (MMO2, Fig. S15†). A morphology transformation was successfully produced by Mn2+, confirming it is triggered by such cation. Although the EELS and Raman analysis showed similar results in MMO2 as compared to FMO2 (Fig. S16†), instead of obtaining a defined nanocone shape the MMO2 nanostructures showed a small faceted cone-like nanoparticle morphology. This contrast with the previous results reported by Tu et al.,17 who could obtain nanosheet to nanocone transformation through Mn2+ adsorption, can be explained by their much longer aging times. Such finding highlights the role of Fe2+ in speeding up the transformation by generating in situ the Mn2+ species with crystal defects, thus reducing the time of synthesis of well-defined nanocones.
Finally, since the nanocone transformation occurs through an oxidative step, the original oxidation state of the 2D MnO2 (HMO) can be of upmost importance. To assess its effect, three 2D MnO2 materials named 1M-HMO, 2M-HMO and 3M-HMO were synthesized by modifying the synthesis and aging time (see Experimental section) in order to change their Mn oxidation state. This was monitored by EELS (Fig. 8a), demonstrating that the longer the synthesis and aging times, the more oxidized the Mn species of the 2D MnO2 nanosheets.
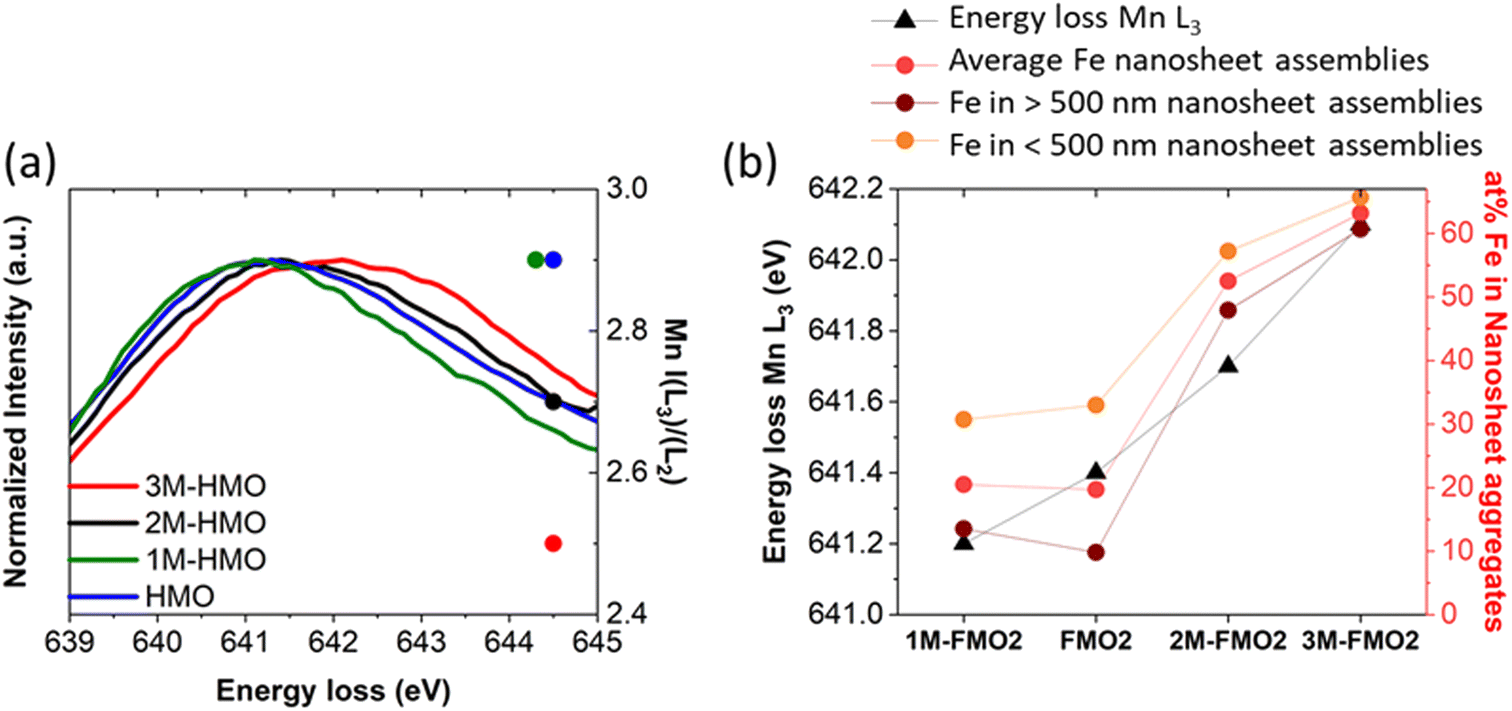 | ||
| Fig. 8 (a) Left-Y Axis: EELS Mn L3 peaks of HMO, 1M-HMO, 2M-HMO and 3M-HMO. Right-Y axis: corresponding Mn I(L3)/(L2) values. (b) Trends of oxidation state of xM-HMO (Left-Y axis) and Fe introduced by galvanic exchange reaction (right-Y axis) for xM-FMO2. | ||
Galvanic exchange reaction was subsequently conducted with these xM-HMO materials emulating FMO2 conditions (xM-FMO2). The results showed that the materials produced with more oxidized MnO2 nanosheets (2M-FMO2 and 3M-FMO2) contained FexMn1−xO2 nanosheets with larger contents of Fe than FMO2 but containing similar ratio of nanocones (Fig. 8b and S17†). On the contrary, reducing the oxidation state of Mn species (1M-HMO) by shorter synthesis and aging time resulted on materials with the same 20 at% Fe than HMO after galvanic exchange reaction. However, the difference in oxidation state of 1M-HMO contributed to the major enhancement of the nanocone morphology with respect to nanosheet after reaction (Fig. S17†). These results can be related to the galvanic exchange reaction potentials with different Mnn+ species. The reaction between Fe3+/Fe2+ and Mn2O3/Mn2+ couples is thermodynamically more favourable than that of Fe3+/Fe2+ and MnO2/Mn2+ (ΔE0cell = 0.714 V vs.ΔE0cell = 0.459 V, respectively). This difference potentially indicates larger local concentration of produced Mn2+ during galvanic exchange reaction with the more reduced 1M-HMO due to the higher thermodynamic driving force, explaining the larger nanocone to nanosheet ratio. Moreover, the nanocone size is also larger, showing an average length 391 ± 197 nm and average width 228 ± 91 nm distributed in two different family sizes. (Fig. S4†).
Conclusions
A rapid layer-to-tunnel transformation from δ-MnO2 nanosheets to γ-MnO2 nanocones was achieved via Fe galvanic exchange reaction. Such transformation leads to a change of the electrochemical capacitive properties of the FexMn1−xO2 nanomaterials. Mechanistic insights were gained by a combination of electron microscopy and spectroscopy techniques. According to local EELS analyses, the coupled morphology and phase transition followed an in situ Mn2+ generation and reoxidation mechanism. Investigations on the oxidation state of the MnO2 nanosheets and the ratio between Fe2+ and MnO2 for galvanic exchange reaction revealed the major role of the equilibrium between the generated Mn2+ and Fe3+ cations for the layer-to-tunnel transition, allowing to tune the nanostructures obtained. This work highlights the importance of mechanistic understanding for the rational design, synthesis, and structure–property relationships of functional nanomaterials.Author contributions
R. A. A. conducted the synthesis, electron microscopy experiments and data analysis and was assisted by J. L. (J. Lim) and C. S. for the results interpretation. P. C. and R. A. A. performed the electrochemical measurements. K. T. and J. L. (J. Linnenmann) assisted in the interpretation of the electrochemistry data. P. E. conducted the Raman spectroscopy experiments which were analyzed and interpreted by R. A. A. and M. R. R. A. A. wrote the manuscript with contributions of all authors. All authors have given approval to the final version of the manuscript.Conflicts of interest
There are no conflicts to declare.Acknowledgements
Benjamin Breitbach is acknowledged for XRD measurements. We also thank Andrea Mingers for performing ICP-MS. R. A. A and P. C. are grateful for financial support from the International Max Planck Research School for Interface Controlled Materials for Energy Conversion (IMPRS-SurMat). R. A. A. work was supported by a fellowship of the German Academic Exchange (DAAD). K. Tschulik acknowledges funding through a Max Planck Fellowship and J. Linnemann through the Stiftung Mercator (18023). M. Rabe work was funded by the Deutsche Forschungsgemeinschaft (DFG, German Research Foundation) under Germany's Excellence Strategy - EXC 2033 - 390677874 – RESOLV. This work was supported by the National Research Foundation of Korea (NRF) grant funded by the Korea government (MSIT) (No. NRF-2021R1F1A1061943).References
- C. M. Julien and A. Mauger, Nanomaterials, 2017, 7, 396 CrossRef PubMed.
- R. Yang, Y. Fan, R. Ye, Y. Tang, X. Cao, Z. Yin and Z. Zeng, Adv. Mater., 2021, 339, 2004862 CrossRef PubMed.
- Y. Meng, W. Song, H. Huang, Z. Ren, S.-Y. Chen and S. L. Suib, J. Am. Chem. Soc., 2014, 136, 11452–11464 CrossRef CAS PubMed.
- P. K. Gupta, A. Bhandari, S. Saha, J. Bhattacharya and R. G. S. Pala, J. Phys. Chem. C, 2019, 123, 22345–22357 CrossRef CAS.
- Z. Ye, T. Li, G. Ma, Y. Dong and X. Zhou, Adv. Funct. Mater., 2017, 27, 1704083 CrossRef.
- L. Tian, X. Zhai, X. Wang, J. Li and Z. Li, J. Mater. Chem. A, 2020, 8, 14400–14414 RSC.
- M. H. Oh, T. Yu, S.-H. Yu, B. Lim, K.-T. Ko, M.-G. Willinger, D.-H. Seo, B. H. Kim, M. G. Cho, J.-H. Park, K. Kang, Y.-E. Sung, N. Pinna and T. Hyeon, Science, 2013, 340, 964–968 CrossRef CAS PubMed.
- J. Lim, J. M. Lee, B. Park, X. Jin and S.-J. Hwang, Nanoscale, 2017, 9, 792–801 RSC.
- H. Liu, W. Gu, B. Luo, P. Fan, L. Liao, E. Tian, Y. Niu, J. Fu, Z. Wang, Y. Wu, G. Lv and L. Mei, Electrochim. Acta, 2018, 291, 31–40 CrossRef CAS.
- D. P. Dubal, W. B. Kim and C. D. Lokhande, J. Phys. Chem. Solids, 2012, 73, 18–24 CrossRef CAS.
- Y. Wang, Y.-Z. Zhang, Y.-Q. Gao, G. Sheng and J. E. ten Elshof, Nano Energy, 2020, 68, 104306 CrossRef CAS.
- S. Birgisson, D. Saha and B. B. Iversen, Cryst. Growth Des., 2018, 18, 827–838 CrossRef CAS.
- T. Hatakeyama, H. Li, N. L. Okamoto, K. Shimokawa, T. Kawaguchi, H. Tanimura, S. Imashuku, M. Fichtner and T. Ichitsubo, Chem. Mater., 2021, 33, 6983–6996 CrossRef CAS.
- D. A. Kitchaev, S. T. Dacek, W. Sun and G. Ceder, J. Am. Chem. Soc., 2017, 139, 2672–2681 CrossRef CAS PubMed.
- Y.-F. Li, S.-C. Zhu and Z.-P. Liu, J. Am. Chem. Soc., 2016, 138, 5371–5379 CrossRef CAS PubMed.
- B. He, G. Cheng, S. Zhao, X. Zeng, Y. Li, R. Yang, M. Sun and L. Yu, J. Solid State Chem., 2019, 269, 305–311 CrossRef CAS.
- S. Tu, G. J. Racz and T. B. Goh, Clays Clay Miner., 1994, 42, 321–330 CrossRef CAS.
- P. Yang, S. Lee, J. E. Post, H. Xu, Q. Wang, W. Xu and M. Zhu, Geochim. Cosmochim. Acta, 2018, 240, 173–190 CrossRef CAS.
- E. J. Elzinga, Environ. Sci. Technol., 2011, 45, 6366–6372 CrossRef CAS PubMed.
- Y. Yuan, K. He, B. W. Byles, C. Liu, K. Amine, J. Lu, E. Pomerantseva and R. Shahbazian-Yassar, Chem, 2019, 5, 1793–1805 CAS.
- D. Portehault, S. Cassaignon, E. Baudrin and J.-P. Jolivet, Cryst. Growth Des., 2009, 9, 2562–2565 CrossRef CAS.
- Y.-S. Ding, X.-F. Shen, S. Gomez, H. Luo, M. Aindow and S. L. Suib, Adv. Funct. Mater., 2006, 16, 549–555 CrossRef CAS.
- D. Portehault, S. Cassaignon, E. Baudrin and J.-P. Jolivet, J. Mater. Chem., 2009, 19, 7947–7954 RSC.
- K. Kai, Y. Yoshida, H. Kageyama, G. Saito, T. Ishigaki, Y. Furukawa and J. Kawamata, J. Am. Chem. Soc., 2008, 130, 15938–15943 CrossRef CAS PubMed.
- F. Karnbach, M. Uhlemann, A. Gebert, J. Eckert and K. Tschulik, Electrochim. Acta, 2014, 123, 477–484 CrossRef CAS.
- P. A. van Aken and B. Liebscher, Phys. Chem. Miner., 2002, 29, 188–200 CrossRef CAS.
- S. Devaraj and N. Munichandraiah, J. Phys. Chem. C, 2008, 112, 4406–4417 CrossRef CAS.
- T. Brousse, M. Toupin, R. Dugas, L. Athouël, O. Crosnier and D. Bélanger, J. Electrochem. Soc., 2006, 153, A2171 CrossRef CAS.
- S. Zhang and C. Scheu, Microsc, 2017, 67, i133–i141 CrossRef PubMed.
- H. Tan, J. Verbeeck, A. Abakumov and G. Van Tendeloo, Ultramicroscopy, 2012, 116, 24–33 CrossRef CAS.
- J. Lim, X. Jin, S.-J. Hwang and C. Scheu, Adv. Funct. Mater., 2020, 30, 2003849 CrossRef CAS.
- C. Wang, Y. Wang, X. Liu, H. Yang, J. Sun, L. Yuan, G. Zhou and F. Rosei, Nanotechnology, 2015, 27, 035702 CrossRef PubMed.
- S. Min and Y. Kim, Minerals, 2020, 10, 884 CrossRef CAS.
- C. Julien, M. Massot, R. Baddour-Hadjean, S. Franger, S. Bach and J. P. Pereira-Ramos, Solid State Ionics, 2003, 159, 345–356 CrossRef CAS.
- C. M. Julien, M. Massot and C. Poinsignon, Spectrochim. Acta, Part A, 2004, 60, 689–700 CrossRef CAS.
Footnote |
| † Electronic supplementary information (ESI) available. See DOI: https://doi.org/10.1039/d2ta06552e |
| This journal is © The Royal Society of Chemistry 2022 |