 Open Access Article
Creative Commons Attribution 3.0 Unported Licence
Local structural distortions and reduced thermal conductivity in Ge-substituted chalcopyrite†
Sahil
Tippireddy
 a,
Feridoon
Azough
b,
Vikram‡
a,
Animesh
Bhui
c,
Philip
Chater
a,
Feridoon
Azough
b,
Vikram‡
a,
Animesh
Bhui
c,
Philip
Chater
 d,
Demie
Kepaptsoglou
 ef,
Quentin
Ramasse
eg,
Robert
Freer
 b,
Ricardo
Grau-Crespo
 a,
Kanishka
Biswas
 c,
Paz
Vaqueiro
 a and
Anthony V.
Powell
 *a
*a
aDepartment of Chemistry, University of Reading, Whiteknights, Reading, RG6 6DX, UK. E-mail: a.v.powell@reading.ac.uk
bDepartment of Materials, University of Manchester, Manchester, M13 9PL, UK
cNew Chemistry Unit, Jawaharlal Nehru Centre for Advanced Scientific Research, Jakkur, Bangalore-560064, India
dDiamond Light Source, Harwell Science and Innovation Campus, Didcot OX11 0DE, UK
eSuperSTEM Laboratory, SciTech Daresbury Campus, Daresbury WA4 4AD, UK
fDepartment of Physics, University of York, York YO10 5DD, UK
gSchool of Chemical and Process Engineering, University of Leeds, Leeds LS2 9JT, UK
First published on 26th October 2022
Abstract
Chalcopyrite, CuFeS2 is considered one of the promising n-type thermoelectric materials with high natural abundance as a mineral. In this work, partial substitution of germanium in materials CuFe1−xGexS2, (0.0 ≤ x ≤ 0.10), leads to an almost six-fold enhancement of thermoelectric properties. X-Ray photoelectron spectroscopy (XPS) reveals that germanium is present in two oxidation states: Ge2+ and Ge4+. The stereochemically-active 4s2 lone-pair of electrons associated with Ge2+ induces a local structural distortion. Pair-distribution function (PDF) analysis reveal that Ge2+ ions are displaced from the centre of the GeS4 tetrahedron towards a triangular face, leading to pseudo-trigonal pyramidal coordination. This distortion is accompanied by lattice softening and an increase of the strain-fluctuation scattering parameter (ΓS), leading to a decrease in thermal conductivity. Phonon calculations demonstrate that germanium substitution leads to the appearance of resonant phonon modes. These modes lie close in energy to the acoustic and low-energy optical modes of the host matrix, with which they can interact, providing an additional mechanism for reducing the thermal conductivity. The weak chemical bonding of germanium with sulphur also leads to localized electronic states near the Fermi level which results in a high density-of-states effective mass, enabling a relatively high Seebeck coefficient to be maintained, despite the reduced electrical resistivity. This combination produces an almost three-fold improvement in the power factor, which when coupled with the substantial reduction in thermal conductivity, leads to a maximum figure-of-merit, zT ∼ 0.4 at 723 K for CuFe0.94Ge0.06S2.
1. Introduction
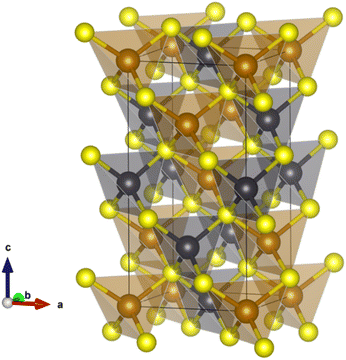
The opportunities afforded by thermoelectric (TE) devices to harvest electrical energy from otherwise waste heat have motivated a significant worldwide search for new high-performance materials. The performance of a TE material is characterized by a figure-of-merit, zT = S2T/ρκ, where S, ρ and κ denote the Seebeck coefficient, electrical resistivity and thermal conductivity, respectively. While significant research effort has resulted in materials with figures-of-merit that exceed unity, many of the examples exhibiting the highest performance1–6 contain toxic or comparatively scarce and expensive elements. Efforts to discover materials containing Earth-abundant elements have extended to an investigation of complex metal-sulphides as candidate thermoelectrics.7,8 This has resulted in significant advances in the performance of p-type sulphides,9–17 while progress in the n-type counterparts18–23 required for device construction has been less marked.Chalcopyrite, CuFeS2, containing Earth-abundant elements is a candidate n-type material for thermoelectric applications. It adopts a tetragonal structure24 (space group: I![[4 with combining macron]](https://www.rsc.org/images/entities/char_0034_0304.gif) 2d), which may be considered an ordered derivative of the cubic zinc blende structure, comprising vertex-sharing MS4 (M = Cu, Fe) tetrahedra (Fig. 1). CuFeS2 exhibits a moderate power factor but has a high lattice thermal conductivity that limits its thermoelectric performance. A wide range of substitutional chemistry of CuFeS2 has been explored20,25–27 in an effort to improve the electrical transport properties and hence optimize the power factor (S2/ρ), while simultaneously reducing the lattice contribution to the thermal conductivity. Substituents have typically consisted of transition-metal cations.20,25–28 These substituents appear to have a limited impact on the thermal conductivity as they do not produce any significant anharmonicity or induce substantial structural distortions.
2d), which may be considered an ordered derivative of the cubic zinc blende structure, comprising vertex-sharing MS4 (M = Cu, Fe) tetrahedra (Fig. 1). CuFeS2 exhibits a moderate power factor but has a high lattice thermal conductivity that limits its thermoelectric performance. A wide range of substitutional chemistry of CuFeS2 has been explored20,25–27 in an effort to improve the electrical transport properties and hence optimize the power factor (S2/ρ), while simultaneously reducing the lattice contribution to the thermal conductivity. Substituents have typically consisted of transition-metal cations.20,25–28 These substituents appear to have a limited impact on the thermal conductivity as they do not produce any significant anharmonicity or induce substantial structural distortions.
We are engaged in a program of work to exploit substitution with high oxidation state main-group cations, to enhance the TE performance of chalcopyrite. The different bonding properties of such substituents compared to transition-metal cations, may lead to weaker chemical bonding and potentially introduce structural distortions. Such features can have a marked impact on the phonon density of states and contribute to reductions in the lattice thermal conductivity.29,30 High oxidation state substituents offer the potential to achieve greater increases in the charge-carrier concentration than is possible with the more usual 2+ transition-metal cations. Although, as we have demonstrated recently,31 in the case of substitution with Sn4+, the increase in charge-carrier concentration can deviate from expected values due to the presence of localised states, associated with the formation of small polarons.
Here we describe the impact on electrical and thermal transport properties of substitution of Fe3+ by the p-block element, Ge4+, in chalcopyrite. X-Ray photoelectron spectroscopy (XPS) reveals the presence of germanium in two oxidation states, Ge4+ and Ge2+, in the substituted phases. While the charge-carrier concentration is increased on substitution, the formation of Ge2+ limits the increase to values below that expected on the basis of formal electron-counting. Significantly, the different bonding preferences of Ge2+ arising from the non-bonding 4s2 electron pair, induce a local structural distortion, in which the Ge2+ cation is displaced from the centre of a GeS4 tetrahedron towards one of the triangular faces of the polyhedron. This induces lattice softening and enhances phonon scattering, resulting in a lattice thermal conductivity that is less than half of that in the pristine phase. Although substitution decreases the electrical resistivity, a relatively high Seebeck coefficient is maintained, leading to an increase in power factor. This, together with a marked reduction in thermal conductivity, leads to an almost six-fold increase in the figure-of-merit.
2. Methods
Elemental Cu (Sigma Aldrich, 99.5%), Fe (Alfa Aesar, 99%+), Ge (Fisher Scientific, 99.999%) powders and S flakes (Sigma Aldrich, 99.99%) were weighed in stoichiometric amounts according to the formula, CuFe1−xGexS2 (0 ≤ x ≤ 0.1) and sealed into evacuated (∼10−3 mbar) fused silica tubes. The evacuated tubes were heated to 723 K and held at this temperature for 150 hours before slow cooling (0.4 K min−1) to room temperature. The products were ground and re-fired for 48 hours at 1173 K in evacuated silica tubes, before cooling to room temperature at 0.4 K min−1. The as-cast ingots were re-ground and hot-pressed at 873 K under a pressure of 80 MPa for 30 minutes. Densities of the consolidated pellets, determined by the Archimedes method, using an AE Adam PW 184 balance, are >98% of the theoretical value.Initial phase analysis of the powdered products was carried out by laboratory powder X-ray diffraction, collected using a Bruker D8 Advance diffractometer (Cu Kα1: λ = 1.5405 Å). Synchrotron X-ray powder diffraction data (λ = 0.161669 Å) were collected on the I15-1 beamline at the Diamond Light Source synchrotron facility, UK. The PerkinElmer XRD 1611 CP3 Bragg detector was placed ∼900 mm from the sample for a data acquisition time of 120 s. Rietveld analysis of the powder X-ray diffraction data was carried out using FullProf.32 X-Ray total scattering data for CuFe1−xGexS2 (0.02 ≤ x ≤ 0.1) were collected on I15-1 using a PerkinElmer XRD 4343 CT detector placed ∼200 mm from the sample, with a data acquisition time of 300 s. The powder samples were contained in 1 mm capillaries, which were spun during data collection. The diffraction data were processed using the GudrunX software33 (Qmax = 30 Å) to perform background and instrumental corrections and to convert the data into the pair-distribution function (PDF). The PDF analysis (small box modelling) and fitting was performed using the PDFgui software.34
X-Ray photoelectron spectroscopy (XPS) measurements for CuFe0.94Ge0.06S2 were performed with a Thermo Scientific spectrometer using an Al-Kα (1.487 keV) X-ray monochromatic source with variable spot size. The C 1s binding energy (284.8 eV) was used for calibration. The background correction, peak deconvolution and fitting of the XPS spectra were carried out using CasaXPS software.35
The microstructure was investigated using a SIRION FEI FEG-SEM, and energy-dispersive X-ray spectroscopy (EDS) elemental point analysis was performed using a TESCAN MIRA LC FEG (SEM) equipped with an Oxford Instrument SDD energy dispersive detector. An FEI FEGTEM (Tecnai G2, Hillsboro, OR) operating at 300 kV was used for high-resolution transmission electron microscopy (HRTEM) and selected area electron diffraction (SAED). Atomic-resolution structural characterization was carried out using a Nion UltraSTEM aberration-corrected STEM equipped with a Gatan Enfina electron energy loss spectrometer. This microscope was operated at 100 kV acceleration voltage and the probe-forming optics were adjusted to form a 0.9 Å electron probe with a convergence of 31 mrad and beam current of approximately 50 pA.
Electrical resistivity and Seebeck coefficient data were collected on hot-pressed pellets over the temperature range (323 ≤ T/K ≤ 723) using a Linseis LSR-3 system. Hall effect measurements at room temperature were performed using an Ecopia HMS-3000 system. Thermal diffusivity (α), data were collected using a Netzsch LFA-447 NanoFlash instrument (323 ≤ T/K ≤ 573) and an Anter Flashline-3000 system (573 ≤ T/K ≤ 723 K). The data were converted to thermal conductivity (κ) using κ = αCpd where Cp denotes the constant-pressure specific heat capacity, and d is the sample density. The specific heat of chalcopyrite was calculated to be 0.52 J g−1 K−1, using the Dulong–Petit expression. Uncertainties in electrical resistivity, Seebeck coefficient and thermal conductivity are estimated to be 5%, 5% and 10% respectively, leading to an estimated uncertainty in the figure-of-merit (zT) of ca. 15%. Longitudinal (vl) and transverse (vt) sound velocity measurements were performed at room temperature, on an ingot of dimensions: 12.7 mm (diameter) × 1.8 mm (thickness), using an Olympus Epoch 650 Ultrasonic Flaw Detector with a transducer frequency of 5 MHz.
Density functional theory (DFT) calculations were performed using the VASP code36–38 and a projected augmented-wave basis with a wave cutoff of 385 eV.39 The generalized gradient approximation (GGA) exchange–correlation functional of Perdew–Burke–Ernzerhof (PBE)40 was used, and a Hubbard (GGA + U) correction with Ueff = 3 eV was applied to improve the poor GGA description of the Fe 3d orbitals.41 To simulate the 6 at% Ge substituted CuFeS2 approximating the experimental composition, CuFe0.94Ge0.06S2, a supercell of 2 × 2 × 1 conventional unit cell of CuFeS2 (with Z = 4 in each conventional unit cell) was taken where one atom of Fe was replaced by Ge. This gives a composition with 6.25 at% Ge substituted in CuFeS2, or CuFe0.9375Ge0.0625S2, close to the experimental composition. The zero-damping DFT-D3 method42 was employed and the structure was relaxed with a threshold force of 10−4 eV Å−1 on each atom. The resulting lattice parameters are in close agreement with the experimental values. The Brillouin zone was sampled by a 4 × 4 × 2 and 12 × 12 × 6 Γ-centered k-point mesh for structural optimization and single point calculations respectively, with reference to the conventional unit cell and using grids of the same density for supercell calculations. Spin-polarization was allowed in the simulations, and the Fe magnetic moments were initialized in high-spin configurations with antiferromagnetic ordering. The electronic density of states (DOS) was calculated using the tetrahedron method with Blöchl corrections.43 The phonon dispersion curves for the 6.25% Ge doped composition were obtained using density functional perturbation theory (DFPT)44,45 as implemented in VASP, to first calculate the force constants, and later using the PHONOPY46 code, for force constant extraction and calculation of the dispersion plot.
3. Results and discussion
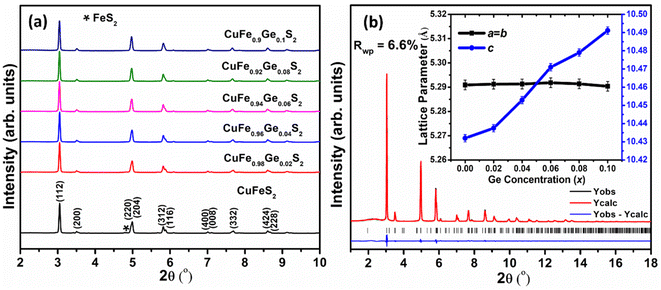
Examination of laboratory powder X-ray diffraction data indicated that all compositions could be indexed on the basis of a tetragonal unit cell, with lattice parameters similar to those of CuFeS2, thereby confirming that the chalcopyrite structure is retained at all levels of substitution. Subsequent structural analysis was conducted using powder X-ray diffraction data obtained using synchrotron radiation (Fig. 2a). The powder diffraction data for the Ge-substituted materials provide no evidence for the presence of any impurity phases, while a weak feature arising from trace amounts of FeS2 is apparent in the data for the end-member, CuFeS2. Rietveld refinements using synchrotron X-ray powder diffraction data (Fig. 2b for CuFe0.94Ge0.06S2, with data for the remaining compositions provided as ESI†) were carried out using a structural model in which Ge is located at the Fe (4b) site. This results in excellent agreement between the observed and calculated powder diffraction patterns. While the unit-cell parameter, a, remains almost constant (Fig. 2b (inset)) with increasing Ge content, the c parameter increases monotonically. Since the ionic radii of Ge4+ and Fe3+ in tetrahedral coordination are 0.39 and 0.49 Å respectively,47 Ge4+ substitution at the Fe3+ site would be expected to result in a slight decrease in the lattice parameters. However, as demonstrated by XPS data (vide infra), Ge-substituted materials also contain larger Fe2+ (0.63 Å) and Ge2+ (0.73 Å) cations,47 which may be responsible for the observed increase in the c lattice parameter.Scanning electron microscopy (SEM) coupled with energy-dispersive X-ray spectroscopy (EDS) was performed to evaluate the composition of the samples and to identify any trace amounts of secondary phases, below the level of detection by powder X-ray diffraction, that may influence the transport properties. The SEM data (Fig. S2a†) for CuFeS2 itself, indicate the presence of small amounts of FeS2 and Cu5FeS4. Similarly, at the lowest level of Ge substitution (x = 0.02), trace amounts of FeS2 are observed (Fig. 3a), albeit reduced compared to the unsubstituted sample. At Ge contents in the range 0.04 ≥ x ≥ 0.06, the SEM data (Fig. 3b and c) show the materials to be phase-pure with no evidence of any secondary phase(s), suggesting that Ge substitution stabilizes the chalcopyrite phase and suppresses the formation of secondary phases. At the highest levels of germanium incorporation, (x > 0.06), FeS2 together with microprecipitates of another secondary phase, identified by EDS as a non-stoichiometric, copper-poor chalcopyrite-like phase (the compositions of which are presented in the caption to Fig. S2†) are evident at very high magnification (Fig. S2b and c†).
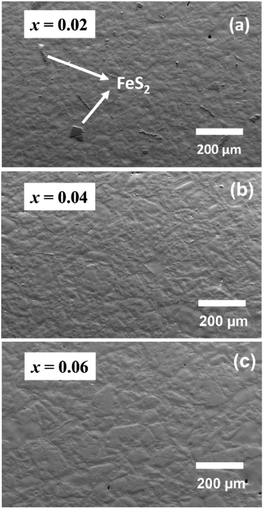 | ||
| Fig. 3 Scanning electron microscopy (SEM) images for CuFe1−xGexS2 with (a) x = 0.02, (b) x = 0.04 and (c) x = 0.06 . | ||
The compositions of the principal chalcopyrite-type phase in the substituted samples, determined by EDS (Table S2†), are broadly consistent with the nominal compositions. The slightly higher Cu contents determined by EDS may be due to the overlap of the Kα and Lα characteristic lines of Cu and Fe, as has been reported previously.31 The Ge contents are in excellent agreement with the nominal values, indicating successful substitution of Ge in the chalcopyrite matrix.
X-Ray photoelectron spectroscopy data for CuFe0.94Ge0.06S2 (Fig. 4) reveals the presence of Cu+, Fe3+ and S2−, as has been observed in XPS data for unsubstituted chalcopyrites.25,29,31,48,49 However, an additional weak peak (Fig. 4b) corresponding to Fe2+ is observed in the Fe 2p spectrum, suggesting that Ge substitution results in a reduction of a fraction of the Fe3+ ions to Fe2+. A similar observation has been made for tin and indium substitution in chalcopyrite30,31 Significantly, the 3d spectrum of Ge (Fig. 4d) indicates that this cation is in a mixed oxidation state, with peaks assignable to both Ge2+ and Ge4+ present; the latter having the higher intensity. While data were obtained for materials with lower germanium contents, the Ge signal was too weak to provide definitive information on the oxidation states.
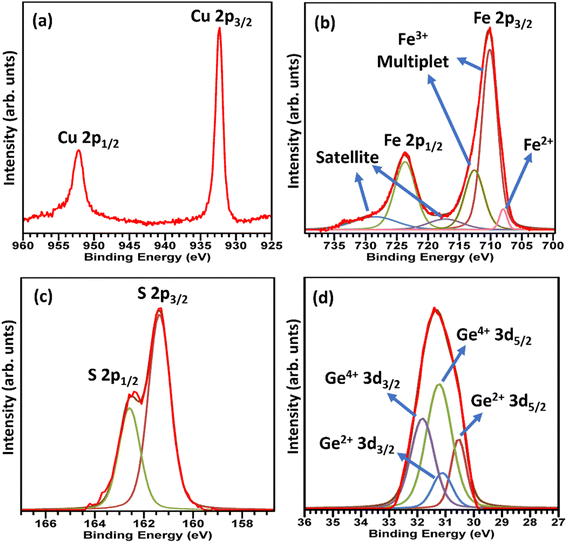 | ||
| Fig. 4 The X-ray photoelectron spectra corresponding to (a) Cu 2p (b) Fe 2p (c) S 2p (d) Ge 3d in CuFe0.94Ge0.06S2. | ||
CuFeS2 exhibits a relatively high electrical resistivity (ρ) of 0.31–0.4 mΩ m at temperatures in the range 323 ≤ T/K ≤ 723. The resistivity is markedly reduced on Ge substitution (Fig. 5a) at levels of substitution up to x = 0.06. The temperature dependence also changes, with ρ(T) becoming relatively flat for the substituted materials. At higher levels of Ge incorporation, (x ≥ 0.08) the electrical resistivity increases slightly. This may be associated with the presence of trace amounts of secondary phases, identified by SEM, at these high levels of substitution. The lowest electrical resistivity, measured for CuFe0.94Ge0.06S2, is ca. 50–70% lower than that of the pristine CuFeS2 phase, demonstrating the effectiveness of Ge substitution in improving the electrical properties.
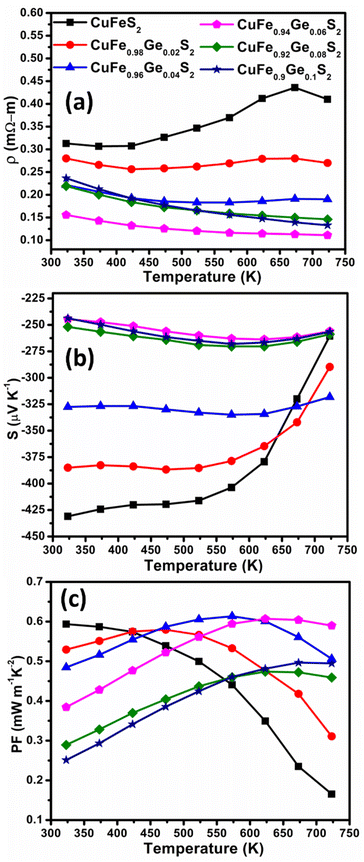 | ||
| Fig. 5 (a) Electrical resistivity (ρ), (b) Seebeck coefficient (S) and (c) power factor (PF) as a function of temperature of CuFe1−xGexS2 (0.0 ≤ x ≤ 0.10). | ||
The Seebeck coefficient (S) (Fig. 5b), follows a similar trend to that observed for the electric resistivity: |S| initially decreases with Ge contents up to x = 0.06, before increasing slightly at x ≥ 0.08. The temperature dependence of the Seebeck coefficient is again markedly different for the substituted samples, and S(T) exhibits a much flatter response compared to that of CuFeS2. A low electrical resistivity combined with a relatively high and flat S(T), leads to a high power-factor (PF) in the Ge-substituted phases, which increases with temperature, contrary to the PF(T) dependence of CuFeS2 (Fig. 5c). The maximum power factor, PF = 0.6 mW m−1 K−2, achieved for CuFe0.94Ge0.06S2 at 723 K, represents an almost three-fold improvement over that of unsubstituted CuFeS2.
Hall-effect measurements at room temperature (Fig. 6a), reveal that the charge-carrier concentration (n) increases with increasing Ge concentration, from n = 1.4(2) × 1019 cm−3 for unsubstituted CuFeS2 to a maximum n = 4.7(3) × 1019 cm−3 for CuFe0.94Ge0.06S2. However, the maximum value of n is lower than that expected on formal electron counting grounds (ca. 8 × 1020 cm−3 for x = 0.06). While substitution of Ge4+ for Fe3+ results in electron donation, Ge2+ identified by XPS, is expected to act as an electron acceptor. The intensity ratio I(Ge4+)/I(Ge2+) ≈ 2.5 observed in the XPS data, indicates that Ge4+ is the majority species. Therefore, germanium substitution is expected to produce an increase in the effective carrier concentration, albeit one that is reduced from the values expected on the basis of electron counting.
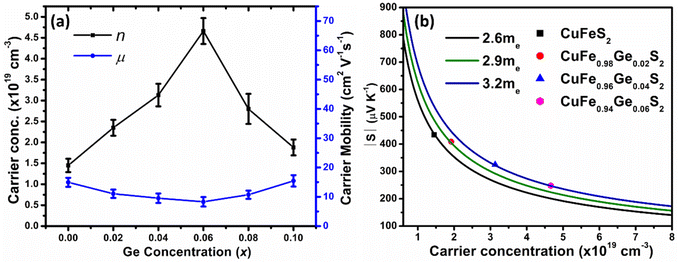 | ||
| Fig. 6 (a) Carrier concentration (n) and mobility (μ) of CuFe1−xGexS2 (0.0 ≤ x ≤ 0.10) samples. (b) Pisarenko plot showing |S| vs. n for CuFe1−xGexS2 (0.0 ≤ x ≤ 0.06) samples. | ||
With further increases in the Ge content (x > 0.06), the carrier concentration decreases, consistent with the slight increase in the electrical resistivity and Seebeck coefficient for the compositions with x ≥ 0.08. The origin of the decrease in charge-carrier concentration at high levels of substitution may be associated with the formation of secondary phase(s), as observed by SEM (but not by powder X-ray diffraction), that would result in a slight change to the Cu![[thin space (1/6-em)]](https://www.rsc.org/images/entities/char_2009.gif) :
:![[thin space (1/6-em)]](https://www.rsc.org/images/entities/char_2009.gif) Fe ratio in the primary chalcopyrite-type phase. Although the charge-carrier mobility decreases with substitution, the change is less marked compared to that in the carrier concentration. Pisarenko plots (Fig. 6b) derived from the Hall measurement data reveal an increase in the density-of-states (DOS) effective mass, from
Fe ratio in the primary chalcopyrite-type phase. Although the charge-carrier mobility decreases with substitution, the change is less marked compared to that in the carrier concentration. Pisarenko plots (Fig. 6b) derived from the Hall measurement data reveal an increase in the density-of-states (DOS) effective mass, from  for the CuFeS2 to
  for CuFe1−xGexS2 (0.02 ≤ x ≤ 0.06). The increase in
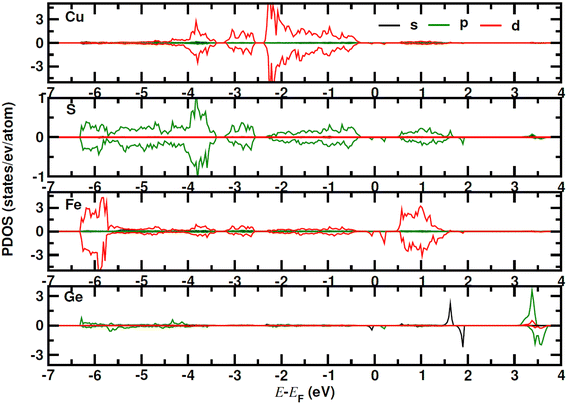
  can be understood from the atom projected density of states (PDOS) for the Ge-substituted CuFeS2 system (Fig. 7). Localized germanium electronic states near the Fermi level (EF), indicate weak chemical bonding with the sulphur atoms. The hybridization of germanium 4p states with sulphur 3p states also induces localized iron and copper electronic states. These are associated with those neighbouring MS4 (M = Fe, Cu) tetrahedra that are connected to the germanium-centered tetrahedra through a common sulphur vertex. The sharp localized states increase the band degeneracy and the DOS near the Fermi level, and are responsible for the high
  which contributes to the maintenance of a relatively high Seebeck coefficient.
Unsubstituted CuFeS2 exhibits a high thermal conductivity (Fig. 8a) due to a large lattice component (κL) (Fig. 8b), arising from a high mean sound velocity (Table 1). The lattice component, κL, decreases by more than 50% on Ge substitution (for x ≥ 0.06) with a correspondingly marked reduction in the mean sound velocities. The derived Debye temperature and elastic moduli also decrease considerably with Ge substitution, indicative of significant lattice softening.
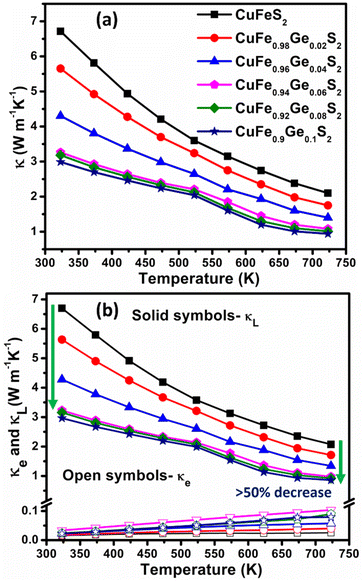 | ||
| Fig. 8 Temperature dependence of (a) total (κ), (b) electronic (κe) and lattice (κL) thermal conductivities of CuFe1−xGexS2 (0.0 ≤ x ≤ 0.10). | ||
| Sample | v l [m s−1] | v t [m s−1] | v avg [m s−1] | v m [m s−1] | E [GPa] | G [GPa] | θ D [K] |
|---|---|---|---|---|---|---|---|
| x = 0 | 4720 | 2536 | 3264 | 2831 | 69.9 | 26.94 | 319 |
| x = 0.02 | 4178 | 2270 | 2906 | 2532 | 55.59 | 21.54 | 286 |
| x = 0.06 | 3690 | 2135 | 2653 | 2370 | 47.46 | 19.00 | 267 |
| x = 0.1 | 3470 | 2122 | 2571 | 2342 | 44.36 | 18.46 | 264 |
Previously,31 it has been shown that scattering of acoustic phonons with mean free paths between 50 and 500 nm, can reduce the lattice thermal conductivity of chalcopyrite-type phases significantly. High-resolution transmission electron microscopy (HRTEM) (x = 0.06 and 0.1) and TEM (x = 0.1) along the [110] zone axis show twinning features and dislocations in the Ge-substituted phases at length scales in the range of 5–20 nm. The density of twins/dislocations become more prominent with an increase in the Ge content (Fig. 9a and c). However, these line defects would scatter acoustic phonons with only a small range of mean free-paths. While this may contribute to the reduction in the lattice thermal conductivity, the scattering is insufficient to account for the observed substantial reduction in κL.
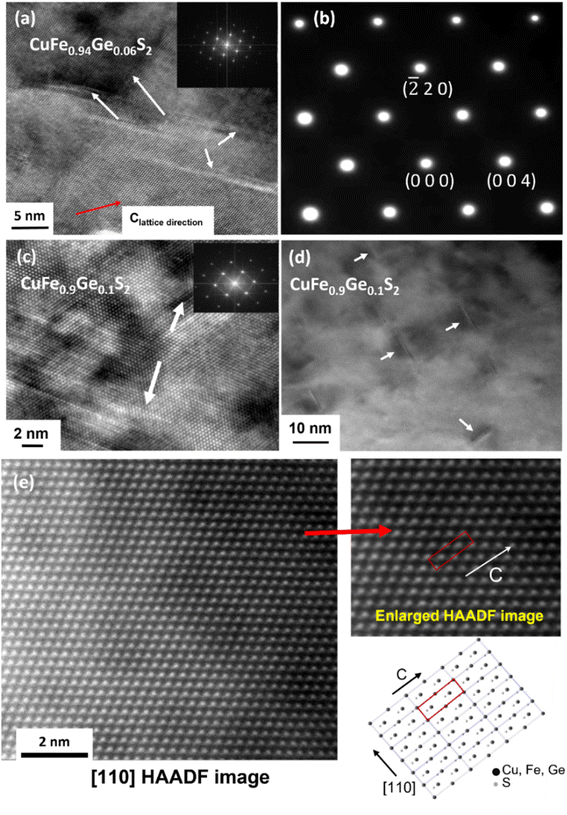 | ||
| Fig. 9 (a) High-resolution transmission electron microscopy (HRTEM) image and (b) selected area electron diffraction pattern (SAED) along the [110] zone axis for CuFe0.94Ge0.06S2. (c) HRTEM and (d) TEM images along [110] zone axis for CuFe0.9Ge0.1S2 (e) HAADF-STEM image along the [110] axis. Enlarged colour HAADF image showing the distribution of cations is given in the ESI.† | ||
The selected area electron diffraction (SAED) pattern along the [110] zone axis for the composition x = 0.06 (Fig. 9b) shows no additional diffraction spots corresponding to lower-symmetry superstructures and/or other phases, apart from the tetragonal chalcopyrite structure, which is consistent with powder X-ray diffraction and SEM data. Furthermore, to investigate if the origin of the reduction in lattice thermal conductivity is associated with atomic scale defects in the substituted phases, atomic resolution scanning transmission electron microscopy (STEM) was performed for CuFe0.94Ge0.06S2. The high-angle annular dark field (HAADF)-STEM image (Fig. 9e) at high magnification reveals no short/long range atomic disorder or vacancies and shows a uniform and homogenous atomic ordering in the substituted materials. The absence of any secondary phases and of atomic defects/vacancies, combined with the limited range of mean-free-paths of acoustic phonons scattered by twins/dislocations, suggests that microstructural features are not the primary origin of the reduced lattice thermal conductivity.
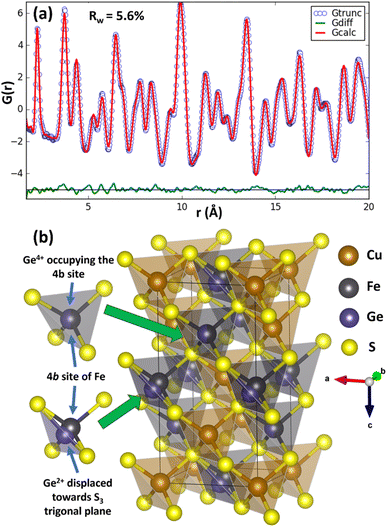
To investigate the origin of the reduction in thermal conductivity further, pair distribution function (PDF) analysis of synchrotron X-ray total scattering data was performed for CuFe1−xGexS2 (0.02 ≤ x ≤ 0.1) to explore changes in the local bonding and coordination. The initial structural model in which Cu, Fe/Ge and S occupy the 4a, 4b, and 8d sites respectively, with site occupancy factors corresponding to the nominal stoichiometry, was obtained from Rietveld refinement using synchrotron X-ray powder diffraction data. This was imported to PDFgui to model the experimental PDF. A systematic refinement of the lattice parameters, atomic positions, thermal displacement parameters and occupancies was performed in PDFgui over the range 0 < r < 20 Å. At this stage, the long-range average structure provided a reasonably good fit (Rw = 9.8–11.2%) to the PDF at longer interatomic distances (r) but produced relatively poor agreement between the calculated and observed PDF at lower r (<3 Å), indicating the presence of short-range deviations from the long-range average structure. In an effort to improve the fit at low r, the symmetry constraints on the Wyckoff sites were relaxed and atomic positions for each cation and anion refined sequentially, unconstrained by symmetry. The coordinates for Cu, Fe and S remained unchanged, thereby maintaining the overall crystal symmetry and long-range order of these cations. However, the model that produced the best fit (Rw = 5.6–6.1%) of the PDF for all substituted phases corresponds to a structure in which two out of the four germanium positions originally at the 4b site in the unit cell are displaced from the centre of the GeS4 tetrahedron towards one of the triangular (S3) faces of the tetrahedron. The resulting experimental and calculated PDFs for CuFe0.94Ge0.06S2 are presented in Fig. 10, with the profiles for the other compositions provided as ESI, (Fig. S6†). The remaining two Ge positions remain in the expected tetrahedral geometry at locations corresponding to a sub-set of those associated with what was originally the single 4b Wyckoff site. The germanium cations remaining in tetrahedral coordination can be associated with the Ge4+ ions identified by XPS. The closed-shell 3d10 electron configuration of this cation supports a stable tetrahedral coordination by sulphur atoms. The off-centered Ge cations can be identified as the Ge2+ species. These exhibit a near trigonal pyramidal coordination with three sulphur atoms (Fig. 10), instead of the expected tetrahedral coordination. The splitting of these two Ge2+ cations out of the four formerly crystallographically equivalent sites, maximises the distance between Ge2+ which aids in maintaining the local charge balance. Moreover, the level of Ge substitution is too low to induce long-range order, and the average structure is therefore not affected by the local distortion. A similar mixed coordination environment of germanium with sulphur has been observed in TlGeS2,50 which contains formally Ge4+ in tetrahedral coordination (GeS4) and Ge2+ in a distorted trigonal pyramidal coordination (GeS3). Similarly, in germanium(II) sulfide, GeS, Ge2+ adopts a trigonal pyramidal coordination,51,52 providing further evidence for the impact of the stereochemically active 4s2 lone pair of Ge2+. The local structural distortion due to the displaced Ge2+ cations may be quantified through the evaluation of bond length (γx) and angle (γθ) distortion parameters for the GeS4 tetrahedra (calculation details in ESI†). In the case of the near-ideal FeS4 and Ge4+S4 tetrahedra located at the 4b site, γx (4.12 × 10⁻⁴) and γθ (3.1 × 10⁻⁴) for the (Fe, Ge)–S bonds are quite low, consistent with a near-tetrahedral coordination. However, for Ge–S bonds associated with the displaced Ge2+ cations, γx and γθ increase to 1.33 × 10⁻² and 8.61 × 10⁻³, respectively, indicating significant displacement of the Ge2+ cations from the centre of the GeS4 tetrahedron.
The lattice thermal conductivity of Ge-substituted phases, κL, was modelled according to the Debye Callaway model:53,54
 | (1) |
 | (2) |
| Sample | L [μm] | A [× 1043 s−3] | B [× 1043 s−3] | Γ [× 10−3] | Γ M [× 10−3] | Γ S [× 10−3] | ε |
|---|---|---|---|---|---|---|---|
| x = 0 | 12.1 | 2 | 6 | — | — | — | — |
| x = 0.02 | 5.9 | 7.26 | 6.2 | 8.11 | 0.66 | 7.45 | 88 |
| x = 0.06 | 3.8 | 75.33 | 5.7 | 69.11 | 1.89 | 67.22 | 267 |
| x = 0.1 | 19.6 | 97.47 | 6 | 85.99 | 3.02 | 82.97 | 200 |
The point defect scattering parameter (A) increases significantly with Ge concentration, primarily due to a marked increase in the strain-field fluctuation (ΓS). There is a 9-fold increase in ΓS between compositions with x = 0.02 and x = 0.06, which suggests a high strain induced by the Ge substituent. This may reflect the local structural distortion associated with the 4s2 lone pair of Ge2+. The values of ΓS determined in the present study are found to be higher than values reported for other substituted chalcopyrites containing non-lone-pair cations.20,25,31 This suggests the presence of a cation with a stereochemically-active lone pair creates a high degree of strain, through a local structural distortion. The distortion enhances point defect scattering and lattice softening, as evidenced by the reduction in the elastic moduli, Debye temperature and sound velocities (Table 1).
Phonon calculations for the parent phase, CuFeS2, (Fig. S7†) demonstrate that the majority of the heat-carrying acoustic modes lie below 4 THz while the low-frequency optical phonon modes are in the range 4–6 THz. In CuFe0.94Ge0.06S2, the weak local chemical bonding of germanium with sulphur, leads to sharp resonant phonon states around 3–3.2 THz (Fig. 11). These localized vibrational modes are close in energy to both the acoustic and low-energy optical modes, and may contribute to enhanced phonon scattering. In addition, the lattice softening induced by Ge substitution propagates to the Cu–S and Fe–S bonds in the neighbouring MS4 (M = Cu, Fe) tetrahedra, leading to changes in the detail of the phonon DOS compared to that of CuFeS2.
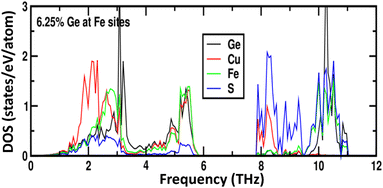 | ||
| Fig. 11 The phonon density of states as a function of phonon frequency for 6.25 at% Ge-substituted CuFeS2. | ||
Calculation of the phonon group velocities of the two longitudinal (LA, LA′) and one transverse optical (TO) acoustic modes (Table S5†) shows a reduction in the average group velocity along the Γ − X, Γ − Z and Γ − N directions in CuFe0.94Ge0.06S2, compared to the pristine CuFeS2, by ca. 2–6%. A similar combination of a local structural distortion and a reduction in the phonon group velocities has been observed for indium substitution in CuFeS2.29,30 The distortion has been attributed to a stereochemically-active 5s2 lone pair of electrons associated with In+. Together with the results presented here, this suggests that the introduction of a p-block cation with a stereochemically-active lone pair of electrons, at one of the cation sites in CuFeS2, offers an effective method for reducing the lattice thermal conductivity compared to what is achievable using transition-metal substituents.
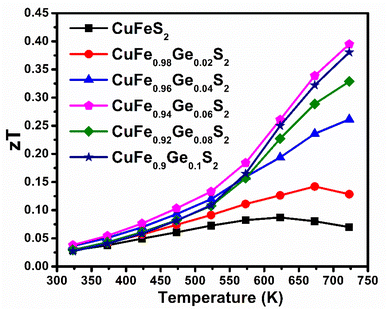
The maximum figure-of-merit (zT) of CuFe1−xGexS2 (0.0 ≤ x ≤ 0.10) increases from zT = 0.07 (at 723 K) for the pristine CuFeS2 to a zT = 0.4 at 723 K for CuFe0.94Ge0.06S2 (Fig. 12). This represents an almost six-fold improvement. Furthermore, the maximum value of zT attained in this work, is higher than the values reported for many of the substituted CuFeS2 compositions,20,25–27,29–31,57–59 and is one of the highest achieved in substituted chalcopyrite; thus, making Ge substitution a promising approach to fabricating high-performing n-type CuFeS2 materials for thermoelectric applications.
4. Conclusions
Pair-distribution function analysis (PDF) reveals that substitution of iron in chalcopyrite by germanium leads to a local structural distortion associated with the presence of Ge2+ that is identified by XPS. The stereochemically-active 4s2 lone-pair of Ge2+ favours adoption of a trigonal pyramidal coordination which induces movement of the germanium cation from the centre of the tetrahedron towards one of the triangular faces. This contributes to the increase in the calculated strain-fluctuation scattering parameter (ΓS), which leads to a reduction in lattice thermal conductivity. In addition, calculations indicate Ge substitution introduces localized vibrational modes, which may also increase phonon scattering through interaction with energetically similar acoustic and low-energy optic modes.Substitution also produces a significant reduction in electrical resistivity as a result of an increased carrier concentration, although the increase is less than expected on the basis of electron counting. This can be attributed to the mixed Ge2+/Ge4+ oxidation states indicated by XPS. However, the localized electronic states near the Fermi level arising from Ge, lead to a high density-of-states effective mass. This enables a relatively high Seebeck coefficient to be maintained, even at increased carrier concentrations, contributing to a high power factor of ca. 0.6 mW m−1 K−2 at 723 K in CuFe0.94Ge0.06S2.
In conjunction with the marked reductions in thermal conductivity, the figure-of-merit of all Ge-substituted materials is increased over that of the end-member phase, with a maximum zT = 0.4 being attained for CuFe0.94Ge0.06S2 at 723 K. These results demonstrate that substitution with a p-block cation, possessing a stereochemically-active lone pair of electrons can be an effective strategy to achieve high thermoelectric performance by effecting significant reductions in lattice thermal conductivity through local structural distortions.
Conflicts of interest
There are no conflicts to declare.Acknowledgements
This work was funded by UKRI Global Challenges Research Fund (GCRF) supported by EPSRC, UK (grant no: EP/T020040/1). We would like to acknowledge the Diamond Light Source, UK for provision of beam time on I15-1 beamline under proposal CY30162. We acknowledge access to SuperSTEM, the National research facility for advanced electron microscopy, funded by EPSRC (EP/W021080/1). We also thank the Chemical Analysis Facility (CAF) at the University of Reading, Reading, UK.References
- L. D. Zhao, H. J. Wu, S. Q. Hao, C. I. Wu, X. Y. Zhou, K. Biswas, J. Q. He, T. P. Hogan, C. Uher, C. Wolverton, V. P. Dravid and M. G. Kanatzidis, Energy Environ. Sci., 2013, 6, 3346–3355 RSC.
- Y. Wu, Z. Chen, P. Nan, F. Xiong, S. Lin, X. Zhang, Y. Chen, L. Chen, B. Ge and Y. Pei, Joule, 2019, 3, 1276–1288 CrossRef CAS.
- C. Chang, M. Wu, D. He, Y. Pei, C. F. Wu, X. Wu, H. Yu, F. Zhu, K. Wang, Y. Chen, L. Huang, J. F. Li, J. He and L. D. Zhao, Science, 2018, 360, 778–783 CrossRef CAS PubMed.
- B. Qin, D. Wang, W. He, Y. Zhang, H. Wu, S. J. Pennycook and L. D. Zhao, J. Am. Chem. Soc., 2019, 141, 1141–1149 CrossRef CAS PubMed.
- C. Zhang, M. de la Mata, Z. Li, F. J. Belarre, J. Arbiol, K. A. Khor, D. Poletti, B. Zhu, Q. Yan and Q. Xiong, Nano Energy, 2016, 30, 630–638 CrossRef CAS.
- W. H. Shin, J. W. Roh, B. Ryu, H. J. Chang, H. S. Kim, S. Lee, W. S. Seo and K. Ahn, ACS Appl. Mater. Interfaces, 2018, 10, 3689–3698 CrossRef CAS PubMed.
- A. V. Powell, J. Appl. Phys., 2019, 126, 100901 CrossRef.
- R. Freer, D. Ekren, T. Ghosh, K. Biswas, P. Qiu, S. Wan, L. D. Chen, S. Han, C. Fu, T.-J. Zhu, A. K. M. A. Shawon, A. Zevalkink, K. Imasato, G. J. Snyder, M. Ozen, K. Saglik, U. Aydemir, R. Cardoso-Gil, E. Svanidze, R. Funahashi, A. V. Powell, S. Mukherjee, S. Tippireddy, P. Vaqueiro, F. Gascoin, T. Kyratsi, S. Philipp and T. Mori, JPhys Energy, 2022, 4, 022002 CrossRef.
- L. Paradis-Fortin, G. Guélou, V. Pavan Kumar, P. Lemoine, C. Prestipino, O. Merdrignac-Conanec, G. R. Durand, S. Cordier, O. I. Lebedev and E. Guilmeau, J. Alloys Compd., 2020, 831, 154767 CrossRef CAS.
- K. Suekuni, F. S. Kim, H. Nishiate, M. Ohta, H. I. Tanaka and T. Takabatake, Appl. Phys. Lett., 2014, 105, 132107 CrossRef.
- C. Candolfi, G. Guélou, C. Bourgès, A. R. Supka, R. A. R. Al Orabi, M. Fornari, B. Malaman, G. Le Caër, P. Lemoine, V. Hardy, J.-M. Zanotti, R. Chetty, M. Ohta, K. Suekuni and E. Guilmeau, Phys. Rev. Mater., 2020, 4, 025404 CrossRef CAS.
- Y. Bouyrie, M. Ohta, K. Suekuni, Y. Kikuchi, P. Jood, A. Yamamoto and T. Takabatake, J. Mater. Chem. C, 2017, 5, 4174–4184 RSC.
- S. O. J. Long, A. V. Powell, P. Vaqueiro and S. Hull, Chem. Mater., 2018, 30, 456–464 CrossRef CAS.
- K. Chen, C. Di Paola, B. Du, R. Zhang, S. Laricchia, N. Bonini, C. Weber, I. Abrahams, H. Yan and M. Reece, J. Mater. Chem. C, 2018, 6, 8546–8552 RSC.
- X. Lu, D. T. Morelli, Y. Xia and V. Ozolins, Chem. Mater., 2015, 27, 408–413 CrossRef CAS.
- S. Tippireddy, R. Chetty, M. H. Naik, M. Jain, K. Chattopadhyay and R. C. Mallik, J. Phys. Chem. C, 2018, 122, 8735–8749 CrossRef CAS.
- S. He, Y. Luo, L. Xu, Y. Wang, Z. Han, X. Li and J. Cui, Inorg. Chem., 2021, 60, 11120–11128 CrossRef CAS PubMed.
- J. Corps, P. Vaqueiro, A. Aziz, R. Grau-Crespo, W. Kockelmann, J. C. Jumas and A. V. Powell, Chem. Mater., 2015, 27, 3946–3956 CrossRef CAS.
- C. Bourgès, T. Barbier, G. Guélou, P. Vaqueiro, A. V. Powell, O. I. Lebedev, N. Barrier, Y. Kinemuchi and E. Guilmeau, J. Eur. Ceram. Soc., 2016, 36, 1183–1189 CrossRef.
- B. Ge, J. Hu, Z. Shi, H. Wang, H. Xia and G. Qiao, Nanoscale, 2019, 11, 17340–17349 RSC.
- B. Du, R. Zhang, K. Chen, A. Mahajan and M. J. Reece, J. Mater. Chem. A, 2017, 5, 3249–3259 RSC.
- C. Bourgès, P. Lemoine, O. I. Lebedev, R. Daou, V. Hardy, B. Malaman and E. Guilmeau, Acta Mater., 2015, 97, 180–190 CrossRef.
- S. Mukherjee, A. V. Powell, D. J. Voneshen and P. Vaqueiro, J. Solid State Chem., 2022, 314, 123425 CrossRef CAS.
- S. R. Hall and J. M. Stewart, Acta Crystallogr., Sect. B: Struct. Crystallogr. Cryst. Chem., 1973, 29, 579–585 CrossRef CAS.
- H. Xie, X. Su, G. Zheng, T. Zhu, K. Yin, Y. Yan, C. Uher, M. G. Kanatzidis and X. Tang, Adv. Energy Mater., 2017, 7, 1601299 CrossRef.
- R. Lefèvre, D. Berthebaud, M. Y. Mychinko, O. I. Lebedev, T. Mori, F. Gascoin and A. Maignan, RSC Adv., 2016, 6, 55117–55124 RSC.
- J. Navratil, J. Kašparová, T. Plecháček, L. Beneš, Z. Olmrová-Zmrhalová, V. Kucek and Č. Drašar, J. Electron. Mater., 2019, 48, 1795–1804 CrossRef CAS.
- B. Ge, Z. Shi, C. Zhou, J. Hu, G. Liu, H. Xia, J. Xu and G. Qiao, J. Alloys Compd., 2019, 809, 151717 CrossRef CAS.
- H. Xie, X. Su, S. Hao, C. Zhang, Z. Zhang, W. Liu, Y. Yan, C. Wolverton, X. Tang and M. G. Kanatzidis, J. Am. Chem. Soc., 2019, 141, 18900–18909 CrossRef CAS PubMed.
- B. Ge, H. Lee, C. Zhou, W. Lu, J. Hu, J. Yang, S.-P. Cho, G. Qiao, Z. Shi and I. Chung, Nano Energy, 2022, 94, 106941 CrossRef CAS.
- S. Tippireddy, F. Azough, Vikram, F. T. Tompkins, A. Bhui, R. Freer, R. Grau-Crespo, K. Biswas, P. Vaqueiro and A. V. Powell, Chem. Mater., 2022, 34, 5860–5873 CrossRef CAS PubMed.
- J. Rodríguez-Carvajal, in Abstracts of the Satellite Meeting on Powder Diffraction of the XV Congress of the IUCr, Toulouse, France, 1990, p. 127 Search PubMed.
- A. K. Soper and E. R. Barney, J. Appl. Crystallogr., 2011, 44, 714–726 CrossRef CAS.
- C. L. Farrow, P. Juhas, J. W. Liu, D. Bryndin, E. S. Boin, J. Bloch, T. Proffen and S. J. L. Billinge, J. Phys.: Condens. Matter, 2007, 19, 335219 CrossRef CAS PubMed.
- N. Fairley, V. Fernandez, M. Richard-Plouet, C. Guillot-Deudon, J. Walton, E. Smith, D. Flahaut, M. Greiner, M. Biesinger, S. Tougaard, D. Morgan and J. Baltrusaitis, Appl. Surf. Sci. Adv., 2021, 5, 100112 CrossRef.
- G. Kresse and J. Furthmüller, Comput. Mater. Sci., 1996, 6, 15–50 CrossRef CAS.
- G. Kresse and J. Furthmüller, Phys. Rev. B: Condens. Matter Mater. Phys., 1996, 54, 11169–11186 CrossRef CAS PubMed.
- G. Kresse and J. Hafner, Phys. Rev. B: Condens. Matter Mater. Phys., 1993, 47, 558 CrossRef CAS PubMed.
- P. E. Blöchl, Phys. Rev. B: Condens. Matter Mater. Phys., 1994, 50, 17953 CrossRef PubMed.
- J. P. Perdew, K. Burke and M. Ernzerhof, Phys. Rev. Lett., 1996, 77, 3865–3868 CrossRef CAS PubMed.
- S. L. Dudarev, G. A. Botton, S. Y. Savrasov, C. J. Humphreys and A. P. Sutton, Phys. Rev. B: Condens. Matter Mater. Phys., 1998, 57, 1505 CrossRef CAS.
- S. Grimme, J. Antony, S. Ehrlich and H. Krieg, J. Chem. Phys., 2010, 132, 154104 CrossRef PubMed.
- P. E. Blöchl, O. Jepsen and O. K. Andersen, Phys. Rev. B: Condens. Matter Mater. Phys., 1994, 49, 16223 CrossRef PubMed.
- X. Gonze, Phys. Rev. A: At., Mol., Opt. Phys., 1995, 52, 1086–1095 CrossRef PubMed.
- X. Gonze, Phys. Rev. A: At., Mol., Opt. Phys., 1995, 52, 1096–1114 CrossRef CAS PubMed.
- A. Togo and I. Tanaka, Scr. Mater., 2015, 108, 1–5 CrossRef CAS.
- R. D. Shannon, Acta Crystallogr., Sect. A: Cryst. Phys., Diffr., Theor. Gen. Crystallogr., 1976, 32, 751–767 CrossRef.
- I. Nakai, Y. Sugitani, K. Nagashima and Y. Niwa, J. Inorg. Nucl. Chem., 1978, 40, 789–791 CrossRef CAS.
- A. Ghahremaninezhad, D. G. Dixon and E. Asselin, Electrochim. Acta, 2013, 87, 97–112 CrossRef CAS.
- G. Eulenberger, J. Less-Common Met., 1985, 108, 65–72 CrossRef CAS.
- W. H. Zachariasen, Phys. Rev., 1932, 40, 917–922 CrossRef CAS.
- V. G. Bissert and K.-F. Hesse, Acta Crystallogr., Sect. B: Struct. Crystallogr. Cryst. Chem., 1978, 34, 1322–1323 CrossRef.
- J. Callaway, Phys. Rev., 1959, 113, 1046–1051 CrossRef CAS.
- J. Callaway and H. C. von Bayer, Phys. Rev., 1960, 120, 1149–1154 CrossRef CAS.
- G. A. Slack, Phys. Rev., 1957, 105, 829 CrossRef CAS.
- B. Abeles, Phys. Rev., 1963, 131, 1906–1911 CrossRef.
- H. Xie, X. Su, G. Zheng, Y. Yan, W. Liu, H. Tang, M. G. Kanatzidis, C. Uher and X. Tang, J. Phys. Chem. C, 2016, 120, 27895–27902 CrossRef CAS.
- W. D. Carr and D. T. Morelli, J. Electron. Mater., 2016, 45, 1346–1350 CrossRef CAS.
- J. Li, Q. Tan and J. F. Li, J. Alloys Compd., 2013, 551, 143–149 CrossRef CAS.
Footnotes |
| † Electronic supplementary information (ESI) available. See DOI: https://doi.org/10.1039/d2ta06443j |
| ‡ Present address: Department of Materials, University of Oxford, Parks Road, Oxford OX1 3PH, UK. |
| This journal is © The Royal Society of Chemistry 2022 |

