DOI:
10.1039/D2TA05021H
(Paper)
J. Mater. Chem. A, 2022,
10, 23222-23231
Design of densified nickel-rich layered composite cathode via the dry-film process for sulfide-based solid-state batteries†
Received
24th June 2022
, Accepted 27th September 2022
First published on 28th September 2022
Abstract
Solid-state batteries (SSBs) based on sulfide solid electrolytes are expected to replace flammable liquid electrolytes in conventional lithium-ion batteries, potentially improving safety and energy density. However, widespread research on SSBs is hampered by several challenges, such as improving the interparticle connection and standardizing electrode formats to enhance the utilization of active materials throughout the composite cathode process. This study investigated the relationship between the microstructures of different electrode compositions and the electrochemical performance of densified composite cathodes prepared via a solvent-free dry-film process. Composite cathodes consisting of LiNi0.8Co0.15Al0.05O2 (NCA), Li6PS5Cl (LPSCl), Super-C65, and polytetrafluoroethylene (PTFE) particles were fabricated with respect to the content of NCA (75–85 wt%), and its microstructure, cycle performance, and charge transport kinetics were analysed using electrochemical impedance spectroscopy (EIS) and DC polarization measurements. The balance of ionic and electronic conductivity of the composite cathode with 80 wt% NCA significantly increased the capacity retention and rate capability. EIS measurements on cycled SSBs indicated that a balanced charge transport lowered the complex resistance in the composite cathode. Our findings imply that establishing a balanced conduction path in the composite cathode is the most important design/manufacturing criteria for high-performance SSB electrodes.
Introduction
Solid-state batteries (SSBs) based on solid electrolytes have emerged as a promising alternative for an energy storage device for electric vehicles and have thermal stability superior to that of lithium-ion batteries (LIBs) that use a flammable liquid electrolyte (LE).1–4 Since lithium (Li) metal or micro-Si has been used as counter electrodes for SSBs, and bipolar stacking of SSB electrodes can reduce the packaging materials of batteries, SSBs can potentially achieve high energy density.5–10 Furthermore, recently discovered sulfide solid electrolytes (SSEs) such as Li10GeP2S12, argyrodite types Li6PS5Cl, and Li5.5PS4.5Cl have ionic conductivities of ∼10−2 S cm−1,11–13 which is comparable to carbonate-based LE (∼10−2 S cm−1)11,14 and suggests a high potential in lithium ion (Li+) charge transport kinetics related to power density.
Despite their excellent properties, composite cathodes in SSBs encounter various obstacles to guarantee ionic and electronic conductivity. In general, nickel-rich layered composite cathodes for SSBs were fabricated using the same method as the LIB cathodes through a slurry process; however, unlike LE that penetrated the cathodes, the composite cathodes for SSBs were configured to include SSEs as a component of the electrode. These SSEs were generally required in significant amounts within the composite cathodes for proper Li+ diffusion (SSEs 20% of the weight fraction), decreasing the energy density.15–17 However, composite cathodes suffer from sluggish charge transport kinetics owing to agglomeration of SSEs in the microstructure, resulting in poor contact between particles with the formation of pore volume and/or particle isolation.18–20 Although numerous studies have identified the issue mentioned above, few have examined the relationship between the improvement in connectivity of particles through densification and the electrochemical characteristics of composite cathodes for SSBs.21–23
Recently, in constructing a composite cathode, the ‘dry-film process’ that uses a polytetrafluoroethylene (PTFE) binder without solvent has been acknowledged as a viable alternative to the slurry process for better particle contact while maintaining a dense microstructure throughout the electro-chemical performance.8,24–28 Due to the problem that the polar solvent accelerates the chemical instability of SSE, a non-polar or less-polar solvent was applied in a slurry process, and the selection of a binder suitable for the solvent ensured the mechanical properties of an electrode were limited.29–31 Specifically, nitrile-butadiene rubber (NBR), which is appropriate for use in a non-polar solvent, has a weak adhesive force between solid components and acts as an insulator in the electrode, capacity fading during the electrochemical reaction is easily accelerated due to poor contact and induces overpotential.32–36 Unlike the NBR binder solution, which is dissolved in a solvent to generate ‘area-contact’ between particles like glue, PTFE can maximize a specified contact area even with a tiny amount by producing ‘line-contact’ through fibrillation with shear force. Consequently, it was discovered that the percolated conduction network in the microstructure can produce dense and thick electrodes using the dry-film technique without being disturbed by fibrous PTFE due to web adhesion among solid components. Herein, we investigated the effect of modifying the content between Ni-rich cathode active material and argyrodite solid electrolyte in the densified composite cathode on the electrochemical properties of SSBs. Through a dry-film process using 1 wt% PTFE powder, we modified the polycrystalline LiNi0.8Co0.15Al0.05O2 (NCA) and Li6PS5Cl (LPSCl) to a weight ratio of 75![[thin space (1/6-em)]](https://www.rsc.org/images/entities/char_2009.gif) :23 to 85:13 with an additional 1 wt% Super-C65 to fabricate composite cathodes. Regardless of the electrode composition, the composite cathodes were fabricated to have a dense microstructure with the same quantity of pore volume (average porosity of ∼15%) to eliminate the capacity fading effect caused by loose contact of particles. On a densified composite cathode, electrochemical impedance spectroscopy (EIS) and DC polarization measurements were performed to confirm the charge transport properties of the NCA content. The adjusted composition of the electrode, in which the charge transport pathways of Li+ and electron (e−) were well-formed, and the electrochemical performance indicated an improvement in initial capacity, rate capability, and capacity retention for 50 cycles. Furthermore, we demonstrated the way to correlate the charge transport pathway with improved electrochemical performance using additional EIS measurements on SSBs.
:23 to 85:13 with an additional 1 wt% Super-C65 to fabricate composite cathodes. Regardless of the electrode composition, the composite cathodes were fabricated to have a dense microstructure with the same quantity of pore volume (average porosity of ∼15%) to eliminate the capacity fading effect caused by loose contact of particles. On a densified composite cathode, electrochemical impedance spectroscopy (EIS) and DC polarization measurements were performed to confirm the charge transport properties of the NCA content. The adjusted composition of the electrode, in which the charge transport pathways of Li+ and electron (e−) were well-formed, and the electrochemical performance indicated an improvement in initial capacity, rate capability, and capacity retention for 50 cycles. Furthermore, we demonstrated the way to correlate the charge transport pathway with improved electrochemical performance using additional EIS measurements on SSBs.
Experimental section
Preparation of the composite cathode
NCA powder was supplied by Samsung SDI Co. Ltd and LPSCl, with an average particle size of 0.93 μm (from Field emission scanning electron microscopy (FESEM) observation and calculation using IC Measure software, Ver. 2.0.0.245, The Imaging Source, Co., Ltd) was purchased from JEONG KWAN Co., Ltd, South Korea. All fabrication steps for the composite cathodes were carried out in an Ar-filled glovebox (O2 and H2O < 1 ppm). Composite mixtures were prepared by mixing NCA, LPSCl, and Super-C65 (powder density: 1.60 g cm−3, TIMICAL Ltd, Switzerland) in different weight ratios of NCA from 75 wt% to 85 wt% (fixed contents of Super-C65 as 1 wt%) using a roller mixer with ZrO2 balls for 30 min at 50 rpm. To fabricate the composite cathode through a dry-film process, the mixtures were then transferred to a mortar by adding 1 wt% of PTFE powder (powder density: 2.17 g cm−3, average Mw 10000, Daikin Industries Co. Ltd). The clay of the composite cathode was obtained after 5 min of mixing and shearing for PTFE fibrillation. For target thickness, the clay was pressed with an Al current collector or only clay with a pressing machine (PHE 150, Master Co., Ltd, South Korea). The NCA loading level was 15 mg cm−2.
Cell assembly and electrochemical testing
SSB cells were assembled using a pressing cell (inner diameter, 10 mm; pressing cell, Premium Glass Co., Ltd, Japan) in a dry room (temperature: 23 °C; dew point: ∼−70 °C). The LPSCl powder was pressed into the pressing cell at 375 MPa to be used as a separator (thickness, 800 μm). The composite cathodes were pressed at 375 MPa on one side of the LPSCl separator, and the other side was pressed at 300 MPa with indium (thickness, 100 μm; diameter, 10 mm) and lithium foil (thickness, 200 μm; diameter, 4 mm) as an anode with Cu foils. Electrochemical charge–discharge experiments (TOSCAT-3100, Toyo system) were performed with the voltage range of 1.9–3.7 V vs. In/InLi at 25 °C, applying an 11 N m torque force during the electrochemical reaction. To stabilize the composite cathodes during the electrochemical test, the formation step was performed at a current rate (C-rate) of 0.05C for two cycles with constant current-constant voltage (CC-CV) mode with CC charging at 3.7 V vs. In/InLi, followed by CV charging with a cut-off condition of 0.01C. After the formation step, three different types of electrochemical tests were performed in the following manners: (i) charge–discharge experiments at a 0.1 C-rate without CC-CV charging for 50 cycles; (ii) charge–discharge rate capability tests at a 0.1, 0.5, and 1 C-rate for three cycles; (iii) charge–discharge experiments of CC-CV mode at a 0.5 C-rate with CC charging at 3.7 V vs. In/InLi, followed by CV charging with a cut-off condition of 0.05C.
Charge transport characteristic measurements
SSBs cells were investigated to determine the complex charge transport characteristics of as-prepared and after-cycled composite cathodes using EIS measurements (SP-300, Biologic). All EIS measurements were performed in a frequency range of 3 MHz to 20 mHz, with an AC amplitude of 5 mV at room temperature. The free-standing electrodes were prepared for the as-prepared composite electrode for a cathode. Then ion-blocking [stainless steel (SS)‖composite electrode‖SS] and electron-blocking [Li foil‖LPSCl‖composite electrode‖LPSCl‖Li foil] as shown in Fig. S7† using the same composite electrode in each cell. Two types of cells were analysed by additional DC polarization measurements by applying a constant bias from ±5 mV to ±50 mV for ion-blocking cells and a constant current of 200 μA for electron-blocking cells. For after-cycled composite cathodes, the EIS measurements of electrochemical testing cells with (iii) CC-CV mode were collected at the end of the CC and CV charged state at the 1st, 3rd, and 5th cycle, respectively.
Characterization
The particle morphology and cross-sectional surface of the composite cathodes were observed by FESEM with EDS (energy dispersive spectrometer) elemental mapping (S-4700, HITACHI, Japan). The cross-sectional surfaces of the electrodes were prepared using a cross-section polisher (CP, IB-19530CP, JEOL) for 6 h at 5.5 kV with an Ar ion beam. The electric conductivity of NCA powder was measured using the direct volt-ampere method (Powder resistivity measurements, MCP-PD51, MITSUBISHI ELECTRIC Co., Ltd), pressing the powder with a plate of the four-point probe. The X-ray diffraction measurements of the samples were performed using a Bruker D8 ADVANCE diffractometer using Cu Kα radiation (λ = 1.5406 Å). As sulfide solid electrolyte has low air stability, samples containing argyrodite powder were sealed in a polyethylene pouch to protect the samples from exposure to the atmosphere during XRD measurements.
Results and discussion
Densified composite cathodes via dry-film processes
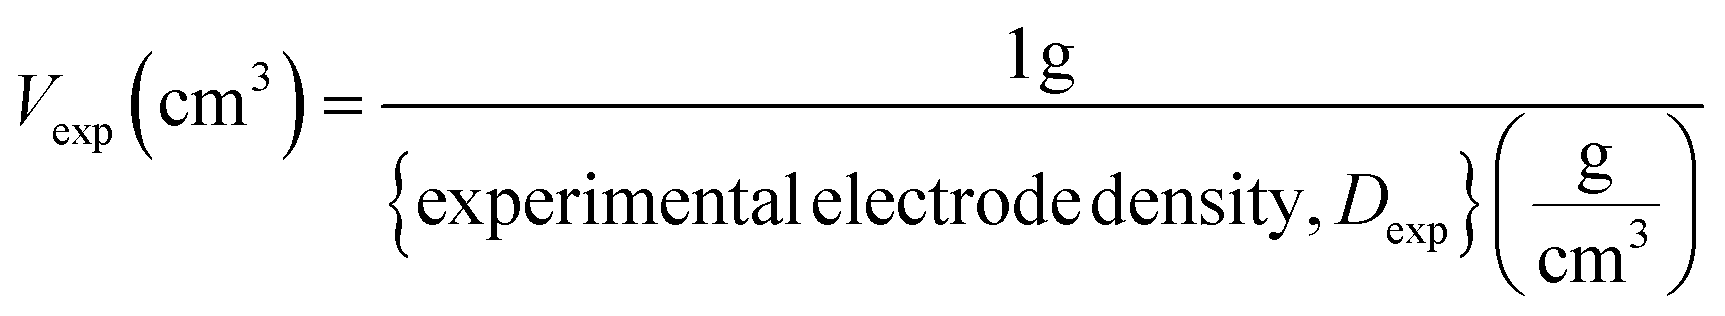
To implement a uniformly dispersed electrode, a densified composite cathode for SSBs was fabricated using dry-film techniques. Fig. 1a–c shows schematics of dry-film processes and a produced composite cathode comprising NCA and LPSCl (Fig. S1 and S2†) as well as a conducting agent (Super-C65) and PTFE powders. To further understand the relationship between NCA and LPSCl content in composite cathodes, Super-C65 and PTFE were set at 1 wt%, and NCA content of 75, 77, 80, 83, and 85 wt% with a decrease in LPSCl were chosen for the composition fractions (refer to Table 1). As a preliminary stage in the fabrication of a dry film, three solid powders, except the binder, were mixed uniformly with zirconia balls using a roll mixer under the conditions above (Fig. 1a). As shown in Fig. 1b, the remaining PTFE powders were added to the mixture to make electrode clay via fibrillation of PTFE by shear force at 80 °C.24 The resulting clay was spread on the glass plate to form free-standing electrodes. Free-standing electrodes were cast on Al foil and densified by roll pressing at 80 °C (Fig. 1c). Through a series of processes, it was verified by a cross-sectional SEM image of NCA 80 wt% cathode that 1 wt% of PTFE added to the composite cathode was uniformly distributed between the particles and Al foil in an electrode, and the PTFE maintained the adhesion force among all components (Fig. S3†). As the NCA content increased in the electrode, the electrode density (Dexp) after roll pressing was increased from 2.78 g cm−3 to 3.19 g cm−3 (Fig. 1d). Despite the differences in electrode density, we used a dry-film method to ensure that all electrodes have the same porosity, resulting in an electrochemical performance that was solely influenced by the fraction of NCA and LPSCl. The porosity of the composite cathode is 15% on average, decreasing from 15.95% to 13.44% as the NCA content increases, as shown in the porosity plot as a function of electrode density (Fig. 1e). This plot was functionalized using the volume of a composite cathode (Vexp), calculated from Dexp, and the theoretical volume (Vtheo), with the standard density of components as the reference value of the density (Table S1†).37,38 The volume of 1 g of the composite cathode (Vexp and Vtheo) and porosity (φ) was expressed as follows:| |  | (1) |
| |  | (2) |
| |  | (3) |
where the ‘Σj’ indicates the total summation of each electrode component (NCA, LPSCl, Super-C65, and PTFE). In contrast, when the composite mixture was fabricated to a pellet-type electrode (composite pellet) through a uniaxial pressing method under sufficient uniaxial pressure without PTFE,23 it showed relatively low electrode density and high porosity. For simplification, a composite pellet was fabricated by applying a uniaxial press of 1500 MPa to a composite mixture in which only NCA and LPSCl were uniformly mixed (Fig. S4 and Table S2–S3†). Similar to the tendency of composite cathodes, when the NCA content increased from 75 wt% to 85 wt% in composite pellets, Dexp was risen from 2.57 g cm−3 to 3.03 g cm−3, with 22% of average porosity accompanied by a relatively high deviation. It was confirmed that the dry-film process could improve the densification of the composite cathode more efficiently. When a volume fraction of NCA:LPSCl in composite cathode through dry film process was reviewed by removing a volume fraction of porosity {V‘Σj’ (%) = Vexp × (1 − φ)}, the volume fraction of NCA:LPSCl account for 46.85:34.19 vol% to 60.92:22.17 vol% of the total volume in NCA 75 wt% to 85 wt% electrodes (see Table S1†).
 |
| | Fig. 1 Schematic representation of the dry-film process for SSBs composite cathode with three steps: (a) mixing procedure of components, (b) fibrillation procedure for the formation of clay electrodes, and (c) densification procedure for the composite cathode with resulting clay. (d) Experimental electrode density (Dexp) of the composite cathode with respect to the content of NCA. (e) Porosity plot of composite cathodes with respect to the total summation of the standard density of each component as a reference value of the theoretical density (see Table S1†).37,38 | |
Table 1 Modified content of the NCA composite cathode with experimental electrode density (Dexp) and loading level of NCA
| Entry |
Modified contents |
NCA:Li6PS5Cl (wt%) |
Super C65:PTFE (wt%) |
D
exp (g cm−3) |
Loading level of NCA (mg cm−2) |
| 1 |
NCA 75 wt% |
75:23 |
1:1 |
2.78 ± 0.03 |
∼15 |
| 2 |
NCA 77 wt% |
77:21 |
1:1 |
2.87 ± 0.04 |
∼15 |
| 3 |
NCA 80 wt% |
80:18 |
1:1 |
2.98 ± 0.04 |
∼15 |
| 4 |
NCA 83 wt% |
83:15 |
1:1 |
3.11 ± 0.04 |
∼15 |
| 5 |
NCA 85 wt% |
85:13 |
1:1 |
3.19 ± 0.06 |
∼15 |
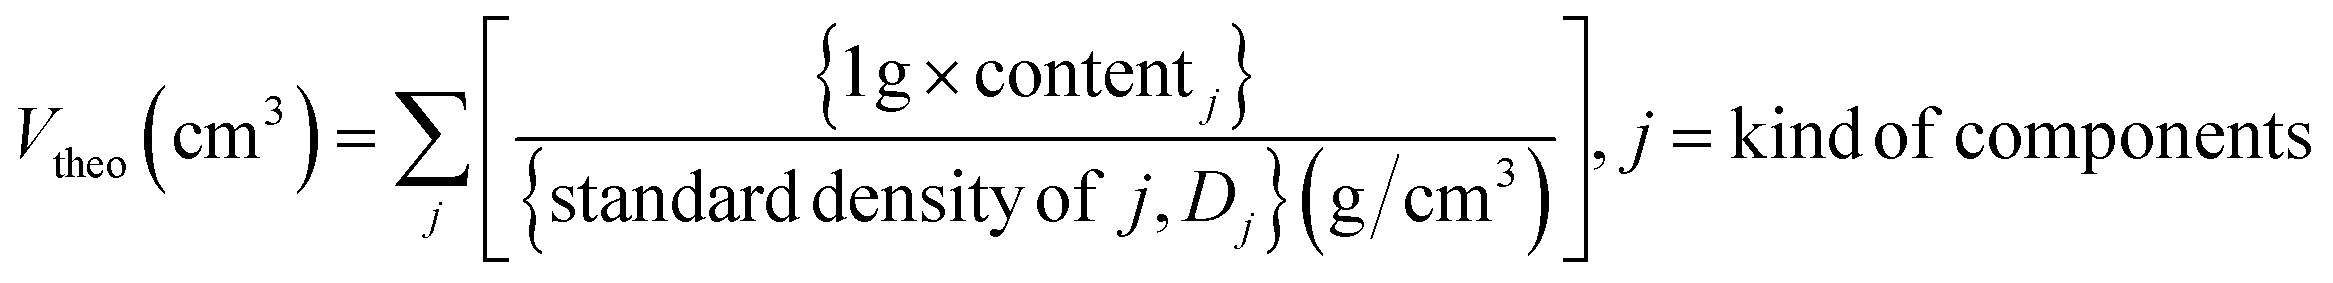
Fig. 2 shows cross-sectional SEM images of composite cathodes with different content of NCA 75, 80, and 85 wt%. The dispersion uniformity of NCA and LPSCl in the microstructure for each composition was confirmed by mapping the corresponding EDS element (Fig. S5†) at the same position as in Fig. 2a, c, and e. Although each electrode had a comparable porosity (15%), it was observed that small primary NCA particles with a size of 1–3 μm and LPSCl were locally agglomerated in the interparticle spaces between NCA secondary particles with a size of 10–15 μm. Therefore, as shown in Fig. 2c and d, the composite cathode with 80 wt% of NCA played a role in smoothly connecting the electronic and ionic conduction pathways in the microstructure by expanding the NCA–NCA contact area and reducing the isolation of NCA from agglomerated LPSCl particles compared to the NCA 75 wt% cathode, which dominantly secured the ionic conduction pathway (Fig. 2a and b). In contrast, it appears that the electron conduction path of the NCA 85 wt% cathode is ensured better than 80 wt% of NCA due to the primary particles of NCA being disposed of in the pores. Accordingly, the contact area of NCA secondary particles/LPSCl is reduced, and thus the ion conduction path might be lost, thus degrading the electrochemical performance (Fig. 2e and f).
 |
| | Fig. 2 Cross-sectional SEM images of the composite cathode consisting of different content of NCA: (a) and (b) NCA 75 wt%; (c) and (d) NCA 80 wt%; (e) and (f) NCA 85 wt%. | |
Electrochemical properties
We measured the electrochemical performance of densified composite cathodes with different NCA contents. Fig. 3, S6a, and S6b† show the charge–discharge voltage profiles of composite cathodes with 75–85 wt% of NCA in the voltage range of 1.9 V to 3.7 V vs. In/InLi during 50 cycles. For the electrochemical stabilization of the composite cathodes, the formation step was followed at 0.05C for two cycles, followed by three cycles at 0.1C. In the formation step, the initial discharge capacity increased to 179 mA h g−1 in NCA 77 wt% and 80 wt% (Fig. 3a and S6a†) and then slightly decreased to 175 mA h g−1 in NCA 85 wt% (Fig. 3c), accompanied by a similar trend of the 1st coulombic efficiency (Fig. S7†). Interestingly, at the 0.1 C-rate, the difference in discharge capacity was clearly observed for each NCA electrode. As shown in Fig. 3d, all electrodes exhibited a decrease in discharge capacity with an increase in cycle number. As the content of NCA increases in electrode, the initial discharge capacity was the highest at NCA 77 wt% with ∼160 mA h g−1, gradually decreased at NCA 80 wt% with ∼152 mA h g−1, and then the lowest at NCA 85 wt% with ∼128 mA h g−1. In addition, NCA 77 wt% showed the highest initial coulombic efficiency with the highest discharge capacity, but in the second cycle, the coulombic efficiency of all electrodes increased to 99–100%, maintaining a similar level for 50 cycles (Fig. S7†). Finally, when it reached to 50th cycle state, the capacity retention of NCA 80 wt% was ∼88.5%, and the result is superior to NCA 77 wt% of 84.7%, as shown in Fig. 3f. Furthermore, during the rate capability test (Fig. 3e and S8†), the NCA 80 wt% cathode exhibited the best performance at a high C-rate, which corresponded to 102 mA h g−1 at 0.5C and 54 mA h g−1 at 1C (NCA 77 wt%:94 mA h g−1 at 0.5C and 43 mA h g−1 at 1C). It was suggested that when the interparticle connectivity became similar as a result of the formation of a compact microstructure with few pores, an appropriate conduction network between Li+ and e− according to the content of NCA improved the electrochemical properties.
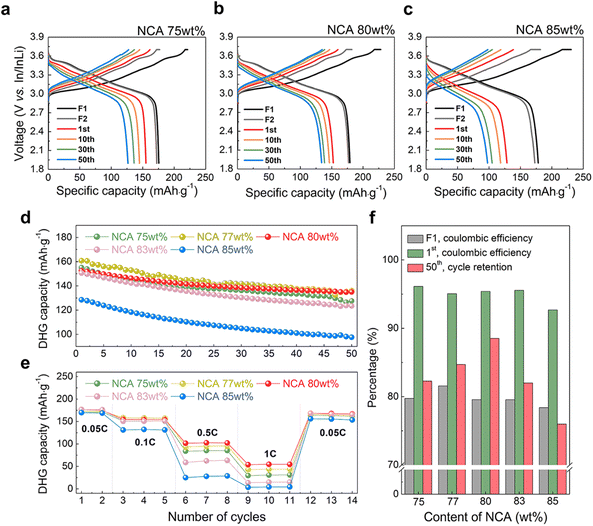 |
| | Fig. 3 Charge–discharge voltage profiles of SSBs composite cathodes with modified content of NCA (a) 75 wt%, (b) 80 wt%, and (c) 85 wt%. (d) Discharge capacity retention with modified content of NCA from 75 wt% to 85 wt%, measured in a voltage range of 1.9 V to 3.7 V vs. In/InLi at 0.1C for 50 cycles after formation at 0.05C for two cycles. (e) Rate capability at 0.05C to 1C for NCA from 75 wt% to 85 wt%. (f) Representation of the initial coulombic efficiency before (grey)/after (green) formation step and the discharge capacity retention efficiency of the 1st per 50th cycle (red) with respect to NCA content. | |
Effective electronic- and ionic-conductivity of composite cathodes
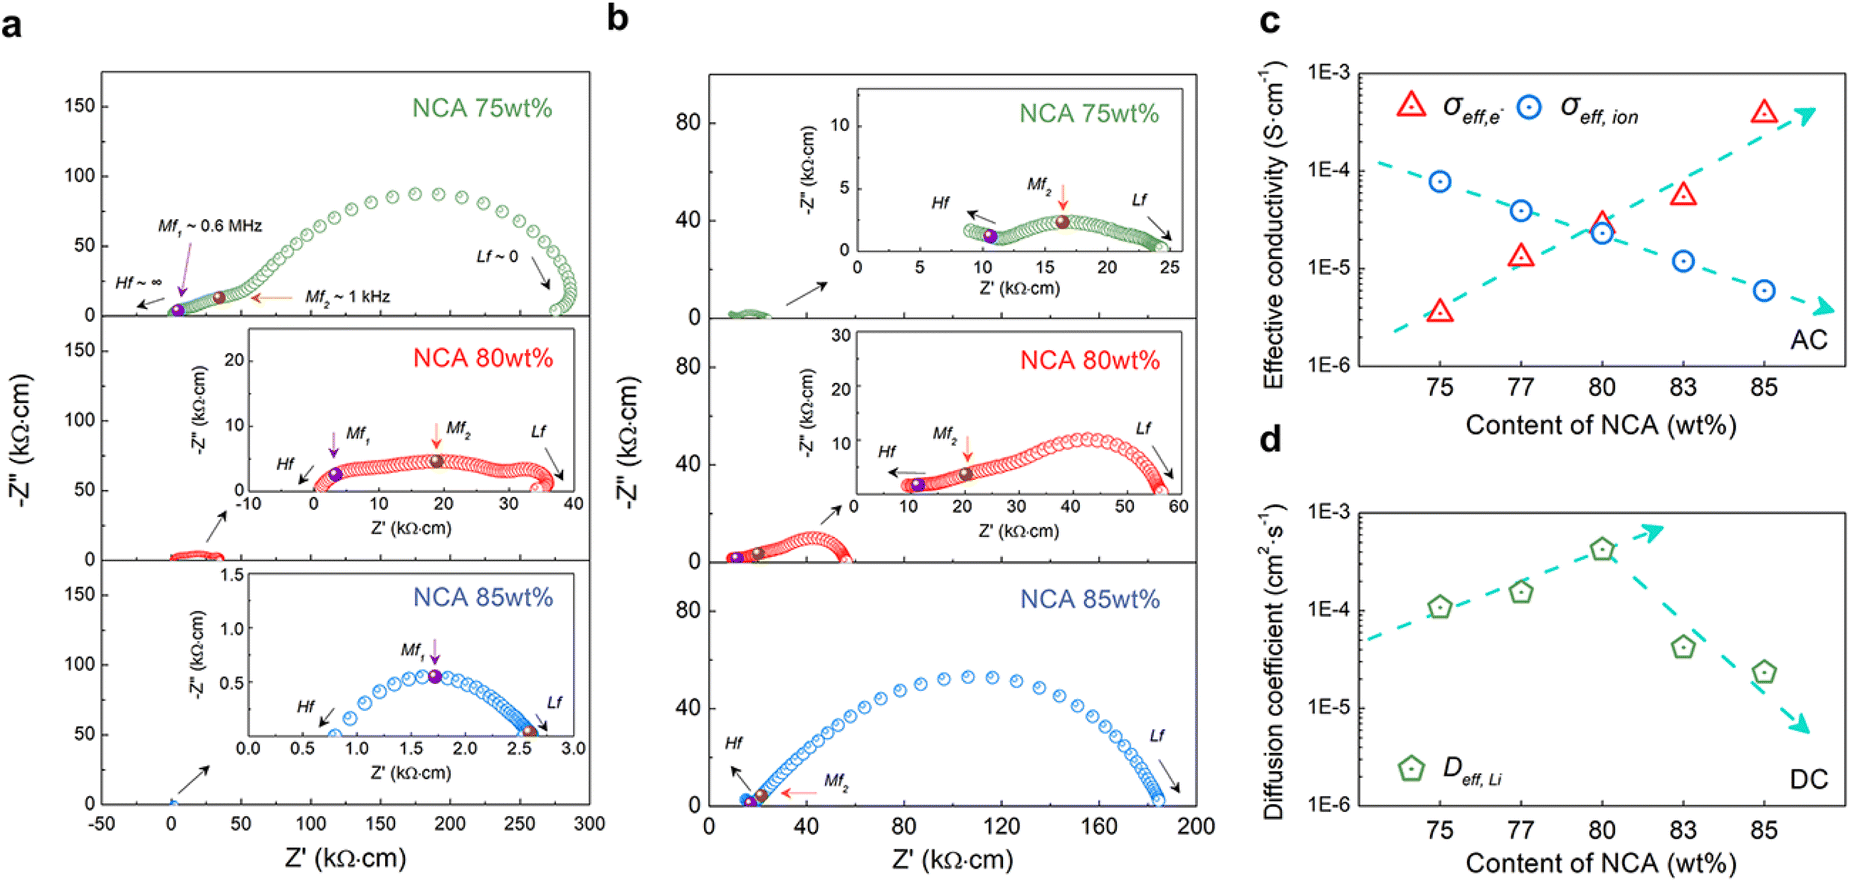
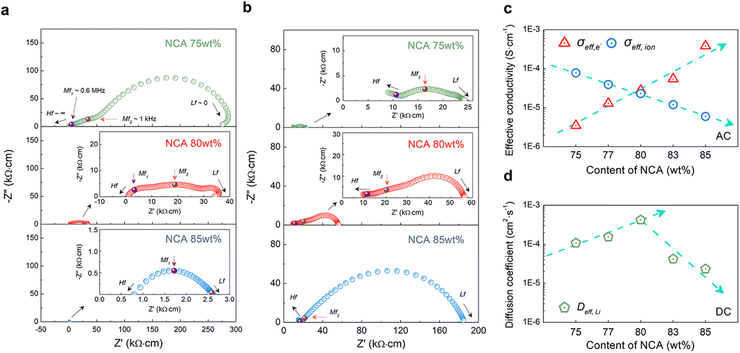
To investigate the ionic and electronic charge transport properties in composite cathodes with different compositions of NCA, symmetric cells with free-standing electrodes were prepared for EIS measurements. This free-standing electrode was fabricated to have the same Dexp as the Al cast electrode through the densification process without Al foil (Fig. 1c). Since the composite cathode in SSBs shows the characteristics of a mixed ionic-electronic conductor (MIEC),23,38,39 we constructed an e-blocking symmetric cell that blocks electron flow while allowing only ions to flow and an ion-blocking symmetric cell that allows only electrons to flow while blocking ion flow to avoid complex resistance that occurred by both charge carriers (Li+ and e−). The ion-blocking symmetric cell configuration is [SS‖composite electrode‖SS], and the electron-blocking symmetric cell configuration is [Li foil‖LPSCl‖composite electrode‖LPSCl‖Li foil], as shown in Fig. S9a and S9b.† Moreover, the resulting Nyquist plot represents ‘generalized finite-length Warburg impedance’.40–42 According to the frequency response of each blocking symmetric cell, the effective ionic and electronic conductivity of the composite electrode was estimated through the frequency dependence of the chemical polarization process. Specifically, when the injected frequency approaches the low frequency (Lf, f ∼ 0), the resulting steady state of each blocking symmetric cell in the Nyquist plot indicates the charge transport characteristics of only non-blocking charge carriers free from blocking layers.43
As shown in Fig. 4a and b, each type of symmetric cell exhibited depressed semicircles, and all results of the Nyquist plots shown in Fig. 4 were normalized with the dimension of the composite electrode. In the case of ion-blocking cells (Fig. 4a), approximately three depressed semicircles were observed at medium frequency (Mf1 and Mf2, f1 ∼ 0.6 MHz and f2 ∼ 1 kHz) and Lf (f ∼0). The size of all semicircles was observed to gradually decrease as the composition of NCA increased from 75 wt% to 85 wt% (Fig. 4a, S10a, and S10c†). Among them, the Mf2-semicircle was depressed compared to Mf1-, beginning at the NCA 83 wt% electrode (Fig. S10c†) and eventually disappearing when it reached NCA 85 wt%. In contrast, the Nyquist plots of e-blocking cells showed a gradual increase in the three depressed semicircles as NCA increased (Fig. 4b, S10b, and S10d†). However, the observed semicircles differ from those of the ion-blocking cell, including an additional high-frequency semicircle (Hf, f ∼ ∞), caused by the resistance of both sides of the LPSCl blocking layer (Fig. S8b†), and the disappearance of the Mf1-semicircle. The ideal blocking symmetric cell should only have Lf-semicircles with a half-tear drop shape composed of a semicircle (Warburg element) and no additional Mf-semicircles.41,44 Therefore, our previous study using composite electrodes consisting of single-crystalline NCA and LPSCl reported an additional definition of each semicircle of symmetric cells as (i) Lf-semicircles; by the chemical capacitance of local charge neutrality between Li+ and e−; (ii) Mf-semicircles; by electrostatic capacitance at interparticle-boundary and blocking layers interface with composite electrodes.23 In contrast to our previous study, it was confirmed that the Mf-semicircle was roughly divided into Mf1- and Mf2-. As the NCA content increased, the Mf1-semicircle was dominant in ion-blocking cells but not in e-blocking cells. Considering the addition of 1 wt% PTFE, Mf1- and Mf2-semicircles represent additional e− and Li+ blocking resistance through the interparticle-boundary or blocking layer interface with PTFE. These frequency-dependent interface resistances at Mf1-(MHz) were caused by a dielectric loss in a biphase mixture of two dielectrically different materials (NCA and PTFE), where NCA is an MIEC-type polycrystalline ceramic and PTFE is a non-polar semicrystalline polymer.45–47 In other words, Mf1- and Mf2-semicircles should partially reflect the electronic resistance at the interface with the NCA-PTFE composite/SS layer and the ionic resistance at the interface with the NCA-LPSCl composite/LPSCl layer, respectively.
 |
| | Fig. 4 Nyquist plots of (a) ion-blocking cells [SS‖composite cathode‖SS] and (b) electron-blocking cells [Li‖LPSC l‖composite cathode‖LPSC l‖Li] with 75 wt%, 80 wt%, and 85 wt% of NCA in composite cathodes. (c) Effective conductivity (σeff) and (d) diffusion coefficients (Deff,Li) results of the composite cathode extracted from EIS and DC polarization measurements as a function of NCA content from 75 wt% to 85 wt%. | |
Fig. 4c indicates the resulting effective electronic-conductivity (σeff,e) and ionic-conductivity (σeff,ion) of the composite electrode with different content of NCA, which overcome all resistance elements in the EIS measurements (at f ∼0). As NCA content increased, σeff,e increased from ∼3 × 10⁻⁶ S cm−1 to ∼4 × 10⁻⁴ S cm−1 and, conversely, σeff,ion decreased from ∼8 × 10⁻⁵ S cm−1 to ∼5 × 10⁻⁶ S cm−1. To verify the validity of the effective conductivity of the EIS measurements, DC polarization measurements were also performed with the same ion- and e-blocking cells (Fig. S11 and S12†). For σeff,e and σeff,ion, the effective electronic and ionic resistivity (ρeff,e and ρeff,ion) were calculated from Ohm's law (R = V/I) with the V–I curve of DC polarization and converted to effective conductivity (ρeff = 1/σeff). Overall, σeff indicated similar conductivity with EIS measurements. In the EIS and DC polarization results, when the content of NCA reached 80 wt% in the composite electrode, each value of σeff,ion and σeff,e were approached to ∼3 × 10⁻⁵ S cm−1 with a similar effective conductivity.
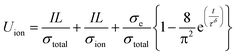
It was confirmed that the balanced effective conductivity of the NCA 80 wt% electrode correlates with the improved electrochemical performance of the cycle retention and rate capability test at a high C-rate (Fig. 3d–f). Furthermore, as mentioned above, it might be inferred that the balancing of effective conductivity representing the networks of SSEs and conducting agents on the NCA was well percolated in the microstructure (Fig. 2). Therefore, the charge carriers gradually diffuse from the interface of the NCA toward the inner core simultaneously, although PTFE blocked some percolation networks (Mf1-semicircle). To approach the relationship between effective conductivity and the diffusion process of charge carriers in composite electrodes, we also estimated the chemical diffusion coefficient (Deff,Li) from time-dependent DC polarization with an e-blocking symmetric cell (Fig. S12a–S12e†). Deff,Li was expressed as the following equations48–50
| |  | (4) |
where
I,
L,
t, and
Uion are the applied current, sample thickness, pulse time, and measured potential, respectively, and
τδ is the relaxation time to reach the constant potential value. The slope of the ln|
U(
t) −
U(
t = ∞, steady state)|
vs. t plot (inset of Fig. S12a–e
†) correlates
τδ ∝ 1/
Deff,Li and
Fig. 4d indicates
Deff,Li of the DC polarization measurements. Among the composite electrodes, 80 wt% of NCA, which balanced effective conductivity, showed the highest
Deff,Li as ∼4 × 10
−4 cm
2 s
−1. These findings show that when the percolation network is well distributed, the electrochemical performance improved through similarity between the effective conductivity within the electrode. However, considering only the maximization of the initial capacity without cycle retention, it is assumed that
σeff,ion plays a more dominant role between
σeff,ion and
σeff,e in improving the initial electrochemical performance. For example,
σeff,ion is dominant between the effective conductivity of the NCA 77 wt% electrode (
Fig. 4c), which showed that the initial discharge capacity was higher than that of the NCA 80 wt% (
Fig. 3d–f).
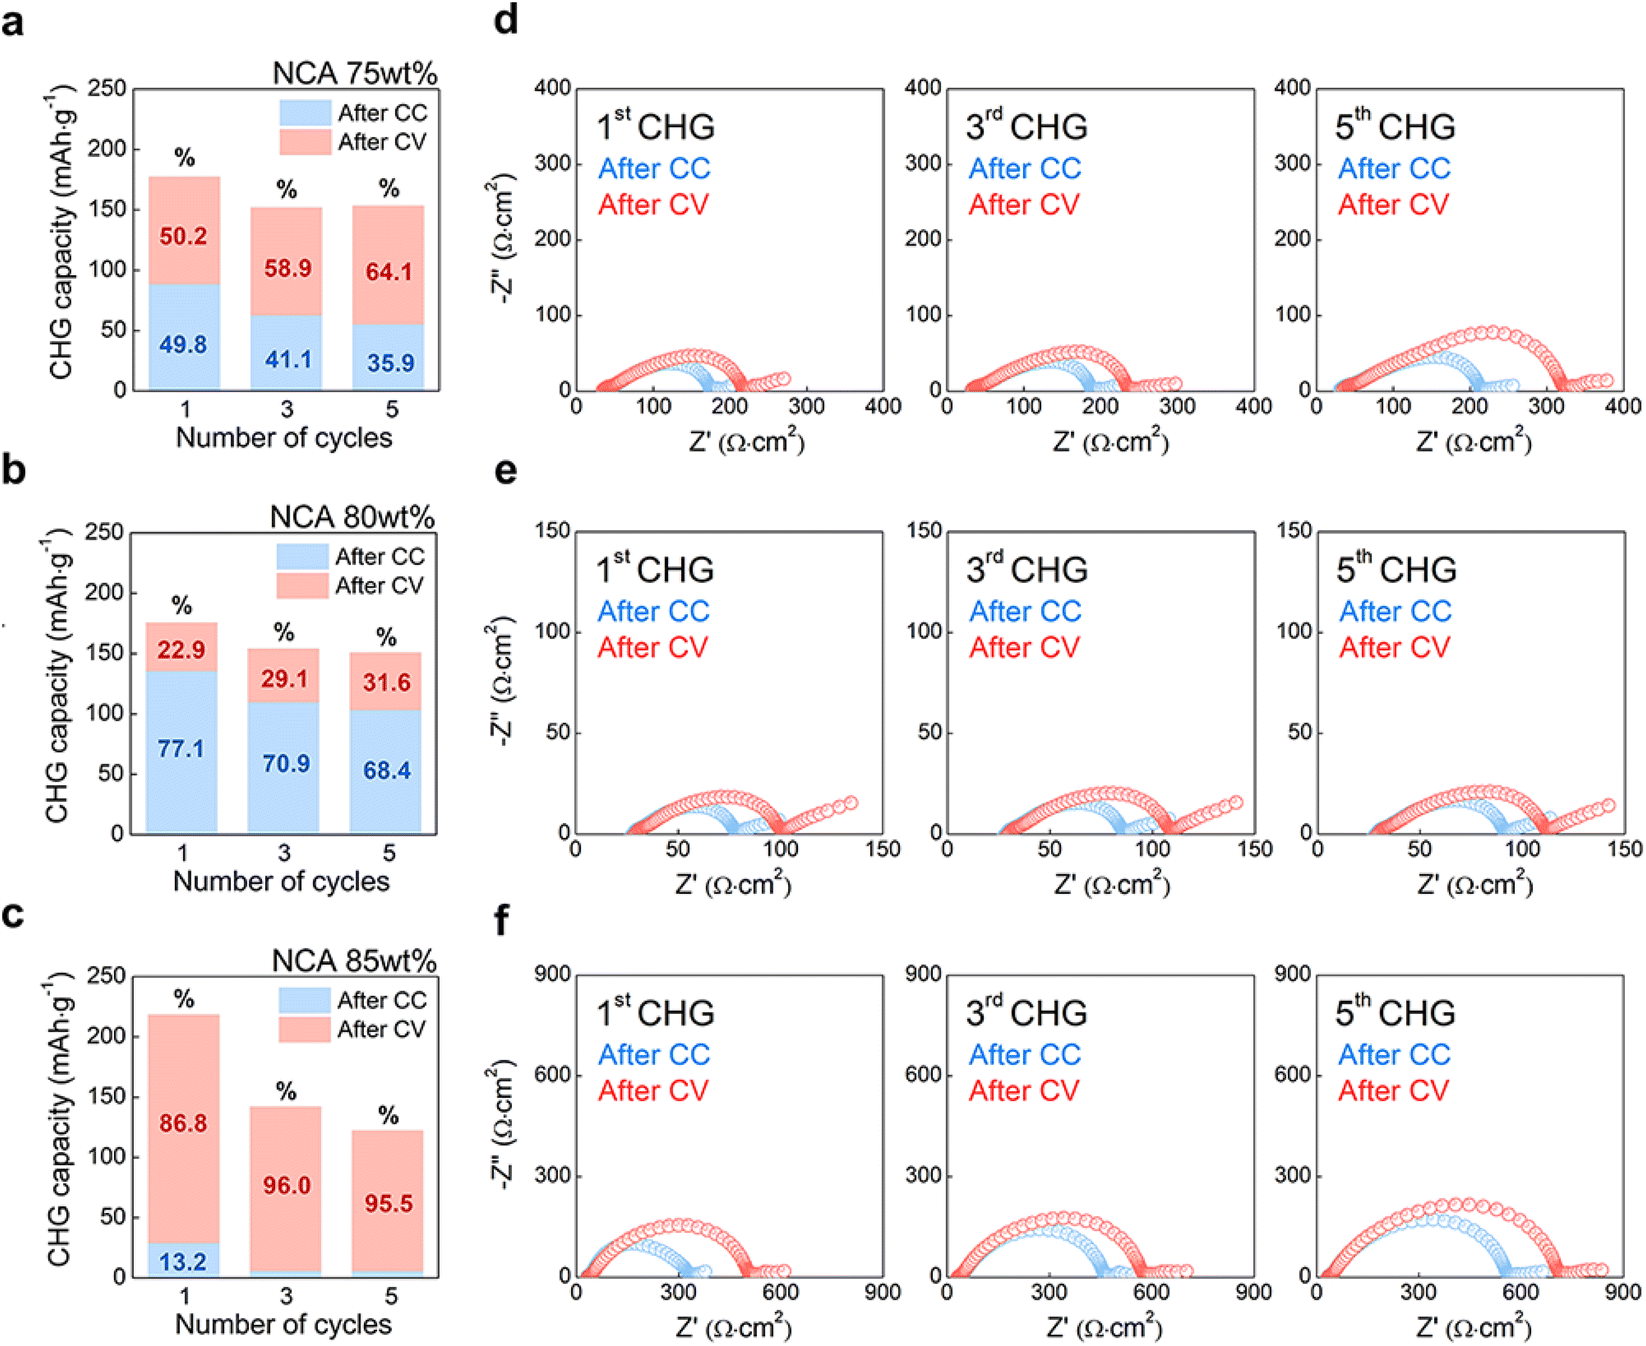
Balanced conductivity effects
To confirm the relationship between the effective conductivity and the electrochemical properties of the composite cathode with different contents of NCA, an additional half-cell EIS measurement was conducted following the cycling state of the electrode (Fig. 5). Cells containing 75, 80, and 85 wt% NCA cathodes were evaluated using charge–discharge experiments with the CC-CV mode in the same voltage range as other electrochemical tests (Fig. 3). After two cycles of formation steps, the CC-CV mode progressed at 0.5 C-rate with CC charging at 3.7 V vs. In/InLi followed by CV charging with a cut-off condition of 0.05C during five cycles (Fig. S13†). During charge–discharge, EIS measurements were then performed only during the charge state in which most of the changes in the shape of the Nyquist plots correspond to the composite cathodes because the resistance of the InLi anode in the SSB cell was lower than the discharge state.51–53 Therefore, EIS measurements were performed twice after CC (bluish open dots) and CV (reddish open dots) in the 1st, 3rd, and 5th charge states of cells (Fig. 5d–f). As shown in Fig. 5a–c, each charge capacity of the CC-CV results corresponds to the 1st, 3rd, and 5th charge states, which are represented as bar charts with the 1st charge capacity of CC and CV being 177.65 mA h g−1, 175.73 mA h g−1, and 218.65 mA h g−1, respectively. The 85 wt% of NCA exhibited the highest initial charge capacity; however, when separated into the CC and CV sections as percentages, the 1st charge capacity of the CC-CV results indicated 49.8–50.2%, 77.1–22.9%, and 13.2–86.8%, in the order of NCA content as 75, 80, and 85 wt%, respectively. In contrast to other NCA content, the NCA 80 wt% electrode with the highest CC capacity continuously showed a relatively high percentage of CC capacity of 68.4% even after the 5th charge state (Fig. 5b), accompanied by the highest discharge capacity with low overpotential at 0.5 C-rate (Fig. S13b and S13e†).
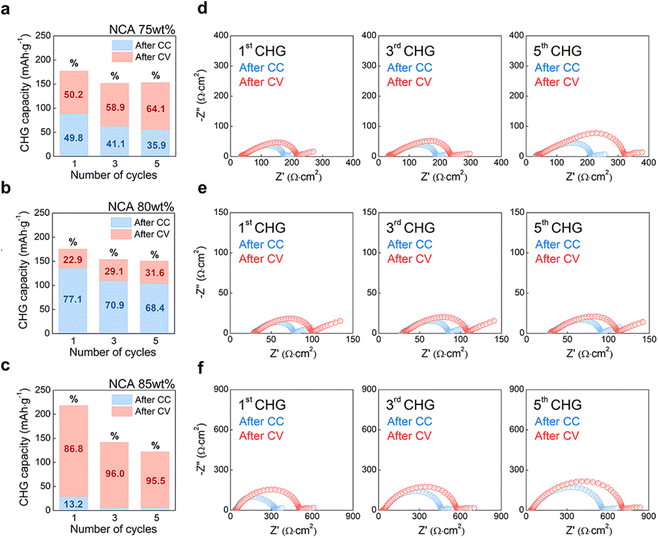 |
| | Fig. 5 Representation of the 1st, 3rd, and 5th CC-CV charge capacity of NCA (a) 75 wt%, (b) 80 wt% and (c) 85 wt% composite cathodes with CC charging (bluish bar chart) to 3.7 V vs. In/InLi at 0.5C followed by CV charging (reddish bar chart) with a cut-off condition of 0.05C. Nyquist plots of after the 1st, 3rd, and 5th CC (bluish open dots) and CV (reddish open dots) with respect to content of NCA (d) 75 wt%, (e) 80 wt%, and (f) 85 wt%. | |
Although the remaining two cathodes had a CV capacity higher than CC, the total capacity of the NCA 75 wt% cathode chased the NCA 80 wt% cathode until the 5th charge state as well as the 1st charge capacity. Interestingly, at the 5th charge state, the Nyquist plots of NCA 75 wt% cathode after CV had 2.7 times the resistance of NCA 80 wt% cathode (Fig. 5d and e). Furthermore, increasing the tendency of Nyquist plots in NCA 75 wt% cathode from ‘after CC’ to ‘after CV’ revealed a 1.3-time greater resistance. Recently, J. Kim et al. reported that loosely contacted and/or isolated particles in SSB composite cathodes caused current hot spots (overpotential in the voltage profile), resulting in inhomogeneous lithiation/delithiation among the particles using synchrotron-based in situ and ex situ X-ray analysis.53 Considering the similar porosity on each electrode, it was assumed that the overpotential of the CC voltage profile and high CV capacity at NCA 75 wt% (Fig. S13a†) were caused by the dominant connection of the ion conduction path due to the semi-isolation of NCA particles by LPSCl particles or fibrous PTFE (σeff,ion > σeff,e, Fig. 4c). Similarly, the NCA 85 wt% cathode, in which electron conduction pathways were dominantly formed due to the semi-isolation of LPSCl by the NCA-PTFE composite (σeff,ion < σeff,e, Fig. 4c), also had a significant increase in resistance as the cycle progressed (Fig. 5f and S13c†). However, the Nyquist plots of the NCA 85 wt% cathode after CV showed that it was six times larger than the NCA 80 wt% cathode (Fig. 5e) and 2.25 times larger than the NCA 75 wt% cathode (Fig. 5d). Consequently, the NCA 80 wt% cathode with a balanced conduction pathway (σeff,ion ≈ σeff,e, Fig. 4c) showed the smallest resistance change during the cycle at a rate of 0.5C. Furthermore, the results confirmed that the lack of an ionic conduction path is more detrimental to the electrochemical performance than the lack of an electronic path, as proven by an increase in the resistance of the cell complex as the NCA content increases.
Conclusion
Using EIS and DC polarization measurements, we investigated the relationship between capacity fading and the conduction pathway of charge carriers in the densified composite cathodes of SSBs. For the same densification, composite cathodes with different content of NCA (75 wt% to 85 wt%) were fabricated through a dry-film process (average porosity of 15%) to minimize loose particle contact, and the dense microstructure was observed using CP-SEM. Along with the increase in NCA content, LPSCl powder, which isolated NCA by occupying a large volume fraction in the electrode (34.19 vol% in NCA 75 wt% cathode, Table S1†), rapidly decreased in volume to 22.17 vol% as NCA reached 85 wt%, and conversely, NCA isolated the LPSCl powder. Among the content of NCA from 75 wt% to 85 wt% in the composite cathode, the NCA 80 wt% cathode resulted in improved capacity retention over 50 cycles and improved rate capability. Through EIS and DC polarization analysis, it was found that the electrochemical properties were enhanced because the NCA 80 wt% cathode was balanced with a similar value of ionic-effective- and electronic-effective-conductivity of the pristine electrodes (σeff,ion and σeff,e ∼3 × 10⁻⁵ S cm−1). Furthermore, the correlation between balanced conductivity and electrochemical properties in different content of NCA cathode was confirmed through half-cell EIS measurements, which showed increasingly complex resistance according to the cycled state. It was proven that the lack of an ionic conduction path had a more detrimental effect on the electrochemical properties than the electronic conduction path when the charge transport pathway was not balanced. Our findings emphasise the importance of a balanced conduction pathway in composite cathodes and their electrode design/manufacturing processes for high-performance SSBs.
Author contributions
D. S. and Y.-J. K. conceived the project. D. S., J. S. N., C. T. L. N., Y. J. and K. L. performed materials characterization and electrochemical measurements. J. S. N. and S. M. H. analysed the AC impedance and DC polarization data. D. S. and J. S. N wrote the original manuscript. Y.-J. K. supervised the project and edited the manuscript. All authors discussed the results and commented on the manuscript.
Conflicts of interest
There are no conflicts of interest to declare.
Acknowledgements
This research was supported by the Agency for Defense Development, Republic of Korea [UC190025RD].
References
- J. Janek and W. G. Zeier, Nat. Energy, 2016, 1, 16141–16144 Search PubMed.
- J. Duan, X. Tang, H. Dai, Y. Yang, W. Wu, X. Wei and Y. Huang, Electrochem. Energy Rev., 2019, 3, 1–42 Search PubMed.
- H. Lee, P. Oh, J. Kim, H. Cha, S. Chae, S. Lee and J. Cho, Adv. Mater., 2019, 31, 1900376 Search PubMed.
- F. Duffner, N. Kronemeyer, J. Tübke, J. Leker, M. Winter and R. Schmuch, Nat. Energy, 2021, 6, 123–134 Search PubMed.
- X. Yang, K. R. Adair, X. Gao and X. Sun, Energy Environ. Sci., 2021, 14, 643–671 Search PubMed.
- S. Randau, D. A. Weber, O. Kötz, R. Koerver, P. Braun, A. Weber, E. Ivers-Tiffée, T. Adermann, J. Kulisch, W. G. Zeier, F. H. Richter and J. Janek, Nat. Energy, 2020, 5, 259–270 Search PubMed.
- Y.-G. Lee, S. Fujiki, C. Jung, N. Suzuki, N. Yashiro, R. Omoda, D.-S. Ko, T. Shiratsuchi, T. Sugimoto, S. Ryu, J. H. Ku, T. Watanabe, Y. Park, Y. Aihara, D. Im and I. T. Han, Nat. Energy, 2020, 5, 299–308 Search PubMed.
- D. H. S. Tan, Y.-T. Chen, H. Yang, W. Bao, B. Sreenarayanan, J.-M. Doux, W. Li, B. Lu, S.-Y. Ham, B. Sayahpour, J. Scharf, E. A. Wu, G. Deysher, H. E. Han, H. J. Hah, H. Jeong, J. B. Lee, Z. Chen and Y. S. Meng, Science, 2021, 373, 1494–1499 Search PubMed.
- G. Homann, P. Meister, L. Stolz, J. P. Brinkmann, J. Kulisch, T. Adermann, M. Winter and J. Kasnatscheew, ACS Appl. Energy Mater., 2020, 3, 3162–3168 Search PubMed.
- D. Cao, X. Sun, Y. Wang and H. Zhu, Energy Storage Mater., 2022, 48, 458–465 Search PubMed.
- Y. Kato, S. Hori, T. Saito, K. Suzuki, M. Hirayama, A. Mitsui, M. Yonemura, H. Iba and R. Kanno, Nat. Energy, 2016, 1, 16030 Search PubMed.
- H. J. Deiseroth, S. T. Kong, H. Eckert, J. Vannahme, C. Reiner, T. Zaiss and M. Schlosser, Angew. Chem., Int. Ed. Engl., 2008, 47, 755–758 Search PubMed.
- P. Adeli, J. D. Bazak, K. H. Park, I. Kochetkov, A. Huq, G. R. Goward and L. F. Nazar, Angew. Chem., Int. Ed. Engl., 2019, 58, 8681–8686 Search PubMed.
- K. H. Park, Q. Bai, D. H. Kim, D. Y. Oh, Y. Zhu, Y. Mo and Y. S. Jung, Adv. Energy Mater., 2018, 8, 1800035 Search PubMed.
- T. Shi, Q. Tu, Y. Tian, Y. Xiao, L. J. Miara, O. Kononova and G. Ceder, Adv. Energy Mater., 2019, 10, 1902881 Search PubMed.
- J. H. Teo, F. Strauss, Đ. Tripković, S. Schweidler, Y. Ma, M. Bianchini, J. Janek and T. Brezesinski, Cell Rep. Phys. Sci., 2021, 2, 100465 Search PubMed.
- W. Jiang, X. Zhu, R. Huang, S. Zhao, X. Fan, M. Ling, C. Liang and L. Wang, Adv. Energy Mater., 2022, 12, 2103473 Search PubMed.
- A. Bielefeld, D. A. Weber and J. Janek, J. Phys. Chem. C, 2018, 123, 1626–1634 Search PubMed.
- S. Yamakawa, S. Ohta and T. Kobayashi, Solid State Ionics, 2020, 344, 115079 Search PubMed.
- J. Park, K. T. Kim, D. Y. Oh, D. Jin, D. Kim, Y. S. Jung and Y. M. Lee, Adv. Energy Mater., 2020, 10, 2001563 Search PubMed.
- J.-M. Doux, Y. Yang, D. H. S. Tan, H. Nguyen, E. A. Wu, X. Wang, A. Banerjee and Y. S. Meng, J. Mater. Chem. A, 2020, 8, 5049–5055 Search PubMed.
- C. Doerrer, I. Capone, S. Narayanan, J. Liu, C. R. M. Grovenor, M. Pasta and P. S. Grant, ACS Appl. Mater. Interfaces, 2021, 13, 37809–37815 Search PubMed.
- J. S. Nam, W. To A. Ran, S. H. Lee, T. H. L. Vuong, H. Jo, J.-H. Lee, S. M. Hwang and Y.-J. Kim, Energy Storage Mater., 2022, 46, 155–164 Search PubMed.
- F. Hippauf, B. Schumm, S. Doerfler, H. Althues, S. Fujiki, T. Shiratsuchi, T. Tsujimura, Y. Aihara and S. Kaskel, Energy Storage Mater., 2019, 21, 390–398 Search PubMed.
- Y. Lu, C.-Z. Zhao, H. Yuan, J.-K. Hu, J.-Q. Huang and Q. Zhang, Matters, 2022, 5, 876–898 Search PubMed.
- S.-B. Hong, Y.-J. Lee, U.-H. Kim, C. Bak, Y. M. Lee, W. Cho, H. J. Hah, Y.-K. Sun and D.-W. Kim, ACS Energy Lett., 2022, 7, 1092–1100 Search PubMed.
- J.-K. Hu, H. Yuan, S.-J. Yang, S. Sun, J. Liu, Y.-L. Liao, S. Li, C.-Z. Zhao and J.-Q. Huang, J. Energy Chem., 2022, 71, 612–618 Search PubMed.
- T. Boenke, P. Härtel, S. Dörfler, T. Abendroth, F. Schwotzer, H. Althues and S. Kaskel, Batteries Supercaps, 2021, 4, 989–1002 Search PubMed.
- K. Lee, S. Kim, J. Park, S. H. Park, A. Coskun, D. S. Jung, W. Cho and J. W. Choi, J. Electrochem. Soc., 2017, 164, A2075–A2081 Search PubMed.
- M. Yamamoto, Y. Terauchi, A. Sakuda and M. Takahashi, Sci. Rep., 2018, 8, 1212 Search PubMed.
- J. Lee, T. Lee, K. Char, K. J. Kim and J. W. Choi, Acc. Chem. Res., 2021, 54, 3390–3402 Search PubMed.
- Y. J. Nam, D. Y. Oh, S. H. Jung and Y. S. Jung, J. Power Sources, 2018, 375, 93–101 Search PubMed.
- W. Cho, J. Park, K. Kim, J. S. Yu and G. Jeong, Small, 2021, 17, 1902138 Search PubMed.
- K. Lee, J. Lee, S. Choi, K. Char and J. W. Choi, ACS Energy Lett., 2018, 4, 94–101 Search PubMed.
- D. Y. Oh, K. T. Kim, S. H. Jung, D. H. Kim, S. Jun, S. Jeoung, H. R. Moon and Y. S. Jung, Mater. Today, 2022, 53, 7–15 Search PubMed.
- D. Y. Oh, Y. J. Nam, K. H. Park, S. H. Jung, K. T. Kim, A. R. Ha and Y. S. Jung, Adv. Energy Mater., 2019, 9, 1802927 Search PubMed.
- A. Zülke, I. Korotkin, J. M. Foster, M. Nagarathinam, H. Hoster and G. Richardson, J. Electrochem. Soc., 2021, 168, 120522 Search PubMed.
- P. Minnmann, L. Quillman, S. Burkhardt, F. H. Richter and J. Janek, J. Electrochem. Soc., 2021, 168, 040537 Search PubMed.
- Z. Siroma, T. Sato, T. Takeuchi, R. Nagai, A. Ota and T. Ioroi, J. Power Sources, 2016, 316, 215–223 Search PubMed.
- J. S. Lee, J. Jamnik and J. Maier, Monatsh. Chem., 2009, 140, 1113–1119 Search PubMed.
- P.-A. Ahn, E.-C. Shin, G.-R. Kim and J.-S. Lee, J. Korean Ceram. Soc., 2011, 48, 549–558 Search PubMed.
- P. A. Ahn, E. C. Shin, J. M. Jo, J. H. Yu, S. K. Woo and J. S. Lee, Fuel Cells, 2012, 12, 1070–1084 Search PubMed.
- N. Kaiser, S. Spannenberger, M. Schmitt, M. Cronau, Y. Kato and B. Roling, J. Power Sources, 2018, 396, 175–181 Search PubMed.
- J. Jamnik and J. Maier, J. Electrochem. Soc., 1999, 146, 4183–4188 Search PubMed.
- P. S. Anjana, M. T. Sebastian, M. N. Suma and P. Mohanan, Int. J. Appl. Ceram. Technol., 2008, 5, 325–333 Search PubMed.
- N. Gorshkov, V. Goffman, M. Vikulova, I. Burmistrov, V. Sleptsov and A. Gorokhovsky, J. Appl. Polym. Sci., 2019, 137, 20867–20874 Search PubMed.
- H. Peng, H. Ren, M. Dang, Y. Zhang, X. Yao and H. Lin, Ceram. Int., 2018, 44, 16556–16560 Search PubMed.
- R. Amin, D. B. Ravnsbæk and Y.-M. Chiang, J. Electrochem. Soc., 2015, 162, A1163–A1169 Search PubMed.
- R. Amin and Y.-M. Chiang, J. Electrochem. Soc., 2016, 163, A1512–A1517 Search PubMed.
- L. Zhang, X. Zhan, Y. T. Cheng and M. Shirpour, J. Phys. Chem. Lett., 2017, 8, 5385–5389 Search PubMed.
- R. Koerver, W. Zhang, L. de Biasi, S. Schweidler, A. O. Kondrakov, S. Kolling, T. Brezesinski, P. Hartmann, W. G. Zeier and J. Janek, Energy Environ. Sci., 2018, 11, 2142–2158 Search PubMed.
- R. Koerver, I. Aygün, T. Leichtweiß, C. Dietrich, W. Zhang, J. O. Binder, P. Hartmann, W. G. Zeier and J. Janek, Chem. Mater., 2017, 29, 5574–5582 Search PubMed.
- J. Kim, W. Lee, J. Seok, E. Lee, W. Choi, H. Park, S. Yun, M. Kim, J. Lim and W.-S. Yoon, J. Energy Chem., 2022, 66, 226–236 Search PubMed.
Footnotes |
| † Electronic supplementary information (ESI) available: Characteristics of the NCA and LPSCl, calculated porosity plot and table of composite cathodes, cross-sectional SEM image of composite cathodes, additional electrochemical properties, schematics of blocking symmetric cells, additional AC impedance results, and DC polarization results in Fig. S1–13. See https://doi.org/10.1039/d2ta05021h |
| ‡ These authors contributed equally to this work. |
|
| This journal is © The Royal Society of Chemistry 2022 |
Click here to see how this site uses Cookies. View our privacy policy here. 
 a,
Chi Thi
Linh Nguyen
a,
Chi Thi
Linh Nguyen