DOI:
10.1039/D2TA02147A
(Paper)
J. Mater. Chem. A, 2022,
10, 19829-19838
Unusual thermoelectric properties mediated by solute segregation in tellurium alloyed CoSbS†
Received
18th March 2022
, Accepted 13th May 2022
First published on 14th May 2022
Abstract
The doping or alloying effect is effective for tuning the carrier concentration and/or lowering the lattice thermal conductivity in thermoelectrics. Herein, taking Co0.94Ni0.06SbS1−xTex as a typical example, we observed an unusual phenomenon where Te alloying mediates grain growth. It was observed that the Te dopant tended to be segregated along grain boundaries as a precipitate, resulting in an increase in grain size from 0.36 μm to 0.57 μm. The grain growth optimizes the low-temperature carrier scattering mechanism, leading to a higher power factor that represents a superior value in advanced sulfur-based thermoelectric materials. The lattice thermal conductivity was, however, slightly suppressed, which was higher than the Debye-model prediction. As a compromise, the average thermoelectric figure of merit (zT) was enhanced after Te doping, higher than those of other CoSbS based materials. Overall, this work proves the significance of solute segregation in the optimization of thermoelectric performance.
 Zihang Liu | Dr Zihang Liu is a full professor in the Department of Materials Science and Engineering at the Harbin Institute of Technology (HIT), China. He obtained a Ph.D. in March 2017 at HIT, then did postdoctoral study at the University of Houston and National Institute for Materials Science, Japan until August 2021. He received the 2021 National Natural Science Fund for Excellent Young Scientists (Overseas). His research interests include thermoelectric materials and devices, thermal management, and DFT calculations. As a first author and corresponding author he has published over 30 papers in peer-reviewed journals, including Joule, Nature Communications, PNAS, Energy & Environmental Science, and Advanced Energy Materials. |
Introduction
Thermoelectric devices can directly convert a temperature gradient to electricity and vice versa, which plays a vital role in the applications of these materials in aerospace power, refrigeration, and energy harvesting.1–3 The corresponding thermoelectric performance, including the conversion efficiency for power generation and the cooling coefficient of performance for cooling applications, is dominated by the dimensionless thermoelectric figure of merit (zT), which is defined as zT = (S2σ/κtot)T, where S, σ, κtot, and T are the Seebeck coefficient, electrical conductivity, total thermal conductivity (including lattice thermal conductivity κlat and electronic thermal conductivity κele), and absolute temperature, respectively.4 To enhance the zT of a target material, conventional strategies rely on carrier concentration optimization to increase the power factor (PF = S2σ) and/or isoelectronic alloying to strengthen phonon scattering to suppress κlat.5–8
Over the last two decades, the significance of microstructural engineering in tuning thermoelectric properties was realized and demonstrated,9 in which a remarkable effect was demonstrated where κlat was reduced through delicate control of the material synthesis process to introduce phonon-scattering centers, e.g., grain boundaries,10–13 nanoprecipitates,14,15 dislocations,16–18 and pores.19,20 In contrast, few relevant studies have focused on the influence of microstructural defects on carrier transport. Very recently, it was found that grain boundary scattering, a previously overlooked factor, plays a vital role in the carrier scattering strength for some thermoelectric material systems, e.g., Mg2Si,21 Mg3Sb2,22–24 PbSe–NaSbSe2,25 and Hf/ZrCoSb.26 Eliminating the additional scattering mechanism via increasing the grain size is therefore responsible for the experimental maximization of the PF.
Tellurium (Te) based thermoelectric materials, such as low-temperature Bi2Te3,10,27–29 and intermediate-temperature PbTe and GeTe,30–36 exhibit high zT values in their working temperature range. However, the scarcity of Te, with an abundance in the Earth's crust of around 0.001 ppm, may restrict their wide applications. Considering the significantly high earth abundance of sulfur (S) of around 350 ppm, S-based materials, including Bi2S3,37,38 PbS,39,40 Cu2S,41,42 and CuFeS2,43,44 have received intensive interest for the replacement of their Te-based counterparts. Due to their increased ionic bonding strength, S-based materials for thermoelectric applications are prone to exhibiting both low σ and PF as a consequence of low charge carrier mobility, μH. Parker et al. first reported the potential thermoelectric performance of a paracostibite CoSbS compound using combined theoretical and experimental analysis.45 Very recently, this system was demonstrated to have an ultrahigh PF that exceeds the benchmark of 20 μW cm−1 K−2 using Ni or Te doping as strong n-type dopants.46–48 This attractive property is due to the several conduction bands around the Fermi level, contributing to the high band degeneracy, as well as the nonexistence of compensating or killer intrinsic defects.45,49 In contrast, CoSbSe and CoSbTe, both of which are not isostructural to CoSbS, are metallic conduction type materials. Isoelectronic alloying by Se on the S site further reduces κlat and therefore increases zT.50–52 The recent discovery of the colossal power factor of CoSbS single crystals over the cryotemperature range also motivated interest in condensed matter physics.53,54
Herein, we systematically investigated the influence of Te alloying on the microstructure and thermoelectric properties of Co0.94Ni0.06SbS. It was found that the solute segregation mediated by Te alloying led to increased grain size, which resulted in anomalous transport properties. The carrier scattering mechanism was beneficially changed, leading to simultaneous increases in carrier mobility and power factor. Meanwhile, the thermal properties were slightly influenced due to the compromise between the introduced point defects and weakened grain boundary for phonon scattering. As a result, Ni and Te codoping in CoSbS significantly increased the power factor and zT, with maximum peak values of around 20.6 μW cm−1 K−2 and 0.65, respectively, which highlights the prospects of this material for intermediate-temperature thermoelectric power generation.
Experimental
Materials
High-purity raw materials were directly weighed according to nominal composition Co0.94Ni0.06SbS1−xTex samples (x = 0, 0.02, 0.04, and 0.06), loaded into a ball-milling jaw in a glovebox, and finally subjected to a one-time ball milling process without stopping for 5 h (SPEX SamplePrep 8000 Mixer Mill). The obtained nanopowders were loaded into a graphite die and sintered via a direct-current quick hot press system at 1023 K under a pressure of ∼80 MPa for 2 min.
Phase and microstructure characterization
Phase structures were characterized by powder X-ray diffractometry (PXRD, PANalytical X'Pert Pro) using Cu Kα radiation. PXRD patterns revealed that the materials crystallized with an orthorhombic structure (Pbca space group) rather than in the Pmn21 space group (Fig. S1†). The obtained Rietveld refinement parameters proved the good quality of the sample data. The sample crystallinity was not apparently changed and there was no second phase observed for the Co0.94Ni0.06SbS1−xTex samples within the detection limit of the PXRD apparatus. Microstructural analysis was conducted using a scanning electron microscope (SEM, JEOL6330F) and a scanning transmission electron microscopy (STEM, Thermo, Talos F200X G2, USA) with a high-angle annular dark-field (HAADF) detector and energy dispersive spectroscopy (EDS) was also employed. TEM samples were prepared using a conventional Ar-ion milling process.
Physical property measurements
Bar samples were cut from pressed disks and used for the simultaneous measurement of electrical resistivity (ρ) and Seebeck coefficient (S) on a commercial system (ULVAC ZEM-3). The thermal conductivity κtot was calculated using κtot = DCpd, where D, Cp, and d are the thermal diffusivity, specific heat capacity, and density, respectively. The thermal diffusivity coefficient (D) and specific heat capacity (Cp) were concurrently measured on disk samples on a laser flash system (Netzsch LFA 457, Germany). The sample density (d) was determined using the Archimedes method. The room-temperature Hall coefficient RH was measured using a PPMS (physical properties measurement system, Quantum Design) instrument. The Hall carrier concentration (nH) was obtained using nH = 1/eRH and the Hall carrier mobility (μH) was calculated using σ = eμHnH, where e is the electronic charge and σ is the electrical conductivity.
Results and discussion
Previous density functional theory (DFT) calculations revealed that CoSbTe crystallizes in the Pnn2 space group and exhibits a semimetal band structure.55 Therefore, Te alloying in CoSbS would decrease the bandgap accordingly (Fig. 1a). The charge carrier concentration nH increased gradually, with the room-temperature value increasing from 7.9 × 1020 cm−3 for Co0.94Ni0.06SbS to 9.0 × 1020 cm−3 for Co0.94Ni0.06SbS0.94Te0.06 (Fig. 1b). Considering that S and Te have the same number of valence electrons, this may be related to the associated change in the intrinsic point defect, e.g., the TeSb antisite defect.48 Surprisingly, we also observed an increasing trend in the charge carrier mobility μH, e.g., 2.2 cm2 V−1 s−1 for Co0.94Ni0.06SbS and 2.5 cm2 V−1 s−1 for Co0.94Ni0.06SbS0.96Te0.04 (Fig. 1b). The simultaneous increases in both nH and μH contribute towards increased electrical conductivity σ, e.g., the room-temperature value increased from 2.8 × 10⁴ S m−1 for Co0.94Ni0.06SbS up to 3.4 × 10⁴ S m−1 for Co0.94Ni0.06SbS0.94Te0.06 (Fig. 1c). More importantly, despite its high nH, Co0.94Ni0.06SbS still exhibits a positive slope for the relationship between σ and T, which is the signature of an intrinsic semiconductor. This implies the occurrence of an additional carrier-scattering mechanism in CoSbS based materials in addition to acoustic phonon-carrier scattering and the high effective mass of carriers. This may include grain boundary scattering, impurity ionic scattering, and magnetic scattering.45 It should be noted that Te alloying beneficially tunes the scattering mechanism, which can be ascribed to the weakened grain boundary scattering that will be discussed in the following. As expected, the Seebeck coefficient S is decreased after Te alloying due to the increased nH (Fig. 1d). Due to the compromise between the increased nH and the reduced Eg, the peak of S is maintained at around almost the same position. Based on the Goldsmid–Sharp band gap formula Eg = 2e|S|maxTmax, where |Smax| represents the maximum of absolute Seebeck coefficient and Tmax is the temperature at which this value occurs, the observed decreasing trend after Te alloying is consistent with previous DFT calculations (Fig. 1e). Consequently, Te alloying leads to an increase in the power factor PF, with a maximum peak value of around 20.6 μW cm−1 K−2 (Fig. 1f).
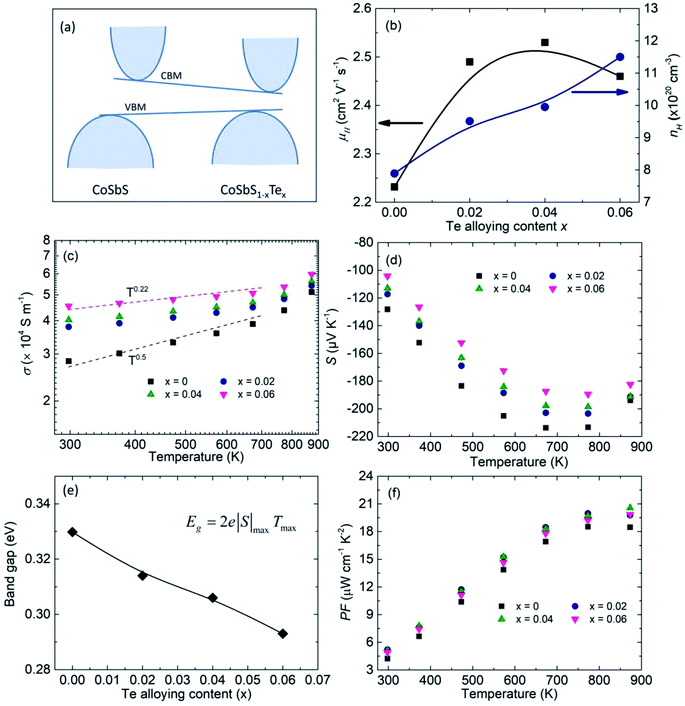 |
| | Fig. 1 Electronic properties of Co0.94Ni0.06SbS1−xTex samples (x = 0, 0.02, 0.04, and 0.06). (a) Schematic diagram of band structure evolution after Te alloying in CoSbS, (b) charge carrier concentration nH and carrier mobility μH values at room temperature as a function of Te alloying content, (c and d) temperature-dependent electrical conductivity σ and Seebeck coefficient S, respectively, (e) the calculated bandgap based on the Goldsmid–Sharp method, and (f) the temperature-dependent power factor PF. | |
To further unveil the underlying mechanism of the unusual electronic properties after Te alloying, the single parabolic band (SPB) model was utilized for analysis herein. Based on the Pisarenko plot, namely the nH dependent S, it is observed that the data of CoSbS-based samples, including Ni and Te codoping, as well as Ni doping,46 are located around the obtained line with a total density of states effective mass m* = 6me (Fig. 2a). This indicates that there is no significant change in the conduction band minimum around the Fermi level, which indicates the effectiveness of the rigid band model. Our present conclusion is consistent with previous first-principle calculations that also revealed the unchanged band structure in CoSbS1−xTex.50 Compared to Ni doping, Ni and Te codoping leads to a higher μH at the same nH (Fig. 2b). In thermoelectrics, the weighted mobility μW, irrespective of the doping element and/or nH, can be well used to evaluate the ability of a material's electronic properties,25,56 which is codetermined by the drift mobility μD and the m*, as shown in the following equation:
| |  | (1) |
where
me is the electron mass. Herein, we used the simplified model to calculate the
μD and
μW.
57 It is found that Ni and Te codoped samples possess a higher
μW than Ni doped samples at the same
nH (
Fig. 2c). Similarly, a higher PF is achieved for Ni and Te codoped samples, consistent with the tendency of
μW (
Fig. 2d). All the above mentioned analysis indicates the anomalous electronic properties observed for Ni and Te codoping that are beyond the conventional SPB model.
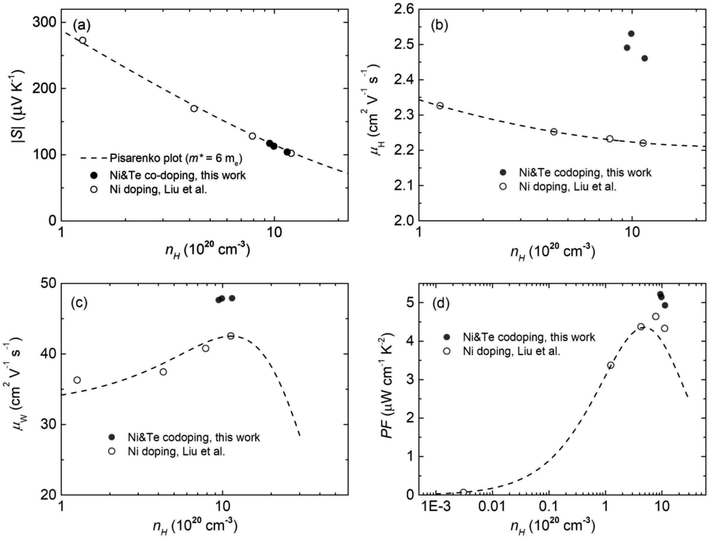 |
| | Fig. 2 Charge carrier concentration nH dependent room-temperature electronic properties of the Co0.94Ni0.06SbS1−xTex samples (x = 0, 0.02, 0.04, and 0.06), in comparison to Ni doped CoSbS. (a) The Pisarenko plot, (b, c and d) the charge carrier mobility μH values, the predicted weighted mobility μW, and the power factor PF, respectively. The dashed lines were obtained based on a single parabolic band (SPB) model with a total effective mass of m* = 6me. | |
Considering the almost unchanged band structure, grain boundary scattering should be the most plausible reason to account for the unusual properties. Therefore, the average grain size was analyzed by SEM characterization on the freshly fractured surfaces of samples of Co0.94Ni0.06SbS and Co0.94Ni0.06SbS0.96Te0.04, respectively (Fig. 3a and c). Co0.94Ni0.06SbS sample has an average grain size of around 0.36 μm (Fig. 3b), which increased up to around 0.57 μm after Te alloying (Fig. 3d). Moreover, the grain size distribution changed from unimodal to bimodal, indicating that Te alloying leads to inhomogeneous grain growth, namely abnormal grain growth characteristics. Therefore, the corresponding underlying mechanism is due to the increased grain boundary energy for some specific grain boundaries after Te alloying.
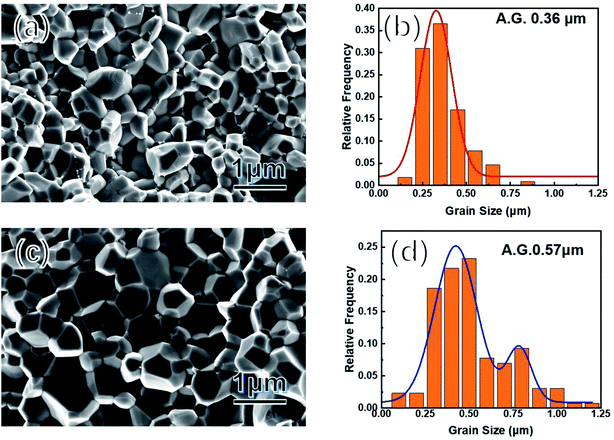 |
| | Fig. 3 (a and c) SEM images of freshly fractured surfaces of Co0.94Ni0.06SbS and Co0.94Ni0.06SbS0.96Te0.04, respectively; (b and d) their corresponding grain-size distribution analysis. | |
In metallurgy and ceramics science, it is widely acknowledged that impurities and alloying elements can significantly alter boundary energetics since these solute elements tend to be easily segregated along grain boundaries.58 A well-known example is doped alumina, in which these segregated solute atoms alter the local bonding environment and thereby affect microstructure evolution.59,60 The origin of abnormal grain growth behavior is assumed to be related to nonuniform grain boundary mobility,61 due to the appearance of wetting phases along the grain boundary.24,62 To have a deep understanding of microstructural evolution in Te-alloyed Co0.94Ni0.06SbS, we performed a thorough characterization on the Co0.94Ni0.06SbS0.96Te0.04 sample based on HAADF-STEM analysis, because the contrast in HAADF-STEM images is strongly dependent on the atomic number. Most of the precipitates were observed to occur around the grain boundary in the nanosized range with a low concentration (Fig. 4a), which are consistent with the sample composition and PXRD refinement results. It should be noted that these spherical-shaped particles in the grain, consisting of Si, C, O elements, are formed during the sample preparation process of the TEM observations. Grain boundaries with high energy are preferential locations for solute segregation that could lower the total energy and promote precipitation behavior at the grain boundary. Coupled with the chemical composition analysis (STEM-EDS), elemental Te segregates modestly to the grain boundary by means of precipitation (Fig. 4b). Considering the similar atomic numbers of Sb and Te, this means that the Te element is dominant (or as the elemental precipitate) in this precipitated compound. By checking the binary Sb–Te phase diagram, the highest possibility of this precipitate is therefore elemental Te, since there is no Te-rich compound near the end of this diagram. Since Te element has a relatively low melting point of 723 K, the segregation along the grain boundary acts as the ‘welting phase’ character that could lead to grain growth via liquid phase sintering. From the viewpoint of chemical bonding, the substitution of S atoms with Te atoms leads to the smaller difference in atom electronegativity, corresponding to weaker polar bonding strength around the grain boundary, therefore promoting grain growth. Moreover, since we used the high-energy balling method in combination with the SPS technique to synthesize the nanostructured thermoelectric materials with an average grain size of 0.36 μm, structural instabilities derived from a high number of grain boundaries provided the driving force for grains to reduce the total area of grain boundaries and in turn suppress the excess free energy per unit.
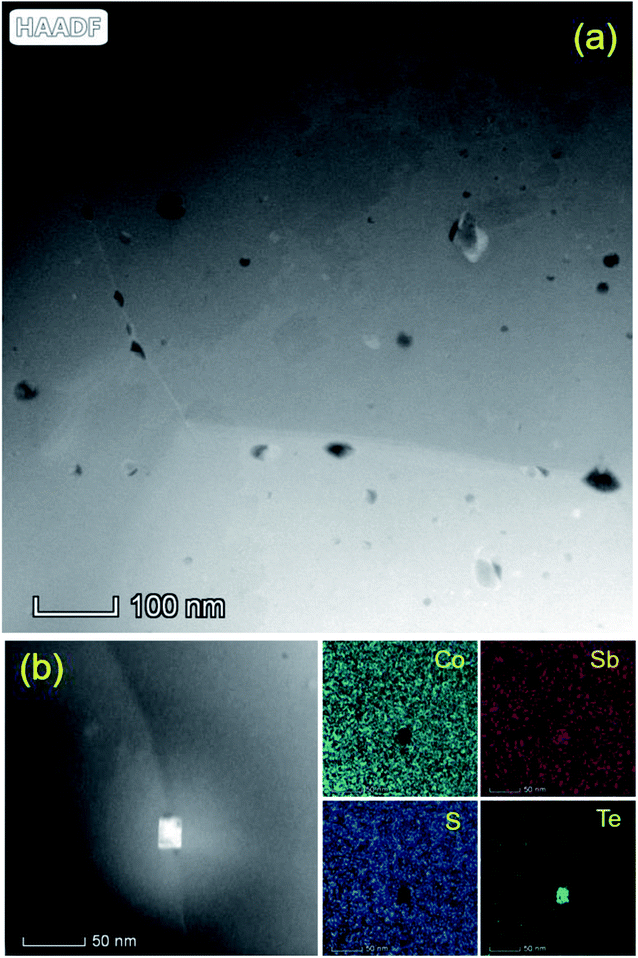 |
| | Fig. 4 (a) The high-resolution HAADF-STEM image around the grain boundary and (b) the high-resolution HAADF-STEM image and EDS mapping of the elemental segregation along the grain boundary. | |
Despite the big difference in the measured nH after Te alloying, the κtot of the Co0.94Ni0.06SbS1−xTex samples reduces slightly over the low-temperature range (Fig. 5a), whereas Te alloying suppresses the bipolar effect above 673 K due to the remarkably increased nH. Herein, we used the single parabolic band (SPB) model approximation with acoustic phonon scattering to calculate the Lorenz number (L). After subtracting the electronic thermal conductivity κele = LσT from κtot, the calculated lattice thermal conductivity κlat is found to dominate the κtot and therefore shows a similar trend to κtot (Fig. 5b). Remarkably, Te alloying has an extremely weak influence on κlat. To further assess the theoretical contribution of phonon scattering from point defects, the Callaway–Debye model was used here,7,63 as in the following:
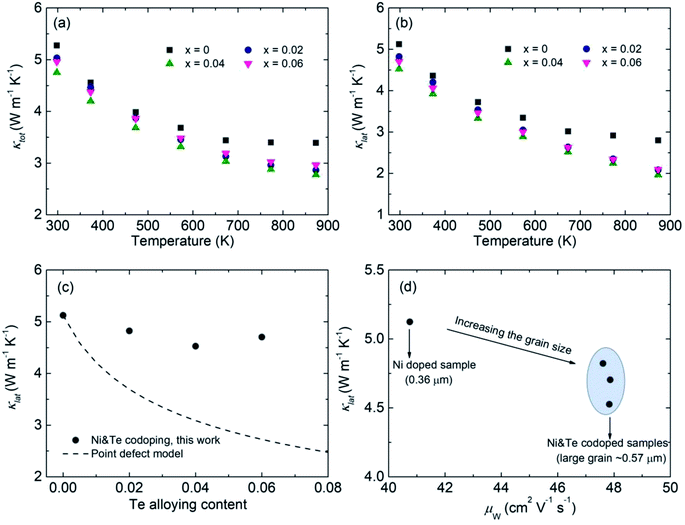 |
| | Fig. 5 Thermal properties results and analysis of the Co0.94Ni0.06SbS1−xTex samples (x = 0, 0.02, 0.04, and 0.06). (a and b) Temperature-dependent total thermal conductivity κtot and lattice thermal conductivity κlat, respectively, (c) comparison of the measured and simulated lattice thermal conductivity κlat as a function of Te alloying content, where the dashed line represents the theoretical value based on the Callaway–Debye model, and (d) the relationship between the calculated lattice thermal conductivity κlat and weighted carrier mobility μW in Co0.94Ni0.06SbS1−xTex. | |
In terms of a material containing substitutional defects, namely CoSbS1−xTex samples, the relationship between the κlat and κlat,p of the pure CoSbS sample can be written as:
| |  | (2) |
Here the parameter
u is defined by:
| |  | (3) |
where
Ω and
h represent the average volume per atom and Planck constant, respectively, and the average sound velocity
va can be calculated from:
4–7| |  | (4) |
Here, the longitudinal (vl, 5878 m s−1) and transverse (vs., 3542 m s−1) sound velocities were used in eqn (3) and the obtained va was around 3917 m s−1. The Debye temperature θD can be calculated using:
| |  | (5) |
where the
V is the unit-cell volume,
N is the number of atoms in a unit cell, and
kB is the Boltzmann parameter. The obtained
θD is around 454 K. The imperfection scaling parameter
Γ in
eqn (2) represents the strength of phonon scattering from point defects, including two components, the scattering parameter
ΓM due to mass fluctuation and the scattering parameter
ΓS due to strain field fluctuation. A phenomenological adjustable parameter
ε is included to better estimate
ΓS, which can be derived from:
| |  | (6) |
| |  | (7) |
| |  | (8) |
where
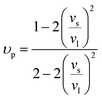
υp is the Poisson ratio, with a value of 0.22, the Gruneisen parameter (
γ) was calculated to be around 1.34, and the phenomenological adjustable parameter
ε is around 39.
No compositional change occurs on the sites of Co and Sb, ΓCo = ΓSb = 0, and the substitution between S and Te gives:
| |  | (9) |
| | | Γ(S,Te) = ΓM,(S,Te) + εΓS,(S,Te) | (11) |
| |  | (12) |
where Δ
M =
MTe −
MS and
M(S,Te) = (1 −
x)
MS +
xMTe| |  | (13) |
where Δ
r =
rTe −
rS and
r(Te,S) = (1 −
x)
rS +
xrTethen,
| |  | (14) |
and then,
| |  | (15) |
Based on the above eqn (2)–(15), the obtained κlat of defective CoSbS containing substitutional Te defects at the S sites is shown as a dashed line in Fig. 5c. Apparently, the slight reduction in κlat after Te alloying is beyond the prediction based on the conventional Callaway–Debye model. Since the atomic mass of the impurity atom Te (127.6 g mol−1) is much larger than that of the host atom S (32.06 g mol−1), the calculated imperfection scaling parameter from the strain field fluctuation was higher than that of the mass fluctuation considering the similar atomic radii of S (102 pm) and Te (135 pm) (Fig. S2†). Here, it should be noted that the additional scattering mechanism may lead to an overestimated κlat.64 In contrast, due to their larger grain sizes, Ni and Te codoped samples exhibit higher μW and lower κlat values than Ni-doped samples, which follows conventional thinking and is therefore distinct from the unusual findings on the Mg3(Sb,Bi)2 system. The overestimated κlat value of defective CoSbS based on the point-defect model was due to the significantly increased grain size after Te alloying that weakens the grain boundary scattering. Therefore, alloying dopant-mediated grain growth leads to anomalous thermoelectric properties that are beyond conventional thermoelectric prediction models.
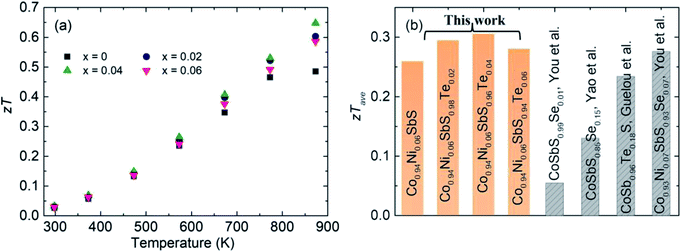
Due to the increased PF and suppressed κtot, Te alloying leads to enhanced zT across the entire measured temperature range, in which the peak zT value at 873 K is increased from 0.47 to 0.65 (Fig. 6a). Meanwhile, the highest average zT ∼ 0.31 is achieved for Co0.94Ni0.06SbS0.98Te0.02, higher than those of other optimized CoSbS-based samples (Fig. 6b). Our results thus show the potential of using CoSbS-based samples for power generation at intermediate temperatures.
 |
| | Fig. 6
zT value of the Co0.94Ni0.06SbS1−xTex samples (x = 0, 0.02, 0.04, and 0.06). (a) Temperature-dependent zT values and (b) comparison of the Co0.94Ni0.06SbS1−xTex samples with other reported CoSbS samples prepared by Hou et al., Yao et al., and Guelou et al. | |
Conclusions
In summary, we observed a novel phenomenon of solute segregation along the grain boundary of alloying mediated grain growth in Co0.94Ni0.06SbS1−xTex samples, which led to anomalous thermoelectric properties. Specifically, the average grain size was increased from 0.36 μm to 0.57 μm after Te alloying. Due to the weakened strength of grain boundary scattering for electrons and phonons, the carrier mobility was increased while the lattice thermal conductivity was slightly suppressed. As a result, Ni and Te codoping in CoSbS significantly increased the power factor and zT, with maximum peak values of around 20.6 μW cm−1 K−2 and 0.65, respectively. Our work highlights the significance of solute segregation on thermoelectric properties that are beyond conventional thermoelectric model prediction.
Author contributions
Weihong Gao: investigation; methodology; writing – original draft, Yuxi Yang, Mingqi Deng, Bin Sun, Yixuan Li: investigation; validation; writing – reviewing and editing; Yudong Fu, Zihang Liu, Jiehe Sui: conceptualization; supervision; funding acquisition; writing – reviewing and editing.
Conflicts of interest
There are no conflicts to declare.
Acknowledgements
This work was supported by the “Ten Thousand Million” Engineering Science and Technology Major Special Project of Heilongjiang Province (2019ZX10A01). It was also funded by the National Natural Science Foundation of China (No. 52130106, 51871082, and 52101247). The support from the Central University Basic Research Fund of China (FRFCU5710053021 and HIT.OCEF.2021014) is gratefully acknowledged.
References
- T. Mori and S. Priya, MRS Bull., 2018, 43, 176–180 CrossRef.
- G. Tan, M. Ohta and M. G. Kanatzidis, Philos. Trans. R. Soc., A, 2019, 377, 20180450 CrossRef CAS PubMed.
- J. Mao, G. Chen and Z. Ren, Nat. Mater., 2020, 20, 454–461 CrossRef PubMed.
- N. Jia, J. Cao, X. Y. Tan, J. Dong, H. Liu, C. K. I. Tan, J. Xu, Q. Yan, X. J. Loh and A. Suwardi, Mater. Today Phys., 2021, 21, 100519 CrossRef CAS.
- Y. Z. Pei, A. LaLonde, S. Iwanaga and G. J. Snyder, Energy Environ. Sci., 2011, 4, 2085–2089 RSC.
- Z. H. Liu, Y. M. Wang, J. Mao, H. Y. Geng, J. Shuai, Y. X. Wang, R. He, W. Cai, J. H. Sui and Z. F. Ren, Adv. Energy Mater., 2016, 6, 1502269 CrossRef.
- J. Callaway and H. C. von Baeyer, Phys. Rev., 1960, 120, 1149 CrossRef CAS.
- H. Wang, A. D. LaLonde, Y. Pei and G. J. Snyder, Adv. Funct. Mater., 2013, 23, 1586–1596 CrossRef CAS.
- Z. H. Liu, J. Mao, T.-H. Liu, G. Chen and Z. F. Ren, MRS Bull., 2018, 43, 181–186 CrossRef.
- B. Poudel, Q. Hao, Y. Ma, Y. C. Lan, A. Minnich, B. Yu, X. Yan, D. Z. Wang, A. Muto, D. Vashaee, X. Y. Chen, J. M. Liu, M. S. Dresselhaus, G. Chen and Z. F. Ren, Science, 2008, 320, 634–638 CrossRef CAS PubMed.
- L. Yang, Z.-G. Chen, M. Hong, G. Han and J. Zou, ACS Appl. Mater. Interfaces, 2015, 7, 23694–23699 CrossRef CAS PubMed.
- W. H. Gao, Z. Y. Wang, J. Huang and Z. H. Liu, ACS Appl. Mater. Interfaces, 2018, 10, 18685–18692 CrossRef CAS PubMed.
- G. Wu, Z. Guo, Q. Zhang, X. Wang, L. Chen, X. Tan, P. Sun, G.-Q. Liu, B. Yu and J. Jiang, J. Mater. Chem. A, 2021, 9, 13065–13070 RSC.
- K. Biswas, J. Q. He, Q. C. Zhang, G. Y. Wang, C. Uher, V. P. Dravid and M. G. Kanatzidis, Nat. Chem., 2011, 3, 160 CrossRef CAS PubMed.
- D. Qin, H. Wu, S. Cai, J. Zhu, B. Cui, L. Yin, H. Qin, W. Shi, Y. Zhang, Q. Zhang, W. Liu, J. Cao, S. J. Pennycook, W. Cai and J. Sui, Adv. Energy Mater., 2019, 9, 1902435 CrossRef CAS.
- S. I. Kim, K. H. Lee, H. A. Mun, H. S. Kim, S. W. Hwang, J. W. Roh, D. J. Yang, W. H. Shin, X. S. Li, Y. H. Lee, G. J. Snyder and S. W. Kim, Science, 2015, 348, 109–114 CrossRef CAS PubMed.
- X. F. Meng, Z. H. Liu, B. Cui, D. D. Qin, H. Y. Geng, W. Cai, L. W. Fu, J. Q. He, Z. F. Ren and J. H. Sui, Adv. Energy Mater., 2017, 7, 1602582 CrossRef.
- Z. W. Chen, B. H. Ge, W. Li, S. Q. Lin, J. W. Shen, Y. J. Chang, R. Hanus, G. J. Snyder and Y. Z. Pei, Nat. Commun., 2017, 8, 13828 CrossRef CAS PubMed.
- A. U. Khan, K. Kobayashi, D.-M. Tang, Y. Yamauchi, K. Hasegawa, M. Mitome, Y. M. Xue, B. Z. Jiang, K. Tsuchiya, D. Golberg, Y. Bando and T. Mori, Nano Energy, 2017, 31, 152–159 CrossRef CAS.
- F. Guo, B. Cui, C. Li, Y. Wang, J. Cao, X. Zhang, Z. Ren, W. Cai and J. Sui, Adv. Funct. Mater., 2021, 31, 2101554 CrossRef CAS.
- J. de Boor, T. Dasgupta, H. Kolb, C. Compere, K. Kelm and E. Mueller, Acta Mater., 2014, 77, 68–75 CrossRef CAS.
- J. J. Kuo, S. D. Kang, K. Imasato, H. Tamaki, S. Ohno, T. Kanno and G. J. Snyder, Energy Environ. Sci., 2018, 11, 429–434 RSC.
- K. Imasato, C. Fu, Y. Pan, M. Wood, J. J. Kuo, C. Felser and G. J. Snyder, Adv. Mater., 2020, 32, 1908218 CrossRef CAS PubMed.
- Z. H. Liu, N. Sato, W. H. Gao, K. Yubuta, N. Kawamoto, M. Mitome, K. Kurashima, Y. Owada, K. Nagase, C.-H. Lee, J. Yi, K. Tsuchiya and T. Mori, Joule, 2021, 5, 1196–1208 CrossRef CAS.
- T. J. Slade, J. A. Grovogui, J. J. Kuo, S. Anand, T. P. Bailey, M. Wood, C. Uher, G. J. Snyder, V. P. Dravid and M. G. Kanatzidis, Energy Environ. Sci., 2020, 13, 1509–1518 RSC.
- Q. Qiu, Y. Liu, K. Xia, T. Fang, J. Yu, X. Zhao and T. Zhu, Adv. Energy Mater., 2019, 9, 1803447 CrossRef.
- T. Fang, X. Li, C. Hu, Q. Zhang, J. Yang, W. Zhang, X. Zhao, D. J. Singh and T. Zhu, Adv. Funct. Mater., 2019, 29, 1900677 CrossRef.
- X. Tang, Z. Li, W. Liu, Q. Zhang and C. Uher, J. Alloys Compd., 2022, 1, 88–115 Search PubMed.
- L. Chen, Q. Zhang, Z. Guo, Z. Yan, K. Song, G. Wu, X. Wang, X. Tan, H. Hu, P. Sun, G.-Q. Liu and J. Jiang, Mater. Today Phys., 2021, 21, 100544 CrossRef CAS.
- K. Biswas, J. Q. He, I. D. Blum, C.-I. Wu, T. P. Hogan, D. N. Seidman, V. P. Dravid and M. G. Kanatzidis, Nature, 2012, 489, 414–418 CrossRef CAS PubMed.
- G. Tan, F. Shi, S. Hao, L.-D. Zhao, H. Chi, X. Zhang, C. Uher, C. Wolverton, V. P. Dravid and M. G. Kanatzidis, Nat. Commun., 2016, 7, 12167 CrossRef CAS PubMed.
- C. Qin, L. Cheng, Y. Xiao, C. Wen, B. Ge, W. Li and Y. Pei, Mater. Today Phys., 2021, 17, 100355 CrossRef CAS.
- Z. H. Liu, J. F. Sun, J. Mao, H. T. Zhu, W. Y. Ren, J. C. Zhou, Z. M. Wang, D. J. Singh, J. H. Sui, C.-W. Chu and Z. F. Ren, Proc. Natl. Acad. Sci. U. S. A., 2018, 115, 5332–5337 CrossRef CAS PubMed.
- Z. H. Liu, W. H. Gao, W. H. Zhang, N. Sato, Q. S. Guo and T. Mori, Adv. Energy Mater., 2020, 10, 2002588 CrossRef CAS.
- M. Hong, Z. G. Chen, L. Yang, Y. C. Zou, M. S. Dargusch, H. Wang and J. Zou, Adv. Mater., 2018, 30, 1705942 CrossRef PubMed.
- T. Xing, C. Zhu, Q. Song, H. Huang, J. Xiao, D. Ren, M. Shi, P. Qiu, X. Shi, F. Xu and L. Chen, Adv. Mater., 2021, 33, 2008773 CrossRef CAS PubMed.
- Z. H. Liu, Y. L. Pei, H. Y. Geng, J. C. Zhou, X. F. Meng, W. Cai, W. S. Liu and J. H. Sui, Nano Energy, 2015, 13, 554–562 CrossRef CAS.
- J. Guo, J. Yang, Z.-H. Ge, B. Jiang, Y. Qiu, Y.-K. Zhu, X. Wang, J. Rong, X. Yu, J. Feng and J. He, Adv. Funct. Mater., 2021, 31, 2102838 CrossRef CAS.
- L.-D. Zhao, J. He, S. Hao, C.-I. Wu, T. P. Hogan, C. Wolverton, V. P. Dravid and M. G. Kanatzidis, J. Am. Chem. Soc., 2012, 134, 16327–16336 CrossRef CAS PubMed.
- Y. Xiao, D. Wang, Y. Zhang, C. Chen, S. Zhang, K. Wang, G. Wang, S. J. Pennycook, G. J. Snyder, H. Wu and L.-D. Zhao, J. Am. Chem. Soc., 2020, 142, 4051–4060 CrossRef CAS PubMed.
- Y. He, T. Day, T. S. Zhang, H. L. Liu, X. Shi, L. D. Chen and G. J. Snyder, Adv. Mater., 2014, 26, 3974–3978 CrossRef CAS PubMed.
- S. Zhao, H. Chen, X. Zhao, J. Luo, Z. Tang, G. Zeng, K. Yang, Z. Wei, W. Wen, X. Chen and Y. Sun, Mater. Today Phys., 2020, 15, 100271 CrossRef.
- N. Tsujii and T. Mori, Appl. Phys. Express, 2013, 6, 043001 CrossRef.
- H. Xie, X. Su, G. Zheng, T. Zhu, K. Yin, Y. Yan, C. Uher, M. G. Kanatzidis and X. Tang, Adv. Energy Mater., 2017, 7, 1601299 CrossRef.
- D. Parker, A. F. May, H. Wang, M. A. McGuire, B. C. Sales and D. J. Singh, Phys. Rev. B: Condens. Matter Mater. Phys., 2013, 87, 045205 CrossRef.
- Z. H. Liu, H. Y. Geng, J. Shuai, Z. Y. Wang, J. Mao, D. Z. Wang, Q. Jie, W. Cai, J. H. Sui and Z. F. Ren, J. Mater. Chem. C, 2015, 3, 10442–10450 RSC.
- R. Chmielowski, S. Bhattacharya, W. Xie, D. Péré, S. Jacob, R. Stern, K. Moriya, A. Weidenkaff, G. Madsen and G. Dennler, J. Mater. Chem. C, 2016, 4, 3094–3100 RSC.
- G. Guélou, F. Failamani, P. Sauerschnig, J. Waybright, K. Suzuta and T. Mori, J. Mater. Chem. C, 2020, 8, 1811–1818 RSC.
- S. Bhattacharya, R. Chmielowski, G. Dennler and G. K. Madsen, J. Mater. Chem. A, 2016, 4, 11086–11093 RSC.
- W. Yao, D. Yang, Y. Yan, K. Peng, H. Zhan, A. Liu, X. Lu, G. Wang and X. Zhou, ACS Appl. Mater. Interfaces, 2017, 9, 10595–10601 CrossRef CAS PubMed.
- Y. You, X. Su, W. Liu, Y. Yan, T. Hu, C. Uher and X. Tang, RSC Adv., 2017, 7, 34466–34472 RSC.
- Y. You, X. Su, S. Hao, W. Liu, Y. Yan, T. Zhang, M. Zhang, C. Wolverton, M. G. Kanatzidis and X. Tang, J. Mater. Chem. A, 2018, 6, 15123–15131 RSC.
- Q. Du, M. Abeykoon, Y. Liu, G. Kotliar and C. Petrovic, Phys. Rev. Lett., 2019, 123, 076602 CrossRef CAS PubMed.
- R. Yang, M. Corasaniti, L. Wu, Q. Du, Y. Zhu, C. Petrovic and L. Degiorgi, Phys. Rev. B, 2021, 103, L161111 CrossRef CAS.
- H. S. Kousar, D. Srivastava, M. Karppinen and G. C. Tewari, J. Phys.: Condens. Matter, 2019, 31, 405704 CrossRef CAS PubMed.
-
K. Koumoto and T. Mori, Thermoelectric Nanomaterials, Springer, New York, 2015 Search PubMed.
- J. Zhu, X. Zhang, M. Guo, J. Li, J. Hu, S. Cai, W. Cai, Y. Zhang and J. Sui, npj Comput. Mater., 2021, 7, 116 CrossRef CAS.
- D. Raabe, M. Herbig, S. Sandlöbes, Y. Li, D. Tytko, M. Kuzmina, D. Ponge and P. P. Choi, Curr. Opin. Solid State Mater. Sci., 2014, 18, 253–261 CrossRef CAS.
- P. Gruffel and C. Carry, J. Eur. Ceram. Soc., 1993, 11, 189–199 CrossRef CAS.
- H. Yoshida, S. Hashimoto and T. Yamamoto, Acta Mater., 2005, 53, 433–440 CrossRef CAS.
- B. L. DeCost and E. A. Holm, Metall. Mater. Trans. A, 2017, 48, 2771–2780 CrossRef CAS.
- T. Luo, J. J. Kuo, K. J. Griffith, K. Imasato, O. Cojocaru-Mirédin, M. Wuttig, B. Gault, Y. Yu and G. J. Snyder, Adv. Funct. Mater., 2021, 31, 2100258 CrossRef CAS.
- Y.-L. Pei, J. Q. He, J.-F. Li, F. Li, Q. J. Liu, W. Pan, C. Barreteau, D. Berardan, N. Dragoe and L.-D. Zhao, NPG Asia Mater., 2013, 5, e47 CrossRef CAS.
- J. J. Kuo, M. Wood, T. J. Slade, M. G. Kanatzidis and G. J. Snyder, Energy Environ. Sci., 2020, 13, 1250–1258 RSC.
|
| This journal is © The Royal Society of Chemistry 2022 |
Click here to see how this site uses Cookies. View our privacy policy here.  *c and
Jiehe
Sui
 *c
*c


