
Defect-engineered MOF-801 for cycloaddition of CO2 with epoxides†
Yunjang
Gu
,
Bai Amutha
Anjali
,
Sunghyun
Yoon
,
Youngson
Choe
 ,
Yongchul G.
Chung
* and
Dae-Won
Park
*
,
Yongchul G.
Chung
* and
Dae-Won
Park
*
School of Chemical Engineering, Pusan National University, Busan, 46241, Korea. E-mail: drychung@gmail.com; dwpark@pusan.ac.kr
First published on 31st March 2022
Abstract
Heterogeneous catalysts based on defective metal–organic frameworks (MOFs) have attracted wide attention due to their facile formation of defects during synthesis. Herein, two MOFs, MOF-801(D) and MOF-801(P), were synthesized by a solvothermal method using a modulation approach. The synthesized MOFs were characterized by using PXRD, N2 BET, TGA, NH3 and CO2-TPD, CO2 adsorption isotherms, XPS, FT-IR, FE-SEM, and HR-TEM. A computational characterization method was developed to approximate the degree of defects using a combination of molecular simulation and a linear programming approach. Master isotherm models for N2 isotherms at 77 K were constructed to match the experimental isotherm data of MOF-801(D) and MOF-801(P), and the pore size distribution and the degree of defects were quantified based on the predicted N2 isotherms at 77 K. MOF-801(D) showed a high conversion of epoxide with >99% selectivity toward cyclic carbonate and 92% conversion under mild and solvent-less reaction conditions. MOF-801(D) was easily separated using a centrifuge and can be recycled up to 5 times without any significant decrease in its initial performance. Density functional theory (DFT) calculations were carried out to corroborate that the increased acid sites, from the cluster defects, are responsible for the increased catalytic conversion of the catalyst.
Introduction
Due to the concerns over global climate change with the increasing CO2 concentration in the atmosphere, the development of engineering and materials technologies that can efficiently capture, store, and utilize CO2 into valuable chemicals is gaining momentum in a broad scientific community.1–3 One such method of transforming CO2 into valuable chemicals is the synthesis of cyclic carbonate from carbon dioxide and epoxides.2,4,5 The main advantage of the cyclic carbonate synthesis by the cycloaddition reaction is that the reaction (Fig. 1) is more environmentally friendly than traditional carbonate synthesis routes5 with a 100% atom economy. According to a recent report, almost 80 kilotons of cyclic carbonates are produced per year, corresponding to the potential for 40 kilotons per year of direct CO2 utilization.5,6 The demand for cyclic carbonates has been growing rapidly due to their utilization as an electrolyte in Li-ion batteries,7,8 and as intermediates in the synthesis of polyurethane, ethylene glycol, paints, and pharmaceutical products.9–13 Additionally, the synthesis of cyclic carbonates using CO2 as a feedstock leads to long-time CO2 fixation compared to other CO2-based products, such as urea and fertilizer.14,15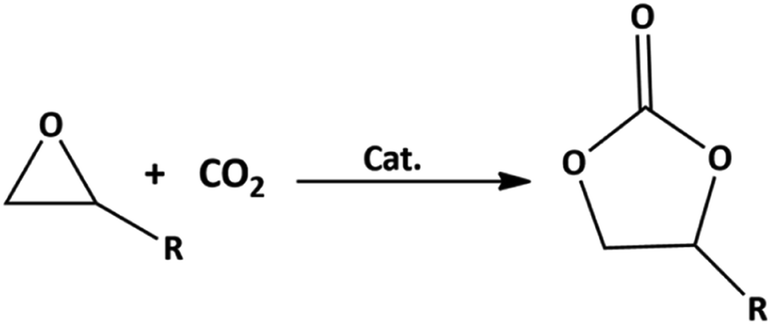 | ||
| Fig. 1 Cycloaddition reaction of epoxide and CO2 to form a five-membered cyclic carbonate (Cat. represents catalyst). | ||
Metal–organic frameworks (MOFs) typically consist of metal clusters and organic ligands and could have a very high surface area, porosity, and crystallinity, depending on the choice of the building blocks for the synthesis. In principle, the internal pore size of MOFs can be controlled by judiciously choosing the framework ligands while the pore surface chemistry can be modulated by introducing functional groups into these ligands.16 As such, MOFs have been investigated for their use in heterogeneous catalysts, sensors, biological and medical materials, proton conductors, gas separators, and adsorbent materials for selective gas capture.13,17–20 MOFs have been developed as efficient catalysts for the synthesis of cyclic carbonates from CO2 and epoxides.21–27
One of the key drawbacks of MOFs for such applications is their chemical and thermal stability.28 For example, many reported MOFs are not stable under humid conditions and at high temperatures because of the weak coordination bond between the metal node and organic ligands. For instance, Zn2+ based MOFs, including Zn-MOF-74, are easily dissociated in a typical atmosphere via water hydrolysis.29,30 Due to the influence of water, the metal–oxygen bond of the MOFs is elongated, which leads to the framework collapsing. However, MOFs based on the Zr4+ node (i.e., Zr-MOFs) have shown to be water-stable and acid–gas resistant,31–33 which makes them an ideal candidate for applications under high temperature and pressure conditions, such as thermal catalysis. More importantly, Zr-based MOFs, such as UiO-66 and MIL-140, were reported to be catalytically active and stable,31,34–37 likely due to the high oxidation states of Zr-based MOFs that can readily activate the reaction substrates.31
The choice of synthesis methods for Zr-MOFs plays a critical role in the degree of defects and the crystallinity of the material. For example, Wißmann et al. reported the modulation approach,31 which consists of the addition of a monovalent modulator (monocarboxylic acid, e.g., acetic acid, formic acid, difluoroacetic acid, and trifluoroacetic acid) to the reaction blend. The modulation approach enhances the reproducibility of the catalyst synthesis, increases the crystallization of catalysts, and controls the crystal size and shape, as well as the degree of agglomeration/aggregation of the crystals.38
During the crystallization, the modulator influences the crystal nucleation and growth by competing with the ligand for the coordination site at the metal ion or metal cluster, which leads to the creation of defect sites. However, only a few studies of the modulation approach have been reported in the literature.39,40
Defects play a central role in heterogeneous catalysis and its utilization.41–45 These defects can be formed from missing linkers clusters, or a combination of both.46,47 Many studies have reported that the role of defect sites in MOFs has been continuously increased after Farrusseng et al.'s original work on the defect of MOF-5 in 2008.48 The presence of defects can also tune the local atomic structure, optical properties, electronic structure, or electrical conductivity of materials, and thus further affect the physicochemical properties and adsorptive and catalytic performance.49–54 Nevertheless, the presence of defects was considered as the primary reason for the unexpected, and sometimes significantly enhanced, catalytic properties of various MOFs, such as UiO-66,55–60 UiO-67,61 MIL-101(Fe),62 MOF-5,63 MOF-808,64 HKUST-1,65 and ZIF-8.66 Among zirconium MOFs, the Zr-fumarate MOF (i.e., MOF-801(Zr)) has a fcu topology, with metal clusters interconnected by a nonlinear dicarboxylate ligand, which leads to a lowering of symmetry and slight tilting of the [Zr6(μ3-O)4(μ3-OH)4]12+ clusters.67 Recently, Zr-MOFs have attracted the attention of many researchers for their water stability, potential for green synthesis, and facile shaping using a direct monolith formation by a gel approach.68
Defects and their associated property modulation in MOF-801(Zr) have been recently investigated by Iacomi et al. for the adsorption and separation of C3 hydrocarbons.69 Two types of defects, missing linkers, and missing clusters, at various concentrations and conformations in the structure have been predicted. A combination of experimental and simulation methodology reveals that the equilibrium adsorption behavior of C3 hydrocarbons can best be described by a model where zirconium clusters are missing cluster defects.
In this work, we prepared pristine and defective MOF-801(Zr) using the modulation method. The catalytic performances of MOF-801(Zr) were characterized based on the experimental and simulated N2 adsorption isotherms, and DFT calculations were carried out to provide a plausible reaction mechanism and an explanation for the increased catalytic activity for the cycloaddition of CO2 and epoxides into cyclic carbonates.48 From the analyses, we conclude that the presence of defects leads to increased catalytic conversion of CO2 into cyclic carbonates by providing additional acid sites for reaction and a pathway for faster mass transfer of reactants.
Results and discussion
Characterization of the synthesized catalysts
The powder X-ray diffraction (PXRD) spectra of the synthesized MOF-801(D, defective) and MOF-801(P, pristine) were compared with the theoretical single crystal spectrum (Fig. 2). Also, the crystal homogeneity, structural integrity, and degree of crystallinity of all the MOF-801 catalysts were confirmed through PXRD analysis. The PXRD peaks of both catalysts well fitted with the theoretical spectrum of the CCDC (Cambridge Crystallographic Data Center, Cambridge, United Kingdom) database, thereby verifying the good synthesis of all the catalysts (Fig. 2).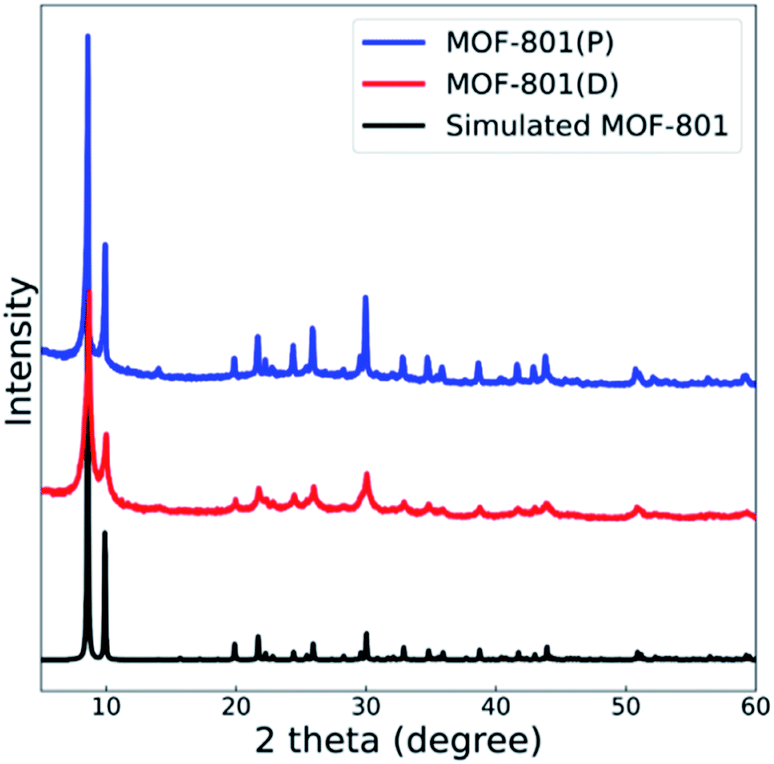 | ||
| Fig. 2 XRD patterns of MOF-801(D) and MOF-801(P) with simulated MOF-801. | ||
NH3 and CO2 temperature-programmed desorption (TPD) analyses (Fig. S1†) were carried out to investigate acid–base sites in the MOF-801 catalysts. As shown in Table 1, MOF-801(D) showed a higher amount of acidic sites than MOF-801(P). In contrast, MOF-801(P) had a higher amount of basic sites than MOF-801(D).
| Catalyst | Acidic sites NH3-TPD (mmol g−1) | Basic sites CO2-TPD (mmol g−1) |
|---|---|---|
| MOF-801(D) | 4.4 | 2.4 |
| MOF-801(P) | 3.8 | 3.0 |
X-ray photoelectron spectroscopy (XPS) was carried out to verify the valence state of the Zr-MOF catalysts. The XPS spectra, as shown in Fig. 3, supports the existence of Zr, C, and O in the Zr-MOF catalysts. The Zr 3d peak located at a binding energy of around 182.68 eV and 184.98 eV can be assigned to Zr 3d5/2 and Zr 3d3/2, which is similar to previous Zr-based MOFs that some of us reported.70
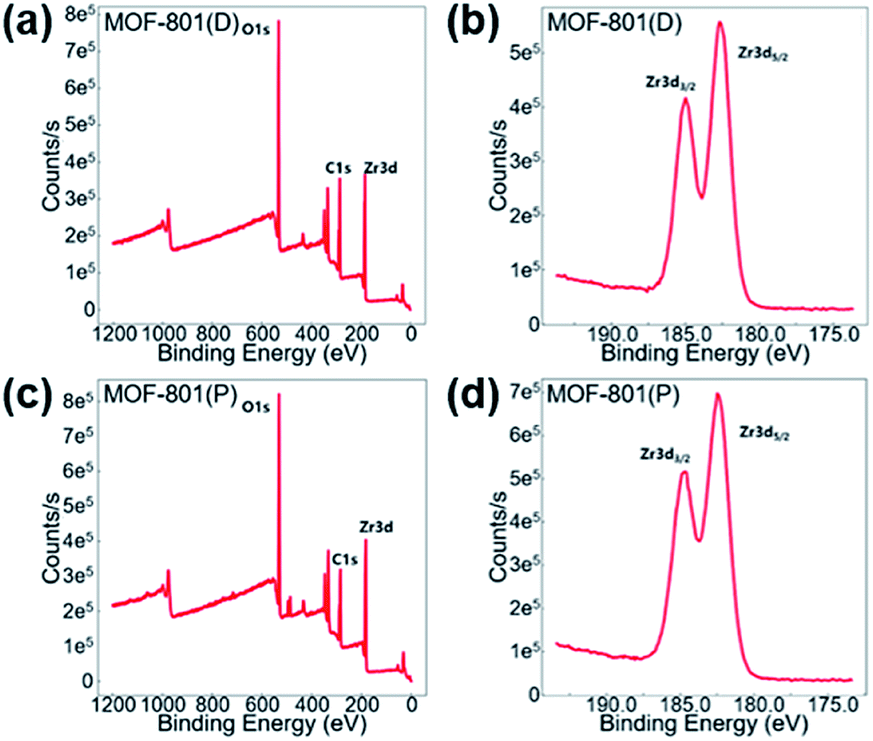 | ||
| Fig. 3 XPS spectra (a) and (b) for MOF-801(D) and (c) and (d) for MOF-801(P). | ||
Fourier transform infrared spectroscopy (FT-IR) spectra of the MOF-801 catalysts are shown in Fig. 4. The wide peak in the range of 3400–3450 cm−1 corresponds to the O–H stretching frequency of coordinated H2O. The peaks observed at approximately 1670–1510 cm−1 correspond to the symmetric and asymmetric stretching vibration of the carboxylic group (COOH) of the ligand. The symmetric stretching vibration of the Zr–O bond at 790 cm−1 and 650 cm−1 confirms the good coordination of the metal with the ligands.13,34
 | ||
| Fig. 4 FT-IR spectra of MOF-801(D) and MOF-801(P). | ||
From the thermogravimetric analysis (TGA), the thermal stability of MOF-801(P) and MOF-801(D) was confirmed to be as high as 200 °C, as shown in Fig. S2.† The TGA of MOF-801 mainly indicates three decaying steps in the temperature ranges of 40–130, 140–500, and 550–700 °C. The first continuous weight loss of 3–4 wt% corresponds to the loss of free water molecules, and the second and third steps can be ascribed to the successive decomposition of the 3D lattice network of the dehydrated catalyst [Zr6O6(O2C-(CH)2-CO2)6] to form (ZrO2)6. MOF-801(P) showed larger weight loss near 500 °C than MOF-801(D). Since MOF-801(P) contains more fumarate ligands in the framework, the weight loss originating from their decomposition could be higher than in MOF-801(D) containing smaller number of the ligands. The total weight loss in wt% between 100 °C (ligand containing state) and 500 °C (ligands are decomposed) for MOF-801(P) and MOF-801(D) was calculated to be 43.1% and 38.8%, respectively. If one of the six ligands in the formula of the dehydrated MOF-801 is missing to form a defect structure, Zr6O6(O2C-(CH)2-CO2)5 [M.W. = 1207.45], the estimated weight loss will be (1207.45–739.272)/1207.45 = 38.8%. Therefore, we can estimate that almost 1/6 ligand of its perfect crystal structure was missing in MOF-801(D). The detailed calculations are included in the ESI (Fig. S2†).
The morphology images of MOF-801 catalysts were obtained using field-emission scanning electron microscopy (FE-SEM), performed under vacuum conditions. FE-SEM images revealed the formation of crystalline solids (Fig. S3†). The image of defective MOF-801(D) was investigated using high-resolution transmission electron microscopy (HR-TEM), operated at 200 kV. The HR-TEM image (Fig. S4†) shows the presence of defects in the crystal structure of MOF-801(D).
Computational methods for defect characterization
There are two types of defects in zirconium MOFs: (1) the missing cluster (mc) defects and (2) the missing linker (ml) defects (Scheme 1). Computational structural analysis, which includes molecular grand canonical Monte Carlo (GCMC) simulations, linear programming, and 2D-NLDFT calculations, was carried out to predict the degree of defects and estimate the pore size distributions and BET area of MOF-801(D) and MOF-801(P). The porosity and isotherm analysis of both MOF-801 catalysts were analyzed by N2 physical adsorption at 77 K. The BET areas of simulated and experimental MOF-801(D) and MOF-801(P) were calculated using the SESAMI 1.0 code71 which is an open-source python program that can automate the BET analyses. Four consistency criteria were satisfied when obtaining the BET areas.72 The simulated BET areas are given in Table S1.† The experimental BET area of MOF-801(P) and MOF-801(D) was 707 and 832 m2 g−1, respectively. | ||
| Scheme 1 Pristine MOF-801(Zr) and defective MOF-801(Zr). Red boxes represent the missing cluster defects (defective structure). | ||
We constructed different master isotherm models composed of the various combinations of the missing linker (ml) and missing cluster (mc) (Table 2). The linear programming approach was used to estimate the BET area, and the results are shown in Table 3, Fig. S5, and S6.† Here, the BET areas of the structures based on the master isotherms were modelled as a minimization problem, and the proportion of different defects that led to the best agreement with the BET area obtained from the experimental isotherm data was selected based on the linear programming approach.
| Model | P | mc-1 | mc-2 | mc-3 | mc-4 | ml-1 | ml-2 | ml-3 | ml-4 | ml-5 |
|---|---|---|---|---|---|---|---|---|---|---|
| a P: perfect crystal, mc: missing cluster, and ml: missing linker. | ||||||||||
| 1 | 0 | 0 | 0 | 100 | 0 | 0 | 0 | 0 | 0 | 0 |
| 2 | 0 | 0 | 0 | 0 | 0 | 0 | 100 | 0 | 0 | 0 |
| 3 | 0 | 36 | 0 | 64 | 0 | 0 | 0 | 0 | 0 | 0 |
| 4 | 0 | 0 | 0 | 37 | 34 | 0 | 0 | 0 | 0 | 29 |
| 5 | 0 | 45 | 23 | 0 | 0 | 0 | 0 | 0 | 32 | 0 |
| 6 | 0 | 100 | 0 | 0 | 0 | 0 | 0 | 0 | 0 | 0 |
| 7 | 100 | 0 | 0 | 0 | 0 | 0 | 0 | 0 | 0 | 0 |
| 8 | 89 | 0 | 0 | 0 | 0 | 0 | 0 | 0 | 0 | 11 |
| 9 | 58 | 31 | 0 | 0 | 0 | 0 | 0 | 0 | 0 | 11 |
| 10 | 90 | 0 | 0 | 0 | 0 | 0 | 0 | 0 | 0 | 10 |
| MOF-801(D) | ||||||
|---|---|---|---|---|---|---|
| Master model | 1 | 2 | 3 | 4 | 5 | Exp. |
| BET area (m2 g−1) | 1125 | 684 | 1070 | 1077 | 963 | 832 |
| MOF-801(P) | ||||||
|---|---|---|---|---|---|---|
| Master model | 6 | 7 | 8 | 9 | 10 | Exp. |
| BET area (m2 g−1) | 966 | 686 | 784 | 667 | 707 | 707 |
To first validate our approach, we used the method on the N2 isotherm data for MOF-801(P) (Table 3 and Fig. S5†). We found that master model 7 was the best master isotherm model composed of 100% pristine crystals, which provides the basis for using the method to further characterize the defective MOF-801. We found that the best model for MOF-801(D) was master model 5 consisting of 45% mc-1, 23% mc-2, and 32% ml-4 (Table 3 and Fig. S6†). Note that mc-1 and mc-2 are the missing cluster defects which can provide more acid sites for the cycloaddition reaction of epichlorohydrin with CO2.
The CO2 adsorption experiments of these catalysts were additionally carried out at 298 K. For additional model validation, CO2 isotherms were predicted from the suggested master model of defect composition from the N2 isotherm (Fig. S7†). The similarity of the isotherm shape in the experimental and simulated cases further supports that the degree of defect estimated using the master isotherm is reasonable. Furthermore, since the CO2 uptake in MOF-801(D) is lower than that in MOF-801(D), the high CO2 uptake is not necessary for the high conversion in the cycloaddition reaction, and the presence of more active sites, as characterized by the master isotherm approach, is a more important feature for high-performance catalyst development.
Pore size distributions (PSDs)
The pore size distributions (PSDs) of defective and pristine MOFs were characterized based on the experimental and simulated N2 adsorption isotherm data. PSDs of materials are typically characterized using different methods, depending on the size of the pores and the heterogeneity of pore surfaces. The 2D non-local density functional theory (2D-NLDFT) method,73 as implemented in SAIEUS 3.0 software (Micromeritics, GA),74 was used to evaluate the pore size distributions of pristine and defective MOFs. The 2D-NLDFT method requires the user to select a proper kernel. For the kernel selection, carbon and N2 at 77 K kernel was chosen since this kernel provides the best agreement when compared with the geometric PSD result calculated using zeo++ (Fig. S8†).75,76 All the simulated structures were first analyzed with the 2D-NLDFT method (Fig. S9 and S10†) to provide a basis for the comparison. Fig. 5 shows the 2D-NLDFT PSD result from the constructed master model and experimental isotherms. In general, the master model-based isotherms (i.e., simulated isotherms) provide reasonable agreement with experimental isotherms in terms of the location and number of peaks. For MOF-801(D), the PSD showed two peaks of larger pore sizes (∼10 and ∼12 angstrom) from the master model and experimental isotherms, whereas there was only a single small pore size (∼7 angstrom) in MOF-801(P). Note that the large pore allows for faster mass transfer of the reactants into the pore, which can subsequently lead to the higher catalytic performance of defective MOF-801(D).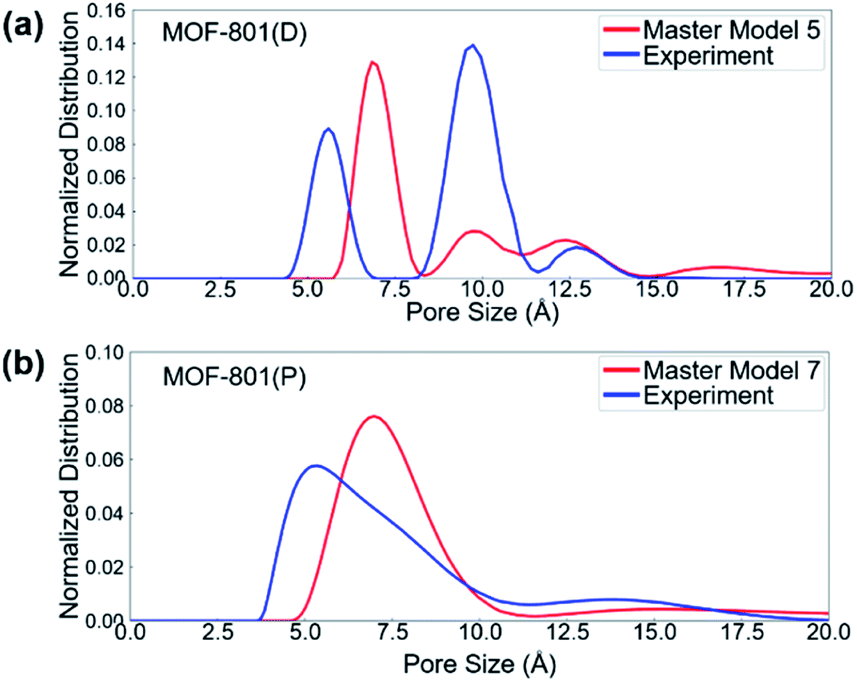 | ||
| Fig. 5 2D-NLDFT result for (a) MOF-801(D), and (b) MOF-801(P) with the master isotherm model. | ||
Cycloaddition of epichlorohydrin with CO2
To evaluate the catalytic performances of MOF-801(D) and MOF-801(P), epichlorohydrin (ECH) was used as the reactant to perform the CO2 cycloaddition reaction for the synthesis of chloropropene carbonate. At first, an appropriate weight of the synthesized MOF-801 catalyst was taken in an autoclave reactor, and the reaction conditions were changed suitably. Under the catalyst-less conditions, the CO2 cycloaddition reaction did not occur even after 15 hours of reaction time at 80 °C and atmospheric CO2 pressure (Table 4, entry 1). The homogeneous catalysts (metal salt and organic ligand) were tested for their respective catalytic activities and ECH converted much lower chloropropene carbonate as the final product (Table 4, entries 2–3). Without a co-catalyst, each MOF-801(D) and MOF-801(P) showed very low ECH conversion under the above conditions (Table 4, entries 4–5). We used tetrabutylammonium halide (TBAX, X = Cl−, Br−, I−) as the co-catalyst to increase the reactivity. The experiments using TBABr alone showed a relatively low conversion (38.9%), but when the catalysts and TBABr were used together, the conversion was significantly increased (Table 4, entries 7–10). This is likely due to the synergistic effect between the MOF catalyst and the co-catalysts in performing the reaction, which has been well-documented in the literature. Comparing the cycloaddition reactions using MOF-801(D) and MOF-801(P) as catalysts, MOF-801(D) leads to a higher conversion (Table 4, entry 7, 92.4%) due to the additional acidic sites (epoxide activation) from undercoordinated zirconium nodes, and pores with >10 angstrom diameter which allows for accelerated mass transfer of reactants. Among different tetrabutylammonium halide cocatalysts (TBABr, TBACl, and TBAI), showing the order of nucleophilicity of anions as I− > Br− > Cl−, bromine anions revealed higher catalytic performance than chloride and iodide anions. Because of the bulky structure of iodide anions, MOF-801(D) with tetrabutylammonium iodide (TBAI) showed lower ECH conversion (77%) than with TBABr due to the mass transfer limitation effect (Table 4, entries 10–12).| Entry | Catalysts | Conversionc (%) | Selectivityc (%) |
|---|---|---|---|
| a Reaction conditions: epichlorohydrin (ECH) = 19.2 mmol, catalyst amount = 0.6 mol%, TBAB = 0.5 mol%, pressure = 0.1 MPa CO2, temperature = 80 °C time = 15 h, semi-batch reaction. b Catalyst amount = 0.4 mol% and TBAB = 0.4 mol%. c Determined by GC. | |||
| 1 | None | — | — |
| 2 | Zirconium salt | 1.52 | 94 |
| 3 | Zr salt/fumaric acid | 1.71 | 96 |
| 4 | MOF-801(P) | 2.13 | >99 |
| 5 | MOF-801(D) | 3.08 | >99 |
| 6 | TBAB | 38.9 | >99 |
| 7 | MOF-801(P)/TBABrb | 70.3 | >99 |
| 8 | MOF-801(D)/TBABrb | 78.8 | >99 |
| 9 | MOF-801(P)/TBABr | 83.1 | >99 |
| 10 | MOF-801(D)/TBABr | 92.4 | >99 |
| 11 | MOF-801(D)/TBACl | 86.5 | >99 |
| 12 | MOF-801(D)/TBAI | 77.0 | >99 |
We further investigated the effects of various reaction parameters, such as the catalyst amount, temperature, reaction time, and CO2 pressure that lead to higher conversion in the CO2 cycloaddition reaction of CO2 and ECH. As shown in Fig. 6, the conversion of ECH monotonically increases with increasing temperature, pressure, and reaction time, and no longer increases at certain points. Therefore, the optimum operating conditions are selected as 0.6 mol% of MOF-801(D) and 0.5 mol% of the TBABr co-catalyst, at a reaction temperature of 80 °C, under atmospheric CO2 pressure (0.1 MPa), and with a reaction time of 15 hours.
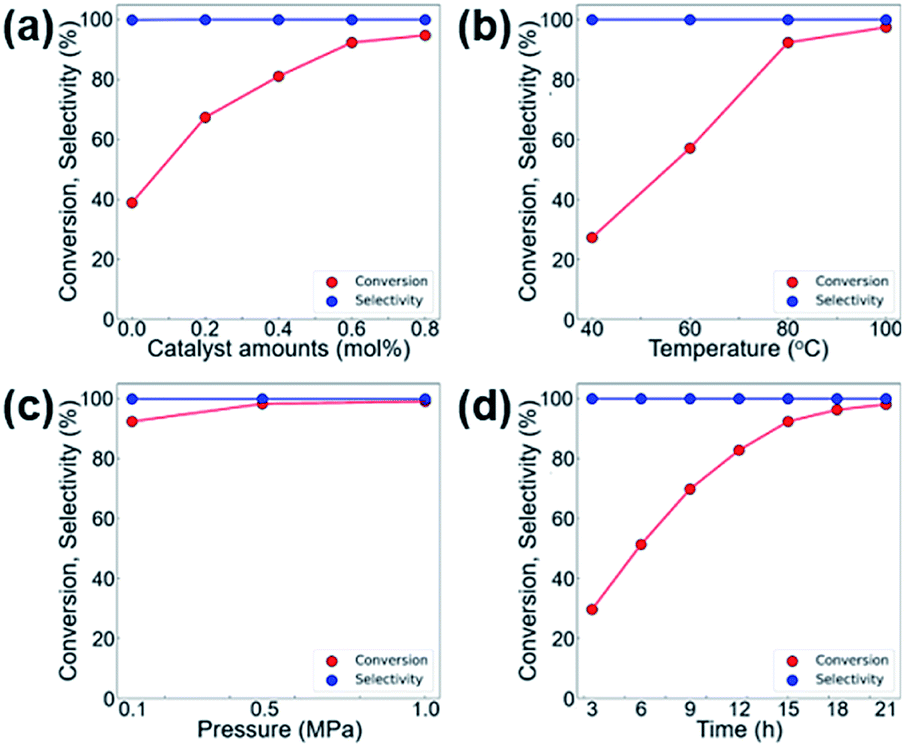 | ||
| Fig. 6 Effect of various reaction parameters on the cycloaddition of CO2 and ECH with MOF-801(D) catalysts (a) catalyst amount (co-catalyst 0.5 mol%, 80 °C, 15 h, 0.1 MPa CO2), (b) temperature (catalyst 0.6 mol%, co-catalyst 0.5 mol%, 15 h, 0.1 MPa CO2), (c) CO2 pressure (catalyst 0.6 mol%, co-catalyst 0.5 mol%, 80 °C, 15 h), and (d) time (catalyst 0.6 mol%, co-catalyst 0.5 mol%, 80 °C, 0.1 MPa CO2). | ||
Catalyst activity with different epoxides
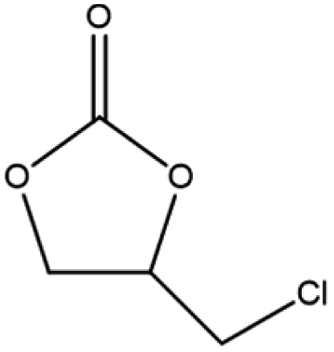
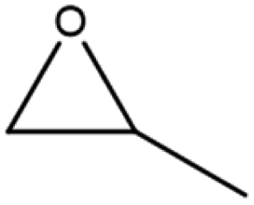
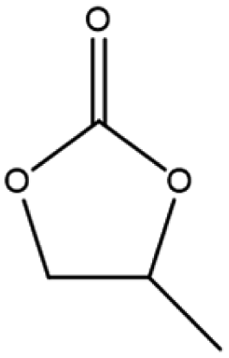
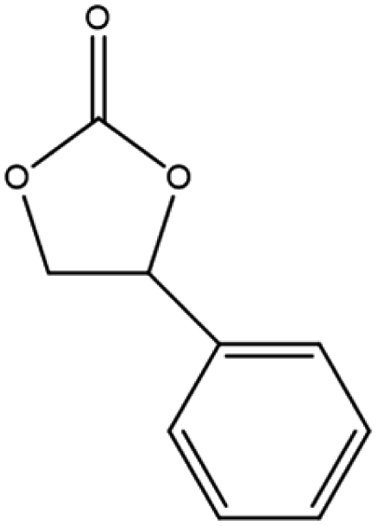
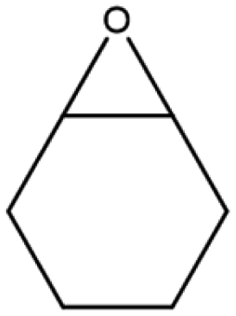
The activity of the MOF-801(D) catalyst was tested for several different epoxides for the cycloaddition reaction with CO2 under the optimized reaction conditions. As shown in Table 5, the MOF-801(D) and TBABr co-catalyst system could transform all the epoxides (epichlorohydrin, propylene oxide, allyl glycidyl ether, styrene oxide, and cyclohexene oxide) to their corresponding cyclic carbonates. Good conversion of epoxide was observed for epichlorohydrin (92.4%), allyl glycidyl ether (82.3%), propylene oxide (70.8%), and styrene oxide (87.1%) with >99% selectivity of the carbonate product. However, cyclohexene oxide revealed relatively low conversion (14.3%), likely due to the presence of the sterically hindered cyclohexene ring, which prevents the approach of the substrate toward the catalytic acidic site of the catalyst,77–79 and likely due to the small pore size of the material that prevents the reactant from diffusing through the internal surface of MOFs.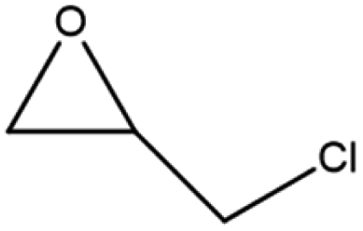


Catalyst separation and reusability
After simple separation using a centrifuge (7000 rpm), the reusability of the MOF-801(D) catalyst was tested by repeating the same experiments five times with the same catalyst materials to verify the integrity of the catalyst under the optimized reaction conditions (0.6 mol% of MOF-801(D), 0.5 mol% of TBABr, 80 °C, 15 h, atmospheric CO2 pressure). As shown in Fig. 7, there was no significant decrease in ECH conversion and chloropropene carbonate selectivity. The reused MOF-801(D) catalyst was subsequently analyzed through various physico-chemical analyses such as PXRD and FT-IR. The PXRD patterns and FT-IR spectra of MOF-801(D) show that the catalyst remains stable even after recycling up to five times (Fig. S11 and S12†).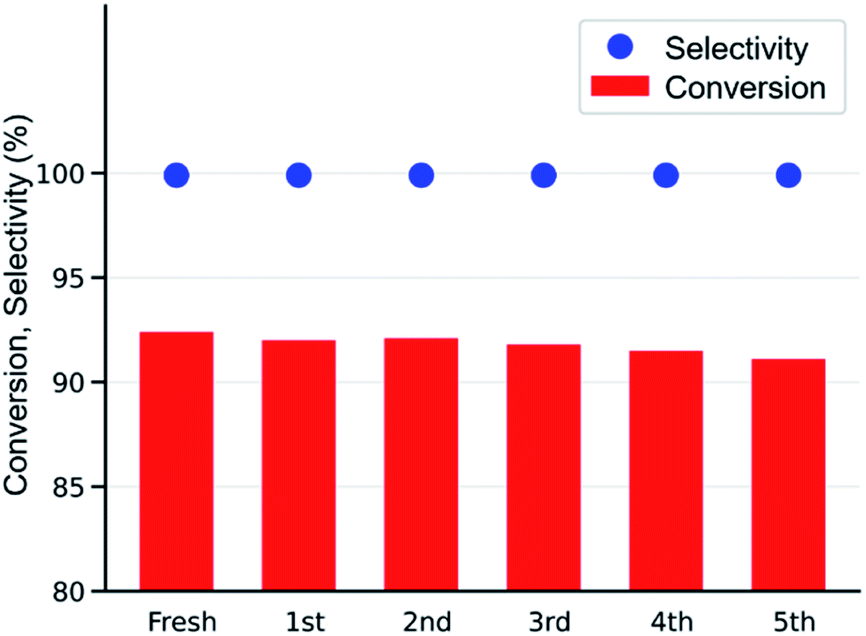 | ||
| Fig. 7 Reusability test of the MOF-801(D) catalyst (ECH 19.2 mmol, catalysts 0.6 mol%, TBABr 0.5 mol%, 80 °C, 15 h, 0.1 MPa, semi-batch). | ||
Reaction mechanism
The cycloaddition reaction mechanism between CO2 and epichlorohydrin (ECH) to form chloropropene carbonate catalyzed by defective MOF-801 and co-catalyzed by TBABr was investigated using density functional theory (DFT) calculations. Fig. 8 provides the relative potential energy profile along with the optimized structures of intermediates and transition states. Initially, the uncatalyzed reaction mechanism was performed (Fig. S13†). The uncatalyzed reaction has an activation barrier of 60.2 kcal mol−1 which suggests the importance of the catalyst. | ||
| Fig. 8 Relative energy profile for the MOF-801/TBABr catalyzed cycloaddition reaction of CO2 with ECH to form chloropropene carbonate and the DFT optimized structures of intermediates and transition states. | ||
A plausible reaction mechanism for the cycloaddition of epoxides with CO2 in the presence of MOF-801(D) and the co-catalyst TBABr was formulated based on the previous experimental and simulation studies.13,78 According to our TPD results (Table 1), MOF-801(D) has strong acidic sites which served as active centers for the cycloaddition reaction. The reaction mechanism for the cycloaddition reaction typically involves three steps consisting of the epoxide ring-opening, CO2 insertion and the carbonate ring-closure. TBABr provides a nucleophilic reagent, Br− for the reaction. Fig. S14† shows the reaction mechanism with only TBABr as a comparison. In the first step, the oxygen atom of epoxides is activated by the unsaturated metal center of MOF-801(D). Here, ECH is coordinated on the unsaturated Zr site to generate a stable Int0 (−40.3 kcal mol−1). Consequently, the bromide anion of TBABr attacks the less hindered carbon atom to form a weak van der Waals complex (Int1) with a relative energy of −42.8 kcal mol−1.
The ring-opening occurs through TS1 where the nucleophilic attack of bromide results in the epoxide ring opening (Int2). The activation energy (Ea) for the ring-opening step is 15.3 kcal mol−1 which is less than half of the activation energy required for the TBABr catalyzed step (Fig. S14,†Ea = 34.9 kcal mol−1). Subsequently, the O− of the opened ring attacks the carbon atom of the carbon dioxide molecule through TS2, with an activation energy of 13.8 kcal mol−1, whereas for the TBABr catalyzed CO2 insertion barrier it is 20.4 kcal mol−1 (Fig. S14†). The resulting intermediate, Int3 has a relative energy of −45.2 kcal mol−1. Finally, the ring closure occurs through TS3 (Ea = 12.0 kcal mol−1) where the formation of the O–C bond and consequent removal of the bromide anion happen leading to the formation of the product, chloropropene carbonate. The high activation energy (Ea = 39.1 kcal mol−1) required for the typical ring closure step in the TBABr catalyzed reaction was significantly reduced using MOF-801(D) as a catalyst. The overall mechanism proves the efficacy of MOF-801 as an excellent catalyst in converting CO2 and epoxide to cyclic carbonates.
Conclusions
A pristine zirconium-fumarate MOF (MOF-801(P)) and its defective analogue (MOF-801(D)) were synthesized and compared for their catalytic performance for the cycloaddition reaction of epichlorohydrin and CO2. MOF-801(D) with the TBABr co-catalyst showed over 92% of ECH conversion with >99% of chloropropene carbonate selectivity at 80 °C under atmospheric pressure of CO2 without using any solvent. The nature of defects was characterized through combined experimental and simulation methods. Among the two types of defects in Zr-MOFs, we found that the two types of missing cluster defect models best matched the experimental data. The higher catalytic performance of MOF-801(D) over MOF-801(P) comes from the high surface area, presence of dual pores and missing cluster defects, and higher amounts of acidic sites due to the presence of open metal sites.Experimental
Chemicals
Zirconyl chloride octahydrate (ZrOCl2·8H2O, 98%, reagent grade), fumaric acid (≥99.0%, purum), formic acid (≥96%, ACS reagent), methanol (99.8%, anhydrous), epichlorohydrin (ECH, ≥99%, purum), propylene oxide (PO, ≥99.5%, puriss. p.a.), styrene oxide (SO, 97%), allyl glycidyl ether (AGE, ≥99%), and cyclohexene oxide (CHO, 98%) were obtained from Sigma-Aldrich. N,N′-Dimethylformamide (DMF, >99.5%) was purchased from Tokyo Chemical Industry (TCI). All synthesis materials and solvents were used without further purification.Preparation of MOF-801(D, defective)
MOF-801(D) was prepared according to the reported synthesis method.67 For the synthesis of MOF-801(D), 16 g of (50 mmol) ZrOCl2·8H2O and 5.8 g (50 mmol) of fumaric acid were dissolved in a blend of DMF/formic acid (200 mL/70 mL) in a 500 mL glass jar. The glass jar was sealed and heated at 130 °C for 6 h. Pure white crystals were obtained and rinsed 3 times with DMF after cooling to room temperature. The as formed MOF-801(D) was washed with DMF 3 times a day for 3 days and soaked in methanol for 3 days. Methanol was exchanged 3 times per day. The white crystal was dried under vacuum conditions at 120 °C for 24 h.Preparation of MOF-801(P, pristine)
For the synthesis of MOF-801(P),67 in a 60 mL glass jar, 0.23 g (0.7 mmol) of ZrOCl2·8H2O and 0.081 g (0.7 mmol) of fumaric acid were dissolved in a mixture of DMF/formic acid (35 mL/5.3 mL). The glass jar was fastened and placed in a 120 °C oven for 24 h. Pure white crystals were obtained and rinsed 3 times with DMF after cooling to room temperature. The synthesized MOF-801(P) was washed with DMF 3 times per day for 3 days and soaked in methanol for 3 days. Methanol was also exchanged 3 times per day. The white crystal was dried in a vacuum oven at 120 °C for 24 h.Cycloaddition of CO2 and epoxides
All the CO2 cycloaddition reactions were carried out in a 25 mL stainless steel reactor filled with a suitable amount of the catalyst, the co-catalyst, and epoxides. The reactor was kept connected to a CO2 tank and stirred at 600 rpm. After the reaction finished, the reactor was cooled to reach room temperature, and the remaining CO2 was released into the atmosphere. The final products were analyzed using gas chromatography (GC, HP 7890A, Agilent technologies, flame ionization detector, HP-5 capillary column) to determine the conversion, selectivity, and yields. Dichloromethane was used as the internal standard.Computational methods
GCMC simulations were carried out to calculate the N2 isotherms at 77 K and CO2 adsorption at 298 K for pristine and defective structures. All the GCMC simulation pressure points were taken to the exact same points as in the experimental isotherm data. For N2 isotherms, we calculated the uptake at 73 pressure points for the MOF-801(D) case (1.12 × 10⁻⁶ bar to 0.99 bar) and 68 pressure points for MOF-801(P) (from 9.7 × 10⁻⁷ bar up to 0.99 bar). The GCMC simulation consisted of 20![[thin space (1/6-em)]](https://www.rsc.org/images/entities/char_2009.gif) 000 cycles for equilibration and 20000 cycles for the ensemble averages. Translation, rotation, reinsertion, and swap Monte Carlo moves were set with equal probabilities for sampling. The TraPPE model was used to model N2 and CO2 molecules.82 For N2 isotherm calculations, only the van der Waals interactions were accounted for in the simulations, while both electrostatic interactions and van der Waals interactions were considered for CO2 isotherm calculations. For van der Waals interactions, the Lennard–Jones 12–6 potential function was used to model the interaction with 12.8 angstrom cutoffs for framework-adsorbate and adsorbate–adsorbate interactions. For electrostatic interactions, the famous Ewald summation methods were used with summation of both reciprocal and real space parts up to 10−5 precision. RASPA 2.0 open-source software was used to carry out all GCMC simulations.83
000 cycles for equilibration and 20000 cycles for the ensemble averages. Translation, rotation, reinsertion, and swap Monte Carlo moves were set with equal probabilities for sampling. The TraPPE model was used to model N2 and CO2 molecules.82 For N2 isotherm calculations, only the van der Waals interactions were accounted for in the simulations, while both electrostatic interactions and van der Waals interactions were considered for CO2 isotherm calculations. For van der Waals interactions, the Lennard–Jones 12–6 potential function was used to model the interaction with 12.8 angstrom cutoffs for framework-adsorbate and adsorbate–adsorbate interactions. For electrostatic interactions, the famous Ewald summation methods were used with summation of both reciprocal and real space parts up to 10−5 precision. RASPA 2.0 open-source software was used to carry out all GCMC simulations.83
Author contributions
Conceptualization, investigation, and methodology: Y. G., B. A. A., and Y. G. C.; writing – original draft preparation: Y. G.; investigation and data curation: S. Y.; writing, review and editing, Y. C., and Y. G .C.; supervision: Y. G. C., and D. W. P. All authors have read and agreed to the published version of the manuscript.Conflicts of interest
There are no conflicts to declare.Acknowledgements
This work was supported by the National Research Foundation of Korea through the Basic Research Program (2019R1I1A3A01057644), and supported by the National Research Foundation of Korea (NRF) grant funded by the Korea government (MSTI) (No. 2020R1C1C1010373). This study has been conducted with the support of the Korea Institute of Industrial Technology (KITECH) as “Development of AI Platform Technology for Smart Chemical Preocess” (JH210005-01). This work was also partially supported by the Industrial Strategic Technology Development Program-Alchemist Project (20012383, Technical Development of Hydrogen Production from Green Ammonia) funded by the Ministry of Trade, Industry & Energy (MOTIE, Korea). The authors acknowledge the computational time provided by the Korea Institute of Science and Technology Information (KISTI) (KSC-2021-CRE-0066). The authors also thank to J. Cha for performing simulations.Notes and references
- K. Sumida, D. L. Rogow, J. A. Mason, T. M. McDonald, E. D. Bloch, Z. R. Herm, T.-H. Bae and J. R. Long, Chem. Rev., 2012, 112, 724–781 CrossRef CAS PubMed.
- M. Aresta, A. Dibenedetto and A. Angelini, Chem. Rev., 2014, 114, 1709–1742 CrossRef CAS PubMed.
- P. Markewitz, W. Kuckshinrichs, W. Leitner, J. Linssen, P. Zapp, R. Bongartz, A. Schreiber and T. E. Müller, Energy Environ. Sci., 2012, 5, 7281–7305 RSC.
- M. Cokoja, M. E. Wilhelm, M. H. Anthofer, W. A. Herrmann and F. E. Kühn, ChemSusChem, 2015, 8, 2436–2454 CrossRef CAS PubMed.
- A. Rehman, F. Saleem, F. Javed, A. Ikhlaq, S. W. Ahmad and A. Harvey, J. Environ. Chem. Eng., 2021, 9, 105113 CrossRef CAS.
- J. F. Kurisingal, Y. Rachuri, Y. Gu, G.-H. Kim and D.-W. Park, Appl. Catal., A, 2019, 571, 1–11 CrossRef CAS.
- B. Scrosati, J. Hassoun and Y.-K. Sun, Energy Environ. Sci., 2011, 4, 3287–3295 RSC.
- K. D. Fulfer and D. G. Kuroda, J. Phys. Chem. C, 2016, 120, 24011–24022 CrossRef CAS.
- S. Gennen, B. Grignard, T. Tassaing, C. Jérôme and C. Detrembleur, Angew. Chem., 2017, 129, 10530–10534 CrossRef.
- A. Pascual, J. P. Tan, A. Yuen, J. M. Chan, D. J. Coady, D. Mecerreyes, J. L. Hedrick, Y. Y. Yang and H. Sardon, Biomacromolecules, 2015, 16, 1169–1178 CrossRef CAS PubMed.
- F. Shi, Y. Deng, T. SiMa, J. Peng, Y. Gu and B. Qiao, Angew. Chem., 2003, 115, 3379–3382 CrossRef.
- H. Xiong, X. Wei, D. Zhou, Y. Qi, Z. Xie, X. Chen, X. Jing and Y. Huang, Bioconjugate Chem., 2016, 27, 2214–2223 CrossRef CAS PubMed.
- J. F. Kurisingal, Y. Li, Y. Sagynbayeva, R. K. Chitumalla, S. Vuppala, Y. Rachuri, Y. Gu, J. Jang and D.-W. Park, Catal. Today, 2020, 352, 227–236 CrossRef.
- E. Koohestanian, J. Sadeghi, D. Mohebbi-Kalhori, F. Shahraki and A. Samimi, Energy, 2018, 144, 279–285 CrossRef CAS.
- J. W. Lee and R. Li, Energy Convers. Manage., 2003, 44, 1535–1546 CrossRef CAS.
- J. F. Kurisingal, Y. Rachuri, R. S. Pillai, Y. Gu, Y. Choe and D.-W. Park, ChemSusChem, 2019, 12, 1033–1042 CrossRef CAS PubMed.
- H.-Y. Li, S.-N. Zhao, S.-Q. Zang and J. Li, Chem. Soc. Rev., 2020, 49, 6364–6401 RSC.
- A. Bieniek, A. P. Terzyk, M. Wiśniewski, K. Roszek, P. Kowalczyk, L. Sarkisov, S. Keskin and K. Kaneko, Prog. Mater. Sci., 2020, 117, 100743 CrossRef.
- Y.-S. Wei, X.-P. Hu, Z. Han, X.-Y. Dong, S.-Q. Zang and T. C. Mak, J. Am. Chem. Soc., 2017, 139, 3505–3512 CrossRef CAS PubMed.
- H. Bux, C. Chmelik, R. Krishna and J. Caro, J. Membr. Sci., 2011, 369, 284–289 CrossRef CAS.
- R. Zou, P. Z. Li, Y. F. Zeng, J. Liu, R. Zhao, H. Duan, Z. Luo, J. C. Wang, R. Zou and Y. Zhao, Small, 2016, 12, 2334–2343 CrossRef CAS PubMed.
- Y. H. han, Z. Y. Zhou, C. B. Tiana and S. W. Du, Green Chem., 2016, 18, 4086–4091 RSC.
- L. Yang, L. Yu, G. Diao, M. Sun, G. Cheng and S. Chen, J. Mol. Catal. A: Chem., 2014, 392, 278–283 CrossRef CAS.
- J. Song, Z. Zhang, S. Hu, T. Wu, T. Jiang and B. Han, Green Chem., 2009, 3, 1031–1036 RSC.
- J. Kim, S. Kim, H. Jang, G. Seo and W. S. Ahn, Appl. Catal., A, 2013, 453, 175–180 CrossRef CAS.
- D. A. Yang, H. Y. Cho, J. Kim, S. T. Yang and W. S. Ahn, Energy Environ. Sci., 2012, 5, 6465–6473 RSC.
- Y. Ren, X. Cheng, S. Yang, C. Qi, H. Jiang and Q. Mao, Dalton Trans., 2013, 42, 9930–9937 RSC.
- A. J. Howarth, Y. Liu, P. Li, Z. Li, T. C. Wang, J. T. Hupp and O. K. Fraha, Nat. Rev. Mater., 2016, 1, 15018 CrossRef CAS.
- Y. Gu, C.-H. Lee, D.-W. Park and D.-H. Lim, Nanosci. Nanotechnol. Lett., 2018, 10, 1088–1094 CrossRef.
- S. Zuluaga, E. M. Fuentes-Fernandez, K. Tan, F. Xu, J. Li, Y. J. Chabal and T. Thonhauser, J. Mater. Chem. A, 2016, 4, 5176–5183 RSC.
- G. Wißmann, A. Schaate, S. Lilienthal, I. Bremer, A. M. Schneider and P. Behrens, Microporous Mesoporous Mater., 2012, 152, 64–70 CrossRef.
- L. Yang, K. B. Idrees, Z. Chen, J. Knapp, Y. Chen, X. Wang, R. Cao, X. Zhang, H. Xing and T. Islamoglu, ACS Appl. Nano Mater., 2021, 4, 4346–4350 CrossRef CAS.
- Z. Li, F. Liao, F. Jiang, B. Liu, S. Ban, G. Chen, C. Sun, P. Xiao and Y. Sun, Fluid Phase Equilib., 2016, 427, 259–267 CrossRef CAS.
- H.-M. Jeong, R. Roshan, R. Babu, H.-J. Kim and D.-W. Park, Korean J. Chem. Eng., 2018, 35, 438–444 CrossRef CAS.
- J. H. Cavka, S. Jakobsen, U. Olsbye, N. Guillou, C. Lamberti, S. Bordiga and K. P. Lillerud, J. Am. Chem. Soc., 2008, 130, 13850–13851 CrossRef PubMed.
- F. Vermoortele, B. Bueken, G. Le Bars, B. Van de Voorde, M. Vandichel, K. Houthoofd, A. Vimont, M. Daturi, M. Waroquier and V. Van Speybroeck, J. Am. Chem. Soc., 2013, 135, 11465–11468 CrossRef CAS PubMed.
- M. Pander, M. Janeta and W. Bury, ACS Appl. Mater. Interfaces, 2021, 13, 8344–8352 CrossRef CAS PubMed.
- S. Diring, S. Furukawa, Y. Takashima, T. Tsuruoka and S. Kitagawa, Chem. Mater., 2010, 22, 4531–4538 CrossRef CAS.
- T. Tsuruoka, S. Furukawa, Y. Takashima, K. Yoshida, S. Isoda and S. Kitagawa, Angew. Chem., Int. Ed., 2009, 121, 4833–4837 CrossRef.
- A. Schaate, P. Roy, A. Godt, J. Lippke, F. Waltz, M. Wiebcke and P. Behrens, Chem.–Eur. J., 2011, 17, 6643–6651 CrossRef CAS PubMed.
- C. Xie, D. Yan, S. Du, W. Chen, Y. Wang, Y. Zou, R. Chen and S. Wang, ACS Catal., 2020, 10, 11082–11098 CrossRef CAS.
- S. M. J. Rogge, J. Wieme, L. Vanduyfhuys, S. Vandenbrande, G. Maurin, T. Verstraelen, M. Waroquier and V. Van Speybroeck, Chem. Mater., 2016, 28, 5721–5732 CrossRef CAS PubMed.
- J. Canivet, M. Vandichel and D. Farrusseng, Dalton Trans., 2016, 45, 4090–4099 RSC.
- Y. Liu, R. C. Klet, J. T. Hupp and O. K. Farha, Chem. Commun., 2016, 52, 7806–7809 RSC.
- C. A. Trickett, K. J. Gagnon, S. Lee, G. Gandara, H. B. Buergi and O. M. Yagi, Angew. Chem., Int. Ed., 2015, 54, 1162–1167 CrossRef PubMed.
- M. Taddei, Coord. Chem. Rev., 2017, 343, 1–24 CrossRef CAS.
- L. Liu, Z. Chen, J. Wang, D. Zhang, Y. Zhu, S. ling, K. W. Hwang, Y. Belmabkhout, K. Adil, Y. Zhang, B. Slater, M. Eddaoudi and Y. Han, Nat. Chem., 2019, 11, 622–628 CrossRef CAS PubMed.
- U. Ravon, M. E. Domine, C. Gaudillere, A. Desmartin-Chomel and D. Farrusseng, New J. Chem., 2008, 32, 937–940 RSC.
- J. T. Ren, Y. Yali and Z. Y. Yuan, Green Energy Environ., 2021, 6, 620–643 CrossRef.
- Z. Xu, J. Gao, L. Shi and Z. Bian, Trans. Tianjin Univ., 2021, 27, 147–154 CrossRef CAS.
- M. Y. Gao, B. Q. Song, D. Sensharma and M. J. Zaworotko, SmartMat, 2021, 2, 38–55 CrossRef.
- K. Tan, H. Pandey, H. Wang, E. Velasco, K. Y. Wang, H. C. Zhou, J. Li and T. Thonhauser, J. Am. Chem. Soc., 2021, 143, 6328–6332 CrossRef CAS PubMed.
- M. Vandichel, J. Hajek, F. Vermoortele, M. Waroquier, D. E. De Vos and V. Van Speybroeck, CrystEngComm, 2015, 17, 395–406 RSC.
- S. L. Ling and B. Slater, Chem. Sci., 2016, 7, 4706–4712 RSC.
- F. Vermoortele, M. Vandichel, B. Van de Voorde, R. Ameloot, M. Waroquier, V. Van Speybroeck and D. E. De Vos, Angew. Chem., Int. Ed., 2012, 51, 4887–4890 CrossRef CAS PubMed.
- J. B. DeCoste, G. W. Peterson, H. Jasuja, T. G. Glover, Y.-g. Huang and K. S. Walton, J. Mater. Chem. A, 2013, 1, 5642–5650 RSC.
- G. C. Shearer, S. Chavan, S. Bordiga, S. Svelle, U. Olsbye and K. P. Lillerud, Chem. Mater., 2016, 28, 3749–3761 CrossRef CAS.
- F. C. Firth, M. J. Cliffe, D. Vulpe, M. Aragones-Anglada, P. Z. Moghadam, D. Fairen-Jimenez, B. Slater and C. P. Grey, J. Mater. Chem. A, 2019, 7, 7459–7469 RSC.
- J. Winarta, B. Shan, S. M. Mcintyre, L. Ye, C. Wang, J. Liu and B. Mu, Cryst. Growth Des., 2019, 20, 1347–1362 CrossRef.
- H. Wu, Y. S. Chua, V. Krungleviciute, M. Tyagi, P. Chen, T. Yildirim and W. Zhou, J. Am. Chem. Soc., 2013, 135, 10525–10532 CrossRef CAS PubMed.
- O. V. Gutov, M. G. Hevia, E. C. Escudero-Adan and A. Shafir, Inorg. Chem., 2015, 54, 8396–8400 CrossRef CAS PubMed.
- P. Horcajada, S. Surblé, C. Serre, D.-Y. Hong, Y.-K. Seo, J.-S. Chang, J.-M. Grenèche, I. Margiolaki and G. Férey, Chem. Commun., 2007, 2820–2822 RSC.
- L. Huang, H. Wang, J. Chen, Z. Wang, J. Sun, D. Zhao and Y. Yan, Microporous Mesoporous Mater., 2003, 58, 105–114 CrossRef CAS.
- H.-H. Mautschke, F. Drache, I. Senkovska, S. Kaskel and F. L. i. Xamena, Catal. Sci. Technol., 2018, 8, 3610–3616 RSC.
- S. Marx, W. Kleist and A. Baiker, J. Catal., 2011, 281, 76–87 CrossRef CAS.
- L. H. Wee, T. Lescouet, J. Ethiraj, F. Bonino, R. Vidruk, E. Garrier, D. Packet, S. Bordiga, D. Farrusseng and M. Herskowitz, ChemCatChem, 2013, 5, 3562–3566 CrossRef CAS.
- H. Furukawa, F. Gandara, Y.-B. Zhang, J. Jiang, W. L. Queen, M. R. Hudson and O. M. Yaghi, J. Am. Chem. Soc., 2014, 136, 4369–4381 CrossRef CAS PubMed.
- J. Koo, I.-C. Hwang, X. Yu, S. Saha, Y. Kim and K. Kim, Chem. Sci., 2017, 8, 6799–6803 RSC.
- P. Iacomi, F. Formalik, J. Marreiros, J. Shang, J. Rogacka, A. Mohmeyer, P. Behrens, R. Ameloot, B. Kuchta and P. L. Llewellyn, Chem. Mater., 2019, 31, 8413–8423 CrossRef CAS.
- F. Ke, C. Peng, T. Zhang, M. Zhang, C. Zhou, H. Cai, J. Zhu and X. Wan, Sci. Rep., 2018, 8, 1–11 CAS.
- A. Datar, Y. G. Chung and L.-C. Lin, J. Phys. Chem. Lett., 2020, 11, 5412–5417 CrossRef CAS PubMed.
- J. Rouquerol, P. Llewellyn and F. Rouquerol, Stud. Surf. Sci. Catal., 2007, 160, 49–56 CrossRef CAS.
- J. Jagiello and J. P. Olivier, Carbon, 2013, 55, 70–80 CrossRef CAS.
- J. Jagiello, Langmuir, 1994, 10, 2778–2785 CrossRef CAS.
- T. F. Willems, C. H. Rycroft, M. Kazi, J. C. Meza and M. Haranczyk, Microporous Mesoporous Mater., 2012, 149, 134–141 CrossRef CAS.
- M. Pinheiro, R. L. Martin, C. H. Rycroft, A. Jones, E. Iglesia and M. Haranczyk, J. Mol. Graphics, 2013, 44, 208–219 CrossRef CAS PubMed.
- J. F. Kurisingal, Y. Rachuri, Y. Gu, Y. Choe and D.-W. Park, Chem. Eng. J., 2020, 386, 121700 CrossRef CAS.
- J. F. Kurisingal, Y. Rachuri, Y. Gu, R. K. Chitumalla, S. Vuppala, J. Jang, K. K. Bisht, E. Suresh and D.-W. Park, ACS Sustainable Chem. Eng., 2020, 8, 10822–10832 CAS.
- X. Yan, R. Fu, F. Liu, Y. Pan, X. Ding and G. He, Ind. Eng. Chem. Res., 2018, 57, 3195–3203 CrossRef CAS.
- A. Raza, A. Sturluson, C. M. Simon and X. Fern, J. Phys. Chem. C, 2020, 124, 19070–19082 CrossRef CAS.
- N. Prasetyo and F. I. Pambudi, Int. J. Hydrogen Energy, 2021, 46, 4222–4228 CrossRef CAS.
- J. J. Potoff and J. I. Siepmann, AIChE J., 2001, 47, 1676–1682 CrossRef CAS.
- D. Dubbeldam, S. Calero, D. E. Ellis and R. Q. Snurr, Mol. Simul., 2016, 42, 81–101 CrossRef CAS.
- P. Sinha, A. Datar, C. Jeong, X. Deng, Y. G. Chung and L.-C. Lin, J. Phys. Chem. C, 2019, 123, 20195–20209 CrossRef CAS.
- C. R. Harris, K. J. Millman, S. J. Walt, R. Gommers, P. Virtanen, D. Cournapeau, E. Wieser, J. Taylor, S. Berg, N. J. Smith, R. Kern, M. Picus, S. Hoyer, M. H. Kerkwijk, M. Brett, A. Haldane, J. F. Rio, M. Wiebe, P. Peterson, P. G. Marchant, K. Sheppard, T. Reddy, W. Weckesser, H. Abbasi, C. Gohlke and T. E. Oliphant, Nature, 2020, 585, 357–362 CrossRef CAS PubMed.
- M. J. Frisch, G. W. Trucks, H. B. Schlegel, G. E. Scuseria, M. A. Robb, J. R. Cheeseman, G. Scalmani, V. Barone, B. Mennucci, G. A. Petersson, H. Nakatsuji, M. Caricato, X. Li, H. P. Hratchian, A. F. Izmaylov, J. Bloino, G. Zheng, J. L. Sonnenberg, M. Hada, M. Ehara, K. Toyota, R. Fukuda, J. Hasegawa, M. Ishida, T. Nakajima, Y. Honda, O. Kitao, H. Nakai, T. Vreven, J. A. Montgomery, J. E. Peralta, F. Ogliaro, M. Bearpark, J. J. Heyd, E. Brothers, K. N. Kudin, V. N. Staroverov, T. Keith, R. Kobayashi, J. Normand, K. Raghavachari, A. Rendell, J. C. Burant, S. S. Iyengar, J. Tomasi, M. Cossi, N. Rega, J. M. Millam, M. Klene, J. E. Knox, J. B. Cross, V. Bakken, C. Adamo, J. Jaramillo, R. Gomperts, R. E. Stratmann, O. Yazyev, A. J. Austin, R. Cammi, C. Pomelli, J. W. Ochterski, R. L. Martin, K. Morokuma, V. G. Zakrzewski, G. A. Voth, P. Salvador, J. J. Dannenberg, S. Dapprich; A. D. Daniels, O. Farkas, J. B. Foresman; J. V. Ortiz, J. Cioslowski and D. J. Fox, Gaussian 16, Revision A.03, Gaussian Inc, Wallingford, CT, 2016 Search PubMed.
- P. J. Hay and W. R. Wadt, J. Chem. Phys., 1985, 82, 299–310 CrossRef CAS.
- Y. Rachuri, J. F. Kurisingal, R. K. Chitumalla, S. Vuppala, Y. Gu, J. Jang, Y. Choe, E. Suresh and D.-W. Park, Inorg. Chem., 2019, 58, 11389–11403 CrossRef CAS PubMed.
Footnote |
| † Electronic supplementary information (ESI) available: NH3 and CO2-TPD curves, FE-SEM images, HR-TEM images, TGA data, BET analysis, 2D-NLDFT and zeo++ PSD results, recycle characterization, and DFT results. See DOI: 10.1039/d2ta00503d |
| This journal is © The Royal Society of Chemistry 2022 |