
Constructing a conjugated bridge for efficient electron transport at the interface of an inorganic–organic hetero-junction†
Xujiao
Ma
a,
Zhong
Zhang
a,
Cheng
Zhang
a,
Xianghui
Ruan
a,
Qinghao
Meng
a,
Jiahui
Feng
a,
Fuli
Cai
a,
Yajie
Yang
a,
Naishun
Bu
 *b,
Shuyuan
Zhou
*c and
Ye
Yuan
*a
*b,
Shuyuan
Zhou
*c and
Ye
Yuan
*a
aKey Laboratory of Polyoxometalate and Reticular Material Chemistry of Ministry of Education, Northeast Normal University, Changchun 130024, China. E-mail: Yuany101@nenu.edu.cn
bSchool of Environmental Science, Liaoning University, Shenyang 110036, China. E-mail: bunaishun@lnu.edu.cn
cState Key Laboratory of NBC Protection for Civilian, Beijing102205, China. E-mail: zhoushuyuan@sklnbcpc.cn
First published on 14th February 2022
Abstract
The large barrier between the phase interfaces of heterojunction catalysts inhibits the electron transfer, resulting in a limited catalytic efficiency. Herein, amino-grafted carbon dots (CDs) were utilized as the building units for the preparation of a CD covalently doped porous polymer. Due to the formation of a conjugated bridge (C![[double bond, length as m-dash]](https://www.rsc.org/images/entities/char_e001.gif) N bond) with delocalized π-electrons, photo-generated electrons were quickly transferred from an organic semiconductor (N3-COF) to an inorganic semiconductor (CDs). Correspondingly, the improvement percentage for the H2 production rate of CD-N3-COF was 560% and 290% compared to that of the physically doped and single bond linked COF systems, respectively. This work provides significant inspiration for consciously regulating the bridge structure at the atomic-level to facilitate the electron transport for the preparation of high-performance heterojunction catalysts.
N bond) with delocalized π-electrons, photo-generated electrons were quickly transferred from an organic semiconductor (N3-COF) to an inorganic semiconductor (CDs). Correspondingly, the improvement percentage for the H2 production rate of CD-N3-COF was 560% and 290% compared to that of the physically doped and single bond linked COF systems, respectively. This work provides significant inspiration for consciously regulating the bridge structure at the atomic-level to facilitate the electron transport for the preparation of high-performance heterojunction catalysts.
 Ye Yuan | Ye Yuan obtained his bachelor’s degree in Applied Chemistry from Jilin University in 2010. He then joined the research group of Professor Guangshan Zhu for his further master's and PhD studies, mainly working on the targeted preparation of porous aromatic frameworks and their functionalization. After receiving his PhD degree in 2015, he began his academic career as an associate professor in the Department of Chemistry, Northeast Normal University, and was promoted to a Professor in 2020. His scientific research interests are focused on the development of molecularly imprinted porous aromatic frameworks for energy, biological and environmental-related applications, including uranium extraction, gas sorption and catalysis. |
Introduction
Photocatalytic conversion as a sustainable, green, and efficient approach has become a hot issue worldwide to overcome the environmental pollution and energy shortage originating from the consumption of traditional fossil fuels.1–5 Because of adequate energy supply and no carbon emission, it has great significance in the fields of pollutant degradation,6 hydrocarbon production,7–9 and antibacterial sterilization.10 Generally, there are several steps during a photocatalytic reaction including light absorption, photogenerated electron–hole pairs, electron–hole migration, and redox reactions.11–14 Therein, the electron–hole migration procedure plays a crucial role in photocatalytic performance, but it is commonly repressed due to the excitonic effect originating from the powerful Coulomb attraction between photogenerated electrons and holes.15,16 The problem is particularly acute in semiconductor–semiconductor (S–S) heterojunction based photocatalysts. Because of the confined electronic conductivity, the interfacial transport of the photoinduced charge is critically inhibited, especially for inorganic–organic heterostructure-based semiconductors, resulting in low electron transport efficiency and limited catalytic activity (Fig. 1A).17–19 By now, several methods have been proposed to overcome this issue such as assembly of aligned arrays,20,21 adjustment of intra-band electronic states,22–25 and construction of conducting networks.26–30 Nevertheless, the effect of electron transport is not satisfactory, due to a relatively large internal energy dissipation as the electron crosses the homogeneous/heterogeneous boundary.31–33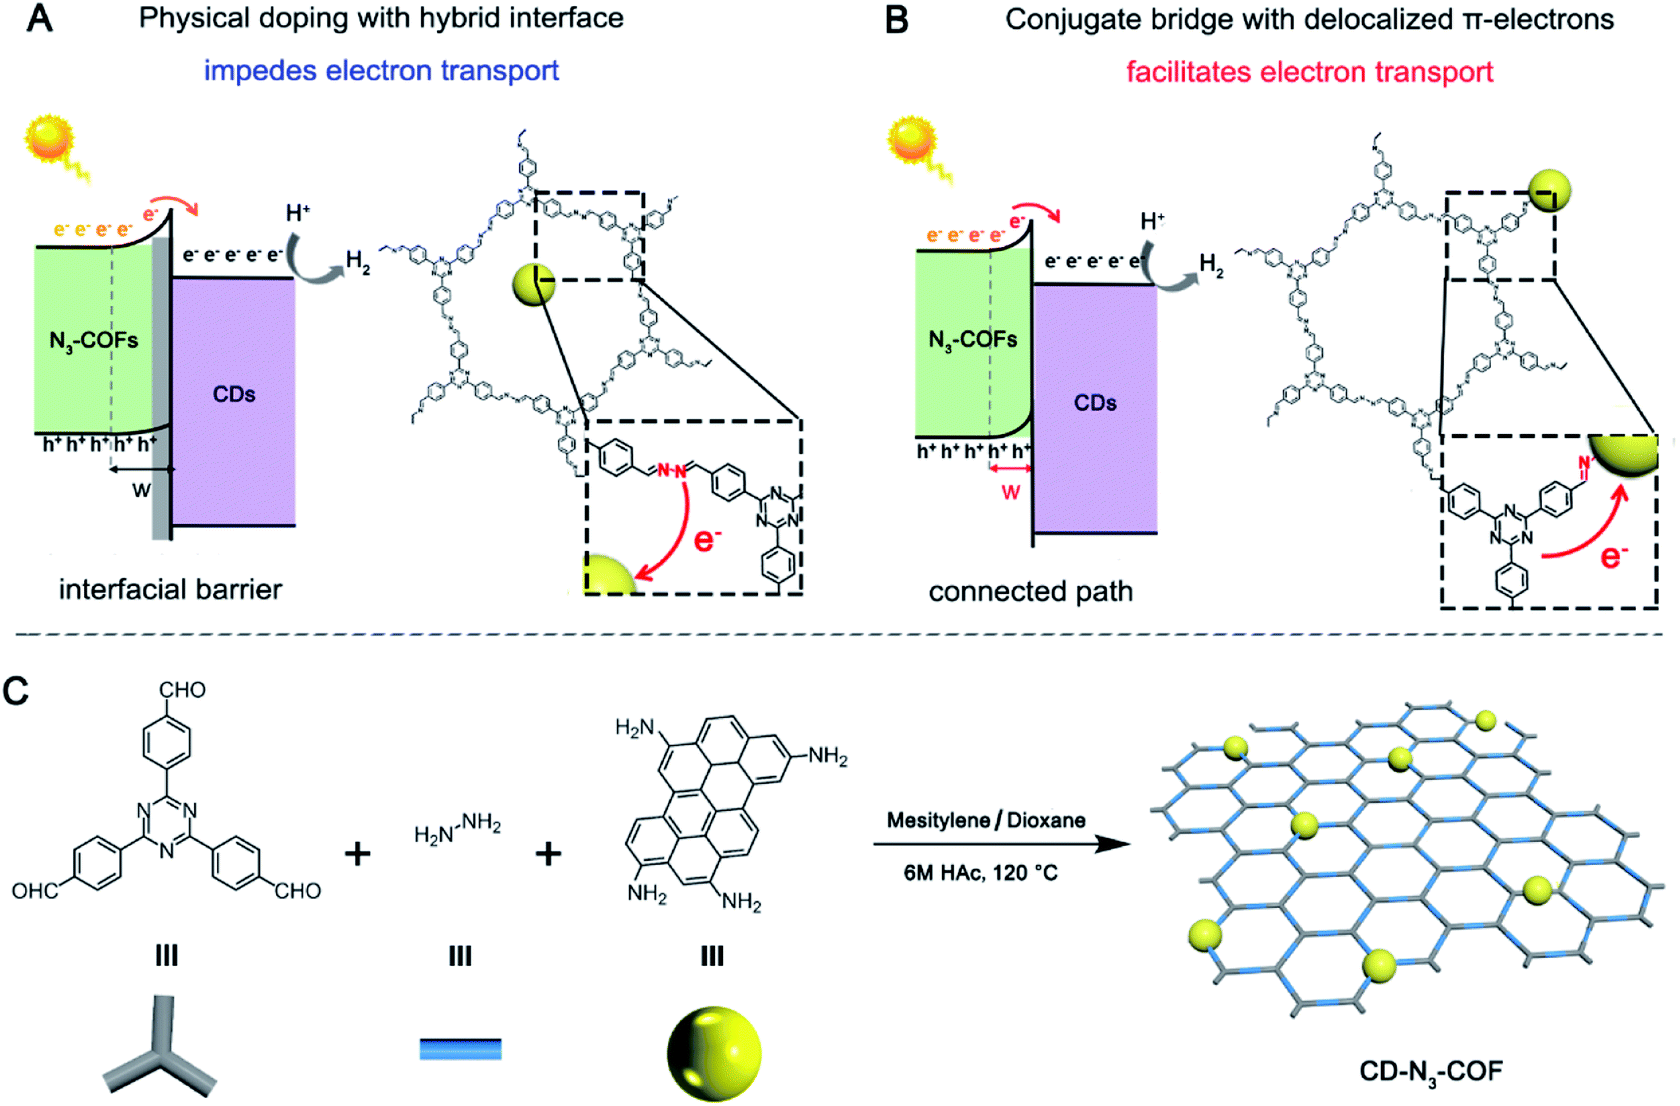 | ||
| Fig. 1 Schematic illustration of electron transfer at the physically doped (A) and conjugated bridged (B) interfaces of the S–S heterojunction. The synthetic route for inorganic–organic heterostructure-based catalyst, CD-N3-COFs (C). | ||
Covalent organic frameworks featuring a reversible coupling pattern reveal some excellent characteristics of high crystallinity, large porosity, and tuneable composition. These solids could be equipped with a controllable band gap and wide visible light absorption to serve as novel photocatalysts.34 Accordingly, previous reports focus on the introduction of photosensitive units into the porous networks, which is capable of improving light collection in the visible-light region and adjust the energy band structure.35–39 The open architecture could incorporate the guest semiconductor, and this sufficient contact facilitates the migration of electron–hole pairs between the inorganic–organic hetero-junction to some extent. Therefore, constructing a conjugated bridge with delocalized π-electrons between the inorganic–organic hetero-junction for electron transfer across the interface may become a promising strategy for enhanced photocatalytic activity, which is still a great challenge (Fig. 1B).
Herein, amino-grafted inorganic particles (carbon dots, CDs) with strong photoluminescence properties were utilized as the building units for copolymerization with 2,4,6-tris(4-formylphenyl)-1,3,5-triazine and hydrazine. Through a Schiff-base reaction, an imine bond (CN) with delocalized π-electrons was then obtained to connect the CD particles and N3-COF network, acting as a high-speed electron transport bridge. After comparison with physically doping and single bond linking (C–N) approaches, the photogenerated electrons of N3-COF are effectively transferred to the CD acceptor, leading to obviously increased photocatalytic activity (Fig. 1B).
Results and discussion
According to a previous report, amino group-grafted CD nano-particles (amino-CDs) are prepared from p-phenylenediamine in ethanol at 160 °C for 6 hours (Fig. S1†). CD covalently bonded COF frameworks are synthesized by copolymerization of amino-CDs with 2,4,6-tris(4-formylphenyl)-1,3,5-triazine and hydrazine catalyzed by 6 M acetic acid in a mesitylene/dioxane (1![[thin space (1/6-em)]](https://www.rsc.org/images/entities/char_2009.gif) :1) mixture at 120 °C for 3 days. The synthesis method is consistent with that of N3-COF (the synthetic diagram is depicted in Fig. 1C, and experimental details are provided in Fig. S2†). CD-N3-COF solids with different doping contents are denoted as xCD-N3-COF, where x represents the initial mass of amino-CDs involved in the reaction (x = 0.1, 0.2, 0.3, 0.5, and 1.0 mg). For comparison, both physically doping and single bond linking (C–N) approaches are adopted to prepare CD-based COF samples as the reference, denoted as CD@N3-COF and CD/N3-COF (Fig. S3†).
:1) mixture at 120 °C for 3 days. The synthesis method is consistent with that of N3-COF (the synthetic diagram is depicted in Fig. 1C, and experimental details are provided in Fig. S2†). CD-N3-COF solids with different doping contents are denoted as xCD-N3-COF, where x represents the initial mass of amino-CDs involved in the reaction (x = 0.1, 0.2, 0.3, 0.5, and 1.0 mg). For comparison, both physically doping and single bond linking (C–N) approaches are adopted to prepare CD-based COF samples as the reference, denoted as CD@N3-COF and CD/N3-COF (Fig. S3†).
The powder X-ray diffraction (PXRD) analysis of CD-N3-COFs shows a series of peaks at 6.0, 7.1, 9.5 and ∼26° corresponding to the reflections of (110), (120), (200) and (001) planes, respectively. Notably, the intense 100 reflection gradually shifts with the increase of the CD mass involved in the reaction from 3.50° for the parent N3-COF to 3.57° for 1.0CD@N3-COF (Fig. 2A). As for the physically doped sample, there is no shift for the 100 plane observed (Fig. S4†). This result is caused by the introduction of CD particles during the co-polymerization step that changes the microscopic structure of the COF network, proving the successful integration of CD particles into the COF architecture.
 | ||
| Fig. 2 (A) PXRD patterns for N3-COF and CD-N3-COFs. (B) CN band in the FT-IR spectra of N3-COF and CD-N3-COFs from 1640 to 1590 cm−1. (C) N2 sorption isotherms and pore size distributions of N3-COF and CD-N3-COFs. (D) TEM image of 0.1CD-N3-COF. Carbon dot nanoparticles are highlighted by a red circle. C1s (E) and N1s (F) XPS spectra for 0.1CD-N3-COF and N3-COF, respectively. | ||
According to Fourier transform infrared (FT-IR) spectral analysis, the characteristic peaks of amino-CDs are observed at 2848–2958 cm−1 corresponding to the stretching vibration of the –CH2– group. The retention of the –NH2 peak at 3373–3200 cm−1 demonstrates the presence of amino groups on the CD particles (Fig. S5†).40 After the coupling reaction, the FTIR spectra of CD-N3-COFs showed an azine CN stretching band at around 1640–1590 cm−1 which could be subdivided into three peaks of CN–N at 1609 cm−1, CN–C (triazine) at 1621 cm−1, and CN–C (CD connected Schiff base bond) at 1615 cm−1 (Fig. 2B). The C–C stretching vibrations ascribed to the –CH2– group of amino-CDs (emerged at 2848–2958 cm−1) indicated that the CD particles were connected to the COF frameworks through CN bonds (Fig. S6†).
Upon evaluation by the N2 adsorption–desorption experiment at 77 K, CD-N3-COFs showed high porosity, consistent with that of N3-COF (Fig. 2C). The Brunauer–Emmett–Teller (BET) surface areas of N3-COF, 0.1CD-N3-COF, 0.5CD-N3-COF, and 1.0CD-N3-COF were calculated to be 1100, 974, 955, and 1197 m2 g−1, respectively. The pore size distributions were located at around 2.51, 2.51, 2.39, and 2.35 nm for N3-COF, 0.1CD-N3-COF, 0.5CD-N3-COF, and 1.0CD-N3-COF, respectively (Fig. 2C). The result was in concert with that of PXRD analysis that the pore size became narrow with the increase of the CD content.
Scanning electron microscope (SEM) images exhibited rod-like morphology for N3-COF and CD-N3-COFs (Fig. S7 and S8†). The high-resolution transmission electron microscope (HRTEM) image demonstrated that a lot of carbon dots of size ∼5 nm were decorated on the skeleton of CD-N3-COFs. A 0.2 nm lattice fringe in the dotted line area is attributed to amino-CDs (Fig. 2D). CD-N3-COFs exhibited a relatively high thermal stability up to 380 °C, analyzed by using thermogravimetric analysis (TGA) under an air atmosphere (Fig. S9†). After soaking 0.1CD-N3-COF in water for 24 hours, 0.1CD-N3-COF maintained the ordered structure, facilitating the photocatalytic reduction of water into H2 molecules (Fig. S10†).
The chemical state and intimate interaction of CD-N3-COF were studied by X-ray photoelectron spectroscopy (XPS) (Fig. S11†). Using 0.1CD-N3-COF as an object, the high-resolution C1s spectra illustrated three conspicuous peaks corresponding to CC/C–C, CN, and C–N groups. As displayed in Fig. 2E, the peak centered at 286.5 eV assigned to the CN signal of CD-N3-COF shifted to the lower-energy side by 0.15 eV compared with that of N3-COF, because electron-rich CD particles offered their electrons to the surrounding skeleton, increasing the electron cloud density.41–43 As for the high resolution N1s spectra, they could be divided into four peaks, including 398.5 eV for CN, 398.8 eV for C–N, 399.1 eV for N–N, and 400.4 eV for N–H (Fig. 2F). Compared to N3-COF, there was a slight shift with a binding energy of 0.1 eV for the CN peak in 0.1CD-N3-COF.41 This result was in good agreement with the high-resolution C1s XPS spectra indicating that the electron cloud density of N atoms (CN) was affected by CD particles. To sum up, these results confirmed that amino-CDs were successfully spliced into the COF network through CN covalent bonds.
Solid-state UV-Vis absorption spectra were recorded to investigate the band structure of the COF samples. The bandgap value (Eg) was estimated from the transformational Tauc plots obtained from the Kubelka–Munk function.43 As shown in Fig. 3A, the absorption region of CD-N3-COFs increased obviously in the UV-Vis absorption spectra, illustrating that the introduction of CD particles influenced the band structure of the COF network. The Eg values of N3-COF and CD-N3-COFs were calculated to be 2.77, 2.68, 2.63, and 2.59 eV, respectively (Fig. 3B). The obvious red shift of the absorption edge visible for the UV-Vis spectra of CD-N3-COFs suggests a decreased band gap. A narrow Eg value is beneficial to the absorption of visible light and the generation of optical carriers to improve the photocatalytic performance.44 Mott–Schottky plots proved that the flat band (Efb) potentials of N3-COF and CD-N3-COFs were −0.82, −0.78, −0.53, and −0.74 V (vs. RHE), respectively (Fig. 3C and S12†).45
 | ||
| Fig. 3 (A) Solid-state UV/Vis absorption spectra and (B) band gap energies of N3-COF and CD-N3-COFs. (C) Mott–Schottky plots of 0.1CD-N3-COF, and (D) proposed band structures of N3-COF and CD-N3-COFs. | ||
Besides, the positive slopes of M–S plots prove that N3-COF and CD-N3-COFs are n-type semiconductors. As previously reported, the conduction band potential (ECB) of an n-type semiconductor is about 0.2 eV negative compared with the Efb,43 and the ECB values of N3-COF and CD-N3-COFs are calculated to be −1.02, −0.98, −0.73, and −0.96 V (vs. RHE), respectively. The valence band (EVB) potentials of N3-COF and CD-N3-COFs are 1.75, 1.70, 1.95, and 1.85 V (vs. RHE), respectively, which are calculated by using the equation EVB = ECB + Eg (Fig. 3D).45 The reduction potential of hydrogen is known to be at −0.44 V (vs. RHE), so N3-COF and CD-N3-COFs thermodynamically favor photocatalytic water splitting. In addition, the more positive valence band position of CD-N3-COFs reduces the barrier height of the photocatalyst-Pt (cocatalyst), thus the electron transfer of thermionic emission through the interface becomes easier to boost the capability for photocatalysis.46
The photocatalytic activity of COF solids for visible light-induced hydrogen evolution was investigated under light irradiation with a λ ≥ 420 nm. The hydrogen evolution experiments were conducted using Pt as a co-catalyst with the addition of triethanolamine (TEoA) as a sacrificial electron donor in PBS at pH 7. Notably, the H2 release rate is determined by a standard curve drawn from the integral area of the H2 peak (Fig. S13†). After 5 hours of irradiation, the H2 evolution amount of 18939.4 μmol per unit mass by the 0.1CD-N3-COF photocatalyst remarkably increased from that (7720 μmol g−1) of N3-COF (Fig. 4A). Correspondingly, the H2 evolution rate of the 0.1CD-N3-COF photocatalyst was calculated to be 3787 μmol g−1 h−1, which was enhanced up to 245% and 195% compared with that of pure N3-COF and physically doped N3-COF, respectively (Fig. 4B). As shown in Fig. 4B, the H2 evolution rates of COF photocatalysts decreased along with the increased doping content of CD particles. This phenomenon is due to the excessive surface defects caused by the high doping amount that leads to easy electron–hole recombination and inhibits the transfer of electrons.47 As revealed in Fig. S14,† 0.1CD@N3-COF exhibited excellent photocatalytic H2 evolution durability after four recycles. The experimental results showed that the photocatalytic performance of covalently bonded heterostructures was superior to that of traditional physically doped heterojunctions.
 | ||
| Fig. 4 (A) Photocatalytic performance for H2 evolution per unit mass. (B) Comparisons of H2 evolution amounts for the COF samples. | ||
As for physically doping and single bond linking (C–N) approaches, the H2 evolution rates of CD@N3-COF and CD/N3-COF were calculated to be 1940 and 2312 μmol g−1 h−1, which were enhanced up to 26% and 50% compared with that of pure N3-COF. But these values were much lower than that of CD-N3-COF with the conjugated bridge (3787 μmol g−1 h−1) under the same experimental conditions (Fig. 4B). It could be calculated that the hydrogen production performance improvement rate of CD-N3COF is 5.6 times and 2.9 times that of CD@COF and CD/N3-COF, respectively. This phenomenon is attributed to the imine bond (CN) with delocalized π-electrons being effective to transport the photo-generated electrons from the N3-COF network to CD particles. Notably, the performance of CD-N3-COF surpasses that of many remarkable COF solids, such as TP-BDDA-COF (3240 μmol g−1 h−1), TpDTz-COF (941 μmol g−1 h−1), and a porphyrin-based COF (413 μmol g−1 h−1) (Table S1†).
Further effort was made to determine the working mechanism of the conjugated bridge of CD-N3-COF photocatalysts. The photoluminescence (PL) spectra of CD@N3-COF (physically doping), CD/N3-COF (single bond linking), and CD-N3-COF (conjugated bridging) displayed a prominent emission peak centered at 600 nm after the 420 nm excitation (Fig. 5A). Under the same conditions, CD-N3-COF revealed the strongest PL emission, proving that the conjugated bridge (CN bond) with delocalized p-electrons facilitated the separation of photo-generated carriers.48
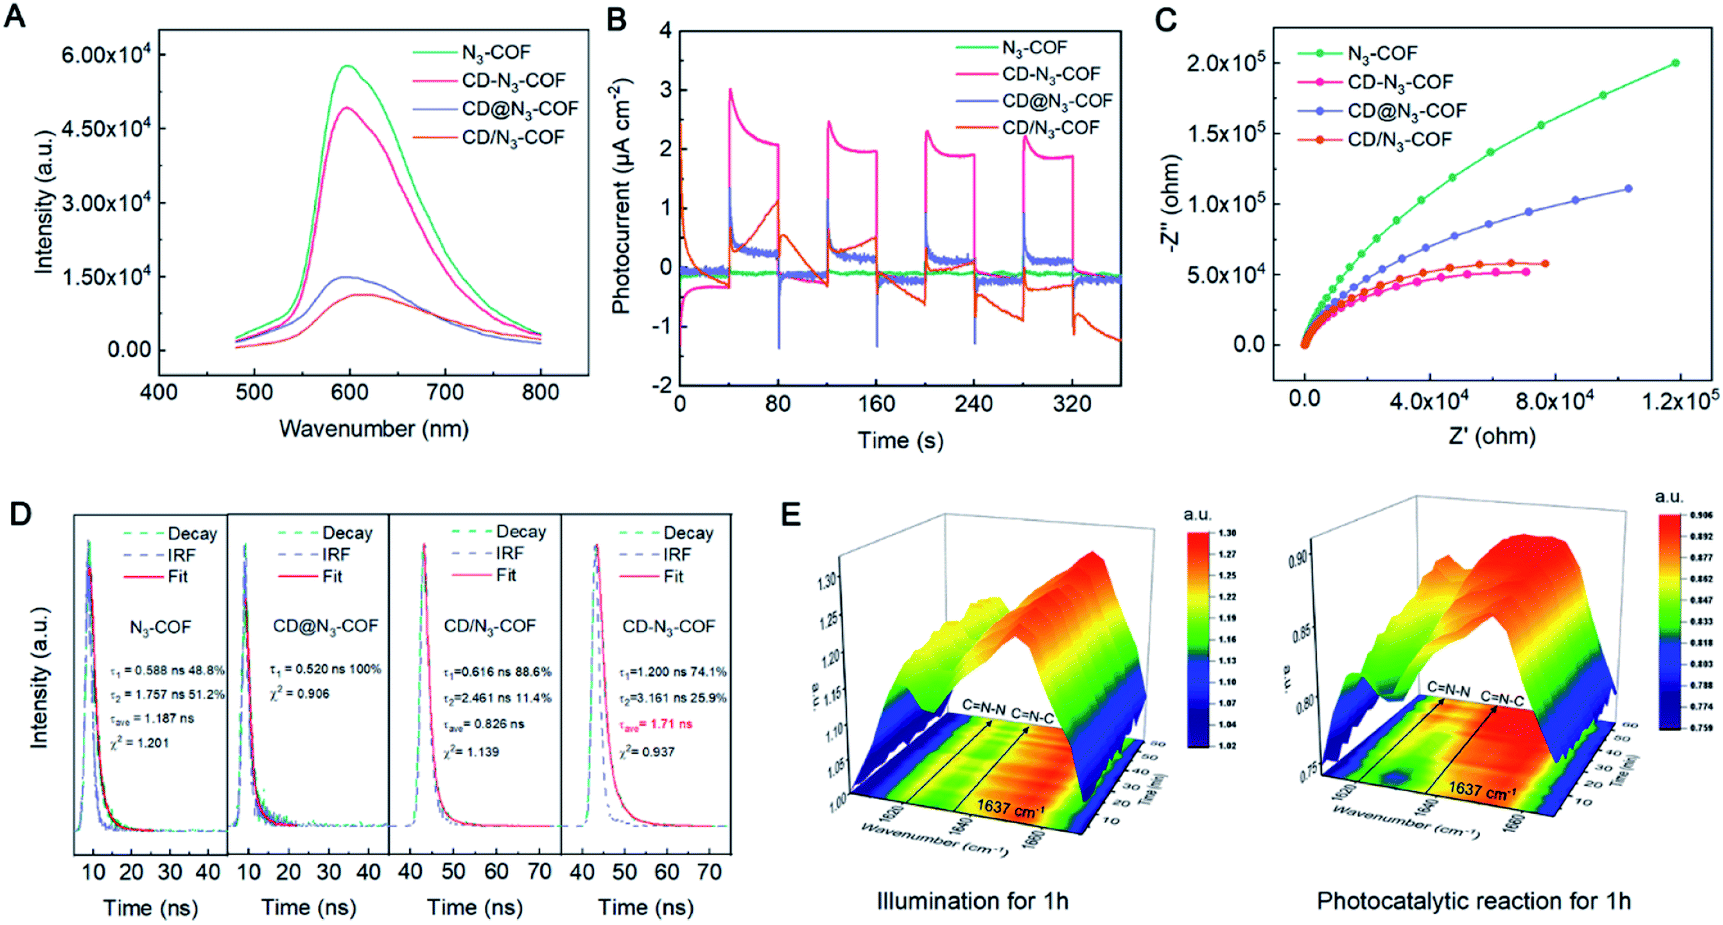 | ||
| Fig. 5 (A) PL spectra, (B) transient photocurrent response, (C) electrochemical impedance spectra, and (D) time-resolved transient PL decay for N3-COF, CD@N3-COF, CD/N3-COF and CD-N3-COF, respectively. (E) In situ FT-IR spectra of 0.1CD-N3-COF under photocatalytic conditions and illumination for 1 h. | ||
Ulteriorly, the kinetic transfer of carriers is determined from time-resolved transient PL (TRPL) spectra (Fig. 5D). The decay curves of CD-N3-COF and N3-COF were automatically calculated by the double exponential kinetic function fitting. As depicted in Fig. 5D, the short lifetime (τ1) increased from 0.588 (N3-COF) to 1.200 ns (CD-N3-COF). Similarly, the long lifetime (τ2) of N3-COF (1.757 ns) was also shorter than that of CD-N3-COF (3.161 ns); as reflected by the nonradiative energy transfer process, self-trapped excitons in CD-N3-COF were hard to form by captured electrons.49 The TRPL spectrum of CD@N3-COF was fitted by a single-exponential term with a fluorescence lifetime of ∼0.520 ns, implying a poor capability of CD@N3-COF for carrier separation (Fig. 5D).50 All these results indicated that the existence of the conjugated bridge decreased the electronic transmission resistance, which improved the photocarrier transport rate and inhibited the recombination of free electrons and holes obviously.43,45,49
Measured from transient photocurrent responses (I–t), the photocurrent density of CD-N3-COF was revealed to be 48, 7.3 and 6.1 times higher than that of N3-COF, CD@N3-COF, and CD/N3-COF (Fig. 5B). Correspondingly, the calculated photoelectron diffusion length (Ln) of CD-N3-COF was significantly increased by 1.72 times relative to that of CD@N3-COF, confirming the accelerated photoelectron movement (Fig. S15†).45 The electrochemical impedance spectroscopy (EIS) results for all COF powders are revealed in Fig. 5C. The semicircle of CD-N3-COF was the smallest, compared to that of N3-COF, CD/N3-COF, and CD@N3-COF. The conjugated bridge (CN bond) with delocalized p-electrons between CD nanoparticles and the COF network reduced the interfacial charge transfer resistance for the acceleration of electron transfer.
The key role of the conjugated bridge (CN bond) for electron transfer was monitored by in situ FT-IR spectroscopy. Within 1 hour of light exposure of 0.1CD-N3-COF, the peak intensity of CN–C (CD connected Schiff base bond) and CN–N stretching vibrations remained unchanged (Fig. 5E and S16†). As for the photocatalytic H2 production, the CN–N stretching vibration located at 1621 cm−1 was gradually enhanced. This is ascribed to the double bonded N–N groups in N3-COF being the active centers for the hydrogen reduction reaction. They will generate electrons under visible light radiation and increase the electron cloud density, leading to the enlarged vibration frequency of the CN (CN–N) band. For the CN–C groups, they are determined to have little ability to generate electrons.41,51 After the irradiation, the CN stretching vibration at 1637 cm−1 was also significantly enhanced along with the catalytic reaction (Fig. 5E and S16†). It is proved that the conjugate bridge (CN bond) is effective for electron transfer from the COF network to CD particles.
Conclusions
In summary, we described that carbon dots were covalently bonded to N3-COF matrices in the heterojunction CD-N3-COF through the CN bond. The conjugated bridge with delocalized p-electrons was effective in overcoming the transfer barrier to increase the electron transfer rate. Based on this unique structure, effective electron transfer was achieved, and then an efficient photocatalytic water splitting system was obtained. The corresponding evolution rate for hydrogen production was obviously enlarged compared with that of physically doped N3-COF. This work provides an effective strategy for the connection of the interface of the S–S heterojunction, which will attract a broad audience from material synthesis and design and application for heterogeneous catalysis.
Conflicts of interest
There are no conflicts to declare.Acknowledgements
The authors are grateful for financial support of the experimental work from the National Natural Science Foundation of China (Grants 21975039 and 21701186), the Fundamental Research Funds from State Key Laboratory of NBC Protection for Civilian (SKLNBC2019-04), Liaoning Revitalization Talents Program (XLYC2007032), and Liaoning Provincial Natural Science Foundation (2021-MS-149).Notes and references
- X. Wang, K. Maeda, A. Thomas, K. Takanabe, G. Xin, J. M. Carlsson, K. Domen and M. Antonietti, Nat. Mater., 2009, 8, 76 CrossRef CAS PubMed.
- X. Chen, S. Shen, L. Guo and S. S. Mao, Chem. Rev., 2010, 110, 6503 CrossRef CAS PubMed.
- J. Liu, Y. Liu, N. Liu, Y. Han, X. Zhang, H. Huang, Y. Lifshitz, S.-T. Lee, J. Zhong and Z. Kang, Science, 2015, 347, 970 CrossRef CAS PubMed.
- G. Xie, K. Zhang, B. Guo, Q. Liu, L. Fang and J. R. Gong, Adv. Mater., 2013, 25, 3820 CrossRef CAS PubMed.
- B. Dai, J. Fang, Y. Yu, M. Sun, H. Huang, C. Lu, J. Kou, Y. Zhao and Z. Xu, Adv. Mater., 2020, 32, 1906361 CrossRef CAS PubMed.
- B. Zhu, P. Xia, Y. Li, W. Ho and J. Yu, Appl. Surf. Sci., 2017, 391, 175 CrossRef CAS.
- L. Zhao, F. Ye, D. Wang, X. Cai, C. Meng, H. Xie, J. Zhang and S. Bai, ChemSusChem, 2018, 11, 3524 CrossRef CAS PubMed.
- J. K. Stolarczyk, S. Bhattacharyya, L. Polavarapu and J. Feldmann, ACS Catal., 2018, 8, 3602 CrossRef CAS.
- X. Li, J. Yu, M. Jaroniec and X. Chen, Chem. Rev., 2019, 119, 3962 CrossRef CAS PubMed.
- T. Xiao, Z. Tang, Y. Yang, L. Tang, Y. Zhou and Z. Zou, Appl. Catal., B, 2018, 220, 417 CrossRef CAS.
- P. V. Kamat, J. Phys. Chem. C, 2007, 111, 2834–2860 CrossRef CAS.
- A. Kubacka, M. Fernández-García and G. Colón, Chem. Rev., 2012, 112, 1555 CrossRef CAS PubMed.
- Y. Qu and X. Duan, Chem. Soc. Rev., 2013, 42, 2568 RSC.
- J. Low, J. Yu, M. Jaroniec, S. Wageh and A. A. Al-Ghamdi, Adv. Mater., 2017, 29, 1601694 CrossRef PubMed.
- Q. Zhang, B. Li, S. Huang, H. Nomura, H. Tanaka and C. Adachi, Nat. Photonics, 2014, 8, 326 CrossRef CAS.
- H. Wang, S. Jin, X. Zhang and Y. Xie, Angew. Chem., Int. Ed., 2020, 59, 22828 CrossRef CAS PubMed.
- M. E. G. Lyons and M. P. Brandon, J. Electroanal. Chem., 2009, 631, 62 CrossRef CAS.
- H. Jin, J. Wang, D. Su, Z. Wei, Z. Pang and Y. Wang, J. Am. Chem. Soc., 2015, 137, 2688 CrossRef CAS PubMed.
- G. Morales-Guio, M. T. Mayer, A. Yella, S. D. Tilley, M. Grätzel and X. Hu, J. Am. Chem. Soc., 2015, 137, 9927 CrossRef PubMed.
- B. Liu and E. S. Aydil, J. Am. Chem. Soc., 2009, 131, 3985 CrossRef CAS PubMed.
- F. Qian, G. Wang and Y. Li, Nano Lett., 2010, 10, 4686 CrossRef CAS PubMed.
- Q. Wang, Z. Zhang, S. M. Zakeeruddin and M. Grätzel, J. Phys. Chem. C, 2008, 112, 7084 CrossRef CAS.
- X. Yang, A. Wolcott, G. Wang, A. Sobo, R. C. Fitzmorris, F. Qian, J. Z. Zhang and Y. Li, Nano Lett., 2009, 9, 2331 CrossRef CAS PubMed.
- A. K. Chandiran, F. Sauvage, M. Casas-Cabanas, P. Comte, S. M. Zakeeruddin and M. Graetzel, J. Phys. Chem. C, 2010, 114, 15849 CrossRef CAS.
- Y. Ling, G. Wang, D. A. Wheeler, J. Z. Zhang and Y. Li, Nano Lett., 2011, 11, 2119 CrossRef CAS PubMed.
- P. V. Kamat, K. Tvrdy, D. R. Baker and E. J. Radich, Chem. Rev., 2010, 110, 6664 CrossRef CAS PubMed.
- H. Hayashi, I. V. Lightcap, M. Tsujimoto, M. Takano, T. Umeyama, P. V. Kamat and H. Imahori, J. Am. Chem. Soc., 2011, 133, 7684 CrossRef CAS PubMed.
- X. Dang, H. Yi, M.-H. Ham, J. Qi, D. S. Yun, R. Ladewski, M. S. Strano, P. T. Hammond and A. M. Belcher, Nat. Nanotechnol., 2011, 6, 377 CrossRef CAS PubMed.
- P. V. Kamat and J. Phys, Chem. Lett., 2011, 2, 242 CAS.
- J. Sun, M. A. Memon, W. Bai, L. Xiao, B. Zhang, Y. Jin, Y. Huang and J. Geng, Adv. Funct. Mater., 2015, 25, 4334 CrossRef CAS.
- K. Zhu, N. R. Neale, A. Miedaner and A. J. Frank, Nano Lett., 2007, 7, 69 CrossRef CAS PubMed.
- J. R. Jennings, A. Ghicov, L. M. Peter, P. Schmuki and A. B. Walker, J. Am. Chem. Soc., 2008, 130, 13364 CrossRef CAS PubMed.
- J. Chen, B. Li, J. Zheng, J. Zhao and Z. Zhu, J. Phys. Chem. C, 2012, 116, 14848 CrossRef CAS.
- H. Wang, H. Wang, Z. Wang, L. Tang, G. Zeng, P. Xu, M. Chen, T. Xiong, C. Zhou, X. Li, D. Huang, Y. Zhu, Z. Wang and J. Tang, Chem. Soc. Rev., 2020, 49, 4135 RSC.
- X. Wang, L. Chen, S. Y. Chong, M. A. Little, Y. Wu, W.-H. Zhu, R. Clowes, Y. Yan, M. A. Zwijnenburg, R. S. Sprick and A. I. Cooper, Nat. Chem., 2018, 10, 1180 CrossRef CAS PubMed.
- E. Jin, Z. Lan, Q. Jiang, K. Geng, G. Li, X. Wang and D. Jiang, Chem, 2019, 5, 1632 CAS.
- S. Bi, C. Yang, W. Zhang, J. Xu, L. Liu, D. Wu, X. Wang, Y. Han, Q. Liang and F. Zhang, Nat. Commun., 2019, 10, 2467 CrossRef PubMed.
- H. Wang, C. Qian, J. Liu, Y. Zeng, D. Wang, W. Zhou, L. Gu, H. Wu, G. Liu and Y. Zhao, J. Am. Chem. Soc., 2020, 142, 4862 CrossRef CAS PubMed.
- J. Yang, A. Acharjya, M.-Y. Ye, J. Rabeah, S. Li, Z. Kochovski, S. Youk, J. Roeser, J. Grüneberg, C. Penschke, M. Schwarze, T. Wang, Y. Lu, R. van de Krol, M. Oschatz, R. Schomäcker, P. Saalfrank and A. Thomas, Angew. Chem., Int. Ed., 2021, 60, 19797 CrossRef CAS PubMed.
- K. Jiang, S. Sun, L. Zhang, Y. Lu, A. Wu, C. Cai and H. Lin, Angew. Chem., Int. Ed., 2015, 54, 5360 CrossRef CAS PubMed.
- V. S. Vyas, F. Haase, L. Stegbauer, G. Savasci, F. Podjaski, C. Ochsenfeld and B. V. Lotsch, Nat. Commun., 2015, 6, 8508 CrossRef CAS PubMed.
- Y. Wang, D. Chen, L. Qin, J. Liang and Y. Huang, Phys. Chem. Chem. Phys., 2019, 21, 25484 RSC.
- X. Wang, X. Wang, J. Huang, S. Li, A. Meng and Z. Li, Nat. Commun., 2021, 12, 4112 CrossRef CAS PubMed.
- P. Li, Z. Zhou, Q. Wang, M. Guo, S. Chen, J. Low, R. Long, W. Liu, P. Ding, Y. Wu and Y. Xiong, J. Am. Chem. Soc., 2020, 142, 12430 CrossRef CAS PubMed.
- Y. Wang, X. Liu, J. Liu, B. Han, X. Hu, F. Yang, Z. Xu, Y. Li, S. Jia, Z. Li and Y. Zhao, Angew. Chem., Int. Ed., 2018, 57, 5765 CrossRef CAS PubMed.
- J. Chen, L. Zhang, Z. Lam, H. B. Tao, Z. Zeng, H. B. Yang, J. Luo, L. Ma, B. Li, J. Zheng, S. Jia, Z. Wang, Z. Zhu and B. Liu, J. Am. Chem. Soc., 2016, 138, 318 Search PubMed.
- Y. Liang, X. Cui, F. Li, C. Stampfl, J. Huang, S. P. Ringer and R. Zheng, J. Phys. Chem. Lett., 2021, 12, 10677 CrossRef CAS PubMed.
- J. R. Lakowicz, K. Ray, M. Chowdhury, H. Szmacinski, Y. Fu, J. Zhang and K. Nowaczyk, Analyst, 2008, 133, 1308 RSC.
- P. Xia, S. Cao, B. Zhu, M. Liu, M. Shi, J. Yu and Y. Zhang, Angew. Chem., Int. Ed., 2020, 59, 5218 CrossRef CAS PubMed.
- P. Niu, G. Liu and H.-M. Cheng, J. Phys. Chem. C, 2012, 116, 11013 CrossRef CAS.
- Y. Wan, L. Wang, H. Xu, X. Wu and J. Yang, J. Am. Chem. Soc., 2020, 142, 4508 CrossRef CAS PubMed.
Footnote |
| † Electronic supplementary information (ESI) available. See DOI: 10.1039/d1ta10657k |
| This journal is © The Royal Society of Chemistry 2022 |