
In situ TEM visualization of single atom catalysis in solid-state Na–O2 nanobatteries†
Haiming
Sun‡
 ac,
Qiunan
Liu‡
ag,
Zhiying
Gao
a,
Lin
Geng
a,
Yanshuai
Li
a,
Fengyu
Zhang
af,
Jitong
Yan
ad,
Yufei
Gao
e,
Kazu
Suenaga
g,
Liqiang
Zhang
*a,
Yongfu
Tang
*ad and
Jianyu
Huang
*ab
ac,
Qiunan
Liu‡
ag,
Zhiying
Gao
a,
Lin
Geng
a,
Yanshuai
Li
a,
Fengyu
Zhang
af,
Jitong
Yan
ad,
Yufei
Gao
e,
Kazu
Suenaga
g,
Liqiang
Zhang
*a,
Yongfu
Tang
*ad and
Jianyu
Huang
*ab
aClean Nano Energy Center, State Key Laboratory of Metastable Materials Science and Technology, Yanshan University, Qinhuangdao 066004, China. E-mail: lqzhang@ysu.edu.cn; tangyongfu@ysu.edu.cn; jyhuang8@hotmail.com
bSchool of Materials Science and Engineering, Xiangtan University, Xiangtan, Hunan 411105, China
cResearch Center for Ultra-High Voltage Electron Microscopy, Osaka University, Ibaraki, Osaka 567-0047, Japan
dHebei Key Laboratory of Applied Chemistry, School of Environmental and Chemical Engineering, Yanshan University, Qinhuangdao 066004, China
eCenter for High Pressure Science, State Key Laboratory of Metastable Materials Science and Technology, Yanshan University, Qinhuangdao 066004, China
fState Key Laboratory of Heavy Oil Processing, Beijing Key Laboratory of Failure, Corrosion, and Protection of Oil/Gas Facilities, China University of Petroleum Beijing, Beijing 102249, China
gThe Institute of Scientific and Industrial Research, Osaka University, Ibaraki, Osaka 567-0047, Japan
First published on 8th November 2021
Abstract
Single-atom catalysts (SACs) exhibit high catalytic activities in many systems including metal–air batteries. However, the fundamental catalytic mechanism of SACs during the charge/discharge process is still unclear. Herein, we report a real-time imaging of the microscopic evolution of single-atom Co/reduced graphene oxide (SA-Co/rGO) in Na–O2 nanobatteries via an in situ environmental transmission electron microscope. Clearly, Na2O2 spheres were formed on the surface of the SA-Co/rGO scaffold during discharging, which can be easily decomposed during charging. In contrast, the formation and decomposition of Na2O2 on bare rGO without SACs were very sluggish. Moreover, a coin cell Na–O2 battery with an SA-Co/rGO air cathode also displays superior performance to a bare rGO cathode. DFT calculations reveal that the local coordination environment (Co + 4N) played a key role in tuning the charge density and oxidation states of the isolated Co active sites, thus activating O2 molecules and facilitating the oxygen reduction reaction/oxygen evolution reaction processes. This study suggests that SA-Co/rGO may be a promising catalyst for enhancing the performance of Na–O2 batteries.
Introduction
Metal–air batteries (MABs) are considered to have potential beyond lithium energy storage devices due to their potential high energy density.1–6 A MAB consists of a metal anode and a breathing cathode in a suitable electrolyte with an open cell structure.7 The energy conversion of MABs is based on the redox reaction between the metal anode and the continuous oxygen supply from the surrounding environment, and they possess remarkably high theoretical energy densities.8,9 However, the realized energy density and cycle life of MABs are still far from meeting the requirements for practical applications due to the unsatisfactory electro-catalysis process. Taking a typical Li–O2 battery as an example, both transition metal oxides and carbon materials have been explored as catalysts to accelerate the oxygen reduction reaction (ORR) and oxygen evolution reaction (OER). However, the low chemical durability of the catalysts caused sluggish ORR and OER kinetics, which hinder the commercial applications of MABs.10 In previous studies, Pt-, Ru-, and Ir-based noble metals have been extensively investigated as catalysts to facilitate the ORR and OER, but the high cost, scarcity, and poor durability of noble metals limit their applications in electro-catalysis.11–14 Therefore, developing highly active and stable non-precious metal catalysts to boost both ORR and OER is critical in the research and development of MABs.Recently, single-atom catalysts (SACs) have attracted increasing attention in heterogeneous catalysis owing to their unique electronic properties and maximal atom utilization efficiency in various catalytic systems, such as water splitting, fuel cells, CO2 reduction reactions and so on.15–19 The high catalytic activity of SACs in the field of MABs has also been demonstrated.20–23 Song et al. reported an Li–O2 battery with a cobalt-based SAC, where the isolated moieties of the SAC can effectively regulate the distribution of active sites to form micrometre-sized flower-like Li2O2 and promote the decomposition of Li2O2via a one-electron pathway with the formation of LiO2 intermediates, operated with high round-trip efficiency (86.2%) and long-term stability (218 days).21 Wang et al. reported isolated cobalt atoms embedded in ultrathin nitrogen-rich carbon as a dual-catalyst for Li–O2 batteries, where the achieved electrode with maximized exposed atomic sites is beneficial for tailoring the formation/decomposition mechanisms of uniformly distributed nano-sized lithium peroxide, and affords remarkably decreased charge/discharge polarization (0.40 V) and long-term cyclability (260 cycles at 400 mA g−1).22 However, there are few reports about using SACs to promote ORR/OER in Na–O2 batteries.24,25 Moreover, the dynamics of microstructure evolution, catalytic mechanism and stability of SACs during the charge/discharge process of Na–O2 batteries have not been explored. Neither is there any report on in situ transmission electron microscope (TEM) studies on SAC catalyzed Na–O2 batteries due to technical challenges for constructing such in situ Na–O2 cells.
Herein, the morphological and structural evolution of an all-solid-state Na–O2 nanobattery with single-atom cobalt on reduced graphene oxide (SA-Co/rGO) as an air cathode during charge/discharge processes were directly observed using an environmental transmission electron microscope (ETEM). The results indicate that the SA-Co/rGO cathode exhibits excellent catalytic activities and long-term stability for both ORR and OER in an Na–O2 battery. It was found that a large number of spherical Na2O2 products were formed on the surface of the SA-Co/rGO cathode during the discharge process, which then decomposed in the following charge process. For comparison, no spherical products were observed during the discharge/charge processes of the Na–O2 nanobatteries with a multilayered graphene cathode prepared by the Scotch tape peeling method.26 DFT calculations reveal that single-atom Co sites exhibit higher activity for activating O2 than pure graphene, and the exposed single-atom Co active sites play an essential role in reducing the overpotentials of both Na2O2 generation and decomposition. Impressively, practical SA-Co/rGO air cathode-based coin cell Na–O2 batteries also exhibit high charge/discharge performance and stability, which proves that SACs are promising catalysts to promote the ORR and OER in Na–O2 batteries.
Results and discussion
Microstructure characterizations
SA-Co/rGO was synthesized by a simple pyrolysis process (Fig. S1†). Briefly, a suspension containing graphene oxide and cobalt nitrate was fully mixed under vigorous stirring, and the flocculent precursor was collected after centrifuging and freeze-drying. The final SA-Co/rGO powder was obtained by calcining the flocculent precursor at 400 °C. The TEM image (Fig. 1a) shows that SA-Co/rGO is a graphene-like nanosheet with a small amount of nanoparticles which are identified as metallic Co. The existence of single Co atoms was proved via the scanning transmission electron microscopy – high angle annular dark field (STEM-HAADF) image. As shown in Fig. 1b, uniformly distributed bright dots (∼1–3 Å) are clearly observed on the surface of the rGO nanosheet, which are assigned to Co atoms. Elemental mapping (Fig. 1c–f) indicates that C, N, and Co elements are homogeneously distributed within the rGO scaffold, confirming the Co single-atom structure of SA-Co/rGO.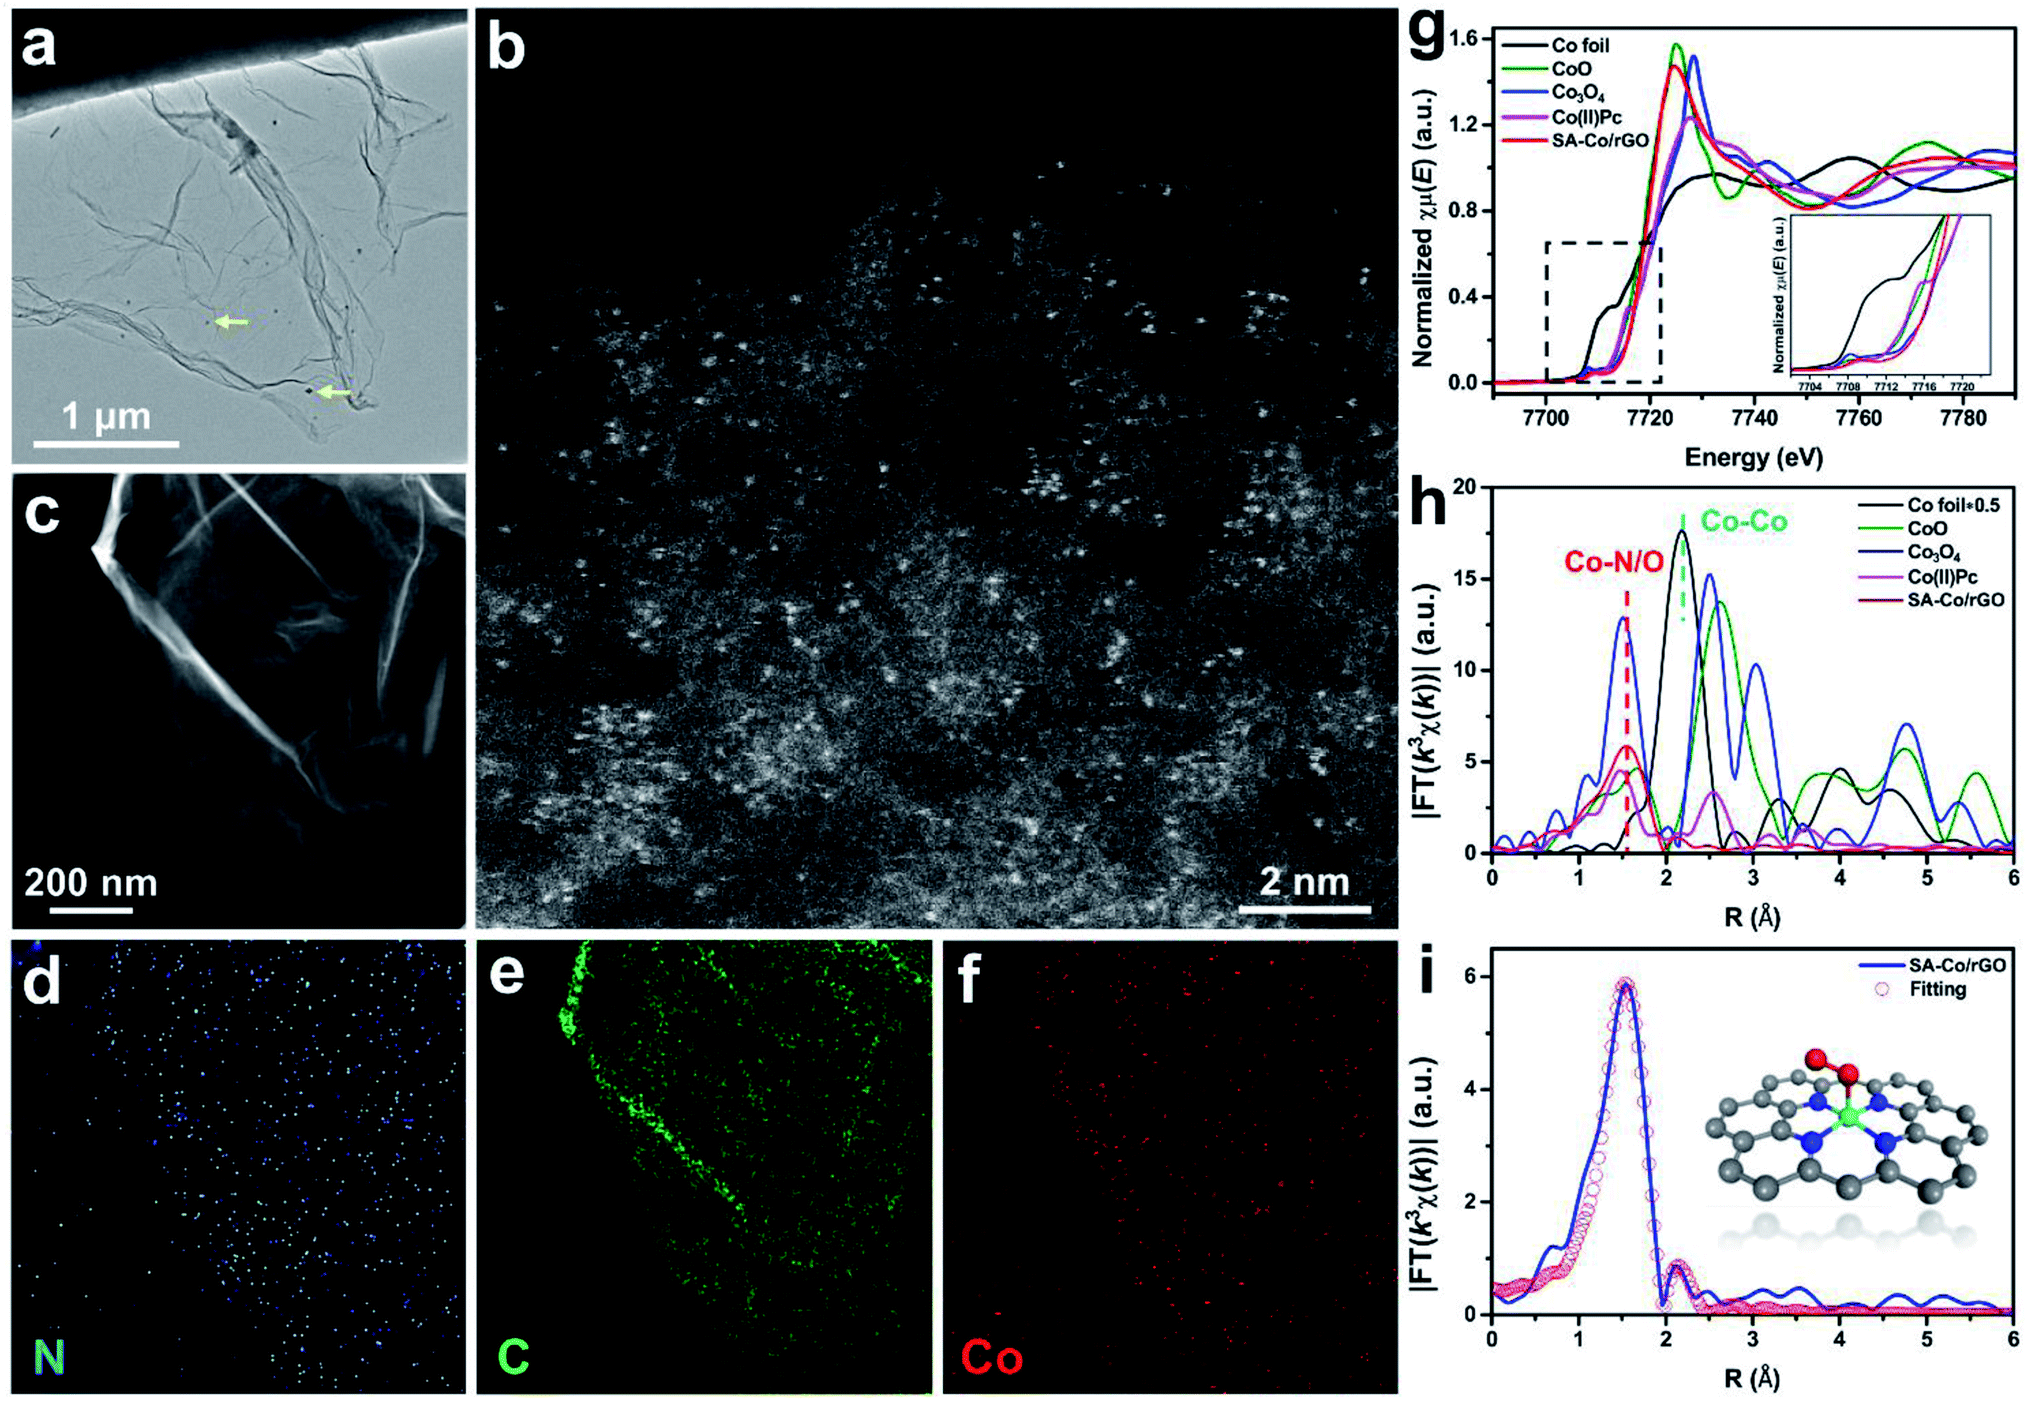 | ||
| Fig. 1 Microstructure characterizations of SA-Co/rGO. (a) A low-magnification bright field image of SA-Co/rGO. (Yellow arrows mark the occasionally observed Co nanoparticles.) (b) STEM-HAADF images of SA-Co/rGO at high and low magnification. (c–f) Elemental mapping images of SA-Co/rGO. (g) XANES spectra, (h) Fourier transform (FT) of the Co K-edge of Co foil, CoO, Co3O4, Co(II)Pc and SA-Co/rGO. (i) The EXAFS fitting curves of SA-Co/rGO in R space (inset: proposed atomic structure of SA-Co/rGO. Co: cyan, N: blue, O: red, C: gray). The Fourier transforms are not corrected for phase shift. | ||
The electronic structure and coordination environment of SA-Co/rGO at an atomic scale were identified by X-ray absorption fine structure spectroscopy (XAFS) of the Co K-edge. Fig. 1g shows the X-ray absorption near-edge structure spectroscopy (XANES) of SA-Co/rGO compared with that of the references of Co foil, CoO, Co3O4 and Co(II) phthalocyanine (Co(II)Pc). The near-edge absorption energy positions of SA-Co/rGO were close to those of the reference Co3O4, suggesting that the valence state of Co in SA-Co/rGO is between Co2+ and Co3+. The Fourier transform (FT) k3-weighted extended X-ray absorption fine structure (EXAFS) curve of SA-Co/rGO and the references are shown in Fig. 1h. Compared with Co foil, CoO, Co3O4 and Co(II)Pc, SA-Co/rGO shows only one main peak at about 1.5 Å, which is assigned to the first coordination shell of Co–N/O. No Co–Co coordination contribution (∼2.2 Å) was observed in SA-Co/rGO. These results indicate that the isolated Co atom is stabilized by N/O on the carbon matrix. The atomic structure of SA-Co/rGO was further directly imaged by ADF-STEM. The ADF image (Fig. S2a†) shows a single Co atom was trapped in a quadruple N defect (labeled as Co + 4N).27,28 The corresponding electron energy loss spectroscopy (EELS) spectrum taken from the region around an individual Co atom is shown in Fig. S2b,† and the peaks located at 284, 401, and 779 eV are identified as the C K-edge, N K-edge, and Co L-edge, respectively. Based on the above results we propose a possible atomic structure of SA-Co/rGO (Fig. 1i, inset). After full relaxation of the proposed structure, quantitative EXAFS fitting was carried out, which demonstrates good consistency with the experimental results. The fitting results for the first shell are displayed in Fig. 1i and S3–S5,† and the fitting parameters are listed in Table S1.†
In situ observation of an all-solid-state Na–O2 nanobattery
An all-solid-state Na–O2 nanobattery was constructed inside a Cs-corrected ETEM (FEI, Titan G2, 300 kV) to allow in situ experiments in an O2 gas environment. Metallic Na, naturally formed Na2O/Na2O2 on the surface of Na, and SA-Co/rGO served as the anode, solid-state electrolyte and cathode, respectively (Fig. S6†). The morphological evolution of the SA-Co/rGO cathode was monitored by time-resolved annular dark field (ADF) images (Fig. 2a–d, Movie S1†). When a voltage of −5 V was applied to the cathode, an obvious reaction front appeared and quickly propagated along the rGO nanosheet (Fig. 2b–d). Spherical discharge products emerged on the surface of the cathode. As the reaction proceeded, more spherical products formed and covered the SA-Co/rGO surface. The large number of products formed on a small piece of SA-Co/rGO indicates the superior catalytic activity of the SA-Co catalyst. At the end of the discharge process (∼275 minutes), the rGO nanosheet was completely covered by the spherical products, while only a small amount of product was present around the agglomerated metal particles. The crystalline structure of the SA-Co/rGO cathode and the reaction product during the discharge process in the Na–O2 battery were recorded using selected area electron diffraction patterns (EDPs) (Fig. 2e–g). As shown in Fig. 2e, the diffused diffraction rings of the pristine cathode are indexed as the (002), (101) and (110) crystal planes of a typical graphite structure (space group P63mc) with d spacings of 3.39, 2.04 and 1.23 Å, respectively, while the sharp diffraction spots (green circles) should be ascribed to the Co nanoparticle. Fig. 2f shows the EDPs of the reaction front region (the white circled region in Fig. 2b). After full discharge, the cathode was completely covered by spherical products. The EDP of the discharge products (Fig. 2g) can be indexed as the (111), (210), (211) and (301) planes of polycrystalline Na2O2 and the (101) and (110) planes of rGO. Furthermore, electron energy-loss spectroscopy (EELS, Fig. 2h, i) was also conducted to investigate the chemical nature of the products. In the low-loss spectra (Fig. 2h), the green line profile shows only one major plasma peak of carbon located at 23.1 eV. Compared with the pristine sample, the spectra of the reaction front region (blue line) and the discharge products (red line) show three peaks located at 8.9 and 8.4, 20.8 and 20.4, and 32.8 and 32.6 eV, respectively. The major plasmon loss peaks shifted from 23.1 eV (Fig. 2h, green) of the pristine sample to 20.8 and 20.4 eV (Fig. 2h, red and blue) for the reaction front region and the discharge products, respectively, which should be ascribed to the formation of Na2O2 products. From the core-loss spectra (Fig. 2i), the Na K-edge appeared in the reaction front region (blue line) and the discharge product (red line). Fig. S7a and b† show the high magnification HAADF and annular bright field (ABF) images of the discharged SA-Co/rGO air cathode, respectively. The lattice spacing of 2.3 Å (Fig. S7b†) can be indexed as the (201) plane of Na2O2. Fig. S7c† shows that single Co atoms are uniformly distributed in the discharge products without any agglomeration, confirming the stability and critical role of the SACs in catalyzing the ORR in an Na–O2 nanobattery. The discharge process may be described as follows: once a negative potential is applied on the cathode, the Na+ ions cross through the solid electrolyte and diffuse into the skeleton of rGO, then react with e− and O2 to form Na2O2 under the catalysis of single-atomic Co, and the discharge product quickly covers the cathode surface.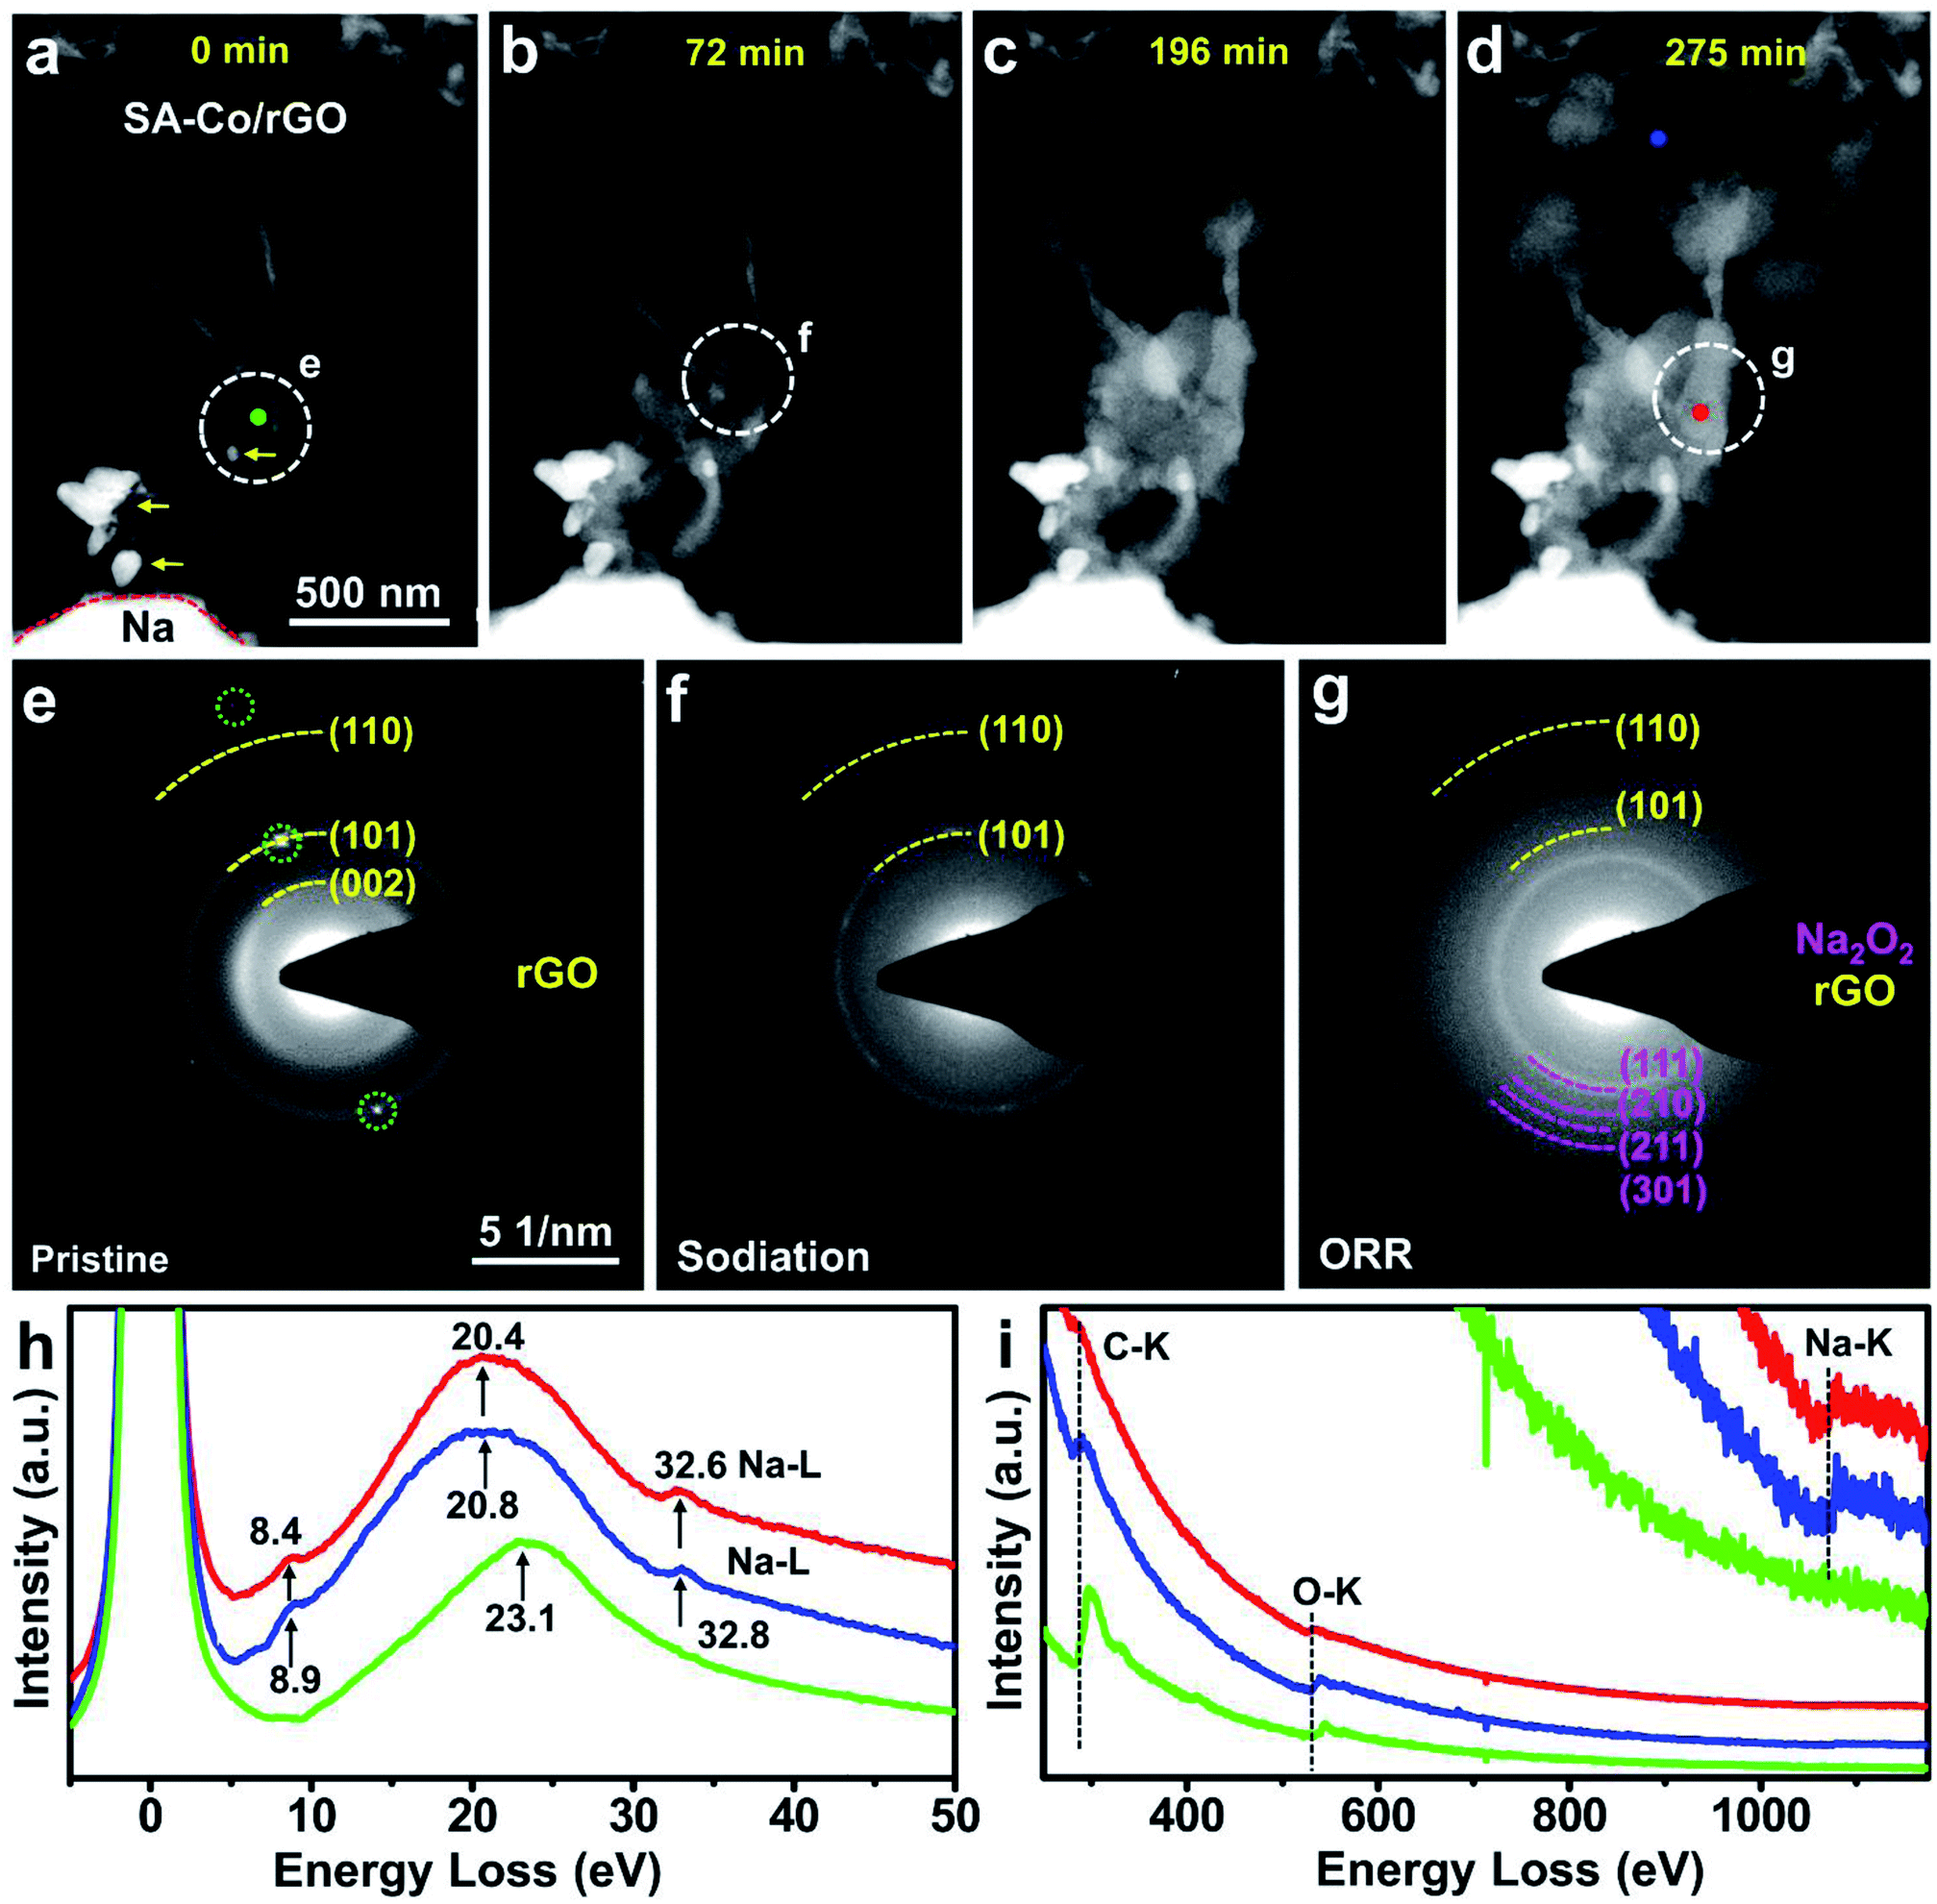 | ||
| Fig. 2 In situ TEM observation and characterization of an Na–O2 nanobattery with an SA-Co/rGO cathode. (a–d) Time-lapse structural evolution of the SA-Co/rGO cathode in an Na–O2 nanobattery during the discharging process. (Yellow arrows mark the agglomerated metal nanoparticles.) (e–g) EDPs and (h, i) EELS of the pristine samples and discharge products on the SA-Co/rGO cathode. White circles mark locations where EDPs were acquired. The green, red and blue dots in (a) and (d) indicate the sites where EELS spectra were acquired. | ||
To further investigate the phase evolution during the discharge process, in situ EDP monitoring was conducted (Fig. S8†). At the beginning of the reaction (Fig. S8a†), the pristine sample showed diffused diffraction rings ascribed to the rGO (101) and (110) planes. When a negative potential was applied, the diffraction rings of polycrystalline Na2O2 gradually appeared, which became more prominent with the passage of time (Fig. S8b–d†). This indicates that a small amount of Na2O2 formed in the reaction front and propagated along the rGO as the reaction went on. The amount of Na2O2 products increased with the lapse of time.
For comparison, another Na–O2 nanobattery with a multilayered graphene derived from highly orientated pyrolytic graphite without Co atoms26 as the cathode was constructed and operated under the same conditions as the SA-Co/rGO nanobattery. Upon applying a negative potential, the electrochemical deposition of Na balls occurred at the triple interface of graphene, O2 and Na2O/Na2O2 solid electrolyte (Fig. 3a–c). At the same time, a semicircular reaction front propagated along the graphene nanosheet with the lapse of time. The morphologies of the discharge products were obviously different from the spherical Na2O2 on the SA-Co/rGO cathode. Compared with the unreacted region, the reacted region showed brighter contrast, and the reaction front propagated in a semicircular shape. The EDP of the pristine graphene can be indexed as the [001] zone axis of graphene (Fig. 3d), while a composite of polycrystalline Na2O and a small amount of Na2O2 were present on the discharged graphene cathode (Fig. 3e), and an Na ball was grown on the triple interface (Fig. 3f). The EELS spectra for the reacted (red line) and non-reacted (blue line) regions near the reaction front are shown in Fig. 3g and h. In the low-loss spectra from the non-reacted region (blue line), a major plasmon peak appeared at 23.9 eV with two minor peaks located at 6.1 and 13.0 eV. In the core-loss spectra from the non-reacted region, only one peak located at 284 eV (C K-edge) was observed. For the reacted region (marked as a red spot in Fig. 3c), the major plasmon loss peak shifted to 22.9 eV with two minor peaks located at 8.4 and 32.3 eV, which are different from those of the pristine cathode. In the core-loss spectra from the reacted region, in addition to the C K-edge at 284 eV, the O K-edge (at 532 eV) and Na K-edge (at 1072 eV) were also observed. Additionally, low-loss EELS from the electroplated Na ball (cyan line) showed three multiple plasmon peaks located at 6.1, 12.0, and 17.7 eV. To summarize, without a Co single-atom catalyst, the electrochemical deposition of Na balls (side product) occurred at the triple interface during the discharge process; meanwhile, no ORR took place in the multilayered graphene cathode except for some brightness change in the reacted region, which was caused by the chemical oxidation of the intercalated Na by O2.
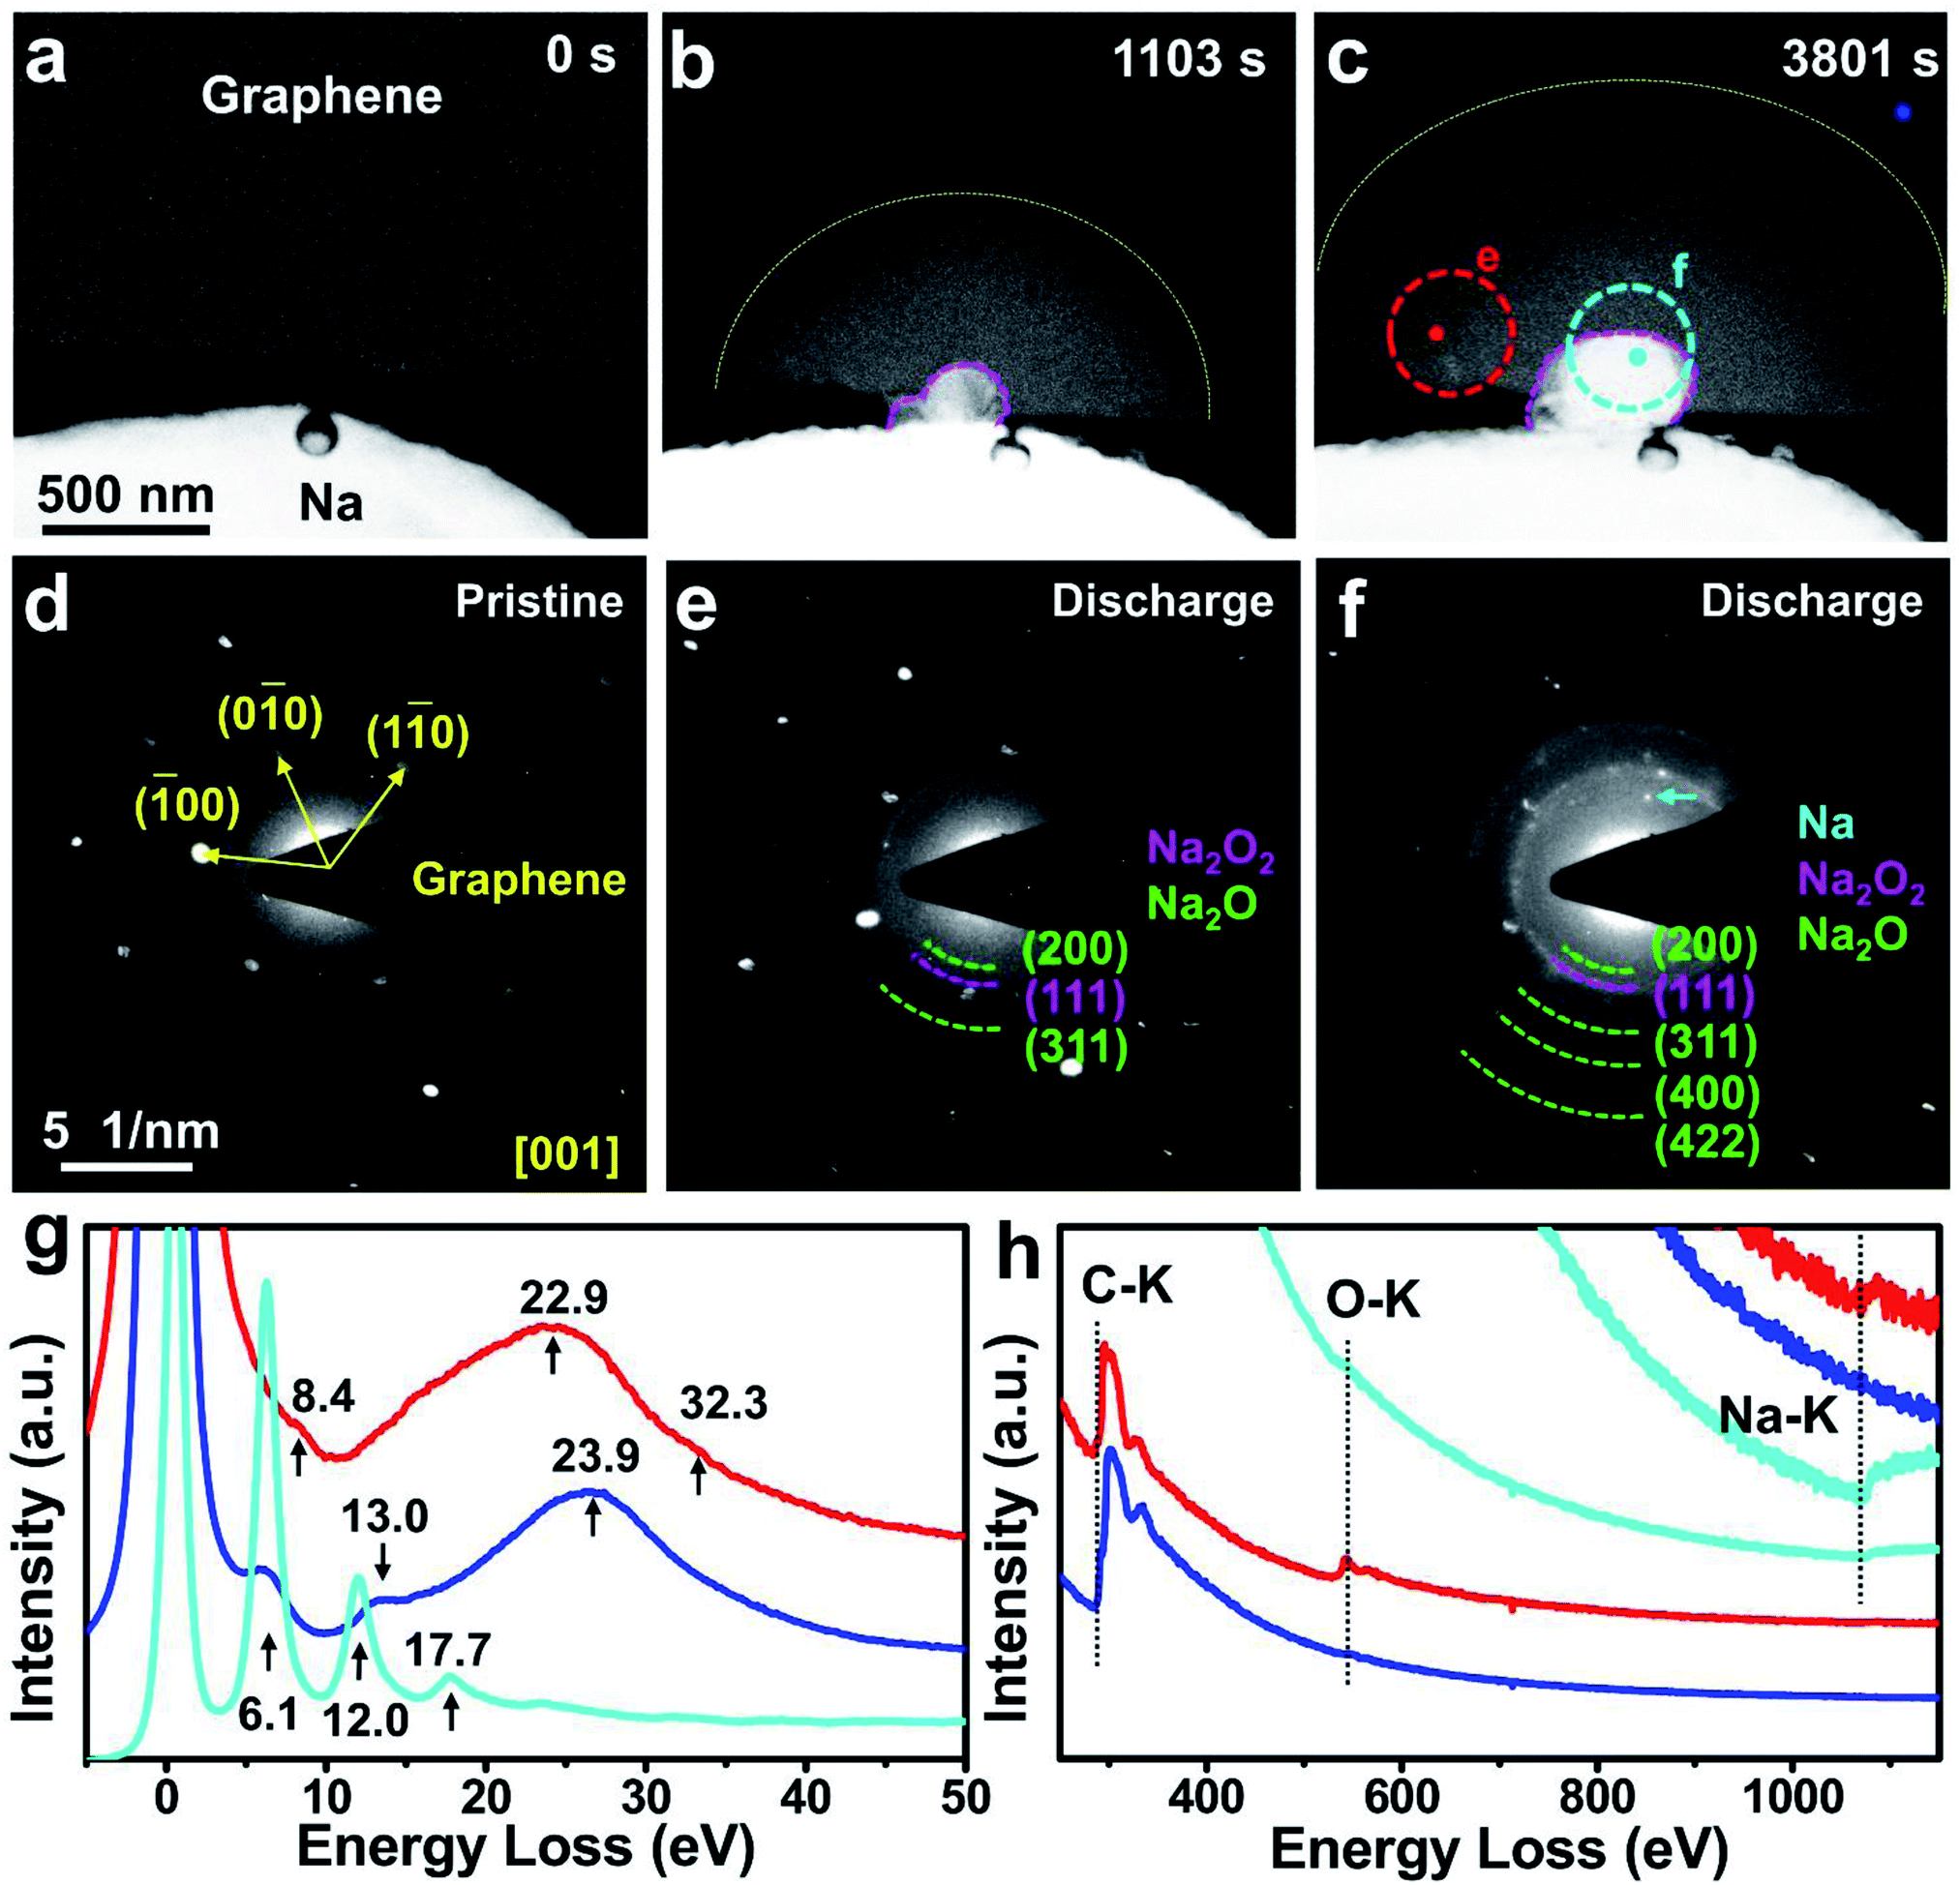 | ||
| Fig. 3 In situ TEM observation and characterization of an Na–O2 nanobattery with a multilayered graphene cathode. (a–c) Time-lapse structural evolution of the graphene cathode in an Na–O2 nanobattery during the discharge process. (d–f) EDPs and (g, h) EELS of the pristine graphene and discharge products on the graphene cathode. The blue and cyan/red dots correspond to the unreacted and reacted regions, respectively. | ||
To highlight the critical role of O2 in the operation of the Na–O2 battery, a control experiment without O2 was carried out. As shown in Fig. S9a–c,† upon applying a negative potential on the SA-Co/rGO cathode side, Na balls emerged at the interface of rGO and Na substrate by an electroplating process (side reaction). Meanwhile, a reaction front (Na intercalation) propagated along the rGO sheet with lapse of time, and no observable spherical products were formed on the cathode surface. According to the electron diffraction patterns (EDPs) shown in Fig. S9d and e,† the minor discharge product was confirmed to be polycrystalline Na2O. The formation of the minor discharge product comprising polycrystalline Na2O originates from the chemical oxidation of the intercalated Na by the residual O2 (<10−5 Pa) in the TEM column. The lack of sufficient O2 prevented the formation of a large amount of discharge product (Na2O2). In summary, with O2, the oxygen reduction reaction (ORR) took place in the SA-Co/rGO cathode during discharge; without O2, no ORR took place, and the discharge reaction was dominated by the plating of Na and intercalation of Na+ ions into rGO.
Another all-solid-state Na–O2 nanobattery with an SA-Co/rGO cathode was operated to investigate its rechargeability. Spherical products were formed on the surface of SA-Co/rGO during the discharge process (Fig. S10a–c, Movie S2†), which is similar to that observed in Fig. 2. Most discharge products were decomposed during the charge process (Fig. S10d–f†). The crystalline structure and the chemical composition of the discharge and charge products were characterized by EDP (Fig. S10g and h†) and EELS (Fig. S10i and j†), respectively. From the EDPs, the discharge products were proved to be Na2O2. The weak diffraction rings indexed as Na2O2 in the charged products indicate that most of the discharged products have decomposed with minor Na2O2 residue. As shown in the EELS spectra (Fig. S10i and j†), the major plasmon loss peaks of SA-Co/rGO shifted from 23.8 eV of the initial sample (Fig. S10i,† blue) to 21.0 eV after discharge (Fig. S10i,† red), and then shifted to 23.3 eV (Fig. S10i,† green) after charging. This experiment indicates the good rechargeability of the Na–O2 nanobattery with an SA-Co/rGO cathode.
The Na–O2 nanobattery with an SA-Co/rGO cathode was studied for three discharge–charge cycles to investigate its cycling performance (Fig. 4 and Movie S3†). Upon applying a negative potential to the cathode against the anode Na, spherical products were clearly formed on the SA-Co/rGO surface (Fig. 4b, marked by red arrows). When the potential was reversed, the products gradually decomposed and converted into a porous structure (Fig. 4c, marked by yellow arrows) with a shell-like scaffold left on the surface. When a negative potential was applied on the SA-Co/rGO cathode again, the porous structure was gradually filled up with new spherical products, and new products were also present on the surface of SA-Co/rGO (Fig. 4d–e). The spherical products decomposed and converted into a porous structure again when the potential was reversed (Fig. 4f). These processes were repeatable in the 3rd cycle (Fig. 4g–i). It should be noted that the spherical products were not completely decomposed at the end of the 3rd charging process, which may be ascribed to the poor electronic and ionic conductivity of the porous residual Na2O2 structure.20,29,30
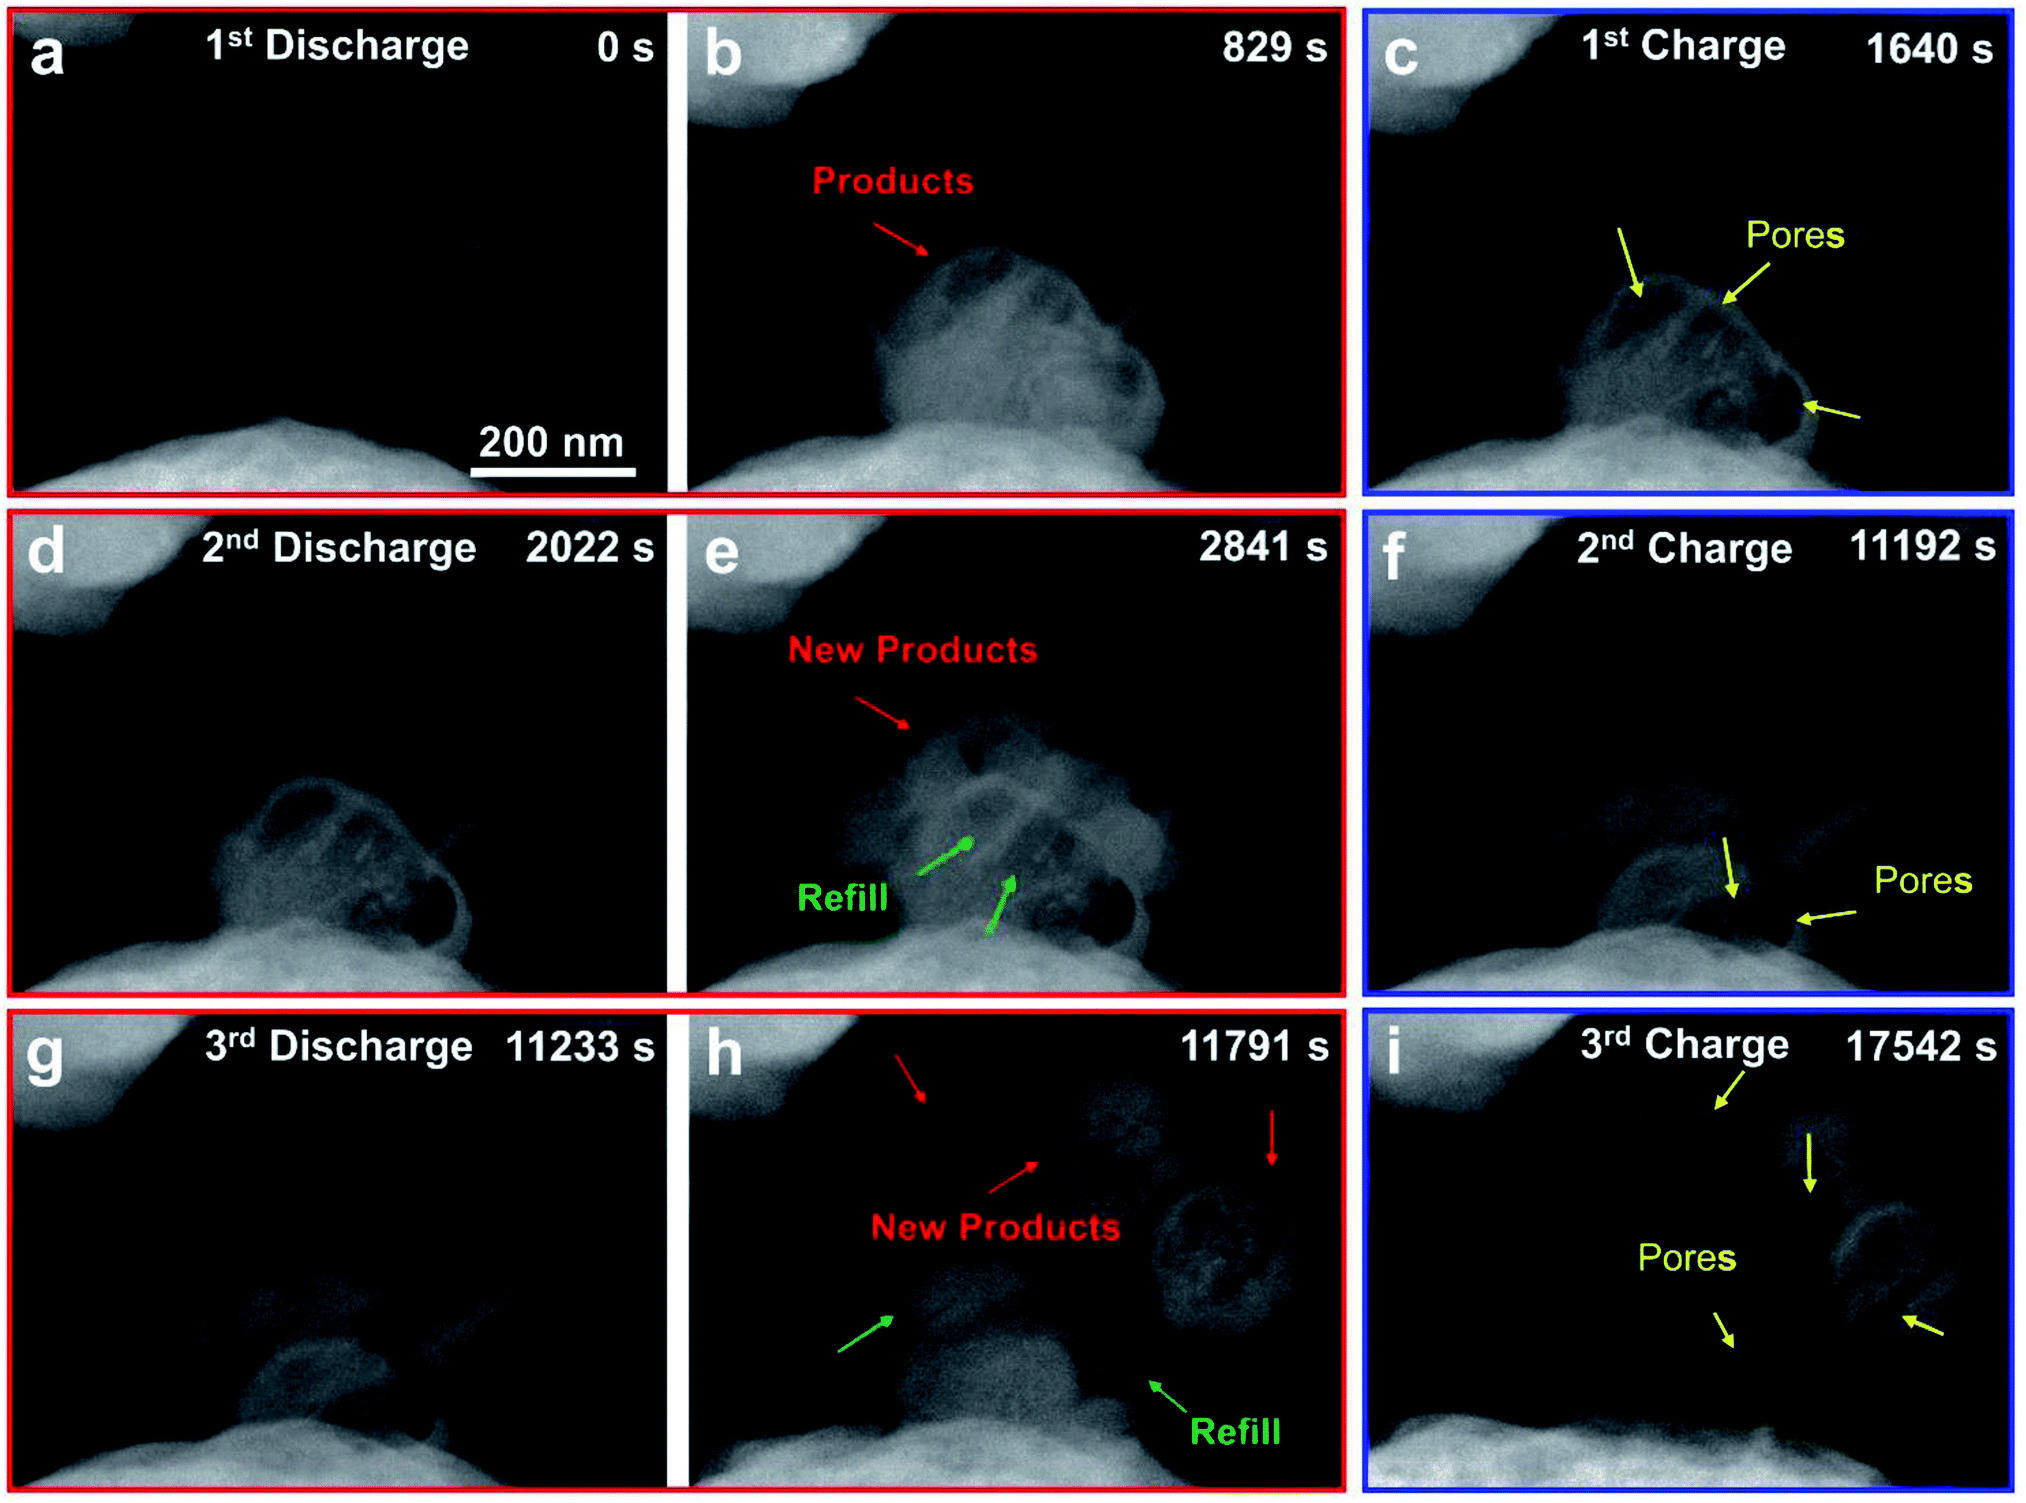 | ||
| Fig. 4 Morphological evolution of SA-Co/rGO in an Na–O2 nanobattery during the first three discharge/charge cycles. In the 1st cycle during the discharge reaction, spherical products emerged at the triple phase point of SA-Co/rGO, Na substrate and O2, and then propagated along the surface of SA-Co/rGO (a, b). Upon a reversing bias, the charge reaction took place, and the spherical products became porous with lapse of time with a shell-like scaffold left on the surface. The discharge/charge reactions were repeatable for three cycles, as shown in (a)–(c), (d)–(f), and (g)–(i), respectively. | ||
Coin cell Na–O2 battery performance
To further validate the in situ ETEM results, electrochemical tests using coin cell Na–O2 batteries with SA-Co/rGO and rGO cathodes were also conducted. The galvanostatic discharge and charge profiles of the coin cell Na–O2 batteries are shown in Fig. S11. Fig. S11a and b† show the selected discharge and charge profiles of SA-Co/rGO and rGO at a fixed capacity of 500 mA h g−1, respectively. As revealed in the first cycle's discharge/charge curves (Fig. S11a†), it is clearly indicated that the SA-Co/rGO cathode exhibits a voltage gap of 0.5 V at a current density of 100 mA g−1. The corresponding voltage gap for the rGO cathode is calculated to be 1.5 V (Fig. S11b†). The discharge voltage of the SA-Co/rGO electrode was still higher than 2 V after 15 cycles, while that of the rGO cathode remained above 2 V for only 10 cycles, and then decreased to ∼1.25 V at the 15th cycle. For both batteries, the charge overpotential values increased gradually with increasing cycle numbers. After 15 cycles, the charge voltage of the battery with an SA-Co/rGO cathode reached ∼4.3 V, while that with rGO was ∼4.6 V. These results indicate that SA-Co/rGO shows better stability than rGO. The plateau voltages of the first discharge curves were slightly higher than in the following cycles, which may be attributed to the sodiation process of the electrode materials.31 The discharge voltages of the battery with an SA-Co/rGO cathode at all cycles were higher than 2 V, which is close to the theoretical discharge voltage of Na2O2 (2.33 V).32,33 The main charge plateau was at ∼4 V, in good agreement with the reported decomposition voltage of Na2O2.32 The slight slope in the charge process between 2.5 and 3.5 V may correspond to the decomposition of NaOx.31 These results indicate the higher catalytic activity and stability of the SA-Co/rGO cathode than that of rGO in coin cell Na–O2 batteries. Furthermore, cycling tests (Fig. S11c†) show that the Na–O2 battery with an SA-Co/rGO cathode can undergo several cycles over 180 hours with less polarization than one with an rGO cathode, indicating the advantage of SAC in improving the stability and reversibility of an Na–O2 battery.DFT calculations and proposed SAC electrocatalysis mechanism
To understand the electro-catalysis mechanism of SA-Co/rGO, DFT calculations were carried out to investigate the adsorption property (Fig. S12 and Table S2†), density of states (Fig. S13a, b†), difference electrons density (Fig. S13c, d†) and free energy diagrams (Fig. 5b, c and S14†) during ORR and OER. Firstly, the adsorption property of Na and O2 on monolayered SA-Co/rGO and a graphene slab were investigated. For monolayered SA-Co/rGO, an Na atom prefers to adsorb on the hollow site above the center of the C–N–Co ring (Site A, Fig. S12a†), with an adsorption energy of −0.87 eV. The strong interaction between Na and the SA-Co/rGO slab ensure the diffusion of Na+ along the slab surface guided by the electric field. Meanwhile, the O2 molecule prefers to strongly adsorb on a top site of the Co atom in the single-atom configuration (Site B, Fig. S12b†) with an adsorption energy of −1.27 eV. The strong adsorption contributes to the capture of the O2 molecule by a single Co site, and then promotes the following ORR process combined with e− and Na+. For monolayered graphene, an Na atom energetically prefers to adsorb onto the hollow site of a C6 ring in graphene (Site C, Fig. S12c†) with an adsorption energy of −1.50 eV. The strong adsorption between Na and graphene holds the diffusion of Na+ along the graphene surface under an electric field. The O2 molecule prefers to lay across two opposing carbon atoms and orient parallel to the graphene plane (Site D, Fig. S12d†) with weak adsorption (adsorption energy of −0.02 eV), which is consistent with previous reports.34–36 Thus, much weaker interaction between O2 and pure graphene than that between Na and pure graphene causes the preferred Na atom adsorption rather than O2 adsorption, hindering the ORR. To shed further light on the interaction between the O2 molecule and monolayered SA-Co/rGO or graphene surface, density of states (DOS) and difference electron density analysis were carried out. After O2 adsorption on SA-Co/rGO, significant hybridization between Co (3d) and O (2p) orbitals was observed around the Fermi energy (Fig. S13a†), while no hybridization between C (2p) and O (2p) orbitals was observed after O2 was adsorbed on graphene (Fig. S13b†), consistent with the DFT result, showing that the O2 molecule prefers to strongly bond with SA-Co/rGO. In order to verify the electron transfer between O2 and the catalytic surface, difference electron densities are plotted in Fig. S13c and d,† defined as Δρ = ρ(surface + O2) − ρ(surface) − ρ(O2), where ρ(surface + O2), ρ(surface) and ρ(O2) represent the electron density for the total system, the surface without O2, and an isolated O2 molecule located at the same position as in the total system, respectively. As shown in Fig. S13c,† electrons accumulate at the Co–O bond after adsorption of O2 on the SA-Co/rGO surface, which suggests strong interaction between O and Co and robust electron transfer. In addition, electron redistribution occurred within the O2 molecule, and some electrons in the middle of the two O atoms are removed, indicating weakened O–O bond strength. In contrast, less electron redistribution occurred within the O2 molecule and there was weak interaction between O and C after the adsorption of O2 on graphene (Fig. S13d†). These results indicate that SA-Co/rGO should have higher activity than graphene for activating O2. Combining the in situ ETEM results and the DFT calculated results, we propose the ORR process on the SA-Co/rGO catalyst as follows. When a negative potential is applied on the cathode side, the reaction begins from the Na+ ion diffusion process. Then, in the SA-Co/rGO catalyst, the O2 molecule is captured and activated by the single-atom Co site due to the suitable adsorption energy between O2 and the single-atom Co site.37,38 and rapidly reacts with Na+ and e− to form Na2O2 (Fig. 5a). In contrast, in the multilayered graphene catalyst, the intercalated Na+ slowly reacts with O2 and e− due to the weak adsorption of O2 on graphene.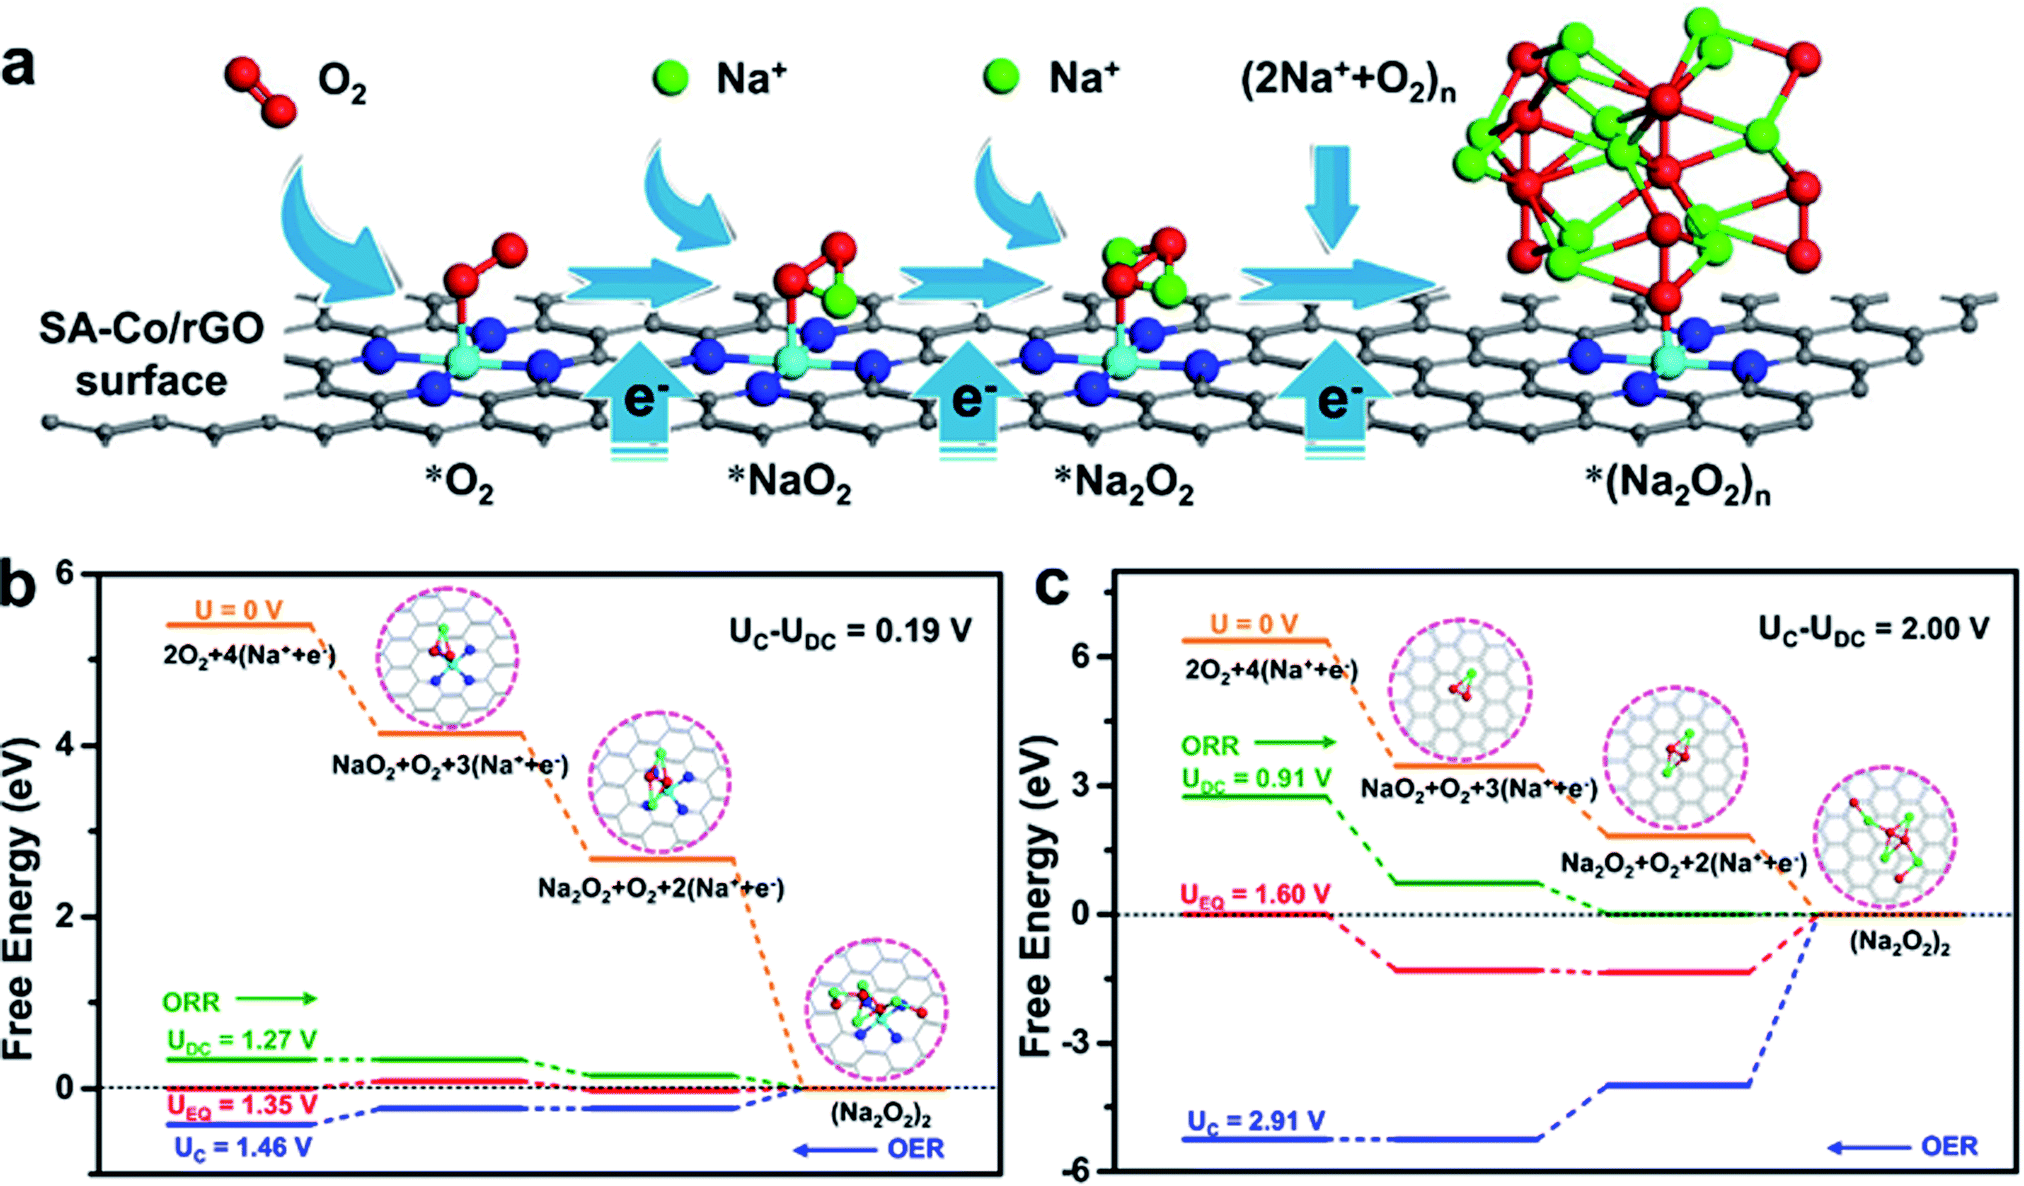 | ||
| Fig. 5 DFT calculation showing the atomic-scale electrocatalysis mechanism of SA-Co. (a) Scheme of the basic ORR mechanism on the SA-Co/rGO surface. Firstly, O2 is attached to the surface; then the first charge transfer takes place to form adsorbed NaO2; with the second charge transfer, NaO2 receives one more Na+ to form adsorbed Na2O2; finally, with the following charge transfer process, Na2O2 reacts with more Na+ and gets incorporated into the (Na2O2)n lattice (solid). Calculated free energy diagrams for the discharge–charge reactions on the active surface of monolayered SA-Co/rGO and graphene. (b) Monolayered SA-Co/rGO. (c) Monolayered graphene. (Inset: top view of the optimized structures.) | ||
Combining in situ ETEM results with the reported mechanisms on SACs.21,22 the atomic-scale mechanism of ORR on an SA-Co/rGO catalyst is proposed via three distinct routes: (1) O2 + Na+ + e− → NaO2; (2) NaO2 + Na+ + e− → Na2O2; and (3) Na2O2 + O2 + 2(Na+ + e−) → (Na2O2)2. Therefore, the calculated free energy diagrams for the nucleation and decomposition of (Na2O2)2 clusters at different overpotentials for the SA-Co/rGO and graphene cathodes were carefully investigated to understand the kinetics of the ORR process on the SA-Co/rGO catalyst. The energetically optimized adsorption configurations for the pristine slabs, the intermediate product (NaO2), and discharge product (Na2O2), and cluster ((Na2O2)2) on the SA-Co/rGO and graphene slabs are shown in Fig. S14.† At zero overpotential, which is defined as the equilibrium potential of the reaction Na ↔ Na+ + e−, the energy difference between each pathway accounts for the Gibbs energy of formation of the corresponding optimized constructions. The charge/discharge potential (UC/UDC) is the lowest/highest potential at which all the steps during charge/discharge (OER/ORR, marked with blue/olive-green arrows in Fig. 5b and c) are exothermic. Here the overpotentials are employed to evaluate the oxygen electrode performance, defined as ηORR = UEQ − UDC and ηOER = UC − UEQ for discharge and charge processes, respectively, where UEQ is the equilibrium potential. The rate-limiting steps for the ORR/OER pathways of the SA-Co/rGO cathode are the formation of NaO2 (intermediate products) and the oxidation of Na2O2 (discharge products), respectively. In comparison, the rate-limiting steps for the ORR/OER pathways of the graphene cathode are the growth of the Na2O2 cluster and oxidation of NaO2, respectively. The calculated overpotentials of oxidation reduction and oxidation evolution for SA-Co/rGO are 0.08 and 0.11 V, respectively. While the overpotentials of graphene are 0.69 and 1.31 V, respectively. Both discharge and charge overpotentials of the SA-Co/rGO cathode are significantly lower than those of the graphene cathode, which supports the fact that the exposed single-atom Co active sites are a decisive factor for reducing both Na2O2 generation and oxidization overpotentials. These results highlight the superiority of SA-Co/rGO in improving the performance of oxygen electrode reactions and are consistent with the above in situ ETEM and coin cell Na–O2 battery experimental observations.
Conclusions
In summary, the morphological and structural evolution of the SA-Co/rGO cathode in Na–O2 nanobatteries during the discharge/charge process were investigated in situ inside a Cs-corrected ETEM. The electro-catalysis phenomenon of SACs in the cathode was directly observed. The SACs show excellent catalytic activity for both ORR and OER in the Na–O2 nanobattery. Plenty of spherical Na2O2 formed on the surface of SA-Co/rGO during discharge, and the Na2O2 can be easily decomposed in the following charge process. In contrast, in the absence of SACs, no spherical product was generated on the graphene surface during the discharge process. Furthermore, first-principles calculations show that the local coordination environment (Co + 4N) played a key role in tuning the charge density and oxidation states of the isolated Co active sites, which contributes to the excellent performance of the Na–O2 battery with SACs used as the cathode. Our work offers an in-depth fundamental understanding of the electrocatalysis mechanism of SAC in Na–O2 batteries, which may provide an important clue to improving the performance of Na–O2 batteries for energy storage applications.Experimental and computational section
Materials preparation
Firstly, graphene oxide solution at a concentration of 1 mg mL−1 was stirred for 6 h to obtain a uniform suspension. Then, 0.3 mL of cobalt nitrate (10 mg mL−1) solution was added into 100 mL of graphene oxide suspension under vigorous stirring, and the obtained suspension was centrifuged for freeze-drying. The dried flocculent product was transferred into a tubular furnace, and calcined at 400 °C for 4 hours under a constant Ar flow, where the heating rate was set at 5.6 °C min−1 (Fig. S1†). Finally, the SA-Co/rGO powder was obtained after cooling to room temperature naturally.Electrochemical measurements
For the preparation of the cathode of a coin cell Na–O2 battery, a slurry by mixing Ketjen Black (KB, 60 wt%), SA-Co/rGO (30 wt%) and polytetrafluoroethylene (PTFE, 10 wt%) was synthesized and pasted in a stainless-steel mesh 12.4 μm thick. For comparison, rGO was also tested. All the cells were assembled under an Ar atmosphere, using clean sodium metal foil as the anode, a glass-fiber separator, and a 1 M tetraethylene glycol dimethyl ether (TEGDME)-sodium trifluoromethane sulfonate (NaCF3SO3) electrolyte. The battery tests were conducted under 1 atm O2 atmosphere at 25 °C. The gravimetric capacity and current densities were calculated based on the carbon mass. Prior to measurements, the cells were kept still at open circuit overnight in a hermetic container purged with desiccative ultra-pure O2 (99.999%, 1 atm). Then, the electrochemical tests were performed in a galvanostatic mode employing a CT3001A LAND battery tester.All-solid-state nanobattery assembly and characterization
All-solid-state Na–O2 nanobatteries were constructed with a TEM-STM (Scanning Tunneling Microscopy) holder (Pico Femto FE-F20) inside a Cs-corrected environmental-transmission electron microscope (ETEM, Titan G2 300 kV, Thermo Fisher Scientific). Briefly, a half Cu grid glued with SA-Co/rGO mounted on one end of the TEM-STM holder was used as the working cathode. A tungsten (W) tip scratched with Na was inserted into the other end of the TEM-STM holder, and used as the reference and counter electrode. All the steps described above were carried out in an argon environment inside a glove box. Then, the holder was sealed in a home-built air-tight bag and transferred to the ETEM. The total time of exposure to air was less than 2 s, as clarified in our previous paper, and the Na substrate was coated by a mixed layer of Na2O and Na2O2 with a thickness of 204–257 nm in ambient O2, which was used as the solid electrolyte for Na+ transportation.39 Prior to the experiment, high-purity O2 (99.999%) was introduced to the specimen chamber with a pressure of 1.0 mbar. The tungsten tip scratched with Na was manipulated to approach the graphene-like cathode, and then a potential was applied to the cathode versus the Na metal electrode to either charge or discharge the nanobattery. To minimize the effect of the electron beam, all the experiments were carried out in an annular dark field (ADF) mode, in which the samples were not showered by the electron beam most of the time except for images taken intermittently. Therefore, the total electron dose experienced by the samples was much less than in the TEM mode.40 It should be noted that neither an apparent reaction front nor a large amount of discharge product was observed without biasing, indicating that the discharge reaction was driven by electrochemical potential rather than by the electron beam. The STEM-HAADF images and elemental mapping were acquired using a Cs-corrected scanning transmission electron microscope (Titan Cubed Themis Z 300 kV, Thermo Fisher Scientific), which was equipped with a DCOR + spherical aberration corrector for the electron probe, and a quad-silicon drift detector (Super-X) optimized for rapid X-ray collection. The ADF image and corresponding EELS spectrum of the Co + 4N local structure were taken with a JEOL 2100F transmission electron microscope equipped with a DELTA corrector and Gatan low-voltage quantum spectrometer operating at 60 kV.XAFS measurements and analysis
The X-ray absorption structural spectra of the Co K-edge (7709 eV) were collected at 20BM-B of the Advanced Photon Source (APS) at the Argonne National Laboratory (ANL). All data were collected in the fluorescence mode due to low Co concentration. A Vertox ME4 silicon drift diode detector was used to collect the Co K fluorescence signal while the Si (111) monochromator scanned the incident X-ray photon energy through the Co K adsorption edge. All spectra were collected in ambient conditions.The acquired EXAFS data were processed according to standard procedures using the ATHENA module implemented in the IFEFFIT software package.41–43 The k3-weighted EXAFS spectra were obtained by subtracting the post-edge background from the overall absorption and then normalizing with respect to the edge-jump step. Subsequently, the k3-weighted χ(k) data of the Co K-edge were Fourier transformed to real (R) space using a Hanning window (dk = 1.0 Å−1) to separate the EXAFS contributions from different coordination shells. To obtain the quantitative structural parameters around central atoms, least–squares curve parameter fitting was performed using the ARTEMIS module of the IFEFFIT software package.
Computational details
All the spin-polarized DFT calculations in the present study were performed with Dmol3 code.44 The exchange-correlation effects are described by the generalized gradient approximation (GGA) with Perdew–Burke–Ernzerhof functional (PBE).45 DFT semicore pseudopotential core treatment was implemented for relativistic effects with the basis set of double numerical plus polarization (DNP).46,47 Before geometrical optimization of SA-Co/rGO, the initial spin of the Co atom is set to 3, which is based on the number of unpaired electrons in the d band of the Co atom. The convergence criteria of the geometrical optimization are set to 1.0 × 10⁻⁵ hartree, 2.0 × 10⁻³ hartree Å−1 and 5.0 × 10⁻³ Å for the energy change, gradient and displacement, respectively. The Grimme method for DFT-D correction was used to accurately describe the van der Waals (vdW) interaction.48 The supercell models of both monolayered SA-Co/rGO (constructed based on EXAFS fitting) and graphene were established with cell dimensions of a = 17.34 Å, and b = 17.20 Å. The periodic images of the atoms were separated by a vacuum slab of 20 Å in the c-axis, which leads to negligible interactions between the system and periodic images.The free energies were obtained from the thermodynamics-based methodology suggested by Nørskov and co-workers,49,50 which has been successfully applied to study several electrochemical reactions.49,51–53 Here we define an Na electrode by setting the equilibrium between bulk Na metal and Na+ ions solvated in the present situation (298.15 K, 0.1 bar) plus electrons (e−) in the electrode, i.e., Na(s) → Na+ + e−, to U0 = 0 V. Reaction free energy (ΔG) is defined as
| ΔG = ΔE + ΔZPE − TΔS + ΔGU |
| Eads = Esum − Eslab − EM |
Author contributions
Haiming Sun, Qiunan Liu: methodology, investigation, data curation, formal analysis, visualization, writing – original draft. Zhiying Gao, Lin Geng, Yanshuai Li: methodology, investigation, formal analysis. Fengyu Zhang, Jitong Yan, Yufei Gao, Kazu Suenaga: resources. Liqiang Zhang, Yongfu Tang, Jianyu Huang: supervision, conceptualization, methodology, writing – review & editing.Conflicts of interest
The authors declare no conflict of interest.Acknowledgements
This work was financially supported by the National Natural Science Foundation of China (Grant Nos. 51802277, 52022088, 51971245, 51772262, 21406191, U20A20336, 21935009), Beijing Natural Science Foundation (2202046), Fok Ying-Tong Education Foundation of China (No. 171064), Natural Science Foundation of Hebei Province (Nos. F2021203097, B2020203037, B2018203297), Hunan Innovation Team (2018RS3091). The authors thank the 20BM-B station in Advanced Photon Source (APS) at Argonne National Laboratory (ANL) for XAFS measurement.References
- R. Brindha, R. Mohanraj, P. Manojkumar, M. Selvam and K. Sakthipandi, J. Electrochem. Soc., 2020, 167, 120539 CrossRef CAS.
- J. Mei, T. Liao, J. Liang, Y. Qiao, S. X. Dou and Z. Sun, Adv. Energy Mater., 2020, 10, 1901997 CrossRef CAS.
- E. Mourad, Y. K. Petit, R. Spezia, A. Samojlov, F. F. Summa, C. Prehal, C. Leypold, N. Mahne, C. Slugovc, O. Fontaine, S. Brutti and S. A. Freunberger, Energy Environ. Sci., 2019, 12, 2559–2568 RSC.
- W. Zhang, Y. Huang, Y. Liu, L. Wang, S. Chou and H. Liu, Adv. Energy Mater., 2019, 9, 1900464 CrossRef.
- I. Landa-Medrano, I. Lozano, N. Ortiz-Vitoriano, I. Ruiz de Larramendi and T. Rojo, J. Mater. Chem. A, 2019, 7, 8746–8764 RSC.
- S. Palanisamy, A. P. Shyma, S. Srinivasan and R. Venkatachalam, J. Energy Storage, 2019, 22, 283–294 CrossRef.
- F. Cheng and J. Chen, Chem. Soc. Rev., 2012, 41, 2172–2192 RSC.
- D. Geng, N. Ding, T. S. A. Hor, S. W. Chien, Z. Liu, D. Wuu, X. Sun and Y. Zong, Adv. Energy Mater., 2016, 6, 1502164 CrossRef.
- D. Aurbach, B. D. McCloskey, L. F. Nazar and P. G. Bruce, Nat. Energy, 2016, 1, 16128 CrossRef CAS.
- R. Gao, D. Zhou, D. Ning, W. Zhang, L. Huang, F. Sun, G. Schuck, G. Schumacher, Z. Hu and X. Liu, Adv. Funct. Mater., 2020, 30, 2002223 CrossRef CAS.
- O. Kasian, J.-P. Grote, S. Geiger, S. Cherevko and K. J. J. Mayrhofer, Angew. Chem., Int. Ed., 2018, 57, 2488–2491 CrossRef CAS.
- H. Zhang, Y. Liu, T. Chen, J. Zhang, J. Zhang and X. W. Lou, Adv. Mater., 2019, 31, 1904548 CrossRef CAS.
- Y.-J. Wang, D. P. Wilkinson and J. Zhang, Chem. Rev., 2011, 111, 7625–7651 CrossRef CAS.
- T. Reier, M. Oezaslan and P. Strasser, ACS Catal., 2012, 2, 1765–1772 CrossRef CAS.
- Y. Li, B. Li, D. Zhang, L. Cheng and Q. Xiang, ACS Nano, 2020, 14, 10552–10561 CrossRef CAS.
- J. Li, J. Liu and B. Yang, J. Energy Chem., 2021, 53, 20–25 CrossRef.
- Y. Li, J. Hao, H. Song, F. Zhang, X. Bai, X. Meng, H. Zhang, S. Wang, Y. Hu and J. Ye, Nat. Commun., 2019, 10, 2359 CrossRef.
- S. Liu, H. Yang, X. Huang, L. Liu, W. Cai, J. Gao, X. Li, T. Zhang, Y. Huang and B. Liu, Adv. Funct. Mater., 2018, 28, 1800499 CrossRef.
- Q. Wang, X. Huang, Z. L. Zhao, M. Wang, B. Xiang, J. Li, Z. Feng, H. Xu and M. Gu, J. Am. Chem. Soc., 2020, 142, 7425–7433 CrossRef CAS.
- X. Hu, G. Luo, Q. Zhao, D. Wu, T. Yang, J. Wen, R. Wang, C. Xu and N. Hu, J. Am. Chem. Soc., 2020, 142, 16776–16786 CrossRef CAS.
- L.-N. Song, W. Zhang, Y. Wang, X. Ge, L.-C. Zou, H.-F. Wang, X.-X. Wang, Q.-C. Liu, F. Li and J.-J. Xu, Nat. Commun., 2020, 11, 2191 CrossRef CAS PubMed.
- P. Wang, Y. Ren, R. Wang, P. Zhang, M. Ding, C. Li, D. Zhao, Z. Qian, Z. Zhang, L. Zhang and L. Yin, Nat. Commun., 2020, 11, 1576 CrossRef CAS.
- C. Hu, L. Gong, Y. Xiao, Y. Yuan, N. M. Bedford, Z. Xia, L. Ma, T. Wu, Y. Lin, J. W. Connell, R. Shahbazian-Yassar, J. Lu, K. Amine and L. Dai, Adv. Mater., 2020, 32, 1907436 CrossRef CAS.
- W. Y. Noh, E. M. Kim, K. Y. Kim, J. H. Kim, H. Y. Jeong, P. Sharma, G. Lee, J.-W. Jang, S. H. Joo and J. S. Lee, J. Mater. Chem. A, 2020, 8, 18891–18902 RSC.
- K. Kim, T. Kang, M. Kim and J. Kim, Appl. Catal., B, 2020, 275, 119107 CrossRef CAS.
- J. Y. Huang, F. Ding, B. I. Yakobson, P. Lu, L. Qi and J. Li, Proc. Natl. Acad. Sci., 2009, 106, 10103 CrossRef CAS.
- Y.-C. Lin, P.-Y. Teng, P.-W. Chiu and K. Suenaga, Phys. Rev. Lett., 2015, 115, 206803 CrossRef.
- H. Fei, J. Dong, Y. Feng, C. S. Allen, C. Wan, B. Volosskiy, M. Li, Z. Zhao, Y. Wang, H. Sun, P. An, W. Chen, Z. Guo, C. Lee, D. Chen, I. Shakir, M. Liu, T. Hu, Y. Li, A. I. Kirkland, X. Duan and Y. Huang, Nat. Catal., 2018, 1, 63–72 CrossRef CAS.
- H.-D. Lim, B. Lee, Y. Zheng, J. Hong, J. Kim, H. Gwon, Y. Ko, M. Lee, K. Cho and K. Kang, Nat. Energy, 2016, 1, 16066 CrossRef CAS.
- D. Sun, Y. Shen, W. Zhang, L. Yu, Z. Yi, W. Yin, D. Wang, Y. Huang, J. Wang, D. Wang and J. B. Goodenough, J. Am. Chem. Soc., 2014, 136, 8941–8946 CrossRef CAS PubMed.
- S. Han, C. Cai, F. Yang, Y. Zhu, Q. Sun, Y. G. Zhu, H. Li, H. Wang, Y. Shao-Horn, X. Sun and M. Gu, ACS Nano, 2020, 14, 3669–3677 CrossRef CAS.
- C. L. Bender, D. Schröder, R. Pinedo, P. Adelhelm and J. Janek, Angew. Chem., Int. Ed., 2016, 55, 4640–4649 CrossRef CAS PubMed.
- P. Hartmann, C. L. Bender, M. Vračar, A. K. Dürr, A. Garsuch, J. Janek and P. Adelhelm, Nat. Mater., 2013, 12, 228–232 CrossRef CAS PubMed.
- J. H. Lee, S. G. Kang, H. S. Moon, H. Park, I. T. Kim and S. G. Lee, Appl. Surf. Sci., 2015, 351, 193–202 CrossRef CAS.
- A. S. Dobrota, I. A. Pašti, S. V. Mentus and N. V. Skorodumova, Phys. Chem. Chem. Phys., 2017, 19, 8530–8540 RSC.
- K. A. Novčić, A. S. Dobrota, M. Petković, B. Johansson, N. V. Skorodumova, S. V. Mentus and I. A. Pašti, Electrochim. Acta, 2020, 354, 136735 CrossRef.
- J. Zhao and Z. Chen, J. Am. Chem. Soc., 2017, 139, 12480–12487 CrossRef CAS PubMed.
- R. Choi, J. Jung, G. Kim, K. Song, Y.-I. Kim, S. C. Jung, Y.-K. Han, H. Song and Y.-M. Kang, Energy Environ. Sci., 2014, 7, 1362–1368 RSC.
- Q. Liu, Y. Tang, H. Sun, T. Yang, Y. Sun, C. Du, P. Jia, H. Ye, J. Chen, Q. Peng, T. Shen, L. Zhang and J. Huang, ACS Nano, 2020, 14, 13232–13245 CrossRef CAS.
- Q. Liu, T. Yang, C. Du, Y. Tang, Y. Sun, P. Jia, J. Chen, H. Ye, T. Shen, Q. Peng, L. Zhang and J. Huang, Nano Lett., 2018, 18, 3723–3730 CrossRef CAS.
- B. Ravel and M. Newville, J. Synchrotron Radiat., 2005, 12, 537–541 CrossRef CAS PubMed.
- D. C. Koningsberger, X-Ray absorption: principles, applications, techniques of EXAFS, SEXAFS, and XANES, John Wiley and Sons, United States, 1988 Search PubMed.
- J. J. Rehr and R. C. Albers, Rev. Mod. Phys., 2000, 72, 621–654 CrossRef CAS.
- B. Delley, J. Chem. Phys., 2000, 113, 7756–7764 CrossRef CAS.
- J. P. Perdew, K. Burke and M. Ernzerhof, Phys. Rev. Lett., 1996, 77, 3865–3868 CrossRef CAS PubMed.
- B. Delley, Phys. Rev. B: Condens. Matter Mater. Phys., 2002, 66, 155125 CrossRef.
- B. Delley, J. Chem. Phys., 1990, 92, 508–517 CrossRef CAS.
- S. Grimme, J. Chem. Phys., 2006, 27, 1787–1799 CAS.
- J. K. Nørskov, J. Rossmeisl, A. Logadottir, L. Lindqvist, J. R. Kitchin, T. Bligaard and H. Jónsson, J. Chem. Phys. B, 2004, 108, 17886–17892 CrossRef.
- J. S. Hummelshøj, J. Blomqvist, S. Datta, T. Vegge, J. Rossmeisl, K. S. Thygesen, A. C. Luntz, K. W. Jacobsen and J. K. Nørskov, J. Chem. Phys., 2010, 132, 071101 CrossRef PubMed.
- J. Rossmeisl, J. K. Nørskov, C. D. Taylor, M. J. Janik and M. Neurock, J. Chem. Phys. B, 2006, 110, 21833–21839 CrossRef CAS.
- H. A. Hansen, I. C. Man, F. Studt, F. Abild-Pedersen, T. Bligaard and J. Rossmeisl, Phys. Chem. Chem. Phys., 2010, 12, 283–290 RSC.
- A. A. Peterson, F. Abild-Pedersen, F. Studt, J. Rossmeisl and J. K. Nørskov, Energy Environ. Sci., 2010, 3, 1311–1315 RSC.
- J. S. Hummelshøj, A. C. Luntz and J. K. Nørskov, J. Chem. Phys., 2013, 138, 034703 CrossRef.
Footnotes |
| † Electronic supplementary information (ESI) available. See DOI: 10.1039/d1ta08080f |
| ‡ These authors contributed equally to this work. |
| This journal is © The Royal Society of Chemistry 2022 |