 Open Access Article
Creative Commons Attribution 3.0 Unported Licence
Atomic-scale investigation of cation doping and defect clustering in the anti-perovskite Na3OCl sodium-ion conductor†
Benedek A.
Goldmann
 a,
Matt J.
Clarke
 a,
James A.
Dawson
 bc and
M. Saiful
Islam
 *a
*a
aDepartment of Chemistry, University of Bath, Bath, BA2 7AY, UK. E-mail: M.S.Islam@bath.ac.uk
bChemistry – School of Natural and Environmental Sciences, Newcastle University, Newcastle Upon Tyne, NE1 7RU, UK
cCentre for Energy, Newcastle University, Newcastle Upon Tyne, NE1 7RU, UK
First published on 22nd October 2021
Abstract
Solid-state batteries present potential advantages over their liquid-based electrolyte equivalents, including enhanced safety and increased energy density. In the search for novel solid electrolytes, the anti-perovskite family of materials are attracting growing interest. However, while there is significant work on Li-rich anti-perovskites, their Na-based counterparts and the atomistic effects of aliovalent doping on these materials are not fully characterised. Here, we investigate the effects on Na-ion conductivity of doping with divalent (Mg, Ca, Sr and Ba) and trivalent cations (Al and Ga), and of possible dopant-vacancy clustering in the anti-perovskite Na3OCl by employing atomistic simulation techniques. Our results highlight the potential of Mg2+, Ca2+, Al3+ and Ga3+ doping due to their favourable incorporation and increased Na-ion vacancy concentration. Local defect clustering and binding energies are analysed, and such effects inhibit Na-ion conductivity in the doped Na3OCl solid electrolyte at operating temperatures. These results provide a framework to guide future work on anti-perovskites to enhance their solid electrolyte properties.
Introduction
Solid-state lithium- and sodium-ion batteries are attracting growing interest due to their enhanced safety and higher energy density compared to conventional liquid electrolyte cells.1–9 A wide range of Li- and Na-based structures have been investigated for potential use as solid electrolytes. One such family of ionic conductors that has been attracting significant attention is characterized by the anti-perovskite structure. Anti-perovskite materials possess a number of promising properties for solid electrolyte applications, such as high ionic conductivity, negligible electronic conductivity, wide electrochemical windows10,11 and favourable mechanical behaviour,12–18 which allow them to be integrated into solid-state batteries. Another important aspect of the perovskite structure is that it is highly amenable to chemical substitution or ion doping in order to fine-tune mechanical or transport properties for a given application.In addition to recent work on Li-rich anti-perovskites Li3OX (X = Cl or Br),19–23 there have been structural and conductivity studies of the sodium analogues Na3OX (X = Cl or Br),24–35 as well as work on a range of other Na-rich anti-perovskites such as Na3ONO2 and Na3OBH4.36–51 In comparison to lithium, Na-ion batteries have the advantages of raw material abundance and reduced cost with possible use in large-scale grid storage applications. It is generally accepted that ion transport in Na-rich anti-perovskites takes place via Na-vacancy migration27 as sodium vacancies seem to be the majority sodium defect species. Therefore, one approach of potentially increasing Na-ion conductivity is doping with aliovalent cations at the sodium sites to increase the concentration of mobile sodium vacancies.26,29
Despite the recent interest in sodium-based solid electrolytes,7,8 the atomic-scale factors that control the dopant properties of Na-rich anti-perovskites have not been fully characterized, which are important for the optimization of their ionic conductivity. In this study, we use large-scale atomistic simulations to study a range of divalent (Mg, Ca, Sr and Ba) and trivalent (Al and Ga) cation dopants and their impact on the Na-ion transport properties of Na3OCl. We examine the modes of dopant incorporation and the possibility of dopant-vacancy association or clustering to gain new insights into the fundamental factors that could influence macroscopic sodium-ion conduction.
Results and discussion
Defect chemistry and dopant incorporation
The starting point of the modelling study was to reproduce the experimentally observed crystal structure using potentials-based techniques (see Methods section for details), which have been applied successfully to a rich variety of battery electrode and solid electrolyte materials.22,30,52 The anti-perovskite crystal structure of Na3OCl (shown in Fig. 1) consists of oxide ions at the typical B-site of an ABX3 perovskite, coordinated to six Na+ ions at the X-site, and the large Cl− ion occupying the 12-coordinate A-site. The calculated lattice parameter for the structure is 4.406 Å, which compares well with the experimental value of 4.496 Å; the same is found for the Na–O and Na–Cl bond lengths with the mean deviations less than 0.05 and 0.06 Å, respectively.25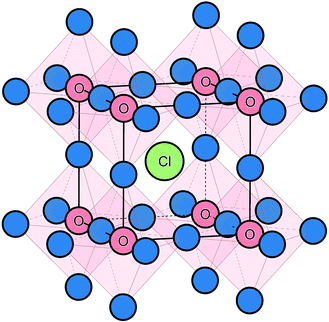 | ||
| Fig. 1 Na3OCl anti-perovskite structure highlighting the corner-sharing ONa6 octahedra available for Na-ion migration. Na ions are shown in blue. | ||
To probe the intrinsic defect chemistry of Na3OCl, a series of isolated point defect (vacancy and interstitial) energies were calculated. By combining these, the relative energies of formation of Frenkel and Schottky-type defects were determined. The general equations (using Kröger–Vink notation) and their formation energies are presented in Table 1 revealing two main points. First, the most favourable type of intrinsic defect for Na3OCl is found to be the NaCl Schottky-type comprised of Na and Cl vacancies, in agreement with previous work;29,30 the magnitude of the formation energy suggests a very low concentration at ambient temperatures. Second, the formation of oxide-ion vacancies and interstitials are highly unfavourable, and unlikely to occur in any significant concentration in the undoped material; these results confirm the structural stability of the perovskite framework.
Our simulation methods can probe dopant incorporation in Na3OCl by generating relative energies of dopant substitution, providing a valuable systematic guide to trends in dopant solubility. In this study, we have examined a wider range of aliovalent cationic dopants in Na3OCl than experimental reports, by considering doping with divalent (Mg, Ca, Sr and Ba) and trivalent cations (Al and Ga). The type of charge-compensating mechanism for such dopants is often assumed to be Na vacancies, but this has not been clearly established and could also involve compensation by Cl interstitials; the two doping mechanisms for M2+ and M3+ cations at the Na site are described by the following reactions:
 | (7) |
 | (8) |
 | (9) |
 | (10) |
 signifies an M2+ dopant substitutional defect. We therefore calculated the overall substitution energy for the two different compensation mechanisms (with the dopant potentials and lattice energies listed in the Methods).
The resulting dopant incorporation (or ‘solution’) energies are presented in Fig. 2, which indicate two main features. First, Mg, Ca, Al and Ga dopants on the Na site with Na-vacancy compensation are the most energetically favourable mode of dopant incorporation; these results confirm the creation of Na vacancies that are crucial for Na-ion conductivity. In general, the unfavourable dopants (Sr and Ba) were more than 1.5 eV higher in energy. Second, doping with Cl− interstitial compensation is relatively unfavourable suggesting that such a compensation mechanism is highly unlikely in the anti-perovskite structure; indeed, such interstitial defects have not been observed experimentally.
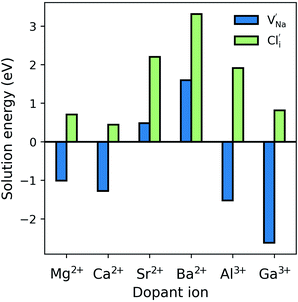 | ||
| Fig. 2 Dopant solution energies for M2+ and M3+ doping in Na3OCl based on eqn (7)–(10). Metal chlorides were used as doping agents in the reactions. | ||
Doping effects on Na-ion conductivity
Insights into Na-ion mobility and clustering effects at the atomic level are of importance when considering key solid electrolyte properties. However, obtaining such details for complex mixed-anion structures is far from straightforward. Here, molecular dynamics (MD) simulation techniques are used to investigate the Na-ion conduction properties for Mg-, Ca-, Al- and Ga-doped materials, as the most energetically favourable dopants. We note that our analysis uses large supercells (>17![[thin space (1/6-em)]](https://www.rsc.org/images/entities/char_2009.gif) 000 ions) and long timescales (10 ns), which are orders of magnitude greater than those currently attainable by DFT methods. The dopant concentrations were chosen in the range of previous experimental studies on the aliovalent doping on sodium-based anti-perovskites, between 0.3% and 1.7% used by Wang et al. and Fan et al., respectively.26,44 For the undoped system, a low level of Na vacancies (via NaCl Schottky defects) is introduced to facilitate Na conduction.
000 ions) and long timescales (10 ns), which are orders of magnitude greater than those currently attainable by DFT methods. The dopant concentrations were chosen in the range of previous experimental studies on the aliovalent doping on sodium-based anti-perovskites, between 0.3% and 1.7% used by Wang et al. and Fan et al., respectively.26,44 For the undoped system, a low level of Na vacancies (via NaCl Schottky defects) is introduced to facilitate Na conduction.
Fig. 3 shows an Arrhenius plot of the Na-ion conductivity over a wide temperature range for each system. The trends and magnitudes of the calculated ionic conductivities are consistent with experiment. The Na3OCl material shows a conductivity of 7.9 × 10⁻⁵ S cm−1 (extrapolated at 500 K), in good agreement with experimental impedance spectroscopy measurements (∼4 × 10⁻⁵ S cm−1).26 Both Mg- and Ca-doping leads to a slight increase in ionic conductivity at higher dopant levels, with the latter having an activation barrier of 0.58 eV in agreement with experimental values (∼0.6 eV).26 This concentration increase from Mg- and Ca-doping offsets the lower vacancy concentrations found in undoped Na3OCl. The highest Na-ion conductivity is found for the Mg-doped (1.2%) system. However, the Na-ion conductivities of the Al- and Ga-doped systems are lower than the undoped material, which may be related to greater defect clustering or binding factors, which we return to below.
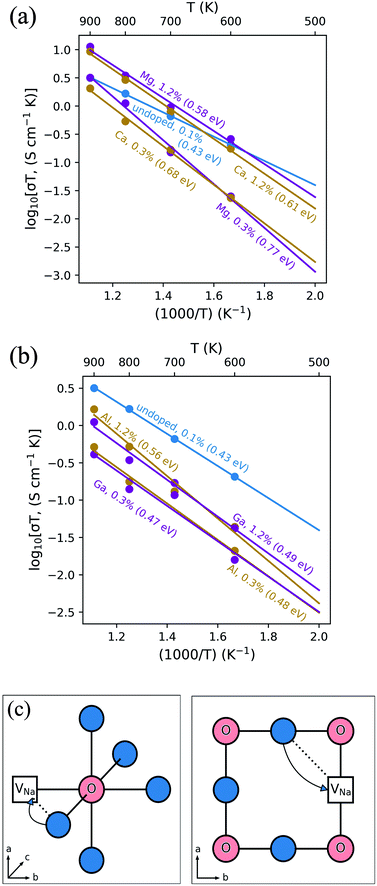 | ||
| Fig. 3 Na-ion conduction in Na3OCl. Temperature-dependent Na+ conductivities (σT) (a) Mg- and Ca-doped (b) Al- and Ga-doped Na3OCl at two Na-vacancy concentrations compared to the undoped system. Representative mean square displacements are in the ESI, Fig. S1.† 4.2% Mg-doping was also considered, but showed lower conductivity (ESI, Fig. S2†). (c) Schematic of the curved migration path for Na-vacancy migration along the ONa6 octahedron edge (left) and looking down the (1 0 0) plane (right). | ||
It is sometimes assumed that the migrating ion takes the shortest path between adjacent sites, i.e., a direct linear jump. However, our simulations identify curved paths between adjacent Na sites (Fig. 3c), which have not been reported for a sodium-based anti-perovskite. It is worth noting that analogous, curved migration paths were first predicted from our atomistic simulation studies of Li-ion migration in LiFePO4,53 and oxide-ion migration in perovskite oxides, such as LaGaO3,54 which were subsequently confirmed by experimental studies using neutron diffraction maximum entropy methods.55,56
Dopant-vacancy association
It is well known that charged point defects can associate to form localised clusters, which can inhibit ion transport. However, the experimental characterisation of such defect clusters can be difficult. Simulations were performed to determine the binding energies of dopant-vacancy pairs in Na3OCl. Fig. 4 show the configurations of dopant-vacancy clusters, as well as the Na/Cl vacancy pair (from the NaCl Schottky-type defect). The binding energy for the defect clusters can be derived from the difference in the calculated energy of the defect pair cluster and the energy of the individual isolated defects that make up the cluster; here a negative value indicates that the cluster is stable with respect to the isolated component defects.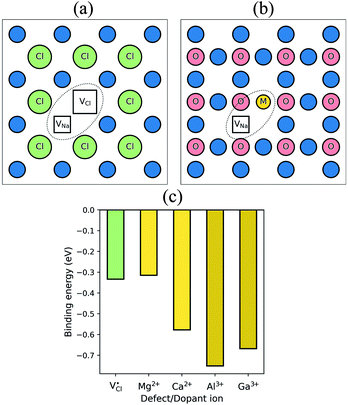 | ||
| Fig. 4 Defect clustering in Na3OCl (a) undoped structure with sodium and chloride vacancies; (b) doped structures with a sodium vacancy and a dopant ion. (c) Binding energies for pair clusters. | ||
The resulting binding energies are shown in Fig. 4c with two main features identified. First, Mg2+ has the smallest binding energy, suggesting that at the dilute limit, Na vacancies are weakly bound to Mg dopants, with a similar binding energy to the undoped system. This indicates that dopant-vacancy interactions will not significantly reduce the Na-ion mobility of Mg-doped Na3OCl. Second, all other dopants show high binding energies (>0.5 eV) with the largest value for Al3+, which could lead to ‘trapping’ of the migrating Na vacancies and hinder Na-ion conductivity in these materials. These results suggest clustering of Na vacancies and dopant ions rather than a random point defect distribution. The differences in Na-ion conductivity found between doped materials (Fig. 3) can be largely rationalised by Na-vacancy trapping effects inhibiting sodium mobility in systems with high binding energies.
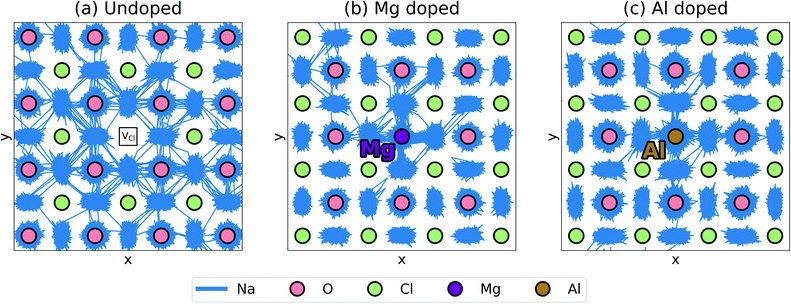
Further insights into mechanistic features of Na-ion transport can be gained from visualising the ion jumps or line trajectories from the large-scale MD simulations (shown in Fig. 5); this illustrates the movement of Na ions in the undoped structure and in the doped structures with the lowest (Mg2+) and highest (Al3+) binding energies. A relatively free migration of Na ions can be found in the undoped structure with ionic motion slightly inhibited in the doped structures, as depicted by greater Na-ion densities close to the Mg and Al dopant ions; this effect is due to a degree of defect clustering predicted from our binding energy results, which would also lead to differences in Na-ion conductivity as found in Fig. 3. The line trajectories connecting Na sites also confirms that Na-ion migration takes place along the ONa6 octahedral edges.
Conclusions
Atomic-scale insights into the transport behaviour of Na-ion solid electrolytes are important for the development of sodium-based solid-state batteries. In this study, we investigated the cation doping mechanisms and ionic conductivity in the anti-perovskite Na3OCl by examining a wider range of aliovalent dopants than current experimental reports.Three main conclusions emerge. (i) The observed structure is simulated accurately, and the lowest energy intrinsic defect is found to be the NaCl Schottky type, although its magnitude (∼2 eV) suggests a very small vacancy population in the undoped material. (ii) The most favourable aliovalent cation dopants are Mg2+, Ca2+, Al3+ and Ga3+ with Na-vacancy charge-compensation; an increase in Na-vacancy concentration would promote Na-ion conductivity. The highest conductivity is found for the Mg-doped system of the order of 10−5 S cm−1 at 500 K, but lower conductivities are predicted for the trivalent Al and Ga dopants. The migration profile and ion trajectory plots confirm 3D Na-ion conduction through curved pathways at the edges of the ONa6 octahedra. (iii) The defect binding energies suggest a high level of Na-vacancy/dopant clustering especially for the Ca, Al and Ga dopants, which would hinder Na-ion conduction. The smallest binding energy is found for the Mg dopant, which correlates with the higher conductivity for the Mg-doped system. We anticipate this study to stimulate further structural investigations of defect clusters at the microscopic level.
The results presented here help to provide a framework to guide future doping studies on these anti-perovskite materials in order to optimize their properties for use as solid electrolytes in sodium-based solid-state batteries.
Methods
Atomistic simulation methods have been applied to a wide range of solid-state compounds including Li- and Na-ion battery materials.22,52,57–59 However, there are only a few examples of these strategies being applied to Na-rich anti-perovskites.30,35 The use of such atomistic simulations can provide valuable insight into ion diffusion over longer timescales and greater lattice sizes than ab initio methods.In this work short- and long-range interactions are modelled with Buckingham-type interatomic potentials and coulombic forces, respectively.60 The shell model of Dick and Overhauser61 is implemented to account for ionic polarization. The parameters used in this work are listed in Table 2. The new Na–O, Na–Cl and Ga–Cl potentials were derived empirically using the experimental structures of Na3OCl and GaCl3. For the defect energy calculations, the two-region Mott–Littleton approach62 is utilised, as included in the General Utility Lattice Program (GULP).63 Molecular dynamics (MD) calculations are performed using the LAMMPS code64 and are run for 10 ns with 1 fs timesteps on a large supercell containing ∼17![[thin space (1/6-em)]](https://www.rsc.org/images/entities/char_2009.gif) 000 atoms. Sodium vacancies are distributed randomly in the structure, while the corresponding positively charged defects (Cl vacancy or dopant) are arranged in a regular pattern such that the spacing between these species is maximised. The temperature range for the simulations is 600–900 K with 100 K intervals in an NPT ensemble using a Nosé–Hoover thermostat.65 Mean square displacement (MSD) data derived from the simulations (see ESI, Fig. S1†) are used to obtain the diffusion coefficients. Conductivities are then calculated from these diffusion coefficients via the Nernst–Einstein equation for solid-state diffusion66 with a Haven ratio of 1, as in previous studies.22,30 Activation energies are derived using the slopes of the linear fitting of Arrhenius conductivity plots.
000 atoms. Sodium vacancies are distributed randomly in the structure, while the corresponding positively charged defects (Cl vacancy or dopant) are arranged in a regular pattern such that the spacing between these species is maximised. The temperature range for the simulations is 600–900 K with 100 K intervals in an NPT ensemble using a Nosé–Hoover thermostat.65 Mean square displacement (MSD) data derived from the simulations (see ESI, Fig. S1†) are used to obtain the diffusion coefficients. Conductivities are then calculated from these diffusion coefficients via the Nernst–Einstein equation for solid-state diffusion66 with a Haven ratio of 1, as in previous studies.22,30 Activation energies are derived using the slopes of the linear fitting of Arrhenius conductivity plots.
| (a) | |||
|---|---|---|---|
| Ion pair | A (eV) | ρ (Å) | C (eV Å−6) |
| Na–O [this work] | 588.38 | 0.3880 | 0.0 |
| Ga–Cl [this work] | 924.20 | 0.3428 | 0.0 |
| Na–Cl [this work] | 1170.41 | 0.3150 | 0.0 |
| Na–Na (ref. 67) | 1788.19 | 0.1590 | 0.0 |
| O–O (ref. 68) | 22![[thin space (1/6-em)]](https://www.rsc.org/images/entities/char_2009.gif) 764.30 764.30 |
0.1490 | 13.19 |
| O–Cl (ref. 67) | 8286.91 | 0.2590 | 62.20 |
| Cl–Cl (ref. 69) | 1227.20 | 0.3210 | 14.53 |
| Mg–O (ref. 70) | 1428.50 | 0.2945 | 0.0 |
| Mg–Cl (ref. 71) | 4914.54 | 0.2570 | 0.0 |
| Ca–O (ref. 70) | 1090.40 | 0.3437 | 0.0 |
| Ca–Cl (ref. 71) | 2302.00 | 0.3402 | 0.0 |
| Sr–O (ref. 70) | 959.10 | 0.3721 | 0.0 |
| Sr–Cl (ref. 22) | 2191.09 | 0.3457 | 0.0 |
| Ba–O (ref. 70) | 905.07 | 0.3976 | 0.0 |
| Ba–Cl (ref. 22) | 2704.55 | 0.3528 | 0.0 |
| Al–O (ref. 72) | 1725.00 | 0.2897 | 0.0 |
| Al–Cl (ref. 22) | 1736.12 | 0.2917 | 0.0 |
| Ga–O (ref. 54) | 2901.12 | 0.2742 | 0.0 |
| (c) | |
|---|---|
| Compound | Lattice energy (eV) |
| Na3OCl | −34.68 |
| NaCl | −8.01 |
| Na2O | −26.38 |
| MgCl2 | −26.52 |
| CaCl2 | −21.15 |
| SrCl2 | −21.14 |
| BaCl2 | −20.16 |
| AlCl3 | −55.85 |
| GaCl3 | −51.61 |
Conflicts of interest
There are no conflicts to declare.Acknowledgements
The authors thank the Faraday Institution CATMAT project (EP/S003053/1, FIRG016) and the Bath URS studentship scheme for financial support, and the HEC Materials Chemistry Consortium (EP/R029431) for Archer high-performance computing facilities. JAD also acknowledges Newcastle University for funding through a Newcastle Academic Track (NUAcT) Fellowship.Notes and references
- T. Famprikis, P. Canepa, J. A. Dawson, M. S. Islam and C. Masquelier, Nat. Mater., 2019, 18, 1278–1291 CrossRef CAS PubMed.
- Z. Z. Zhang, Y. J. Shao, B. Lotsch, Y. S. Hu, H. Li, J. Janek, L. F. Nazar, C. W. Nan, J. Maier, M. Armand and L. Q. Chen, Energy Environ. Sci., 2018, 11, 1945–1976 RSC.
- S. Ohno, A. Banik, G. F. Dewald, M. A. Kraft, T. Krauskopf, N. Minafra, P. Till, M. Weiss and W. G. Zeier, Progress in Energy, 2020, 2, 022001 CrossRef.
- J. C. Bachman, S. Muy, A. Grimaud, H. H. Chang, N. Pour, S. F. Lux, O. Paschos, F. Maglia, S. Lupart, P. Lamp, L. Giordano and Y. Shao-Horn, Chem. Rev., 2016, 116, 140–162 CrossRef CAS PubMed.
- A. Manthiram, X. W. Yu and S. F. Wang, Nat. Rev. Mater., 2017, 2, 16 Search PubMed.
- Z. H. Gao, H. B. Sun, L. Fu, F. L. Ye, Y. Zhang, W. Luo and Y. H. Huang, Adv. Mater., 2018, 30, 1705702 CrossRef PubMed.
- J. J. Kim, K. Yoon, I. Park and K. Kang, Small Methods, 2017, 1, 1700219 CrossRef.
- C. L. Zhao, L. L. Liu, X. G. Qi, Y. X. Lu, F. X. Wu, J. M. Zhao, Y. Yu, Y. S. Hu and L. Q. Chen, Adv. Energy Mater., 2018, 8, 1703012 CrossRef.
- J. A. Dawson, P. Canepa, T. Famprikis, C. Masquelier and M. S. Islam, J. Am. Chem. Soc., 2018, 140, 362–368 CrossRef CAS PubMed.
- J. A. Dawson, T. Famprikis and K. E. Johnston, J. Mater. Chem. A, 2021, 9, 18746–18772 RSC.
- Y. G. Wang, H. Zhang, J. L. Zhu, X. J. Lu, S. Li, R. Q. Zou and Y. S. Zhao, Adv. Mater., 2020, 32, 1905007 CrossRef CAS PubMed.
- S. A. Khandy, I. Islam, A. Laref, M. Gogolin, A. K. Hafiz and A. M. Siddiqui, Int. J. Energy Res., 2020, 44, 2594–2603 CrossRef CAS.
- M. A. Sattar, M. Javed, M. Benkraouda and N. Amrane, Int. J. Energy Res., 2021, 45, 4793–4810 CrossRef CAS.
- Z. L. Lv, H. L. Cui, H. Wang, X. H. Li and G. F. Ji, Phys. Status Solidi B, 2017, 254, 1700089 CrossRef.
- Z. Deng, Z. B. Wang, I. H. Chu, J. Luo and S. P. Ong, J. Electrochem. Soc., 2016, 163, A67–A74 CrossRef CAS.
- Y. G. Wang, T. Wen, C. Park, C. Kenney-Benson, M. Pravica, W. G. Yang and Y. S. Zhao, J. Appl. Phys., 2016, 119, 025901 CrossRef.
- J. Ramanna, N. Yedukondalu, K. R. Babu and G. Vaitheeswaran, Solid State Sci., 2013, 20, 120–126 CrossRef CAS.
- V. I. Zinenko and N. G. Zamkova, Ferroelectrics, 2002, 265, 23–29 CrossRef.
- Y. S. Zhao and L. L. Daemen, J. Am. Chem. Soc., 2012, 134, 15042–15047 CrossRef CAS PubMed.
- A. Emly, E. Kioupakis and A. Van der Ven, Chem. Mater., 2013, 25, 4663–4670 CrossRef CAS.
- J. A. Dawson, T. S. Attari, H. R. Chen, S. P. Emge, K. E. Johnston and M. S. Islam, Energy Environ. Sci., 2018, 11, 2993–3002 RSC.
- M. J. Clarke, J. A. Dawson, T. J. Mays and M. S. Islam, ACS Appl. Energy Mater., 2021, 4, 5094–5100 CrossRef CAS.
- K. Shen, Y. X. Wang, J. Zhang, Y. Zong, G. W. Li, C. C. Zhao and H. Chen, Phys. Chem. Chem. Phys., 2020, 22, 3030–3036 RSC.
- H. Sabrowsky, K. Paszkowski, D. Reddig and P. Vogt, Z. Naturforsch., B: J. Chem. Sci., 1988, 43, 238–239 CrossRef CAS.
- K. Hippler, S. Sitta, P. Vogt and H. Sabrowsky, Acta Crystallogr., Sect. C: Cryst. Struct. Commun., 1990, 46, 736–738 CrossRef.
- Y. G. Wang, Q. F. Wang, Z. P. Liu, Z. Y. Zhou, S. Li, J. L. Zhu, R. Q. Zou, Y. X. Wang, J. H. Lin and Y. S. Zhao, J. Power Sources, 2015, 293, 735–740 CrossRef CAS.
- J. L. Zhu, Y. G. Wang, S. Li, J. W. Howard, J. Neuefeind, Y. Ren, H. Wang, C. D. Liang, W. G. Yang, R. Q. Zou, C. Q. Jin and Y. S. Zhao, Inorg. Chem., 2016, 55, 5993–5998 CrossRef CAS PubMed.
- H. Nguyen, S. Hy, E. Wu, Z. Deng, M. Samiee, T. Yersak, J. Luo, S. P. Ong and Y. S. Meng, J. Electrochem. Soc., 2016, 163, A2165–A2171 CrossRef CAS.
- T. H. Wan, Z. H. Lu and F. Ciucci, J. Power Sources, 2018, 390, 61–70 CrossRef CAS.
- J. A. Dawson, H. Chen and M. S. Islam, J. Phys. Chem. C, 2018, 122, 23978–23984 CrossRef CAS.
- T. L. Pham, A. Samad, J. Kim and Y. H. Shin, J. Appl. Phys., 2018, 124, 6 CrossRef.
- K. Kim and D. J. Siegel, J. Mater. Chem. A, 2019, 7, 3216–3227 RSC.
- E. Ahiavi, J. A. Dawson, U. Kudu, M. Courty, M. S. Islam, O. Clemens, C. Masquelier and T. Famprikis, J. Power Sources, 2020, 471, 228489 CrossRef CAS.
- L. F. Peng, Z. Q. Zeng, Y. L. Sun, H. H. Jia and J. Xie, Acta Phys. Sin., 2020, 69, 228201 Search PubMed.
- H. X. Li, X. Y. Zhou, Y. C. Wang and H. Jiang, Inorg. Chem. Front., 2021, 8, 425–432 RSC.
- M. Jansen, Z. Anorg. Allg. Chem, 1977, 435, 13–20 CrossRef CAS.
- L. Fanfani, G. Giuseppetti, C. Tadini and P. F. Zanazzi, Mineral. Mag., 1980, 43, 753–759 CrossRef CAS.
- W. Müller and M. Jansen, Journal, 1990, 591, 41–46 Search PubMed.
- M. Jansen, C. Feldmann and W. Müller, Z. Anorg. Allg. Chem, 1992, 611, 7–10 CrossRef CAS.
- M. S. Avdontceva, A. A. Zolotarev and S. V. Krivovichev, J. Solid State Chem., 2015, 231, 42–46 CrossRef CAS.
- H. Fang and P. Jena, ACS Appl. Mater. Interfaces, 2019, 11, 963–972 CrossRef CAS.
- Y. L. Sun, Y. C. Wang, X. M. Liang, Y. H. Xia, L. F. Peng, H. H. Jia, H. X. Li, L. F. Bai, J. W. Feng, H. Jiang and J. Xie, J. Am. Chem. Soc., 2019, 141, 5640–5644 CrossRef CAS.
- L. Gao, H. Zhang, Y. C. Wang, S. Li, R. Zhao, Y. G. Wang, S. Gao, L. H. He, H. F. Song, R. Q. Zou and Y. S. Zhao, J. Mater. Chem. A, 2020, 8, 21265–21272 RSC.
- S. S. Fan, M. Lei, H. Wu, J. L. Hu, C. L. Yin, T. X. Liang and C. L. Li, Energy Storage Mater., 2020, 31, 87–94 CrossRef.
- L. Yin, M. Murphy, K. Kim, L. H. Hu, J. Cabana, D. J. Siegel and S. H. Lapidus, Inorg. Chem., 2020, 59, 11244–11247 CrossRef CAS PubMed.
- S. H. Gao, T. Broux, S. Fujii, C. Tassel, K. Yamamoto, Y. Xiao, I. Oikawa, H. Takamura, H. Ubukata, Y. Watanabe, K. Fujii, M. Yashima, A. Kuwabara, Y. Uchimoto and H. Kageyama, Nat. Commun., 2021, 12, 201 CrossRef CAS PubMed.
- H. Sabrowsky, K. Hippler, S. Sitta, P. Vogt and L. Walz, Acta Crystallogr., Sect. C: Cryst. Struct. Commun., 1990, 46, 368–369 CrossRef.
- K. Hippler, S. Sitta, P. Vogt and H. Sabrowsky, Z. Naturforsch., B: J. Chem. Sci., 1990, 45, 105–106 CrossRef CAS.
- Y. R. Yu, Z. Wang and G. S. Shao, J. Mater. Chem. A, 2018, 6, 19843–19852 RSC.
- Y. R. Yu, Z. Wang and G. S. Shao, J. Mater. Chem. A, 2019, 7, 10483–10493 RSC.
- Z. H. Lu, J. P. Liu and F. Ciucci, Energy Storage Mater., 2020, 28, 146–152 CrossRef.
- M. S. Islam and C. A. J. Fisher, Chem. Soc. Rev., 2014, 43, 185–204 RSC.
- M. S. Islam, D. J. Driscoll, C. A. J. Fisher and P. R. Slater, Chem. Mater., 2005, 17, 5085–5092 CrossRef CAS.
- M. S. Khan, M. S. Islam and D. R. Bates, J. Phys. Chem. B, 1998, 102, 3099–3104 CrossRef CAS.
- S. Nishimura, G. Kobayashi, K. Ohoyama, R. Kanno, M. Yashima and A. Yamada, Nat. Mater., 2008, 7, 707–711 CrossRef CAS PubMed.
- M. Yashima, K. Nomura, H. Kageyama, Y. Miyazaki, N. Chitose and K. Adachi, Chem. Phys. Lett., 2003, 380, 391–396 CrossRef CAS.
- Y. Deng, C. Eames, L. H. B. Nguyen, O. Pecher, K. J. Griffith, M. Courty, B. Fleutot, J. N. Chotard, C. P. Grey, M. S. Islam and C. Masquelier, Chem. Mater., 2018, 30, 2618–2630 CrossRef CAS.
- N. Tapia-Ruiz, W. M. Dose, N. Sharma, H. R. Chen, J. Heath, J. W. Somerville, U. Maitra, M. S. Islam and P. G. Bruce, Energy Environ. Sci., 2018, 11, 1470–1479 RSC.
- A. R. Symington, J. Purton, J. Statham, M. Molinari, M. S. Islam and S. C. Parker, J. Mater. Chem. A, 2020, 8, 19603–19611 RSC.
- C. R. A. Catlow, Computer Modeling in Inorganic Crystallography, Academic Press: San Diego, 1997 Search PubMed.
- B. G. Dick and A. W. Overhauser, Phys. Rev., 1958, 112, 90 CrossRef.
- N. F. Mott and M. J. Littleton, Trans. Faraday Soc., 1938, 34, 485–499 RSC.
- J. D. Gale and A. L. Rohl, Mol. Simul., 2003, 29, 291–341 CrossRef CAS.
- S. Plimpton, J. Comput. Phys., 1995, 117, 1–19 CrossRef CAS.
- D. J. Evans and B. L. Holian, J. Chem. Phys., 1985, 83, 4069–4074 CrossRef CAS.
- H. Mehrer, Diffusion in Solids: Fundamentals, Methods, Materials, Diffusion-Controlled Processes, Springer Science & Business Media, 2007 Search PubMed.
- D. J. Binks, PhD thesis, University of Surrey, Guildford, UK, 1994.
- R. Mouta, M. A. B. Melo, E. M. Diniz and C. W. A. Paschoal, Chem. Mater., 2014, 26, 7137–7144 CrossRef CAS.
- C. R. A. Catlow, K. M. Diller and M. J. Norgett, J. Phys. C: Solid State Phys., 1977, 10, 1395–1412 CrossRef CAS.
- S. Darco and M. S. Islam, Phys. Rev. B, 1997, 55, 3141–3145 CrossRef CAS.
- M. S. Islam, J. Solid State Chem., 1990, 85, 251–261 CrossRef CAS.
- R. A. De Souza and J. Maier, Phys. Chem. Chem. Phys., 2003, 5, 740–748 RSC.
Footnote |
| † Electronic supplementary information (ESI) available. See DOI: 10.1039/d1ta07588h |
| This journal is © The Royal Society of Chemistry 2022 |


