 Open Access Article
Creative Commons Attribution 3.0 Unported Licence
Competition between clustering and phase separation in binary mixtures containing SALR particles
Gianmarco
Munaò
 *a,
Dino
Costa
 a,
Gianpietro
Malescio
a,
Jean-Marc
Bomont
a,
Gianpietro
Malescio
a,
Jean-Marc
Bomont
 b and
Santi
Prestipino
a
aDipartimento di Scienze Matematiche e Informatiche, Scienze Fisiche e Scienze della Terra, Università degli Studi di Messina, Viale F. Stagno d’Alcontres 31, 98166 Messina, Italy. E-mail: gmunao@unime.it
bUniversité de Lorraine, LCP-A2MC, UR 3469, Metz F-57078, France
First published on 15th August 2022
Abstract
We investigate by Monte Carlo simulations a mixture of particles with competing interactions (hard-sphere two-Yukawa, HSTY) and hard spheres (HS), with same diameters σ and a square-well (SW) cross attraction. In a recent study [G. Munaò et al., J. Phys. Chem. B, 2022, 126, 2027–2039], we have analysed situations—in terms of relative concentration and attraction strength—where HS promote the formation of clusters involving particles of both species under thermodynamic conditions that would not allow for clustering of the pure HSTY fluid. Here, we focus on the role played by the range of cross attraction in determining the equilibrium structure of the mixture, starting from a homogeneous low-density state. When the width of the well exceeds approximately σ, clustering takes place in the system, with aggregates characterised by various sizes and shapes. Only for low HSTY concentrations (less than 10%) a single big cluster appears, anticipating the behaviour observed for a wider well, around 1.2σ. In the latter case, a spherical cluster encompassing almost all particles is the stable structure at equilibrium. We interpret this outcome as a macrophase, liquid–vapour separation where the spherical cluster is just the form taken at low density by the liquid phase inside the vapour phase: indeed, when the density takes larger values, periodic boundary conditions select liquid–vapour interfaces with other non-spherical shapes, similarly as found for a finite sample of simple fluid going through the liquid–vapour coexistence region. For still higher densities we document the existence of a solid phase characterized by the alternation of bilayers filled with particles of one species and bilayers of the other species, giving the solid a peculiar wafer structure.
1 Introduction
Cluster-forming fluids are currently the object of much interest, due to their role in many different contexts: to quote just a few examples, they can be used as building blocks for complex structures1–4 or as models for the phase behaviour of colloids, protein solutions, and polymers5–15; finally, they can also be employed to describe modulated phases at the mesoscale.16–21 A much-studied class of cluster-forming fluids is represented by SALR (Short-range Attractive and Long-range Repulsive) systems, whose particles can self-assemble in aggregates with various morphologies.9,12,13,18,22–30 From a microscopic point of view, the short-range attraction originates from depletion interactions, whereas the long-range repulsion is usually the outcome of electrostatic forces. According to the picture provided in ref. 31–33, the occurrence of clusters in SALR fluids can be viewed as a frustrated macrophase separation of liquid–vapour type, in which density fluctuations cannot extend over the whole system. As a result, the mixture breaks into fragments (the clusters) which are nearly non-interacting. This condition can only be realised if there is enough (short-range) particle–particle attraction to drive the aggregation, but also enough (long-range) particle–particle repulsion to prevent macrophase separation. The size and shape of aggregates crucially depend on this energy balance: usually, the SALR potential can be tuned to induce either dynamical arrest34 or micellization,35 if not even a glassy phase.36 Under dilute conditions, when the strengths of SA and LR are comparable, the onset of “giant clusters” has been reported.37 On the other hand, when the competition between SA and LR moves in favour of the former—namely, when the system falls below its Lifshitz point, to be identified in the space of model parameters—clustering is suppressed and a standard liquid–vapour phase separation occurs instead,38,39 with enhanced density fluctuations properties.40 Therefore, the identification of regimes where specific self-assembled structures can be expected to occur in equilibrium is highly desirable. Four recent reviews witness the large interest in the study of SALR fluids and progress in this field.20,28,37,41The aforementioned scenario becomes even richer when considering (binary) mixtures: despite the huge number of works investigating self-assembly in one-component SALR fluids, much less effort has been devoted to analyse their mixtures with other species. In this context, it is worth mentioning a mixture of dimers and spheres interacting through a combination of attractive and repulsive potentials.42 We too have investigated the self-assembling behaviour of a binary mixture of dimers and spheres,43–45 although in our studies the modulated phases are essentially promoted by molecular geometry rather than the shape of intermolecular potentials. In particular, upon tuning the size of monomers making up the dimer and using monomer-specific interactions with the second species, it is possible to obtain a large variety of self-assembling structures, including vesicles46 and coating shells (capsules).47,48 A second possibility would be to consider a mixture of monatomic species with various types of SALR potentials:49–52 leveraging on the interactions, one can produce microphases exhibiting many different kinds of stable aggregates.
In the present work we follow the latter prescription, studying by Monte Carlo (MC) simulations a mixture of two monatomic species, 1 and 2, experiencing different interactions: the 1–1 interaction is represented by a hard-sphere two-Yukawa (HSTY) potential, whereas the 2–2 interaction is a bare hard-sphere (HS) repulsion; finally, particles 1 and 2 are taken to interact through a square-well (SW) potential. This system is meant to mimic the behaviour of a cluster-forming species in the presence of a foreign species with a tunable degree of affinity with it. For instance, this model can reproduce the behaviour of soft-matter systems with a non negligible solute–solvent interaction, typically due to screened–Coulomb interactions, as occurring in solutions of biomolecules. In a previous work52 we have shown that, upon setting a proper attraction strength between HSTY and HS particles, it is possible to induce clustering under thermodynamic conditions for which the pure HSTY fluid would be homogeneous. A similar conclusion was reached in ref. 49, using mutually attractive particles (rather than HS) as foreign species. Therefore, in a binary mixture containing HSTY particles, the second species is capable to enhance clustering, provided a sufficiently strong 1–2 attraction is present, regardless of the specific nature of the 2–2 interaction. However, the role played by the range of 1–2 attraction has not been elucidated yet, and it is the purpose of the present study to clarify whether and how an extended SW attraction would result in the macrophase separation of the system (despite the long-range 1–1 repulsion), as it happens for simple fluids.53,54
This paper is organised as follows: in Section 2 we provide details on the model mixture investigated and the simulation method adopted. In Sections 3 and 4 we present our results: in Section 3 we focus on the equimolar case, while uneven concentrations are considered in Section 4. Conclusions and perspectives follow in Section 5.
2 Model and method
The mixture investigated here contains HSTY and HS particles, henceforth referred to as species 1 and 2, respectively. The hard-core diameter σ, providing the natural unit of length, is the same for both. Outside the core, the interaction between two HSTY particles is set to | (1) |
 | (2) |
| r0 = σ + ratt ≈ 1.2424σ. | (3) |
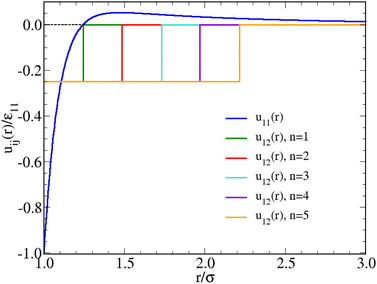 | ||
| Fig. 1 Interaction potentials adopted in this work. The SW attraction u12 (r) is plotted for all the n = 2,…,5 values investigated, see eqn (4); the case n = 1 was studied in ref. 52. The bare HS repulsion u22(r) is not shown. | ||
As for the cross interaction u12(r), we find it convenient to express the width of the attractive well in terms of integer multiples of ratt; specifically, outside the core we set:
 | (4) |
The case n = 1, in which the negative parts of u11(r) and u12(r) are equally extended, was considered in ref. 52. Therein, we investigated the fluid structure of a mixture containing N1 HSTY particles and N2 = N − N1 HS (with N = 2048), for different values of ε12 and relative concentration χ = N1/N, at fixed reduced temperature T = 0.25 and density ρ = 0.05. We found that for ε12 > 0.5 (in units of ε11) clusters are always present in the mixture, at least provided that χ > 0.01. Conversely, for ε12 = 0.25 the mixture is homogeneous at arbitrary χ. In the present work, in order to explore the sensitivity of clustering to the SW range, we generally keep T = 0.25, ρ = 0.05, and ε12 = 0.25 fixed, looking at the behaviour of the mixture as a function of n = 2,…,5 and χ. The shape of u12(r) for the various n is reported in Fig. 1.
We have performed Monte Carlo (MC) simulations in the canonical ensemble of a sample containing N = 2048 particles in total. Occasionally, we have simulated systems with N = 16![[thin space (1/6-em)]](https://www.rsc.org/images/entities/char_2009.gif) 384 particles in order to improve sampling of the low-wavevector region of the structure factors. We have additionally simulated samples with N = 400, 720, 864, and 1372 particles to explore the size dependence of the solid structure observed in the equimolar mixture at high densities. Particles are enclosed in a cubic simulation box with edge L = (N/ρ)1/3 and periodic conditions at the boundary. In our simulations, u11(r) is truncated at L/2. To account for the possibility of clustering, we have considered two distinct values, intracluster and intercluster, for the maximum random displacement of a particle; moreover, to speed up simulations we have implemented swap moves, whereby the positions of two randomly chosen HSTY and HS particles are exchanged. To ascertain whether equilibrium has been reached, simulations are performed using as initial state both a random configuration (equivalent to quenching the system from very high temperature) and a single big cluster (corresponding to the “liquid condensation” described in ref. 55) encompassing all particles. The need for a double check emerges from previous studies of SALR particles37 and their mixtures,49,50,52 where giant clusters have occasionally been observed at equilibrium. For n ≤ 3 equilibrium is typically attained after 5 × 10⁵ MC cycles; for n = 4, as many as 2 × 10⁷ MC cycles are required to equilibrate the system. Finally, for n = 5 full equilibration is obtained after ≈107 MC cycles, but only starting from a big cluster. Note that, in the latter case, equilibration of the system is faster than for n = 4, since the big cluster does not break up into smaller aggregates. In all cases, statistical averages and correlation functions are computed over a production run of 5 × 10⁶ cycles.
384 particles in order to improve sampling of the low-wavevector region of the structure factors. We have additionally simulated samples with N = 400, 720, 864, and 1372 particles to explore the size dependence of the solid structure observed in the equimolar mixture at high densities. Particles are enclosed in a cubic simulation box with edge L = (N/ρ)1/3 and periodic conditions at the boundary. In our simulations, u11(r) is truncated at L/2. To account for the possibility of clustering, we have considered two distinct values, intracluster and intercluster, for the maximum random displacement of a particle; moreover, to speed up simulations we have implemented swap moves, whereby the positions of two randomly chosen HSTY and HS particles are exchanged. To ascertain whether equilibrium has been reached, simulations are performed using as initial state both a random configuration (equivalent to quenching the system from very high temperature) and a single big cluster (corresponding to the “liquid condensation” described in ref. 55) encompassing all particles. The need for a double check emerges from previous studies of SALR particles37 and their mixtures,49,50,52 where giant clusters have occasionally been observed at equilibrium. For n ≤ 3 equilibrium is typically attained after 5 × 10⁵ MC cycles; for n = 4, as many as 2 × 10⁷ MC cycles are required to equilibrate the system. Finally, for n = 5 full equilibration is obtained after ≈107 MC cycles, but only starting from a big cluster. Note that, in the latter case, equilibration of the system is faster than for n = 4, since the big cluster does not break up into smaller aggregates. In all cases, statistical averages and correlation functions are computed over a production run of 5 × 10⁶ cycles.
The structure of the mixture is analysed through the radial distribution functions gij(r) and the structure factors Sij(k), with i, j = 1, 2 labelling the two species. Sij(k) is generally computed in terms of the Fourier transform of gij(r):56
 | (5) |
 | (6) |
To characterise the aggregates we perform a cluster analysis using the Hoshen–Kopelman algorithm.61 In our scheme, two particles are bonded (i.e., belong to the same cluster) if their distance is smaller than r0, which amounts to drawing a bond between two particles only if their distance falls in the range ratt of the SW potential for n = 1. Following ref. 32 and 62, the cluster-size distribution (CSD) is defined as:
 | (7) |
 . In the present work, the CSD is computed by averaging over 2500 configurations extracted from the last block of the production run.
3 Equimolar mixture
In ref. 32 and 52, it was shown that the pure SALR system for T = 0.25 and ρ = 0.05 is a homogeneous fluid. For the same values of T and ρ, also the HSTY-HS mixture is homogeneous when ε12 = 0.25ε11 and n = 1 in eqn (4).52 Upon increasing the range of the SW attraction, we may reasonably expect that the mixture will finally undergo a liquid–vapour separation; indeed, when the balance between repulsion and attraction is progressively shifted toward the latter, the formation of macroscopic droplets will eventually become preferred with respect to clustering.We start by considering the equimolar case, χ = 0.5. Typical equilibrium configurations of the mixture for a few values of n are shown in Fig. 2: for n = 3, panel A, corresponding to a SW width of ≈0.73σ, the fluid appears overall homogeneous, with HSTY and HS particles uniformly dispersed throughout the simulation box. For n = 4 (SW width ≈0.97σ), panel B, aggregates involving particles of both species are clearly visible, suggesting that the interaction range is now large enough to promote clustering, even though the attractive well is not too deep. Finally increasing the range of attraction to n = 5 (SW width ≈1.21σ), panel C, the scenario changes again and a single big cluster encompassing almost all particles becomes stable. This outcome differs from the observation of giant clusters by Sweatman and coworkers in a mixture with short-range interspecies attraction:49,50 in that case, the formation of several clusters of large size was reported at equilibrium. Here, we instead find a single big cluster containing most of the particles in the sample. We tentatively interpret the big cluster as the form taken by liquid–vapour separation in an overall dilute mixture:63–65 in the case shown in Fig. 2(C), the vapour is extremely dilute whereas the liquid droplet is dense and mixed. We stress that a big cluster is promoted by a sufficiently extended—rather than sufficiently strong—interaction, which is exactly the condition for having liquid–vapour coexistence in a simple fluid.53 We defer a more detailed discussion on this point until the end of this section.
 | ||
| Fig. 2 Equimolar mixture for T = 0.25 and ρ = 0.05. Typical equilibrium configurations (HSTY particles, magenta; HS, grey) for n = 3 (A), n = 4 (B), and n = 5 (C) in eqn (4). | ||
The structure of aggregates as a function of n is analysed in Fig. 3. Looking at the CSD (panel A) three regimes are clearly identified: for n ≤ 3 the CSD is a monotonically decreasing function of the cluster size s, as expected for nearly homogeneous fluids.32 For n = 4 a peak appears for s ≈ 100, indicating the presence of clusters with a typical size around 100 particles. For n = 5 the presence of a single big cluster is clearly reflected in the delta-like peak of the CSD for large s values. Further details on the structure of aggregates are provided in Fig. 3(B)–(D), where the internal energy per particle, the average number of isolated particles, the largest cluster size, and the total number of clusters are reported as a function of n. The decrease of energy with n, which is more pronounced for n > 3, reveals the tendency of the system to form increasingly more compact configurations, with the purpose to keep the energy low. A similar trend is found in the number of isolated particles which, starting from ≈50% for n = 1, becomes nearly zero for n = 5. Conversely, the size of the largest cluster increases, until becoming N for n = 5. In turn, the total number of clusters falls abruptly when n > 3, approaching 1 for n = 5.
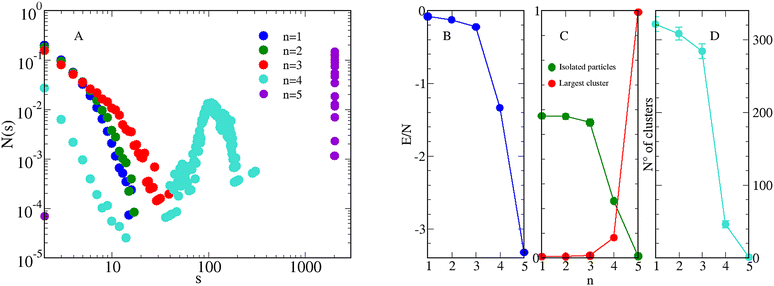 | ||
| Fig. 3 Equimolar mixture for T = 0.25, ρ = 0.05, and various n. (A) CSD, see eqn (7); (B) average internal energy per particle in units of ε11; (C) average number of isolated particles (green circles) and largest cluster size (red circles), both normalized to the total number of particles. (D) Total number of clusters. For completeness, data for n = 152 are also shown. | ||
The existence of aggregates also emerges from an analysis of S11(k), see Fig. 4(A): for n ≤ 3 the low-k peak height is below 2, suggesting that the fluid is well within an intermediate-range order. For n = 4 the low-k peak rises up to ≈30, which indicates the existence of sharply-defined aggregates. A leading structure-factor peak situated at a non-zero k value excludes the possibility of a phase separation. Information on the spatial correlations between HSTY particles can be obtained from g11(r) (panel B): while for n ≤ 3 correlations are low beyond the bonding distance, the sharp rise of the contact value and the large oscillations seen for n = 4 attest the development of a modulated phase.
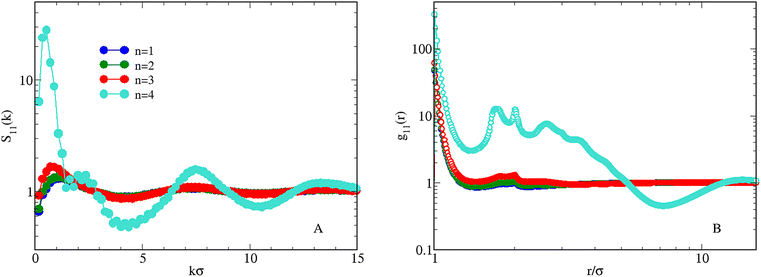 | ||
| Fig. 4 Equimolar mixture for T = 0.25 and ρ = 0.05. Effect of increasing n on the behaviour of S11(k) (A) and g11(r) (B). | ||
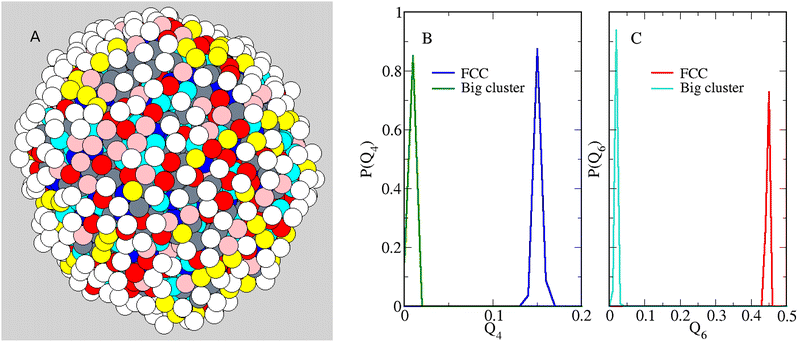
Having clarified the low-density behaviour of the equimolar mixture as a function of n, we turn back to the case n = 5, see Fig. 2(C), to find clues that confirm the phase-separation scenario. First of all we establish whether the distribution of particles in the droplet reveals some kind of order. Indeed, upon cooling the droplet enough, it should eventually become crystalline (hence, faceted). Using n = 5 and ρ = 0.05, we have reduced the temperature down to 0.15, which is the lowest T value for which we could still equilibrate the droplet efficiently. Defining the coordination number nc of a particle as the number of particles (of any species) falling within a distance r0 from it, we typically arrive at a picture like Fig. 5(A), where the different colours denote different nc values (see caption). Looking at this picture, it appears that the droplet surface (and even its core) is still liquid at T = 0.15. In particular, we find neither faceting nor evidence of a superstructure of disclinations like that observed in a dense system of hard particles on a sphere.66,67 To strenghten our conclusion, we have computed the orientational order parameters Q4 and Q6, which efficiently discriminate between a crystal and a dense liquid structure.68,69 While Q4 and Q6 would vanish for a liquid, their value is significantly different from zero for solid structures. Upon extracting 1000 configurations from the last portion of our simulation for T = 0.15, ρ = 0.05, and n = 5, we have computed the statistical distribution of Q4 and Q6 values, see Fig. 5(B) and (C). As is clear, for the big cluster the typical values of Q4 and Q6 are close to zero, as expected for a liquid structure, and markedly different from those typical of a fcc solid, also reported in Fig. 5(B) and (C) for comparison. This conclusion remains unaltered when Q4 and Q6 are only averaged over the cluster particles that are far away from the surface.
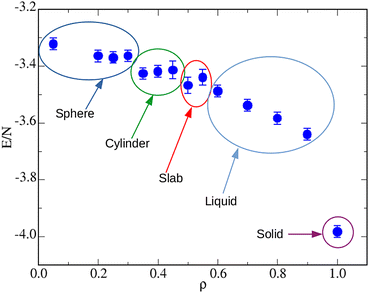
Having explored the temperature dependence of the big cluster at ρ = 0.05, we now probe its density dependence at fixed T = 0.25. Typical microscopic configurations for ρ = 0.35, 0.40, 0.50, and 1.00 are reported in Fig. 6: while for densities up to ρ ≈ 0.30 the system forms a spherical cluster at equilibrium, similar to that seen in Fig. 2(C), for ρ = 0.35 (A) the shape of the big cluster changes from spherical to cylindrical, similarly to what occurs for a simple fluid going through the liquid–vapour coexistence region.64,70 For ρ = 0.40 (B) the shape of the droplet changes again, now resembling three interpenetrating cylinders oriented along the axes of the simulation box—notice that this structure may just be metastable, like the bicylindrical droplet reported in ref. 64. Three cylinders are also observed for ρ = 0.45 (not shown), whereas a slab-like droplet is found for ρ = 0.50 (C). For the latter density, the box length is L = 16σ, hence still sufficiently large to make σ + 5ratt < L/2. These geometric transitions are a finite-size effect promoted by periodic boundary conditions: they are specific of every fluid undergoing phase separation and therefore provide a convincing indication that, under the given conditions, the equimolar mixture exhibits a liquid–vapour separation (with a vapour density that is close to zero). This outcome indicates that it is a sufficiently extended range of 1–2 attraction, rather than its depth, that favours macrophase separation over clustering. Indeed, in our previous study,52 where the range of attraction is kept fixed at n = 1, we have never found evidence of a macrophase separation. In that study we argued that increasing the well depth is a way to enhance the stability of clusters (thus causing them to appear at higher temperatures), without interfering much with the repulsive barrier at larger distances. Conversely, in the present study we find that extending the range of 1–2 attraction effectively amounts to better contrasting the effects of the SALR barrier, thus providing a mechanism for aggregation which will eventually make the existence of the barrier irrelevant. Finally notice that in no case the two species of particles are mixed completely at random in the droplet; rather, every particle preferentially binds particles of the same species—as also witnessed by the large contact values of g11(r) and g22(r) (not shown).
Upon increasing the number density further, we eventually reach a point where it is impossible to prepare the sample in either a disordered state or a spherical-cluster state. Using instead a substitutionally-disordered face-centred-cubic crystal as initial configuration the mixture relaxes to a liquid state uniformly filling the simulation box for ρ = 0.80 or ρ = 0.90. On the other hand, for ρ = 1.00, Fig. 6(D), particle diffusion is so hampered that the mixture remains crystalline for long, indicating that we have probably entered the solid phase. However, owing to swap moves the “equilibrium” solid looks different from the initial configuration, since bilayers filled with particles of one species are now alternated with bilayers of the other species, giving the solid a characteristic wafer structure.
 | ||
| Fig. 6 Equimolar mixture for T = 0.25 and n = 5. Typical equilibrium configurations (HSTY, magenta; HS, grey) for ρ = 0.35 (A), 0.40 (B), 0.50 (C), and 1.00 (D). | ||
One may wonder whether the layered solid structure depends on the chosen N or is in fact independent of it and thus represents a genuine outcome of the simulation. Since we assume a fcc crystal as initial configuration, in order to fill all lattice positions the particle number must be four times the number of cells. In Fig. 7 we show results for ρ = 1.00 and N values that are either incommensurate (N = 400 and N = 720, panels A and B) or commensurate (N = 864 and N = 1372, panels C and D) with a fcc lattice. Therefore, in A and B not all lattice positions in the simulation box are filled with particles. For N = 400 and N = 720 the layers are still present but are tilted with respect to the axes of the simulation box; moreover, small empty regions are seen in the box. On the other hand, for N = 864 and N = 1372 the nature of layering is identical to that found for N = 2048, see Fig. 6(D), showing that for N values that are commensurate with the fcc lattice the wafer structure is independent of the sample size.
 | ||
| Fig. 7 Equimolar mixture for T = 0.25, n = 5, and ρ = 1.00. Typical equilibrium configurations (HSTY, magenta; HS, grey) for N = 400 (A), 720 (B), 864 (C), and 1372 (D) particles. | ||
Another important issue is the possible metastability (for ρ = 1.00) of the layered solid structure with respect to two-phase, solid–vapor coexistence. Indeed, the configuration illustrated in Fig. 7(A) resembles a layered fcc solid with a vapor inclusion. For what it is worth, the energy per particle in the latter configuration is quite smaller than that of the layered solid, indicating that the competition between solid and two-phase separation is probably shifted toward the latter, at least for the given density.
To further characterize the various stages described in Fig. 6, we report in Fig. 8 the internal energy over the same density range. We document the existence of plateaus in correspondence of the spherical, cylindrical, and slab-like droplets. On average, in the liquid region the energy monotonically decreases with ρ. Eventually, when the solid phase is reached, the energy abruptly falls, as expected in the presence of a first-order phase transition.
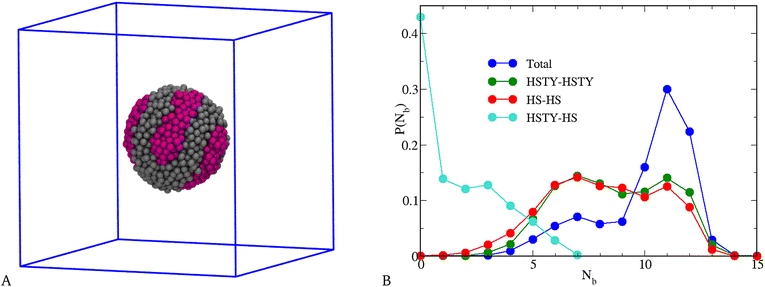
Before concluding our investigation of the equimolar mixture, we consider a range of SW attraction that is significantly long, namely n = 20, which amounts to a SW width ≈4.84σ, still less than L/2 for N = 2048 and ρ = 0.05. Though n = 20 seems unrealistically large, it enables us to unveil the trend expected as n grows beyond 5. A typical equilibrium configuration of the mixture for T = 0.25 is shown in Fig. 9(A), where the peculiar “tennis ball” appearance of the liquid droplet indicates that demixing of HSTY and HS particles now occurs. This visual evidence is corroborated by the quantitative analysis reported in Fig. 9(B), where the probability distribution of the number of bonds Nb, resolved into total, 1–1, 2–2, and 1–2 contributions, is shown: as seen, the total distribution displays a broad maximum for Nb = 7 and a second, higher peak for Nb = 11, referring to particles respectively near and away from the interface between HSTY and HS regions;52 moreover, while the HSTY–HSTY and HS–HS contributions are similar, the mixed HSTY–HS contribution, characterised by a pronounced peak at Nb = 0, distinctly signals the demixing of the two species. Therefore, we arrive at the counterintuitive conclusion that a considerable widening of the range of 1–2 attraction gives rise to segregation of HSTY and HS particles. This phenomenon can be explained by assuming that, within the relative freedom offered by the large and flat SW, HSTY particles find it convenient to gather together in order to efficiently sample the most energetically favourable configurations. Similar stripes have been recently observed in SALR fluids and asymmetric diblock copolymers on a sphere.71,72 The possibility to form such patterns without artificially enforcing the spherical confinement is a novelty of our study, which seems to be inextricably connected with the nature of the cross potential. A more detailed analysis of this result is deferred to future studies.
4 Non-equimolar mixtures
We complete our study by exploring uneven concentrations, while still keeping T = 0.25 and ρ = 0.05. The structure of the mixture for χ = 0.1, 0.3, 0.7, and 0.9 and n = 1,…5 is illustrated in Fig. 10. In line with the equimolar case, when n ≤ 3 both S11(k) and g11(r) provide the picture of a nearly homogeneous fluid: this is particularly evident for χ = 0.1 (A, blue, green, and red symbols) and χ = 0.3 (B), where the low-k peak of S11(k) hardly exceeds 1. For higher concentrations, χ = 0.7 (C) and 0.9 (D), the peak height grows to 2, which is still below the threshold (≈3) marking approximately the onset of clusters in the system.32 Accordingly, g11(r) would be ideal-gas-like for all χ, were it not for a pronounced peak at contact, growing with n, which reveals the increasing preference of HSTY particles for being bonded to particles of the same species.For n = 4 the scenario changes dramatically, since the structure factor now manifests a sharp enhancement of density correlations for all χ, see cyan and orange symbols in Fig. 10. We have resorted to a larger N = 16![[thin space (1/6-em)]](https://www.rsc.org/images/entities/char_2009.gif) 384 sample to clarify the low-k behavior of the structure factors for the cases χ = 0.1 (A) and χ = 0.3 (B). On the other hand, 2048 particles turn out to be enough for higher concentrations, see panels C and D. It emerges that for χ = 0.1 (A) S11 (k) exhibits a plateau for small wavevectors, while a low-k peak is found for higher concentrations. In parallel, g11(r) shows the behaviour typical of an inhomogeneous fluid, with long-range oscillations and multiple peaks.
384 sample to clarify the low-k behavior of the structure factors for the cases χ = 0.1 (A) and χ = 0.3 (B). On the other hand, 2048 particles turn out to be enough for higher concentrations, see panels C and D. It emerges that for χ = 0.1 (A) S11 (k) exhibits a plateau for small wavevectors, while a low-k peak is found for higher concentrations. In parallel, g11(r) shows the behaviour typical of an inhomogeneous fluid, with long-range oscillations and multiple peaks.
Interestingly, a low-k peak is also observed for n = 5 and χ = 0.9 (violet symbols in Fig. 10(D), see more below). In all cases discussed so far, S11(k) has been calculated by Fourier transforming g11(r), which provides the same results as the calculation based on the density fluctuations; however, for n = 5 and χ <0.9 the large fluctuations visible in g11(r) make Fourier inversion more problematic, with the result that large, spurious oscillations appear in the k ≲ 5 portion of the structure factor. For this reason, S11(k) for χ < 0.9 (A, B, and C) has been calculated in terms of the density fluctuations. The very high values attained by S11(k → 0) clearly suggests a macrophase separation under these conditions.
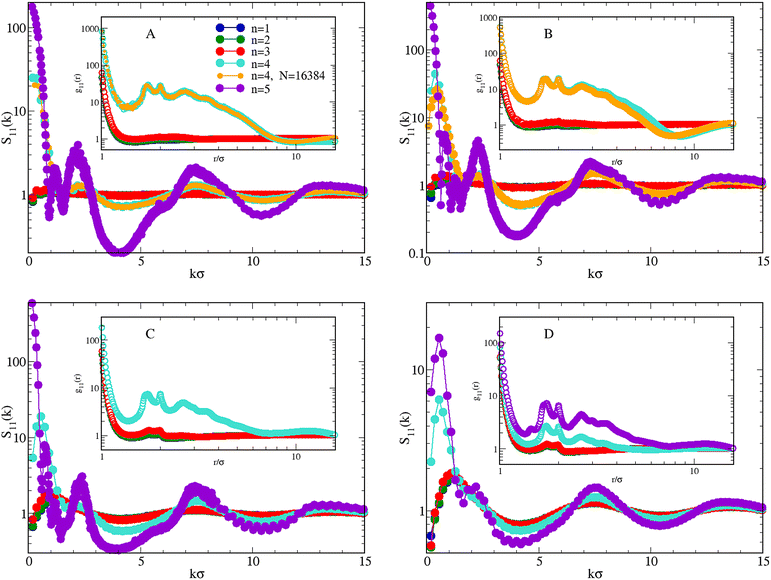 | ||
| Fig. 10 Mixture for T = 0.25 and ρ = 0.05. Effect of increasing n (in the legend) on S11(k) and g11(r) (inset), for χ = 0.1 (A), 0.3 (B), 0.7 (C), and 0.9 (D). Data for n = 1 from ref. 52. | ||
The emerging scenario shows similarities and differences with that observed for χ = 0.5: while for χ = 0.3 and χ = 0.7 the system behaves similarly to the equimolar mixture, differences emerge for χ = 0.1 and χ = 0.9. First considering n = 4, for χ = 0.1 we cannot easily discriminate between macrophase separation and clustering only from the observation of S11(k). The question remains open even after simulating a system of 16![[thin space (1/6-em)]](https://www.rsc.org/images/entities/char_2009.gif) 384 particles, although the trend of S11(k → 0) seems suggestive of a macrophase separation. To clarify this point, we have performed a more detailed investigation, simulating the mixture with χ = 0.1 also for higher densities and lower temperatures. Results are reported in Fig. 11, where in A we plot S11(k) for increasing ρ at T = 0.25: for ρ ≤ 0.30, S11(k) is approximately flat near k = 0. Therefore, the plateau observed for ρ = 0.05 also occurs for higher densities, although with a decreasing height. For densities higher than 0.30, a low-k peak distinctly appears in S11(k), although its height indicates that a clustered state is not reached. When the temperature is reduced to 0.20 (B), the monotonous trend of S11(k) for vanishing wavevectors becomes more evident, in particular for low densities where S11(k → 0) ≈ 100, pointing to the development of large-scale inhomogeneities in the mixture.
384 particles, although the trend of S11(k → 0) seems suggestive of a macrophase separation. To clarify this point, we have performed a more detailed investigation, simulating the mixture with χ = 0.1 also for higher densities and lower temperatures. Results are reported in Fig. 11, where in A we plot S11(k) for increasing ρ at T = 0.25: for ρ ≤ 0.30, S11(k) is approximately flat near k = 0. Therefore, the plateau observed for ρ = 0.05 also occurs for higher densities, although with a decreasing height. For densities higher than 0.30, a low-k peak distinctly appears in S11(k), although its height indicates that a clustered state is not reached. When the temperature is reduced to 0.20 (B), the monotonous trend of S11(k) for vanishing wavevectors becomes more evident, in particular for low densities where S11(k → 0) ≈ 100, pointing to the development of large-scale inhomogeneities in the mixture.
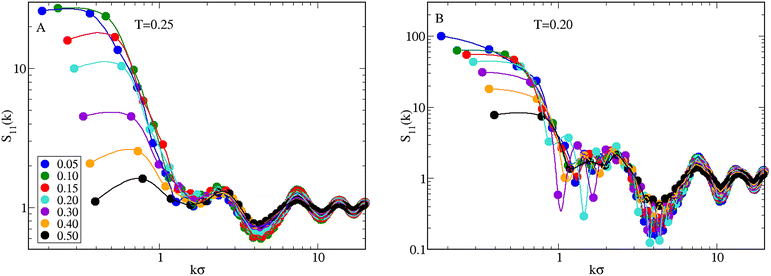 | ||
| Fig. 11 Mixture for n = 4 and χ = 0.1. Profile of S11(k) as a function of ρ (values reported in the legend) for T = 0.25 (A) and 0.20 (B). | ||
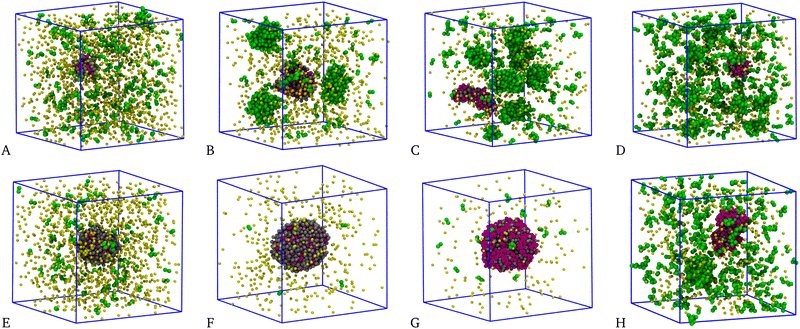
A visual inspection of the system for n = 4 and various concentrations, see top panels of Fig. 12, further helps us to interpret the above results: for all χ > 0.1, several clusters appear in the mixture; in particular, four large clusters are visible for χ = 0.3 (panel B) and even more so for χ = 0.7 (C) and 0.9 (D). Evidence of similarly large clusters has also been reported in ref. 49 and 50. In all these cases, the structure factor exhibits a first peak centred at k ≠ 0, see Fig. 10(B)–(D). On the other hand, for χ = 0.1 (panel A) there is only one cluster of big size surrounded by many small aggregates. The existence of a single big cluster is suggestive of a mixture undergoing liquid–vapour separation.
A similar behaviour is typically observed for n = 5, but in this case almost all particles belong to the big cluster. Equilibrium configurations are shown the bottom panels of Fig. 12: as seen, the longer range of attraction now promotes the onset of a single big cluster including most of the particles, at least for χ < 0.9. As already observed for χ = 0.5, this evidence is suggestive of a phase-separation scenario. However, at variance with the equimolar case the vapour density is not negligible, being higher the farther away we are from equimolarity. Another evidence supporting liquid–vapour separation is provided in Fig. 13, corresponding to χ = 0.1. Here, the density is high enough (ρ = 0.40) that the biggest cluster is cylindrically-shaped rather than spherical. For χ = 0.9, see Fig. 12(H), the biggest cluster is accompanied by a few other large clusters; this is consistent with a clustered state, in agreement with the structural information in Fig. 10(D).
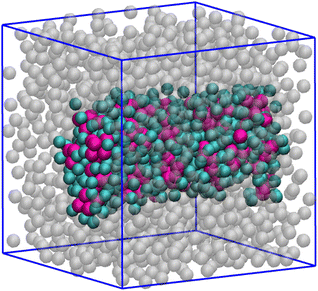 | ||
| Fig. 13 Mixture for T = 0.25, ρ = 0.40, n = 5, and χ = 0.1. A liquid droplet of cylindrical shape is found: HSTY in magenta; HS bonded to them in cyan; HS not belonging to the cylinder in grey. | ||
To summarise, for n ≤ 3 the system keeps substantially homogeneous for all concentrations; a crossover in the behaviour of the mixture is first observed between n = 3 and n = 4, which is where the size of aggregates sharply increases. Provided that n ≥ 4, the second species promotes either clustering of the HSTY particles or the onset of a single big cluster. For n = 4 a big cluster is observed for a concentration of HSTY particles as low as 0.1 (indicating that a liquid–vapour phase separation takes place), whereas for higher χ a cluster fluid is found. The concentration range whereupon phase separation occurs considerably extends for n = 5 where clustering is only observed for high concentrations (χ = 0.9). We reasonably expect that, as n grows beyond 5, macrophase separation will be obtained in an increasingly wider range of concentrations. This difference of behaviour can be traced back to the long-range repulsion between HSTY particles: when their concentration is significant, the formation of large aggregates is hampered by the repulsion at large distances. Obviously, this effect is absent for low χ, where the onset of large structures is anticipated (i.e., occurs for a smaller n) relative to other χ values. A schematic n–χ phase diagram illustrating the behaviour of the mixture for T = 0.25 and ρ = 0.05 is presented in Fig. 14. Here, also the special cases χ = 0 (pure HS fluid) and χ = 1 (pure HSTY fluid32,45), where n plays no role, are included.
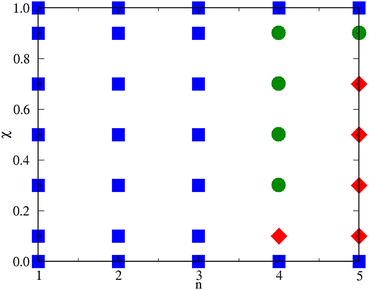 | ||
| Fig. 14 Schematic n–χ phase diagram of the mixture for T = 0.25 and ρ = 0.05. Squares: homogeneous fluid; circles: cluster fluid; diamonds: liquid–vapour phase separation. | ||
5 Conclusions
We have studied a mixture of hard spheres and hard-sphere two-Yukawa particles with a cross attraction of fixed strength and increasing range, measured in terms of a parameter n in eqn (4), under thermodynamic conditions such that the mixture is a homogeneous fluid for the shortest range of attraction considered (n = 1). As the range of attraction grows, particle aggregation is increasingly stimulated until, for n = 4, clusters containing both species of particles emerge at equilibrium. The only exception is for a low concentration of HSTY particles (10% of the total, or χ = 0.1), where we observe the onset of a single big cluster of spherical shape, floating in a background of much smaller aggregates. This structure becomes prevalent for n = 5, where clustering is relegated to very high χ values.We provide convincing evidence that the single big cluster is the sign of a liquid–vapour separation taking place in the system. Indeed, when the density increases, other shapes of the liquid droplet (cylindrical and slab-like) are elicited, similarly as found for a simple-fluid sample going through the liquid–vapour coexistence region in a simulation box with periodic boundary conditions. In addition, upon increasing the density further, a layered solid eventually forms, characterised by bilayers of one species alternated with bilayers of the other species.
In conclusion, when the cross attraction is sufficiently long-ranged, the phase behaviour of the mixture changes from microphase- to macrophase-separated. In our view, the possibility to tune the balance between attractive and repulsive interactions in a simple way makes our model useful for the realisation of prototype materials for the self-assembly of complex structures with programmable sizes and morphologies.
Conflicts of interest
There are no conflicts to declare.Acknowledgements
This work has been done using the computer facilities made available by the PO-FESR 2007-2013 Project MedNETNA (Mediterranean Network for Emerging Nanomaterials).Notes and references
- S. C. Glotzer, M. J. Solomon and N. A. Kotov, AIChE J., 2004, 50, 2978 CrossRef CAS.
- S. C. Glotzer and M. J. Solomon, Nat. Mater., 2007, 6, 557 CrossRef PubMed.
- S. Sacanna and D. J. Pine, Curr. Opin. Colloid Interface Sci., 2011, 16, 96 CrossRef CAS.
- S. Sacanna, M. Korpics, K. Rodriguez, L. Colon-Mendez, S. H. Kim and D. J. Pine, Nat. Commun., 2013, 4, 1688 CrossRef PubMed.
- A. Stradner, H. Sedgwick, F. Cardinaux, W. C. Poon, S. U. Egelhaaf and P. Schurtenberger, Nature, 2004, 432, 492 CrossRef CAS PubMed.
- F. Lo Verso, C. N. Likos and L. Reatto, Smart Colloidal Materials, Berlin, Heidelberg, 2006, pp. 78–87 Search PubMed.
- F. Cardinaux, A. Stradner, P. Schurtenberger, F. Sciortino and E. Zaccarelli, Europhys. Lett., 2007, 77, 48004 CrossRef.
- Y. Liu, L. Porcar, J. Chen, W.-R. Chen, P. Falus, A. Faraone, E. Fratini, K. Hong and P. Baglioni, J. Phys. Chem. B, 2011, 115, 7238 CrossRef CAS PubMed.
- A. Ciach, J. Pękalski and W. T. Góźdź, Soft Matter, 2013, 9, 6301 RSC.
- J. J. McManus, P. Charbonneau, E. Zaccarelli and N. Asherie, Curr. Opin. Colloid Interface Sci., 2016, 22, 73 CrossRef CAS.
- P. Akcora, et al. , Nat. Mater., 2009, 8, 354 CrossRef CAS PubMed.
- J. Riest and G. Nägele, Soft Matter, 2015, 11, 9273 RSC.
- A. P. Santos, J. Pękalski and A. Z. Panagiotopoulos, Soft Matter, 2017, 13, 8055 RSC.
- J. Riest, G. Nägele, Y. Liu, N. J. Wagner and P. D. Godfrin, J. Chem. Phys., 2018, 148, 065101 CrossRef PubMed.
- G. Munaò, A. De Nicola, F. Müller-Plathe, T. Kawakatsu, A. Kalogirou and G. Milano, Macromolecules, 2019, 52, 8826–8839 CrossRef.
- M. Seul and D. Andelman, Science, 1995, 267, 476 CrossRef CAS PubMed.
- G. M. Whitesides and B. Grzybowski, Science, 2002, 295, 2418 CrossRef CAS PubMed.
- J.-M. Bomont and D. Costa, J. Chem. Phys., 2012, 137, 164901 CrossRef PubMed.
- Y. Zhuang, K. Zhang and P. Charbonneau, Phys. Rev. Lett., 2016, 116, 098301 CrossRef PubMed.
- Y. Zhuang and P. Charbonneau, J. Phys. Chem. B, 2016, 120, 7775 CrossRef CAS PubMed.
- H. Serna, A. D. Pozuelo, E. G. Noya and W. T. Góźdź, Soft Matter, 2021, 17, 4957 RSC.
- J. C. F. Toledano, F. Sciortino and E. Zaccarelli, Soft Matter, 2009, 5, 2390 RSC.
- J.-M. Bomont, J.-L. Bretonnet, D. Costa and J.-P. Hansen, J. Chem. Phys., 2012, 137, 011101 CrossRef PubMed.
- Y. Liu, Chem. Eng. Process Tech., 2013, 1, 4 Search PubMed.
- M. B. Sweatman, R. Fartaria and L. Lue, J. Chem. Phys., 2014, 140, 124508 CrossRef PubMed.
- J.-M. Bomont, D. Costa and J.-L. Bretonnet, Phys. Chem. Chem. Phys., 2017, 19, 15247 RSC.
- S. Das, J. Riest, R. G. Winkler, G. Gompper, J. K. G. Dhont and G. Nagële, Soft Matter, 2018, 14, 92 RSC.
- Y. Liu and Y. Xi, Curr. Opin. Colloid Interface Sci., 2019, 39, 123 CrossRef CAS PubMed.
- J.-M. Bomont, D. Costa and J.-L. Bretonnet, Phys. Chem. Chem. Phys., 2020, 22, 5355 RSC.
- A. A. Harraq, A. A. H. E. Lin, T. M. Truskett and B. Bharti, Commun. Chem., 2022, 5, 72 CrossRef.
- F. Sciortino, S. Mossa, E. Zaccarelli and P. Tartaglia, Phys. Rev. Lett., 2004, 93, 055701 CrossRef PubMed.
- P. D. Godfrin, N. E. Valadez-Perez, R. Castañeda-Priego, N. Wagner and Y. Liu, Soft Matter, 2014, 10, 5061 RSC.
- P. D. Godfrin, S. D. Hudson, K. Hong, L. Porcar, P. Falus, N. J. Wagner and Y. Liu, Phys. Rev. Lett., 2015, 115, 228302 CrossRef PubMed.
- A. I. Campbell, V. J. Anderson, J. S. van Duijneveldt and P. Bartlett, Phys. Rev. Lett., 2005, 94, 208301 CrossRef PubMed.
- S. Salaniwal, S. K. Kumar and A. Z. Panagiotopoulos, Langmuir, 2003, 19, 5164–5168 CrossRef CAS.
- M. Tarzia and A. Coniglio, Phys. Rev. E: Stat., Nonlinear, Soft Matter Phys., 2007, 75, 011410 CrossRef PubMed.
- M. B. Sweatman and L. Lue, Adv. Theory Simul., 2019, 2, 1900025 CrossRef.
- R. P. Sear and W. Gelbart, J. Chem. Phys., 1999, 110, 4582 CrossRef CAS.
- Y. Zhuang and P. Charbonneau, J. Phys. Chem. B, 2016, 120, 6178 CrossRef CAS PubMed.
- A. P. D. Pini, G. Jialin and L. Reatto, Chem. Phys. Lett., 2000, 327, 209 CrossRef.
- J. L. Bretonnet, AIMS Mater. Sci., 2019, 6, 509 Search PubMed.
- C. Bores, E. Lomba, A. Perera and N. G. Almarza, J. Chem. Phys., 2015, 143, 084501 CrossRef PubMed.
- G. Munaò, D. Costa, S. Prestipino and C. Caccamo, Colloids Surf., A, 2017, 532, 397 CrossRef.
- S. Prestipino, G. Munaò, D. Costa and C. Caccamo, J. Chem. Phys., 2017, 146, 084902 CrossRef PubMed.
- G. Munaò, S. Prestipino and D. Costa, Phys. Chem. Chem. Phys., 2021, 23, 22661–22672 RSC.
- S. Prestipino, D. Gazzillo, G. Munaò and D. Costa, J. Phys. Chem. B, 2019, 123, 9272 CrossRef CAS PubMed.
- G. Munaò, D. Costa, S. Prestipino and C. Caccamo, Phys. Chem. Chem. Phys., 2016, 18, 24922 RSC.
- N. Dlamini, S. Prestipino and G. Pellicane, Entropy, 2021, 23, 715 CrossRef PubMed.
- C. A. Ferreiro-Rangel and M. B. Sweatman, Mol. Phys., 2018, 116, 3231–3244 CrossRef CAS.
- J. Tan, N. D. Afify, C. A. Ferreiro-Rangel, X. Fan and M. B. Sweatman, J. Chem. Phys., 2021, 154, 074504 CrossRef CAS PubMed.
- O. Patsahan, M. Litniewski and A. Ciach, Soft Matter, 2021, 17, 2883 RSC.
- G. Munaò, S. Prestipino, J. M. Bomont and D. Costa, J. Phys. Chem. B, 2022, 126, 2027–2039 CrossRef PubMed.
- P. Bolhuis and D. Frenkel, Phys. Rev. Lett., 1994, 72, 2211–2214 CrossRef CAS PubMed.
- J. Largo, M. A. Miller and F. Sciortino, J. Chem. Phys., 2008, 128, 134513 CrossRef CAS PubMed.
- J. Ruiz-Franco and E. Zaccarelli, Annu. Rev. Condens. Matter Phys., 2021, 12, 51–70 CrossRef CAS.
- J. P. Hansen and I. R. McDonald, Theory of simple liquids, Academic Press, New York, 3rd edn, 2006 Search PubMed.
- P. Falus, L. Porcar, E. Fratini, A. F. W.-R. Chen, K. Hong, P. Baglioni and Y. Liu, J. Phys.: Condens. Matter, 2012, 24, 064114 CrossRef PubMed.
- P. D. Godfrin, R. Castañeda-Priego, Y. Liu and N. Wagner, J. Chem. Phys., 2013, 139, 154904 CrossRef PubMed.
- J.-P. Hansen and L. Verlet, Phys. Rev., 1969, 184, 151 CrossRef CAS.
- A. B. Bhatia and D. E. Thornton, Phys. Rev. B: Condens. Matter Mater. Phys., 1970, 2, 3004 CrossRef.
- J. Hoshen and R. Kopelman, Phys. Rev. B: Condens. Matter Mater. Phys., 1976, 14, 3438 CrossRef CAS.
- S. H. Chen, J. Rouch, F. Sciortino and P. Tartaglia, J. Phys.: Condens. Matter, 1994, 6, 10855 CrossRef CAS.
- M. C. Abramo, C. Caccamo, D. Costa, P. V. Giaquinta, G. Malescio, G. Munaò and S. Prestipino, J. Chem. Phys., 2015, 142, 214502 CrossRef PubMed.
- S. Prestipino, C. Caccamo, D. Costa, G. Malescio and G. Munaò, Phys. Rev. E: Stat., Nonlinear, Soft Matter Phys., 2015, 92, 022141 CrossRef PubMed.
- L. G. MacDowell, P. Virnau, M. Müller and K. Binder, J. Chem. Phys., 2004, 120, 120 CrossRef PubMed.
- S. Prestipino, M. Ferrario and P. V. Giaquinta, Physica A, 1993, 201, 649 CrossRef.
- R. E. Guerra, C. P. Kelleher, A. D. Hollingsworth and P. M. Chaikin, Nature, 2018, 554, 346 CrossRef CAS PubMed.
- J. Van Duijneveldt and D. Frenkel, J. Chem. Phys., 1992, 96, 4655–4668 CrossRef CAS.
- P. R. ten Wolde, M. J. Ruiz-Montero and D. Frenkel, J. Chem. Phys., 1996, 104, 9932 CrossRef CAS.
- K. Binder, P. Virnau, B. J. Block, P. Virnau and A. Tröster, Am. J. Phys., 2012, 80, 1099 CrossRef CAS.
- S. Franzini, L. Reatto and D. Pini, Soft Matter, 2022, 18, 186–197 RSC.
- F. Zhao, Z. Xu and W. Li, Macromolecules, 2021, 54, 11351–11359 CrossRef CAS.
| This journal is © The Royal Society of Chemistry 2022 |

