DOI:
10.1039/D2SM00527A
(Paper)
Soft Matter, 2022,
18, 5598-5604
A nanofluidic system based on cylindrical polymer brushes: how to control the size of nanodroplets
Received
26th April 2022
, Accepted 1st July 2022
First published on 6th July 2022
Abstract
In molecular dynamics simulations we investigate the self-organized formation of droplets from a continuous flow of incoming nanoparticles. This transformation is facilitated by a cylindrical channel that is decorated with a polymer brush in a marginally poor solvent. We analyze droplet formation and propagation by means of simple scaling arguments which are tested in the simulations. Polymer brushes in marginally poor solvents serve as a pressure feedback system, exhibit a collapse transition under the moderate pressure of the incident flow, without the need for additional external stimuli, and finally close spontaneously after droplet passage. Our results qualitatively demonstrate the control of polymer brushes over continuous fluids and droplet formation, and its effectiveness as a means of fluid control can be used to design nanofluidic rectification devices that operate reliably under moderate pressure.
1 Introduction
Nanofluidic systems using nanochannels for the control of incident fluids have received wide attention because of their novel applications in DNA selection and sequencing,1–3 drug delivery and release,4–6 ionic pumps and diodes,7,8 aquaporin gates9, molecule detection,10,11 energy conversion12 and blood glucose sensoring13. The basis for the implementation of these applications is the ability to manipulate fluids through electromagnetic fields,5,14 nanopore surface charges15, hydrogels16–18 or stimuli-responsive polymer brushes19. Besides the gating function of fluid control in nanovalve systems, another important application is the conversion of a continuous flow into a regular sequence of droplets, a mechanism, which has been implemented in experiments on the micron-scale.20,21
Polymer brushes are promising candidates to achieve similar effects on the nano-scale. They can change their degree of swelling in response to environmental factors such as solvent quality22, pH or voltage changes,23,24 temperature,25,26 pressure27, luminance28, and antibody29 or cosolvent30,31 interactions. A cosolvent is a competing solvent component which at rather low concentrations can trigger a sharp collapse-transition of a brush that is swollen in a good solvent. In the case of cylindrical brushes in a marginally poor solvent, the characteristic bi-minimal free energy profile32 may be tuned so that a transient open channel-state is metastable and closes spontaneously to interrupt a continuous inflow of nanoparticles (NPs), after a cluster or globule of NPs, henceforth to be called ‘nanoparticle droplet’ (NPD), has translocated to the channel. We note that the term NPD indicates the specificity of a globule of NPs with an effective surface tension due to the environment, since the outer layer of NPs interacts directly with the polymer brush.
Brush-decorated nanochannels under incident nanoflow have been studied before using molecular dynamics (MD) simulation methods33, including the effects of interparticle interactions34, the shearing effects on the brushes,27,35 and the formation of NPDs inside channels of infinite length36. In the present work, we simulate brushes in marginally poor solvent which are exposed to a continuous flux of NPs and investigate the gating process that leads to an interruption of that flux. The NPs are accumulating at the brush entrance and eventually breaking through to form the NPD which subsequently propagates through the cohesive brush phase. We are going to focus on scaling properties in order to understand how experimental parameters such as flow speed and particle flux can be used to systematically control size and frequency of NPDs.
The remainder of this work is organized as follows: in Section 2, we detail the MD simulation model for the cylindrical brush and connect the parameter settings of our coarse-grained model with physical units that are of relevance in laboratory setups. Simulation results are discussed in Section 3, including the impacts of driving force and incident rate on the droplet size and frequency, the friction between droplets and brush as well as the effect of the sizes of individual NPs. Finally, a discussion of the findings will be provided in Section 4 and summarized in Section 5.
2 MD simulation model and the relation to experimental parameters
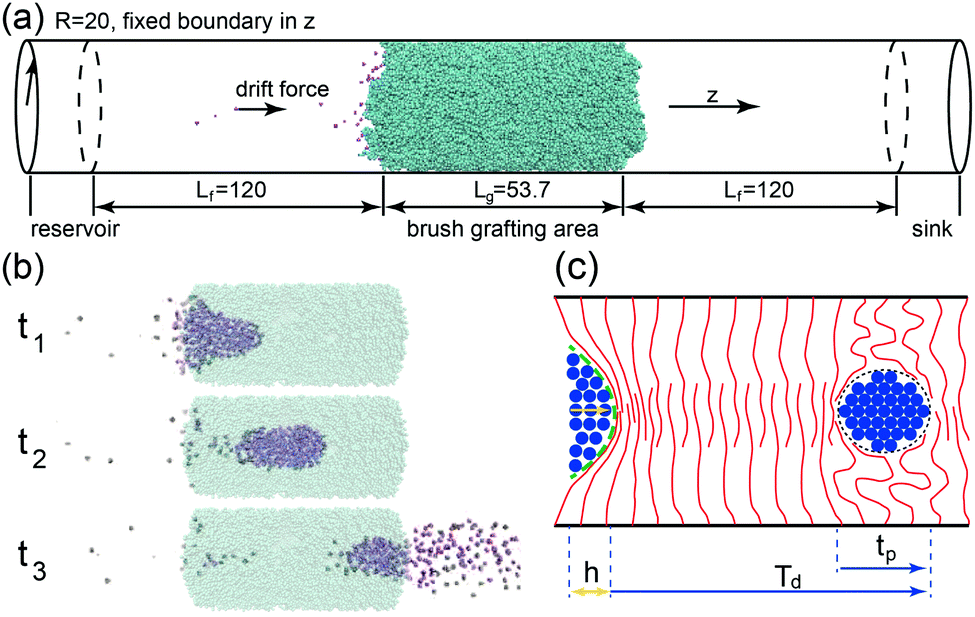
Using the open source LAMMPS software37, MD simulations of cylindrical brushes and NPs have been conducted using a coarse grained bead-spring (‘Kremer–Grest’) model38. The brush is placed in the middle of the nanopore and covers an axial length of Lg, surrounded by empty sections of Lf on each side as shown in Fig. 1a. Each chain is grafted with one end onto the inner tube-wall, at grafting density σ =M/A, where M denotes the total number of chains and A the grafting area of the channel-wall. Pair interactions between any two beads are the Lennard-Jones (LJ) potentials| | 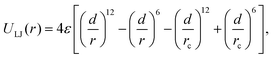 | (1) |
where ε is the depth of the potential (in units of kBT) and d is the effective diameter. The monomer diameter d defines the unit-length, and in the case of interactions between particles of different diameters (NP-sizes are larger, dNP > d), arithmetic mixing rules are applied. All particles are confined inside the channel of radius R by a repulsive potential barrier similar to that of eqn (1) and there is no friction between the particles and the wall. The parameter rc defines the cutoff distance. Fully repulsive interactions result when the LJ potential is truncated at its minimum39, and implemented for monomer–NP interactions, at which  . Otherwise, truncation occurs at a distance of rc = 2.5d between monomers and rc = 2.5dNP between NPs. The NPs are given a weak attraction of ε = 0.5kBT (as well as between monomers), providing a slight adhesive force, which however is insufficient to lead to a spontaneous droplet formation or to grant stability of the droplet after it has passed through the brush phase.
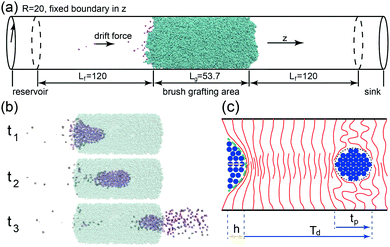 |
| | Fig. 1 (a) Simulation model of NPs driven through a cohesive brush-decorated channel. Purple and cyan beads represent NPs and monomers, respectively. After being generated in the reservoir area on the left, NPs pass through the brush under the drift force f and are deleted after entering the sink area on the right. (b) Snapshots of formation (t1), inclusion (t2) and release (t3) of NPDs. (c) Schematic illustration of droplet formation and passage, where the central column-height of the paraboloidal proto-cluster is h. The droplets pass through a cross section of the brush in time tp and at intervals Td. | |
Connectivity between bonded monomers is enforced through a finite extensible nonlinear elastic (FENE) potential38, defined as
| | | UFENE(r) = −0.5KR02ln[1 − (r/R0)2] | (2) |
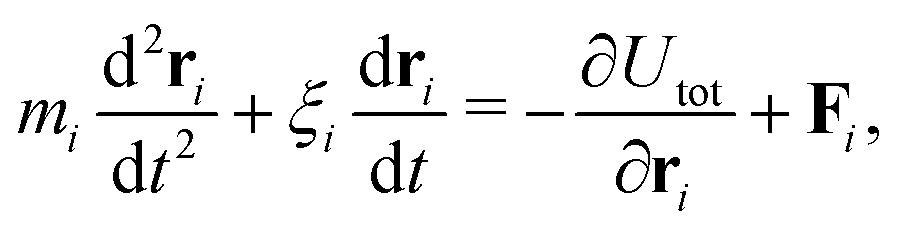
with a spring constant K = 30kBT/d2 and a maximum permitted bond length of R0 = 1.5d. In this setup, average bond-lengths vary between 0.97d and 1.0d. Combining the interaction energies into the potential Utot, the non-driven motion of the particle ‘i’ is described by the Langevin equation,
| |  | (3) |
where
mi and
ξi represent the mass and friction coefficient, respectively.
Fi is a Gaussian random force, applied to couple the system to the heat bath (implicit solvent), with the correlation function
| | | 〈Fi(t)·Fj(t′)〉 = 6mkBTξδijδ(t − t′). | (4) |
Both
kB and the temperature
T are set to unity. We thus take monomer size,
d, mass,
m, and
kBT as length, mass and energy units, respectively. The time unit is the LJ-time of a monomer,
. Then the units of other parameters are deduced, such as force [
f] =
kBT/
d, velocity
, viscosity and friction coefficient

(whose value regarding the monomer is set as
ξ = 1 in simulations).
NPs are additionally exposed to a constant external drift force which drives them through the brush and are bound in the axial direction by a fixed boundary. To connect simulation parameters to real-life dimensions, a transformation into physical units is possible as follows: the dimensionless energy unit kBT is about ∼10−21J at room temperature, while the length unit relates to the size of the Kuhn-monomer, typically of the order of ∼10−9m in the case of rather flexible polymers, or larger otherwise. Then, the unit force used in this work would correspond to ∼10−12N, yielding forces on the NPs of the order of a few tenths of a pico-Newton.
3 Results
3.1 Droplet formation
For setting up the cylindrical polymer brush, a total of 336 polymers with a polymerization of N = 120 are grafted inside the nanopore of radius R = 20 within an axial length of Lg = 53.7 at the grafting density σ = 0.05. The arrangement for the incident flow is illustrated in Fig. 1a: individual NPs (with size dNP = 2) are continuously generated in the reservoir area at time interval Δt, yielding the NP incident rate I = 1/Δt. With the drift, which is generated by a constant external body force f, acting on each particle36, the NPs initially pass through the length of Lf = 120 and crowd at the interface of the brush. The origin of this drive would stem from an (implicit) solvent which is assumed to consist of far smaller molecules that continuously move through the brush, sufficiently slow so that the polymer conformations remain unaffected.40–42 This model is adequate as long as the solvent flow itself would not significantly perturb the brush conformations. As we will show below, the formation of large particle droplets occurs at small drift forces only and thus the regime of high solvent fluxes is of little interest here. There exists a critical flux at which the nanochannel stays permanently open so that a continuous flow of NPs sets in. After having crossed the brush, the droplet disperses into a burst of NPs which are eventually eliminated in the sink area near the far edge of the simulation box.
Fig. 1b shows snapshots of a droplet in its formation stage, while propagating through the channel and its dissolvation. The sketch in Fig. 1c depicts the droplet formation process: While piling up in front of the cohesive brush, the NPs impose an increasing normal stress onto the brush entrance, eventually forming a droplet with a well defined number of NPs. The simulations indicate that it is not a critical accumulative force of NPs, i.e. Fc = Npf, which triggers the breakup of the cohesive polymer phase, but rather a critical normal stress imposed onto the central axis at which the brush polymers overlap: This stress is proportional to the central column-height h of the proto-droplet, which approximately assumes a paraboloid shape (green embedding curve in Fig. 1c). A critical normal stress then corresponds to a critical column-height hc, which causes a breakthrough of the NPs through the brush-entrance, opening a path for the remaining NPs to enter the brush. Since the volume of the paraboloidal proto-droplet is proportional to h2, the number of NPs inside such a droplet at critical stress is Np ∼ hc2. As the normal stress is given by the total force exerted by the central column, hc has to be inversely proportional to the driving force, thus hc ∼ f−1, or
Fig. 2 displays the corresponding simulation results, which verify the scaling relation suggested by eqn (5). Moreover, the average Np is independent of the incident flow rate I, indicating that the time scale involved in droplet formation does not yet interfere with the time scale on which the polymer chains respond to external forces. Since the open–close transition of brush is fast when compared to droplet formation, it is permissible to neglect aspects of polymer dynamics in the theoretical modelling of droplet formation.
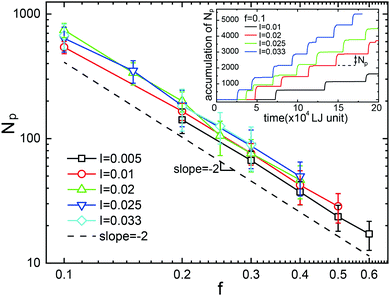 |
| | Fig. 2 The average number of nanoparticles inside a NPD, Np, as a function of drift force, f. Symbols of different colors represent simulations at different incident rates. The dashed line is the slope s = −2 according to the scaling relation eqn (5). Inset: Stepwise accumulation of nanoparticles arriving at the sink area at different production rates but constant driving force. | |
3.2 Frequency of nanodroplets vs. incident rate
To analyze the behaviors of the propagating droplets, we shall assume that all NPs passing through the channel are members of their respective droplets. In fact, there exist a few renegade NPs which either find their individual paths through the brush-tangle or stay behind the droplet and become trapped inside the brush. Those are statistically insignificant and often absorbed by the subsequent droplet. With the NP-production rate of I, the number of NPs having passed the channel is, with increasing system time t, approaching the asymptotic relation Nt = It = MpNp (inset in Fig. 2), where Mp is the total number of droplets. Let us now define the duty cycle Dc as the fraction of time at which an arbitrarily selected cross section of the brush is in its “open” state, then| |  | (6) |
where Td is the average time between the passage of subsequent droplets and tp the time a single droplet requires to propagate a distance of its own size (Fig. 1c). Here we employed the relation Np = ITd. In the case of Dc = 1, the channel is continuously open with a continuous flow of NPs. In the simulations, the passage of droplets and hence Dc can be extracted from variations of the brush-height (i.e. the center of mass thickness, the average radial distance of each monomer from the substrate), which changes as a droplet passes through a given cross-section of the channel.
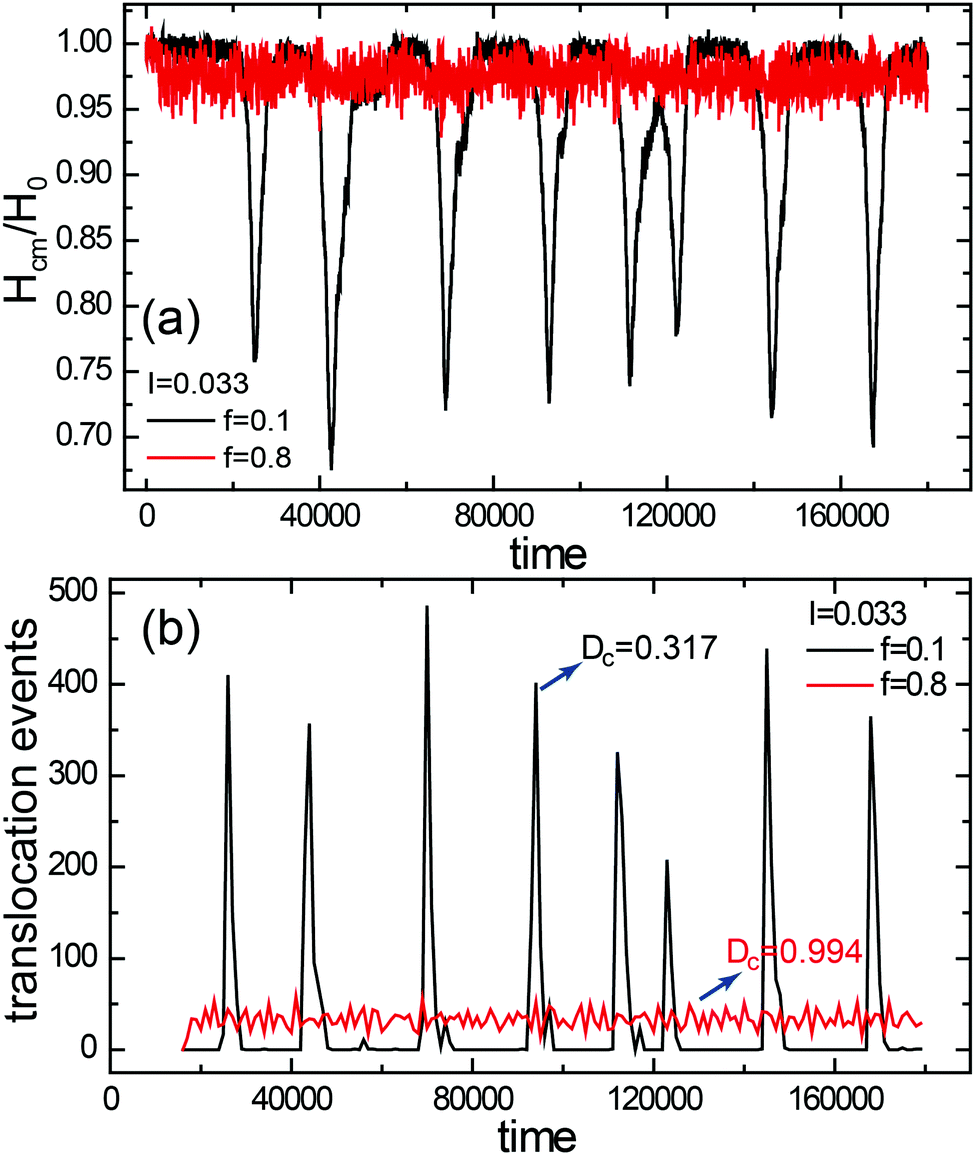
Fig. 3a and b display the variation of the rescaled thickness (for a cross-section layer of an axial length of 5) and the translocation events as a function of time. At the given incidence, I = 0.033, the NPDs formed at the smaller driving force (black curve, f = 0.1), are easily distinguished, since each droplet passage corresponds to a significant decrease in the thickness of the brush. As a result, the continuously incoming fluid is turned into a sequence of droplets at a low value of the duty cycle (Dc = 0.317). In the case of a far higher driving force (red curve, f = 0.8), NPs are continuously passing through the nanochannel and Dc is close to unity, i.e. the channel remains permanently open.
 |
| | Fig. 3 (a) Rescaled center of mass thickness, Hcm/H0 of the brush as a function of simulation time (in LJ units). (b) Time-dependent number of nanoparticle translocation rates. Black (f = 0.1) and red (f = 0.8) curves show the effect of driving force on the permeation process of NPDs at the same incidence rate I = 0.033. | |
When analyzing the simulation results as shown in Fig. 3b, we can extract the NPD duty cycles at different values for the production rate I and driving force f. A large range of simulation parameters is summarized in Fig. 4, where the error bars depict the variation of Dc after removal of trivial translocation events (“renegade” particles which are detached from droplets). The linear relationship between Dc and I as predicted by eqn (6) is approximately satisfied (solid line), indicating that a variation of the NP-flow varies solely the frequency of droplet translocation but does not affect the average droplet size (Fig. 2). As long as the brush returns to its equilibrium state on a time scale covering the idle time between two subsequent droplets, Dc ∼ I holds in this parameter range. This is no longer the case as soon as the droplet frequency reaches sufficiently high values such that the waiting time between two droplets, Td − tp, approaches the relaxation time of the brush. The subsequent droplet then experiences a channel still being in the process of closure, and a further increase of NP-flow eventually enforces a continuously open channel.
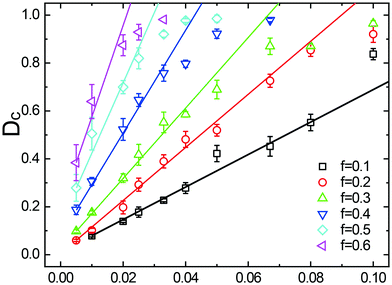 |
| | Fig. 4 Duty cycle of NPDs through nanochannels as a function of incident flow rate and at different drift forces. MD simulation results (symbols) display a linear relationship between Dc and I (solid lines, eqn (6)), which fails as Dc approaches 1. | |
3.3 Friction between droplet and brush
In the case of a driven single particle in the solvent, f is balanced by the frictional drag of the solvent to reach a stationary velocity of v0 = f/ξ. When these NPs form a droplet inside the brush, the friction between the droplet and the surrounding polymers adds to the effective drag, and the resulting total frictional force F has to be in balance with the total driving force Npf, thus giving| |  | (7) |
where v stands for the center of mass velocity of the droplet. Bringing in the relationship between Np and f (eqn (5)), we arrive at| |  | (8) |
The frictional force F on the droplet during the inclusion stage (Fig. 1b-t2) therefore depends upon the number of NPs and the average center of mass velocity of droplet propagation through the brush, which can be extracted separately for each individual droplet.
After evaluating the NPs in individual droplets, Fig. 5 shows the relation between F and Np for each droplet at various driving forces (f, distinguished by colour) and incident flow rates. While Np is not constant but fluctuating about its mean value at any given f (symbols of identical colors), the corresponding total friction F varies linearly with Np (indicated by the red solid line). As a function of f, the average total friction then scales approximately as N1/2p (indicated by the red dashed line). Comparing with eqn (7) and (8), such a simple functional behavior remains valid as long as the velocity ratio v/v0 and hence the droplet velocity v is not itself a function of Np, i.e., as long as the ratio v/v0 does not depend upon f.
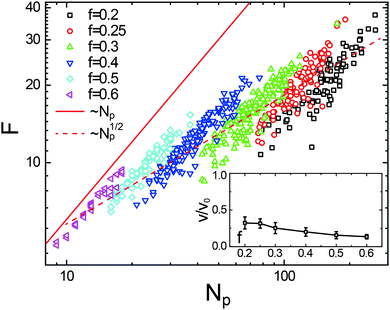 |
| | Fig. 5 Friction between droplets and brushes, F (eqn (7) and (8)), as a function of the number of nanoparticles within the droplet, Np. Each data point (symbols, from the MD simulations) represents an individual droplet produced under different driving forces (f, distinguished by color). The simulation results follow a linear relationship with Np (red solid line) at fixed f, while roughly satisfying a scaling of N1/2p (red dashed line) when f is varied. Inset: Ratio of the center of mass velocity of the droplet to the velocity of a single NP in pure solvent for various f. | |
To investigate the condition under which this simplification holds, we consider a droplet with total number of Np particles, of which Ns are located at the surface of the droplet and in contact with the polymers. Only those would be exposed to the friction that arises from the brush and contribute a drag of ξ*v each to the droplet; ξ* contains the combined friction arising from the implicit solvent and monomers. The remaining (Np − Ns) particles each contribute ξv to the total drag. Therefore, the total frictional drag on the droplet equals Nsξ*v + (Np − Ns)ξv, which is balanced by the cumulative driving force Npf = Npξv0, yielding
| |  | (9) |
where
δ is a factor that depends upon the shape and volume of the droplet,
i.e. the proportion of surface particles. In the limit of sufficiently small droplets, the ratio
Ns/
Np remains close to unity and almost all NPs are in contact with the brush. Therefore, the velocity ratio is a constant of
ξ/
ξ*, depending only upon the properties of solvent and polymer, and the scaling relationship between
F and
Np with respect to the velocity ratio holds valid. Contrarily, in the case of small
f (
e.g.,
f = 0.2, black symbols in
Fig. 5), the resulting large NP-size leads to significant deviations because a constant ratio
v/
v0 no longer remains satisfied. As shown in the inset of
Fig. 5, the velocity ratio approaches an asymptotic value as
f increases.
3.4 Effect of the nanoparticle size
We may re-derive eqn (5), including the size of nanoparticle dNP, as follows. The droplet size is determined by the critical normal stress, which leads to the inclusion pressure of the brush for a single NP in the axial direction, Pinc = faxial/A, where faxial and A represent the axial force of the NP acting on the brush and the cross-sectional area of the NP respectively. Once the NPs accumulate in front of the brush, faxial is proportional to the number of NPs aligned upward along the axial direction, Naxial, and the driving force on each NPs, i.e. faxial = Naxialf. Considering that the length of the NP arrangement satisfies h = NaxialdNP, we get| | 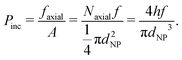 | (10) |
Therefore, the maximum value of the inclusion pressure exists along the column length hc of the paraboloidal proto-droplet (see Fig. 1c). When it reaches a constant critical value Pc, a nanodroplet is formed and the number of NPs inside the droplet is estimated as| | 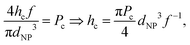 | (11) |
yielding| | | Np ∼ hc2/dNP3 ∼ dNP3f−2. | (12) |
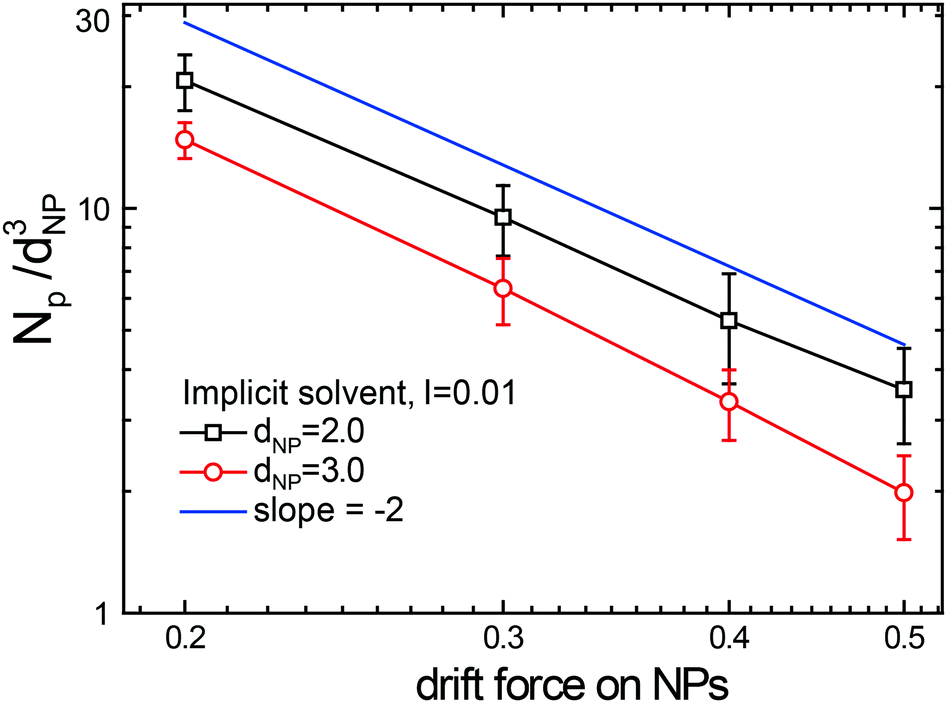
Besides the scaling behavior Np ∼ f−2, the number of nanoparticles in the droplet increases with the volume of the particles. This fact is also found in the simulations, as shown in Fig. 6, though the rescaled profiles Np/dNP3 ∼ f−2 do not precisely coincide indicating that the change of size from dNP = 2 to dNP = 3 is exceeding the volume range of the resulting droplets in which brush-related parameters such as polymer-response would remain approximately invariant.
 |
| | Fig. 6 The average number of NPs inside a “droplet”, Np, as a function of drift force, f. Black and red symbols represent free NP diameters of dNP = 2 and dNP = 3, respectively, and the simulation results for both are consistent with the prediction of the scaling relation Np ∼ f−2 (eqn (5), blue line) within the error range. | |
4 Discussion
The results demonstrate that within a wide parameter range the relaxation dynamics of the polymers is sufficiently fast to remain irrelevant. As a result, neither droplet size nor droplet velocity are functions of the incident NP-rate – the next droplet experiences the brush environment in its equilibrium state. Only at sufficiently high fluxes or driving forces, at which the duty cycle approaches values close to unity, does the dynamics of droplet-passage turn sufficiently fast so that the polymer relaxation fails and the droplet-flow crosses over into a continuous flow. Therefore, with a constant incidence, the brush relaxation time straightforwardly determines the transition condition of NPs from the droplet state to the continuous flow state, i.e., Dc ≃ 1 occurs when the time between two subsequent droplets reaches the brush relaxation time.
Brush coatings are particularly effective for the self-organized generation of a periodic flow of droplets because of two facts: first, the brush forms (in marginally poor solvent) a somewhat sticky tangle which effectively blocks diffusive passage of medium-sized particles, even when the grafting density remains moderate. Besides, its bi-minimal energy profile32 provides here a low free energy barrier against the formation of NPDs, thus reducing the critical stress that is required for the incident particles to enter the brush and to establish the droplet formation.
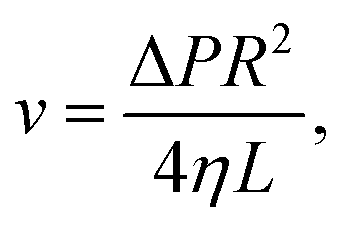
Experimentally, brush-decorated nanopores can be prepared and have been shown to regulate the translocation of fluorescent DNA43. We shall make a rather rough comparison of parameters used in these experiments with the simulations shown here using a coarse-grained model: In the experiment, the channel radius was R = 25 nm, its length L ∼ 6 μm and the pressure difference ΔP ∼ 150 mbar = 1.5 × 10⁴ N m−2 = 1.5 × 10⁻² pN nm−2 between both sides of the channel. Assume for simplicity an empty channel. Then according to Hagen–Poiseuille (HP) the flow velocity in its center would be
| |  | (13) |
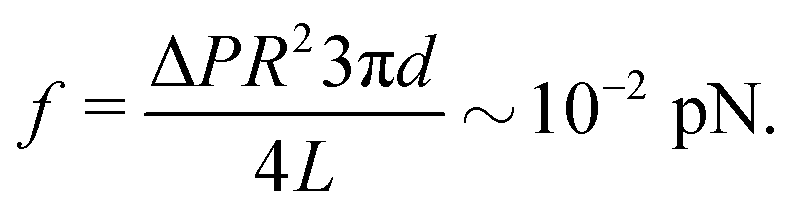
and the drag force on a NP of diameter
d = 3 nm
| |  | (14) |
The estimate of driving forces applied in our simulations (see Section 2) leads to forces that are 1–2 orders of magnitude higher than that, but higher pressures should be feasible experimentally (in reverse osmosis technologies for water desalination, water is driven through membranes at pressures that are higher by three orders of magnitude), and larger pore and NP sizes are probably desirable as well.
5 Conclusions
In conclusion, we have demonstrated in MD simulations how a polymer-decorated brush in marginally poor solvent can be employed to turn a continuous flow of NPs into a regular sequence of droplets. A couple of simple scaling arguments are used to interpret the droplet formation process and primary features of droplet propagation through the brush-tangle. Most notably, the average number of NPs per droplet (size of droplets) is inversely proportional to the squared driving force (eqn (5)), the friction between droplet and brush scales as the square root of the number of NPs (eqn (8)), and the duty cycle (frequency of droplets) linearly with the NP-flux (eqn (6)). The latter fact inevitably leads to a transition into a continuous NP-flow once a critical flux is reached. We thus offer a simple theoretical platform for the design of brush-controlled nanofluidic devices.
A systematic understanding of the brush structure, its free energy profile and the conditions under which the conformational transition is triggered during droplet formation, might allow the design of brushes for nanofluidic devices with the desired properties in terms of particle-throughput or droplet-frequency. The present shortcomings of the simulation method include the neglect of complex effects of hydrodynamic interactions between the flow field, the NPs which are carried by that field and the polymers. In a set of preliminary investigations, we are in the meanwhile able to simulate droplet formation in systems with explicit solvents (data not shown). Here, only the solvent molecules are driven while the NPs are floating passively in the solvent flux. Preliminary results indicate that the scaling properties presented in the current work, and based on the implicit solvent model, still remain valid, but the considerable numerical costs of explicit solvent simulations are so far prohibitive for a production of data of sufficiently statistical volume. We are planning to pursue this direction in an upcoming project with the application of lattice Boltzmann44 or multi particle collision dynamics methods45,46 to optimize the simulation process, in which even the inclusion of hydrodynamic interactions may become feasible.
Conflicts of interest
There are no conflicts of interest to declare.
Acknowledgements
This work was supported by the Deutsche Forschungsgemeinschaft (DFG) under Grant No. SO 277/17 and ME 1756/4-1 and by the Sino-German (CSC-DAAD) Postdoc Scholarship Program, 2019 No. 57460082. The authors thank the ZIH of the TU Dresden for providing computational resources.
Notes and references
- S. M. Iqbal, D. Akin and R. Bashir, Nat. Nanotechnol., 2007, 2, 243–248 CrossRef CAS PubMed.
- S. K. Min, W. Y. Kim, Y. Cho and K. S. Kim, Nat. Nanotechnol., 2011, 6, 162–165 CrossRef CAS PubMed.
- S. Hernández-Ainsa, C. Muus, N. A. Bell, L. J. Steinbock, V. V. Thacker and U. F. Keyser, Analyst, 2013, 138, 104–106 RSC.
- S. Åkerman, P. Viinikka, B. Svarfvar, K. Putkonen, K. Järvinen, K. Kontturi, J. Näsman, A. Urtti and P. Paronen, Int. J. Pharm., 1998, 164, 29–36 CrossRef.
- G. Jeon, S. Y. Yang, J. Byun and J. K. Kim, Nano Lett., 2011, 11, 1284–1288 CrossRef CAS PubMed.
- B. Schuster, M. Junkin, S. S. Kashaf, I. Romero-Calvo, K. Kirby, J. Matthews, C. R. Weber, A. Rzhetsky, K. P. White and S. Tay, Nat. Commun., 2020, 11, 1–12 CrossRef PubMed.
- Z. Siwy and A. Fulinski, Phys. Rev. Lett., 2002, 89, 198103 CrossRef CAS PubMed.
- I. Vlassiouk and Z. S. Siwy, Nano Lett., 2007, 7, 552–556 CrossRef CAS PubMed.
- J. C. Rasaiah, S. Garde and G. Hummer, Annu. Rev. Phys. Chem., 2008, 59, 713–740 CrossRef CAS PubMed.
- M. Davenport, K. Healy, M. Pevarnik, N. Teslich, S. Cabrini, A. P. Morrison, Z. S. Siwy and S. E. Létant, ACS Nano, 2012, 6, 8366–8380 CrossRef CAS PubMed.
- W. Li, N. A. Bell, S. Hernández-Ainsa, V. V. Thacker, A. M. Thackray, R. Bujdoso and U. F. Keyser, ACS Nano, 2013, 7, 4129–4134 CrossRef CAS PubMed.
- Y. Yan, Q. Sheng, C. Wang, J. Xue and H.-C. Chang, J. Phys. Chem. C, 2013, 117, 8050–8061 CrossRef CAS.
- N. Fortin and H.-A. Klok, ACS Appl. Mater. Interfaces, 2015, 7, 4631–4640 CrossRef CAS PubMed.
- P. Dunne, T. Adachi, A. A. Dev, A. Sorrenti, L. Giacchetti, A. Bonnin, C. Bourdon, P. H. Mangin, J. Coey and B. Doudin,
et al.
, Nature, 2020, 581, 58–62 CrossRef CAS PubMed.
- R. Karnik, C. Duan, K. Castelino, H. Daiguji and A. Majumdar, Nano Lett., 2007, 7, 547–551 CrossRef CAS PubMed.
- R. Spohr, N. Reber, A. Wolf, G. M. Alder, V. Ang, C. L. Bashford, C. A. Pasternak, H. Omichi and M. Yoshida, J. Controlled Release, 1998, 50, 1–11 CrossRef PubMed.
- I. S. Lokuge and P. W. Bohn, Langmuir, 2005, 21, 1979–1985 CrossRef CAS PubMed.
- J. P. Chávez, A. Voigt, J. Schreiter, U. Marschner, S. Siegmund and A. Richter, Appl. Math. Modell., 2016, 40, 9719–9738 CrossRef.
- S. P. Adiga and D. W. Brenner, J. Funct. Biomater., 2012, 3, 239–256 CrossRef CAS PubMed.
- D. R. Link, E. Grasland-Mongrain, A. Duri, F. Sarrazin, Z. Cheng, G. Cristobal, M. Marquez and D. A. Weitz, Angew. Chem., Int. Ed., 2006, 45, 2556–2560 CrossRef CAS PubMed.
- A. M. Klein, L. Mazutis, I. Akartuna, N. Tallapragada, A. Veres, V. Li, L. Peshkin, D. A. Weitz and M. W. Kirschner, Cell, 2015, 161, 1187–1201 CrossRef CAS PubMed.
- C.-W. Li, H. Merlitz, C.-X. Wu and J.-U. Sommer, Macromolecules, 2018, 51, 6238–6247 CrossRef CAS.
- B. Yameen, M. Ali, R. Neumann, W. Ensinger, W. Knoll and O. Azzaroni, J. Am. Chem. Soc., 2009, 131, 2070–2071 CrossRef CAS PubMed.
- S. F. Buchsbaum, G. Nguyen, S. Howorka and Z. S. Siwy, J. Am. Chem. Soc., 2014, 136, 9902–9905 CrossRef CAS PubMed.
- C. Yu, S. Mutlu, P. Selvaganapathy, C. H. Mastrangelo, F. Svec and J. M. Fréchet, Anal. Chem., 2003, 75, 1958–1961 CrossRef CAS PubMed.
- I. Lokuge, X. Wang and P. W. Bohn, Langmuir, 2007, 23, 305–311 CrossRef CAS PubMed.
- K. Speyer and C. Pastorino, Soft Matter, 2019, 15, 937–946 RSC.
- Y. S. Park, Y. Ito and Y. Imanishi, Macromolecules, 1998, 31, 2606–2610 CrossRef CAS.
- G. Emilsson, Y. Sakiyama, B. Malekian, K. Xiong, Z. Adali-Kaya, R. Y. Lim and A. B. Dahlin, ACS Cent. Sci., 2018, 4, 1007–1014 CrossRef CAS PubMed.
- J.-U. Sommer, Macromolecules, 2017, 50, 2219–2228 CrossRef CAS.
- H. Yong, E. Bittrich, P. Uhlmann, A. Fery and J.-U. Sommer, Macromolecules, 2019, 52, 6285–6293 CrossRef CAS.
- C.-W. Li, H. Merlitz and J.-U. Sommer, Macromolecules, 2020, 53, 6711–6719 CrossRef CAS.
- F. Tessier and G. W. Slater, Macromolecules, 2006, 39, 1250–1260 CrossRef CAS.
- Q. Cao, C. Zuo, L. Li, Y. Li and Y. Yang, Biomicrofluidics, 2012, 6, 034101 CrossRef PubMed.
- J. Huang, Y. Wang and M. Laradji, Macromolecules, 2006, 39, 5546–5554 CrossRef CAS.
- C. Pastorino and M. Müller, J. Phys. Chem. B, 2021, 125, 442–449 CrossRef CAS PubMed.
- S. Plimpton, J. Comput. Phys., 1995, 117, 1 CrossRef CAS.
- K. Kremer and G. Grest, J. Chem. Phys., 1990, 92, 5057 CrossRef CAS.
- J. Weeks, D. Chandler and H. Anderson, J. Chem. Phys., 1971, 54, 5237 CrossRef CAS.
- S. Baker, G. Smith, D. Anastassopoulos, C. Toprakcioglu, A. Vradis and D. Bucknall, Macromolecules, 2000, 33, 1120–1122 CrossRef CAS.
- R. Ivkov, P. Butler, S. Satija and L. Fetters, Langmuir, 2001, 17, 2999–3005 CrossRef CAS.
- D. Anastassopoulos, N. Spiliopoulos, A. Vradis, C. Toprakcioglu, S. Baker and A. Menelle, Macromolecules, 2006, 39, 8901–8904 CrossRef CAS.
- H. Yong, B. Molcrette, M. Sperling, F. Montel and J.-U. Sommer, Macromolecules, 2021, 54, 4432–4442 CrossRef CAS.
- H. E. Van den Akker, Curr. Opin. Chem. Eng., 2018, 21, 67–75 CrossRef.
-
G. Gompper, T. Ihle, D. Kroll and R. Winkler, Advanced computer simulation approaches for soft matter sciences III, 2009, pp. 1–87 Search PubMed.
- M. P. Howard, A. Nikoubashman and J. C. Palmer, Curr. Opin. Chem. Eng., 2019, 23, 34–43 CrossRef.
|
| This journal is © The Royal Society of Chemistry 2022 |
Click here to see how this site uses Cookies. View our privacy policy here. 
 Open Access Article
 This Open Access Article is licensed under a Creative Commons Attribution-Non Commercial 3.0 Unported Licence
 *a,
Holger
Merlitz
*a,
Holger
Merlitz

 . Otherwise, truncation occurs at a distance of rc = 2.5d between monomers and rc = 2.5dNP between NPs. The NPs are given a weak attraction of ε = 0.5kBT (as well as between monomers), providing a slight adhesive force, which however is insufficient to lead to a spontaneous droplet formation or to grant stability of the droplet after it has passed through the brush phase.
 . Then the units of other parameters are deduced, such as force [f] = kBT/d, velocity
 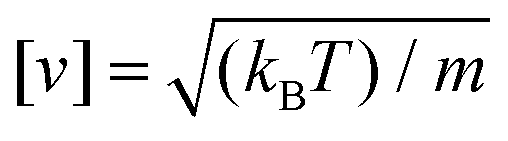 , viscosity and friction coefficient
  (whose value regarding the monomer is set as ξ = 1 in simulations).