 Open Access Article
Magnetization of magnetoactive elastomers under the assumption of breakable adhesion at the particle/matrix interface
Mikhail V.
Vaganov
 *a,
Dmitry Yu.
Borin
 b,
Stefan
Odenbach
b and
Yuriy L.
Raikher
 cd
cd
aClarendon Laboratory, Department of Physics, University of Oxford, Oxford OX1 3PU, UK. E-mail: mikhail.vaganov@physics.ox.ac.uk
bChair of Magnetofluiddynamics, Measuring and Automation Technology, Institute of Mechatronic Engineering, TU Dresden, Dresden 01069, Germany
cInstitute of Continuous Media Mechanics, Russian Academy of Sciences, Ural Branch, Perm, 614018, Russia
dInstitute of Natural Science and Mathematics, Ural Federal University, Ekaterinburg, 620081, Russia
First published on 13th June 2022
Abstract
In this work we study the magnetization of magnetoactive elastomers (MAE) in which the interface between the matrix and magnetic particles is unstable and allows for slipping of the particles against the wall of their elastomer cavities. The estimate of the maximal angle at which each particle can decline its axis from the initial position is made based on cyclic measurement of several consecutive hysteresis loops at different maximal magnetic fields. A model of magnetization of magnetically hard multigrain particles in an elastic environment with allowance for their possible slipping is proposed. Results of modelling is in fair agreement with the experimental data obtained on MAEs whose polymeric matrix is made of polydimethylsiloxane and the magnetic filler is NdFeB spherical particles.
1 Introduction
Magnetoactive elastomers (MAEs) are materials produced by embedding fine magnetic particles into a non-magnetic polymeric matrix. A specific feature of a compliant matrix is that it allows for the rearrangement of the particles under the influence of an applied magnetic field. Therefore, the magnetization process of MAEs, depending on the intrinsic magnetic properties of the particles, is considerably affected by the elastic properties of the matrix as well.1–4In general, the particles used in MAEs can be divided into two generic groups: magnetically soft (MS) and magnetically hard (MH) ones.5,6 For the MAEs of the MS type, the essential factor modifying their magnetic response to an applied field is the translational displacements of the particles induced by their mutual magnetostatic interactions.7–9 For the MAEs of the MH type (MH-MAE), unless the matrix is extremely soft, the magnetization is affected mostly by the on-site rotations of individual particles striving to align their magnetic moments with the field; the role of interparticle interaction is minor.10–12
Taking into account an ample variety of known magnetic materials and vast complexity of their structures, it is hardly possible to universally account for the magnetization processes of all the types of MAEs in terms of a single physical model. Because of that, here we focus on the MAEs with MH filler, namely, the particles of the NdFeB family, which are widely used in engineering and material science.13
From the practical viewpoint – to ensure the magnetic control of the overall behaviour of the composite – a perfect MH-MAE should display maximal magnetomechanical response, meaning that the field-induced particle displacements, both translational and rotational, should be conveyed to the matrix in full. For that, a strong surface adhesion at the particle/matrix interface is desirable, so that this contact would neither break nor degrade during magnetization process. In the literature, several attempts to understand the magnetomechanical behaviour of MH-MAEs have been made and several theoretical models have been proposed based on the strong-adhesion assumption.14–18
In reality though, the achievement of strong adhesion looks rather doubtful, in the first place, because in a typical situation no chemical links between the two constituent phases of a MAE are expected. Indeed, considering a generic MAE that is a silicone rubber matrix filled with metal particles, it comes out that at the particle/matrix interface neither covalent nor hydrogen bonds might form. The only conceivable adhesion mechanism should be ascribed to dispersion forces (van der Waals interaction), and this coupling is not strong.
One may justly infer that under a weak adhesion, the MH particles in an MAE subject to an external field would keep a tight contact with the matrix only until the field strength exceeds some threshold. Then the scheme of the magnetization process looks as follows. Demagnetizing effects apart, an applied field H0 exerts on the particle magnetic moment μp a torque that strives to align μp with H0. Via the internal magnetic anisotropy (in MH particles it is remarkably high), this torque is transferred to the particle body forcing it to rotate. At the initial stage (low fields) where the adhesion holds, the particle rotation is impeded by the resistance on the part of the deformed matrix. When the field strength enhances, and the magnetic torque increases above the critical value, the adhesion breaks down, and the particle starts to rotate independently as itself. This field-induced motion is not entirely free, however, as it takes place inside the elastic cavity where the particle is located; this cavity can be deformed to some extent but can hardly be destroyed. Under these conditions, a rotating particle inevitably experiences the resistance torques induced because the microrough surface of the particle has to slip along and rub against the cavity walls. Additionally, in case the polymerization of the elastomer is inhomogeneous, at the cavity wall there can also be present ‘stains’ of the polymer remained in its liquid state. Thus, in addition to the dry (kinetic) contribution, the interfacial friction may well possess a viscous component.
Visualizing the described phenomena is not a trivial task. Optical and electron microscopes provide images of surface layers and do not allow to observe field-induced changes in the sample volume in situ. Computed microtomography10 has the potential to solve the issue of the bulk sample investigation. However, three-dimensional tomography requires rotation of the specimen or rotation of the radiation source around the specimen, so this method in its conventional realization is more suitable for the study of specimen microstructure in the static state without sweeping the field. Here we employ an indirect investigation of the particle mobility based on the analysis of the magnetization curves of MAE bulk samples.
In ref. 19 an attempt has been made to elucidate and describe the hysteretic magnetization curves of the above-described type of MH-MAEs. The model was strongly simplified: the complex magnetic architecture of the NdFeB micron-size particles used in real MH-MAEs was ignored, and the particles were assumed to be single-domain grains. Despite its obvious limitations, the developed model was able to account for some basic features of the experimental hysteresis loops obtained on the MAEs with shear moduli below 100 kPa. Hereby, in order to advance the insight into the magnetomechanics of MH-MAEs, we, first, present the experimental data evidencing the occurrence of the internal particle slippage and, then, extend our former model for the case of the microparticles each of which is a ‘clot’ made of many MH nanograins.
2 Magnetization properties of MH-MAEs. Experimental evidence
2.1 MQP-S-11-9 powder. Particle structure and magnetic response
We focus on a specific sort of magnetic powder of NdFeB origin. Namely, the commercially available powder MQP-S-11-9-20001 (Magnequench Int.)20 with nearly spherical particles shown in Fig. 1; in the remainder, we refer to them as MQP-S. The powder is produced by a variant of the rapid solidification technique when droplets of a melted Nd–Pr–Fe–Co–Ti–Zr–B alloy obtain spherical shape due to surface tension while being rapidly cooled during free fall in Ar or He gas. According to laser diffraction analysis,20 the median diameter of the spheres ranges from 35–55 μm, and less than 3 wt% of them are larger than 104.7 μm.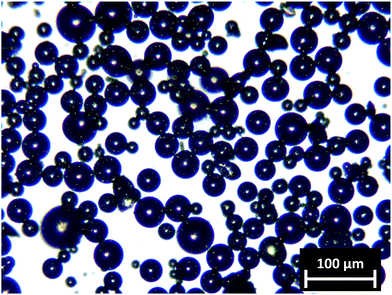 | ||
| Fig. 1 Particles of the MQP-S-9-11-20001 powder. Reproduced from ref. 14 with permission from the Royal Society of Chemistry. | ||
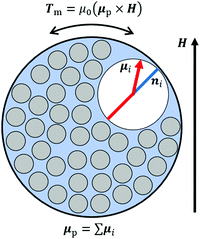
The results of transmission electron microscopy of similar NdFeB systems suggest that the particles we use have a composite structure and contain numerous round-shaped nanograins of intermetallide Nd2Fe14B, see the scheme in Fig. 2. The grains are interlaid with the streaks of a Nd-rich phase that suppresses their exchange interaction.21 The grain radii range from 20 to 400 nm that is below or, at the most, about the critical size of the absolute monodomainness that for Nd2Fe14B is estimated as 150–300 nm.13,22,23 Nanocrystallites of Nd2Fe14B possess tetragonal structure and, consequently, strong uniaxial magnetic anisotropy with energy density K = 4.9 MJ m−3,5 which imparts to them a high coercivity. The saturation magnetization Ms of those grains is about 1.28 MA m−1.5
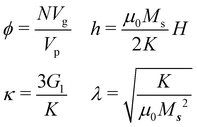
The non-dimensional magnetic hardness parameter  of Nd2Fe14B is about 1.5 that implies that, with respect to magnetization process, the anisotropy energy of individual grains is far more significant than the magnetostatic interaction between them;5,24 here μ0 is the magnetic constant. Although the directly estimated anisotropy field is Ha = 2K/μ0Ms ∼ 6.1 MA m−1, the manufacturer specification on the MQP-S powder20 reports its intrinsic coercivity as being about 570–750 kA m−1, i.e., significantly lower than Ha. Such a drastic discrepancy between the expected and actual values is known in the literature as the Brown's paradox and is conventionally explained by the presence of impurities, crystallite twinning, and other defects.13,25
The anisotropy axes of the grains comprising an MQP-S microparticle are oriented at random. The particular orientation of each axis can be represented by a unit vector ni denoting any of the two possible axis directions, where the subscript i distinguishes a particular grain. When an MQP-S microparticle is subject to a magnetic field H (usually assumed to be directed along the vertical z-axis), the i-th grain experiences magnetic field Hi,loc equal to the sum of the macroscopic field H and field Hi,dd produced by all the other grains of the same microparticle. Under the action of Hi,loc, the grain magnetic moment μi declines from the anisotropy axis towards the field vector and drags the grain after itself. As a result, the whole microparticle comprised of Ng grains experiences a torque
| Tm = μ0(μp × H), | (1) |
 is the net magnetic moment of the microparticle.
At a high enough Hi,loc, μi can jump between the two directions of its anisotropy axis, hence the magnetic hysteresis. According to the Stoner–Wohlfarth model,26 the smaller the angle between the easy axis and the field Hi,loc, the greater the coercivity of the grain. In MAEs, a microparticle is prone to rotate under the action of Tm, thus changing the orientation of its grain anisotropy axes. The level of the particle rotational mobility depends on the elastic moduli of the surrounding matrix and on the quality of adhesion between the matrix and particle surface, consequently, the coercivity values of the microparticle and of an MAE sample as a whole also depend on those parameters.
2.2 Magnetization measurements on MAE samples
The notation of the samples used in this work and their main parameters are listed in Table 1.| Sample |
D(E![[thin space (1/6-em)]](https://www.rsc.org/images/entities/char_2009.gif) : :![[thin space (1/6-em)]](https://www.rsc.org/images/entities/char_2009.gif) O) O) |
G 1 [kPa] | [kA m−1] | M 0(maxH0) [kA m−1] | γ* [°] | H hw19 [kA m−1] | mod1 H hw19 [kA m−1] | mod2 H 19 [kA m−1] |
|---|---|---|---|---|---|---|---|---|
| s1 | 1![[thin space (1/6-em)]](https://www.rsc.org/images/entities/char_2009.gif) : :![[thin space (1/6-em)]](https://www.rsc.org/images/entities/char_2009.gif) 0 0 |
420 ± 5 | N/A | N/A | N/A | 720 ± 10 | N/A | N/A |
| s2 | 1![[thin space (1/6-em)]](https://www.rsc.org/images/entities/char_2009.gif) : :![[thin space (1/6-em)]](https://www.rsc.org/images/entities/char_2009.gif) 0.17 0.17 |
250 ± 5 | N/A | N/A | N/A | 680 ± 10 | N/A | N/A |
| s3 | 1![[thin space (1/6-em)]](https://www.rsc.org/images/entities/char_2009.gif) : :![[thin space (1/6-em)]](https://www.rsc.org/images/entities/char_2009.gif) 0.20 0.20 |
160 ± 5 | 15 ± 1 | 43 ± 4 | 11 ± 1 | 532 ± 16 | 374 | 485 |
| s4 | 1![[thin space (1/6-em)]](https://www.rsc.org/images/entities/char_2009.gif) : :![[thin space (1/6-em)]](https://www.rsc.org/images/entities/char_2009.gif) 0.22 0.22 |
130 ± 5 | 15 ± 2 | 43 ± 4 | 8 ± 1.5 | 320 ± 30 | 332 | 464 |
| s5 | 1![[thin space (1/6-em)]](https://www.rsc.org/images/entities/char_2009.gif) : :![[thin space (1/6-em)]](https://www.rsc.org/images/entities/char_2009.gif) 0.25 0.25 |
110 ± 5 | 14 ± 2 | 41 ± 4 | 9 ± 2 | 296 ± 22 | 318 | 442 |
| s6 | 1![[thin space (1/6-em)]](https://www.rsc.org/images/entities/char_2009.gif) : :![[thin space (1/6-em)]](https://www.rsc.org/images/entities/char_2009.gif) 0.5 0.5 |
40 ± 5 | 28 ± 3 | 52 ± 4 | 18 ± 4 | 130 ± 20 | 183 | 220 |
| s7 | 1![[thin space (1/6-em)]](https://www.rsc.org/images/entities/char_2009.gif) : :![[thin space (1/6-em)]](https://www.rsc.org/images/entities/char_2009.gif) 1.0 1.0 |
7 ± 1 | 24 ± 2 | 48 ± 4 | 29 ± 7 | 40 ± 6 | 53 | 14 |
The elastomer matrices of the MAEs studied in this work are of polydimethylsiloxane (PDMS) origin. When producing a composite, MQP-S particles treated with a siloxane liquid27 are stirred into Elastosil RT623 (Wacker Chemie AG, Germany) at concentration ϕp about 5 vol%. The desired value of the elastic modulus of the final product is adjusted by diluting initial Elastosil components with silicon oil M1000 Baysilone (Bayer AG) that is a liquid form of PDMS at mass ratio D(E![[thin space (1/6-em)]](https://www.rsc.org/images/entities/char_2009.gif) :
:![[thin space (1/6-em)]](https://www.rsc.org/images/entities/char_2009.gif) O), where E stands for Elastosil and O – for oil. The shear moduli of the non-filled matrices G1 were measured via a quasi-static torsion test on an Anton Paar MCR301 rheometer according to the procedure described in ref. 28. The magnetization measurements were conducted by means of a vibrating sample magnetometer Lake Shore 7407s. The samples for the magnetometry were prepared in the shape of disks with the height 1.10 ± 0.03 mm and diameter 4.65 ± 0.03 mm, and their mass was measured using Ohaus Explorer EX225D/AD semi micro balance. The applied field vector H0 was aligned with the disk symmetry axis. When required, the demagnetizing factor
O), where E stands for Elastosil and O – for oil. The shear moduli of the non-filled matrices G1 were measured via a quasi-static torsion test on an Anton Paar MCR301 rheometer according to the procedure described in ref. 28. The magnetization measurements were conducted by means of a vibrating sample magnetometer Lake Shore 7407s. The samples for the magnetometry were prepared in the shape of disks with the height 1.10 ± 0.03 mm and diameter 4.65 ± 0.03 mm, and their mass was measured using Ohaus Explorer EX225D/AD semi micro balance. The applied field vector H0 was aligned with the disk symmetry axis. When required, the demagnetizing factor ![[scr N, script letter N]](https://www.rsc.org/images/entities/char_e52d.gif) was obtained by approximating the sample shape with an oblate ellipsoid and the internal field acting on the microparticles inside a sample was calculated as H = H0 −
was obtained by approximating the sample shape with an oblate ellipsoid and the internal field acting on the microparticles inside a sample was calculated as H = H0 − ![[scr N, script letter N]](https://www.rsc.org/images/entities/char_e52d.gif) M0, where M0 stands for the sample magnetization.
M0, where M0 stands for the sample magnetization.
More details on the MAE preparation and measurement can be found in our earlier works.14,29,30
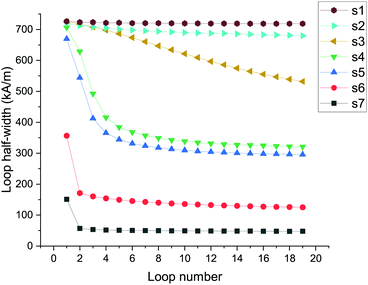
The MQP-S particle substance is an intermetallide, and it is incapable of producing chemical bonds when abutting on a PDMS surface. Therefore, the MAEs under study belong to the above-described type of the systems where adhesion is weak and is maintained just by the dispersion interaction. This implies that for such a multi-grain particle two regimes of responding to the magnetically induced torque Tm are possible. At low fields (weak Tm) the particle is stuck to the matrix and, if turning, entrains the latter keeping point-to-point contact with it. When the field becomes strong enough to break the dispersion coupling, the slipping regime inside a polymeric cavity takes over. Moreover, each next field-ramping cycle damages the bonds to a higher extent, so that the magnetization loops get narrower.
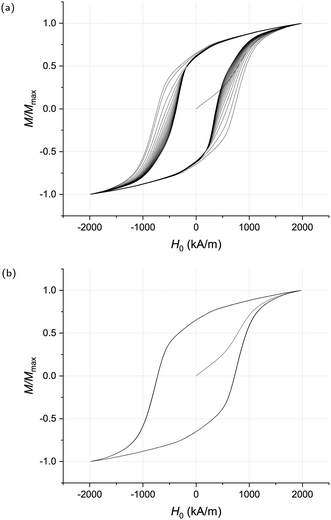
Fig. 3 demonstrates the difference between the magnetization curves of MAE sample s5, inside which the particles are prone to movement, and of a sample with epoxy matrix, where particles are immobilized. Both curves were obtained via applying 20 field cycles and each, therefore, is comprised of the initial curve and 19 full hysteresis loops. Note that the consecutive loops of the epoxy sample (G1 ∼ 1 GPa) do not notably differ from each other. This explicitly confirms the conclusion that the observed low values of coercivity of MH-MAEs with soft matrices (G1 < 500 kPa) are caused by the particle rotational mobility.10,14,29,31
The loops in Fig. 3a are only approximately symmetrical, because of that for each loop we evaluate separately the negative (left) Hc− and positive (right) Hc+ coercivities, i.e., the values of the field at the points where the magnetization curve crosses the abscissa axis. A more instructive characteristic, however, is the half-width of a loop defined as Hhw = (Hc+ − Hc−)/2. The evolution of the half-widths with the number of accomplished magnetization cycles is shown in Fig. 4 for the MAEs with various shear moduli.
From Fig. 3a and 4 it is seen that, beginning from a certain cycle, both the loop shapes and half-widths do not change any longer, i.e., the samples become ‘trained’. The number of the field cycles required to attain training grows with the elastic modulus of the matrix. Samples s1 and s2 possessing the highest shear moduli obey this rule but one has to measure significantly more than 19 loops and at higher fields to make them visibly trained, that is why it seems as if they achieved the trained state after first few cycles (see also Section 2.3). There are three most plausible reasons for the training effect: (i) undermagnetization of MQP-S particles, i.e., the effect entailed by the fact that maximal applied field is lower than the one required to fully saturate the nanograins; (ii) spatial and orientational structuring of the particles, and (iii) deterioration of the particle/matrix adhesion. It is quite likely that all these three phenomena contribute to the magnetization process of the MAEs studied in this work.
The effect of the undermagnetization of the particles in an elastic environment was discussed in ref. 32 and is usually more pronounced when the magnitude of the field during magnetization cycles does not exceed 1 MA m−1.
The emergence of structures (chains, clots, nets, etc.) is a known phenomenon in mechanically soft MAEs, and it may take place even in the samples with relatively low concentration of the filler. To estimate the tendency to structuring, we treat the PDMS matrix as a linearly elastic incompressible infinite continuum; then for elastic energy increment due to translation of a spherical particle with infinitely strong adhesion one gets
| Uet = 3πG1Rpu2; | (2) |
 | (3) |
![[r with combining circumflex]](https://www.rsc.org/images/entities/b_i_char_0072_0302.gif) 12 is the unit vector along that line, e1 and e2 are the unit vectors of the respective magnetic moments. Let the microparticle be magnetized to saturation, so that μp = 4πRp3Ms/3. Then the maximal coupling energy, that for the pair in the head-to-tail formation at a distance r12 = d, is
12 is the unit vector along that line, e1 and e2 are the unit vectors of the respective magnetic moments. Let the microparticle be magnetized to saturation, so that μp = 4πRp3Ms/3. Then the maximal coupling energy, that for the pair in the head-to-tail formation at a distance r12 = d, is | (4) |
In a MAE, emergence of the particle structures (aggregates) is conceivable if the energy cost of the matrix deformation by the particle translations is lower than the energy of interparticle attraction, i.e., Uet < |maxUdd|. Setting u = r12 and identifying both with the mean interparticle distance  defined from the particle volume content ϕp, from comparison of (1) and (4) one finds that at a given ϕp aggregation might occur only in a sufficiently soft matrix:
 | (5) |
2.3 Evidence of the training effect
Fig. 3a shows just one example of the set of measurements carried out on all the samples listed in Table 1. In each measurement, an as-prepared sample was subject to the initial magnetization followed by 19 consecutive quasistatic cycles during which the field was swept within a fixed interval [−maxH0, maxH0].Such measurements of 19 loops were conducted for each of the samples at several different values of maxH0 varied from 400 kA m−1 to 2 MA m−1.
The accumulated data enables one to estimate the critical field  at which the particle/matrix adhesion breaks. To do that, for each measurement, parameter A192 that is the difference between the areas of the 2nd and 19th loops normalized by their arithmetic mean, was calculated; this indicator is zero if the loop area does not change, and tends to two if the area of the final loop goes to zero. An example of the A219 dependence on maxH0 for the sample s5 (G = 110 kPa) is given in Fig. 5.
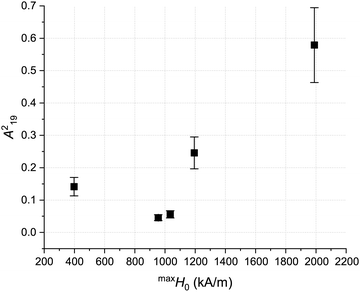 | ||
| Fig. 5 Normalized difference between the 2nd and 19th loop areas for the sample s5 (G1 = 110 kPa) vs. maximal applied field maxH0. | ||
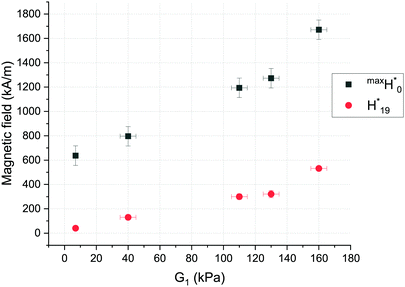
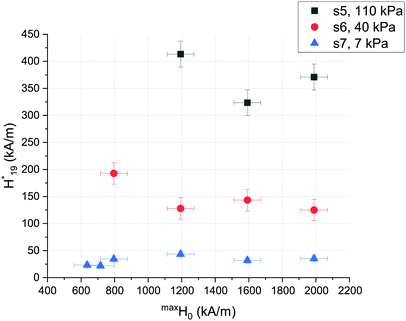
As seen, while maxH0 is less or equal than 1000 kA m−1, A219 is dropping down with maxH0 because of the gradually diminishing effect of the undermagnetization, which is less pronounced when a higher maximal field is applied. At maxH0 > 1050 kA m−1, the difference between the loop areas surges because the mechanical training effect starts influencing the magnetization process: the application of such fields is able to deform the matrix in the vicinity of the magnetized particles by declining them from their initial orientation at such a degree that the matrix unsticks from them and the adhesion at the particle/matrix interface breaks down making the particles rotate freely or slip against the adjacent matrix. The value of maxH0, at which such adhesion breakage starts being observable by a surge in the A219vs.maxH0 graph, depends on the shear modulus G1 of MAE's matrix. These values of maxH0 are exactly the field values  we were looking for and they are presented in Fig. 6. The training phenomenon due to the adhesion breakage is not observable when the maximal field applied during the hysteresis measurements is less than
  . Additionally, since the maximal field generated by our magnetometer in the configuration for this work was only slightly higher than 2 MA m−1, we were not able to observe any significant training of our stiffest samples s1 and s2 which would be defined by the surge in A219 at higher fields.
For all the tested samples (apart from s1 and s2), the loops beginning at most from the 19th one cease to change. Such behaviour becomes understandable if to assume that any MAE sample contains a vast number of particles with a distribution of adhesion strengths, i.e., each particle undergoes its own local training. Assuming that the slipping process goes fast, the magnetization of a trained sample must increase abruptly when most of the particles slip in their elastomer cavities. Consequently, the critical value  of a trained sample can be identified with half-width Hhw19 of the 19th loop; those values are plotted as the lower curve in Fig. 6. Notably, the coercivities Hhw19 (and as a result
  ) of the samples with the same G1 but trained at different
  are very close to each other, see Fig. 7). This implies that under multi-cycle field treatment a given sample attains a unique well-defined ‘trained’ state whatever the field amplitude provided it exceeds a certain level.
3 Qualitative basis of the model
In this section we discuss the behaviour of a single MH multi-grain particle, prone to slipping, under a sequence of magnetization cycles.3.1 Estimation of the breakdown condition
An applied field perturbs the state of a MQP-S particle embedded in an elastic environment and makes it rotate. Schematically, in this situation the adhesion plays the role of a static friction against a compliant substrate. As long as the adhesion sustains, the torque Tm exerted on the particle magnetic moment and, via the magnetic anisotropy, applied to the particle body, is fully transmitted to the elastic matrix. The latter deforms, and generates internal stresses which take the form of the resistance torque Te that counteracts Tm. Therefore, under a quasistatically changing field, the angle displacements of the particle and the polymer cavity wall – denoted, respectively, as ψ and γ – coincide and are defined by the balance condition Tm = Te.Assuming for estimations that the polymer is an infinite linearly elastic continuum, the expression for the elastic torque Te follows from differentiating the torsional increment of elastic energy Uer due to the particle rotation:
| Uer = 4πG1Rp3γ2 = 3G1Vpγ2; | (6) |
| Te = 6G1Vpγ; | (7) |
With allowance for (1) and (7), from the balance condition  , for the breakdown angle one gets
 | (8) |
 depends on the history of the particle magnetization.
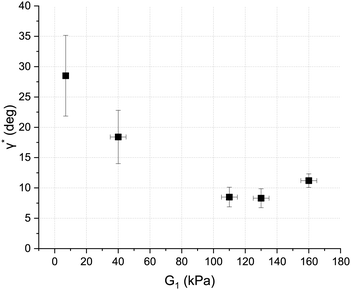
From eqn (8) it is clear that parameter H* is directly related to the adhesion energy density at the particle/matrix interface. In our experiments we cannot measure the latter explicitly but, as it has been shown, one may set H* = Hhw19, thus identifying it with the field under which most of the particles go to the slipping mode. The particle magnetization M* is approximated using the (scaled with ϕp) value of the sample magnetization  at the ‘corner’ of the loop, that is where d2M0/dH02 is minimal on the descending branch and maximal on the ascending one. Meanwhile, the ratio
  , i.e., the normalized projection of the magnetization on the field axis yields the estimate for cos
![[thin space (1/6-em)]](https://www.rsc.org/images/entities/char_2009.gif) φ*.
φ*.
Upon substitution of the experimentally accessible parameters, (8) takes the form
 | (9) |
3.2 Magnetization process of an isolated MQP-S particle
Fig. 9 shows schematically the results of a typical measurement – the initial curve and a pair of first hysteresis loops – on an MAE with a soft matrix and MH filler. Two specific features are noteworthy. First, there is a significant shape and width differences between the sequential loops, in particular, a drastic decrease in coercivity. Second, the considered magnetization process is essentially magnetomechanical. Indeed, the low values of coercivity point out that the hysteresis has its origin in a irreversible process of overcoming a mechanical energy barrier rather than a magnetic one.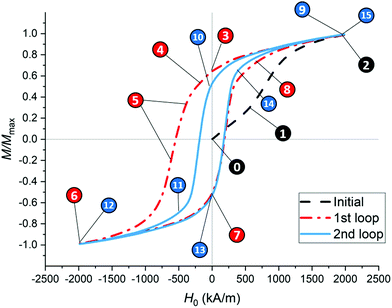 | ||
| Fig. 9 Initial magnetization curve and two first consecutive hysteresis loops of the MAE sample s6 with G1 = 40 kPa; encircled numbers mark the stages of the process. | ||
Our goal is to demonstrate that, despite the fact that only the experimental joint (macroscopic) magnetic response of the whole assembly of embedded magnetic particles is available, a model accounting for the internal processes inside a single multi-grain particle is useful for understanding the essential physics of the PDMS/MQP-S and alike systems.
At stage 0 of Fig. 9, the field is zero, the magnetic moments {μi} of the nanograins comprising the particle are spread at random, so that μp is virtual zero. When some field H0 is applied (stage 1), vectors {μi} deviate from their initial orientations towards the direction of the internal field H. The components of {μi} normal to H effectively cancel each other, so that only components parallel to the field contribute to the microparticle moment μp‖H. At this step, the particle does not significantly change its orientation.
At certain fields during the initial magnetization, those grain magnetic moments, which at the beginning of the experiment were oriented along the anisotropy axes directions producing obtuse angles with H, switch to the more preferable directions that make acute angles with that vector. This happens up until the applied field reaches its maximal value maxH0 (stage 2). From that point, the measurement of the first hysteresis loop begins.
When the field is reduced to zero (stage 3), the set {μi} acquires the configuration different from that of stage 0: those of {μi} which had switched, now point along the directions of their easy magnetization axes which make acute angles with the previously applied field. As a result, the microparticle acquires a non-zero remanent magnetic moment μ(rem)p. Due to the randomness of the easy-axes distribution, μrem)p is not exactly parallel to the direction of the field that created it.
When the magnetic field is applied in negative direction (stage 4), the microparticle starts rotating under the action of a non zero torque Tm, and thanks to the adhesion at the particle–matrix interface, carries the surrounding matrix along with itself. The elastic forces produced in the deformed matrix manifest themselves in the elastic torque Te striving to bring the matrix back to its initial state and impeding the free rotation of the microparticle by means of the adhesion. This regime of balanced torques lasts until the field strength grows to the level beyond which the adhesion cannot stand any longer: the point-to-point contact between the particle and the cavity wall breaks down and their relative motion begins. We do not have the exact information about all the complex micro- and nanoscale details of the slipping process, so, from here, a phenomenological approach is applied.
During stage 5, the torque balance is no longer valid: from now on the particle interacts with the matrix via a friction force composed of a kinetic and viscous parts. The kinetic friction (independent on the relative velocity) might stem from the nanoroughness of the particle surface that has to rub against the now constantly changing contact area. The viscous friction might be due to the traces of plasticiser (silicone oil) which works as a lubricant at the particle/polymer interface. At this stage, on the one hand, the dynamic friction regime facilitates the particle rotation aligning μp with H. On the other hand, a progressive approach of μp to the direction of H reduces the magnetic torque (at full parallelicity Tm = 0) so that at some moment Tm gets smaller than the torque due to the kinetic friction, which brings the relative particle/matrix motion to a halt, and makes the adhesion partially restore. The restoration of the adhesion can be thought as a replacement of the kinetic and viscous friction between two media moving relative to one another with a new static friction manifested in the particle stuck to the walls of its elastomer cavity again.
As a result, the system comes up to H0 = −maxH0 (stage 6) with the newly recovered adhesion, and a weak, but nonzero Tm balanced by a certain Te. When the field is varied from − maxH0 back to H0 = 0, the magnetic torque Tm drops; the particle is driven by the relaxing matrix that brings it to the state where Te = 0 as well. At that point (stage 7), the particle orientation does not coincide with the initial one because of the previously occurred slipping events of stage 5. As it was at stage 3, at stage 7 the remanence is determined by the orientation of the grain magnetic moments relaxed to the vicinity of their anisotropy axes. In this state, because of the microparticle slipping and nanograin switchings, some of {μi} make obtuse angles with negative direction of H, hence the difference between the remanence values at stages 3 and 7.
When the field is swept from 0 to maxH0 (the ascending branch of the first loop), the switchings of magnetic moments of the nanograins evolve on a complicated background of the elastically impeded rotation of the microparticle and its rapid slipping (stage 8). The quasilinear segment (from 8 to 9) of the magnetization curve should be associated with the elastic rotation of the microparticle and the steady and gradual alignment of the nanograin magnetic moments with the imposed field H while H0 → maxH0.
Both branches of the second loop are formed via a similar process like that governing the formation of the descending branch of the first loop. When the field changes from its extremal values to zero (passing either stages 9–10 or 12–13), the microparticle is rotated by the relaxing matrix under gradually diminishing Tm balanced by Te. Then the microparticle undergoes several intermittent slippings and concomitant nanograin switchings that are manifested as the magnetization jumps at stages 10–11 and 13–14. Both branches are finalized by the elastic rotation of the microparticle and steady alignment of the nanograin magnetic moments with the field vector H while the external field approaches ±maxH0 (stages 12 and 15).
In the context of the presented description, the reason of a considerable difference between the consecutive hysteresis loops in Fig. 3a is the gradual deterioration of the adhesion at the particle/matrix interface. The rate of such deterioration varies from particle to particle giving birth to the training effect.
3.3 Mathematical model
A mathematical model for the described magnetization process of an MQP-S particle must allow for the magnetic switching of separate Nd2Fe14B grains and for the mechanical movement of the microparticle body including both elastic rotation and slipping events. The elastic rotation takes place until the angle by which the particle twists the surrounding matrix exceeds γ*, see (8). The slipping process begins when the torque Tm breaks adhesion, the surface of the microparticle moves relative to the wall of its cavity and the static friction is replaced by a combination of the kinetic and viscous ones.In the remainder, the positions of the microparticle to which it comes after the field is switched off and the matrix has relaxed will be called the stationary orientations. The first stationary orientation is the initial position of the microparticle in its polymeric cavity; note that a particle might have different number of stationary orientations.
| μi = MsVgei, | (10) |
Because of the strong uniaxial magnetocrystalline anisotropy, each grain acquires anisotropy energy when its magnetic moment declines from the corresponding easy axis of magnetization:
| Ua,i = KVg(1 − (ei·ni)2), | (11) |
If a magnetic field H is imposed on the microparticle, its i-th grain is subject to local field Hi,loc, i.e., vector sum of H and Hi,dd, where the latter is the field generated by other grains of the same microparticle: under field H = Hq, where q is a unit vector, each grain acquires the Zeeman energy
| UZ,i = −μ0(μi·H) = −μ0MsVgH (ei·q), | (12) |
 | (13) |
 | (14) |
![[r with combining circumflex]](https://www.rsc.org/images/entities/b_i_char_0072_0302.gif) ij is its unit vector.
ij is its unit vector.
During rotation, the particle carries along the surrounding matrix, whose energy of deformation can be approximated by expression 6. Given that, the joint potential energy of the particle–matrix system which should be minimized is
 | (15) |
Normalizing it by factor 2KVg, one arrives at the non-dimensional expression
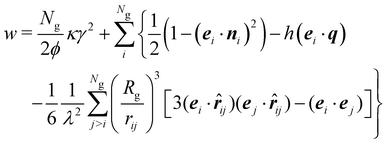 | (16) |
 | (17) |
Further on, the particle magnetization is presented as the projection of M on the axis of field H0 normalized by the saturation magnetization of the whole microparticle satM = NgMsVg/Vp:
 | (18) |
 due to the adhesion at the particle/matrix interface. To keep the model simple and robust we make the following two simplifications. First, it is assumed that the matrix always returns to its initial undeformed state at the end of any slipping event. If this assumption is violated, it will affect only those parts of a hysteresis branch that appear after the first and biggest jump in magnetization caused by the first slipping event, and it will not change the field where magnetization changes its sign. Second, the model particle continues to rotate, being driven by Tm as long as Tm > Tf, where Tf is the torque due to the kinetic and viscous friction whose magnitude we approximate with
  . Without these two assumptions, the motion of the particle–matrix system under Newton's second law in its rotational form was described for the case of a single domain particle in ref. 19.
When simulating the slipping process, the particle rotation is presented as a sequence of steps Δψ. At each step, the current orientation of the nanograin axes is determined by rotating the particle at Δψ, and the orientations of {μi} are found by minimization of their magnetic energy
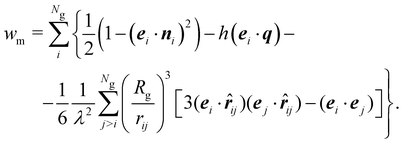 | (19) |
In its turn, the current orientation of the whole microparticle is defined by the orientation of the nanograin anisotropy axes and can be expressed in form of a single angle as
 | (20) |
The model is supposed to simulate the magnetization process of a trained MAE sample, therefore, the maximal possible value of  is approximated using eqn (7) and the values of γ* obtained from expression (8):
 | (21) |
Proceeding to a non-dimensional form, the torques are scaled by the same coefficient 2KVg that was used for the energy (19):
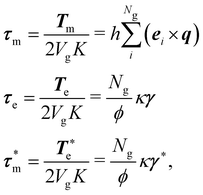 | (22) |
3.4 Simulation details
Algorithm 1 illustrates the sequence of the procedures necessary for acquiring dependence of the particle magnetization m on the magnetic field h. After a proper refactoring and optimization, the actual programming code might deviate from the presented algorithm.The size of the simulated microparticles is determined by the sphere circumscribing Ng closely packed spherical grains. Alternatively, the radii of the microparticle and its grains can be used as the input parameters so that Ng is calculated after performing the close-packing procedure. In both cases, the nanograin concentration ϕ, as Ng grows, tends to ≈0.74.
It is important to remember that angle γ denotes the deviation of the cavity wall from its initial position but does not represent the orientation of the microparticle in 3D space. It is only during the elastic rotation that the wall and the microparticle body move together. After the adhesion breaks down, the particle slips against the wall that returns to its initial state, so that both move independently. The orientation of the microparticle can be described by the set of vectors {ni}, whereas deformation of the matrix due to the particle rotation in 3D-space is determined by two angles α and β corresponding to the rotation about the roll and pitch aircraft principle axes of the microparticle: due to the symmetry, the particle and cavity wall are not expected to rotate about the field axis. At the beginning of simulation α = β = 0.
Algorithm 1: Simulation of magnetization process of a multigrain particle
Input: An array of the field values {h},
parameters κ and γ*,
number of grains Ng (or Rp and Rg),
Output: Array {m} of the same size as {h} containing the
magnetization values for corresponding elements
of the field array {h}
for j = 1 to length ({h}) do
Find μi, α, β and {ni} at hj by minimizing potential
energy (16);
Calculate and save mj;
else
Return the matrix to its initial state by setting γ = 0;
Rotate the particle in the direction of τm by
angle Δφ and correspondingly update the
orientation of all {ni};
Calculate the orientation of the grain magnetic
moments {μi} by minimizing expression 19;
Calculate new value of τm;
end
Update the current stationary state of the
microparticle expressed in current orientation of
{ni};
end
end
The time of the simulation directly depends (i) on the size of the field step Δh that determines the number of field values {hi} (points) at which the magnetization needs to be evaluated, and (ii) on the angular step Δψ of the microparticle slipping. As a rule of thumb, satisfactory results can be obtained with Δh = 0.01 and Δψ = 0.001.
4 Results and discussion
4.1 General modelling
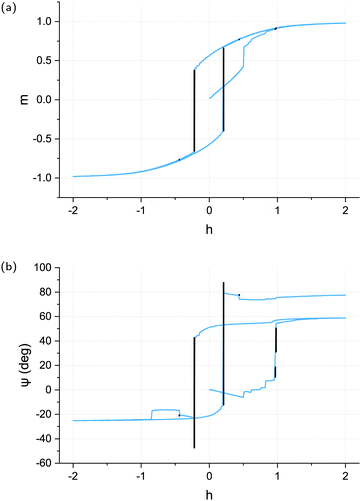
An example magnetization loop calculated for a model microparticle containing Ng = 115 randomly oriented Nd2Fe14B nanograins is presented in Fig. 10a. The blue curves and markers reflect the internal magnetization evolution in the assembly of nanograins inside an elastically turning particle, whereas the black lines correspond to the abrupt change in the magnetization due to the slipping. Evidently, in the considered system, the actual value of coercivity comes out as a combined effect of the nanograin magnetic moments switchings and the occurrence of slipping events. Therefore, the field value at which the particle magnetization changes sign depends on the set of the model parameters, namely {ni}, λ, κ and γ*. Note also that, even though the orientations of the grain anisotropy axes as well as the distribution of {μi} over the directions of {ni} are random, the initial net magnetic moment of the microparticle is, albeit small, but nonzero: . This points out that the inner structure of a microparticle might also affect the shape of the magnetization loop.
The dependence of the particle declination angle ψ on the field h is shown in Fig. 10b. It helps to elucidate the origin of the jumps in the particle magnetization. We note that from simulating the microparticles with unbreakable adhesion,14 it is known that switchings of the nanograin magnetic moments between directions of the corresponding anisotropy axes yield symmetrical M-shaped ψ(h) curves single-valued at h = 0. Indeed, in the absence of slipping, when the field turns to zero, a particle always returns to its initial orientation (ψ = 0°). The fact that the graph in Fig. 10b is double-valued at the origin indicates that the occurring ψ(h) hysteresis is not of a purely magnetic origin but contains a considerable contribution of the particle slipping.
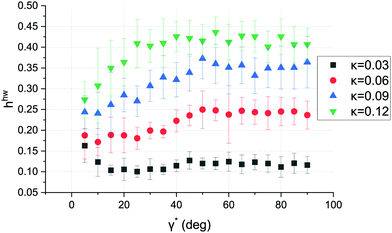
It is instructive to investigate the dependence of the particle coercivity on parameters κ and γ*, which represent mechanical properties of the polymeric matrix and the adhesion strength at the particle/matrix interface, respectively. Fig. 11 shows the dependence of the non-dimensional half-width of the microparticle magnetic loop on γ* for matrices with different elastic moduli. The data for each point of the graph were obtained by simulating the magnetization process of 20 microparticles with the same λ, κ and γ* but uniquely-generated orientational distribution of {ni}.
Similarly to the results obtained for single-domain particles,19 only small values (γ* < 20°) affect the half-width for every κ. In particular, at κ = 0.03 the half-width is larger at small γ* because such a soft matrix deforms easily, and the particle slips during the initial magnetization aligning its net magnetic moment with the field and putting itself in an orientation corresponding to the Stoner–Wohlfarth particle whose anisotropy axis is aligned with the field. At such an orientation, higher fields are required to invert the particle magnetization. In contrast, at κ = 0.12 the matrix is significantly more rigid, and the particle declines from its initial orientation at some γ < γ* during its initial magnetization without any slipping. This situation corresponds to the Stoner–Wohlfarth particle whose anisotropy axis makes an acute angle with the field. At the descending and ascending branches of the hysteresis loop, the angle deviation of such a microparticle can easily attain γ*, so that the slipping begins.
4.2 Comparison with the experiment
Every MAE sample consists of a vast number of microparticles, each of which is located in a somewhat different environment. Those differences are entailed by the inhomogeneous polymerization of the elastomer at micron scale and different amount of surplus silicon oil in the vicinity of each microparticle that was accumulated during the matrix elasticity tuning. In terms of the model described in Section 3.3, those differences are rendered in various local shear moduli of the matrix around a microparticle. To account for such spread of the mesoscopic parameters, we assume that macroscopic shear modulus G1 introduced in Section 2.2 is the maximal possible value of
  for a sample with a given matrix, and that the particles inside that sample are distributed uniformly over
  . Thus, the number of particles
  experiencing local shear modulus in the range from
  to
to  is given by
 | (23) |
 tends to zero, because while treating the silicon oil as an incompressible Newtonian liquid one can take its G1 = 0 kPa.
The magnetic properties of the microparticles are expected to vary only at nanoscale lengths so that different micron-sized particles can be assigned the same K and Ms measured on the epoxied powder or taken from the literature.
The magnetization process of the MAE samples whose parameters are presented in Table 1 has been simulated by calculating the magnetization of Np = 3600 particles containing Ng = 22 grains each. All the grains constituting a particle had K= 1.06 MJ m−3 and Ms = 1.28 MA m−1 that yields λ = 0.72, whereas the parameter  of the particle environment was assigned according to the distribution (23). The corresponding values of γ* were calculated using formula (9) and are shown in the same Table 1. In order to check the influence of slipping on the particle magnetization, we have run a simulation with the same set of particles but under the condition of prohibited slipping. The results of the both sets of simulation with respect to coercivity are presented in the last two columns of Table 1. It can be seen that for samples with G < 160 kPa, the model allowing for slipping provides much better agreement than the purely elastic one.
A more convincing confirmation of the importance of slipping for reproducing the magnetization of a real MAE is given in Fig. 12. There, the experimental 19th loop of sample s5 is compared to two modelled curves: one was obtained from the slipping model described in Section 3.3 whereas the other one was calculated in the framework of the purely elastic model discussed in ref. 14. It is seen that taking into account the slipping process allows one to obtain loops which quite closely resemble the experimental ones; the major cause is the slipping-aided abrupt changes in magnetization shown in black color in Fig. 10a.
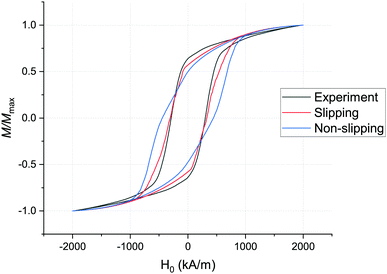 | ||
| Fig. 12 Comparison of the experimental 19th loop of sample s5 and the two modelled loops with and without slipping of the microparticles. | ||
5 Conclusions
The discrepancy between the experimental data on the magnetization of MAEs and the coercivity values calculated using the models based on the elastic declination of microparticles from their initial orientations alone compels one to rethink the situation at the interface between the matrix and microparticle surface. Here we have used mostly phenomenological approach that highlights the main features of the MAE magnetization process under assumption that the breakage of the adhesion at the particle/matrix interface is a highly likely event. It turns out that such a model complies well with that of a number of real systems consisting of a PDMS matrix and Nd2Fe14B microparticles. The hypothesis of breakable adhesion at the particle/matrix interface is supported by the fact that the PDMS matrix and particle intermetallic material cannot establish chemical bonds.Notwithstanding the fact that the here-presented discussion is based on just one type of MAE samples made of the particular matrix and magnetic powder, the results of this work are sufficiently general to be used for studying MAEs with other similar magnetic particles and matrices. The model itself is applicable to any other MAEs with spherical particles lacking adhesion to the walls of their enveloping cavities. The analysis of the experimental data proposed in Section 2.3 also does not imply any prior knowledge of the matrix and particle materials. Thus, the presented approach can be used for testing any techniques aimed at tuning the adhesion at the particle/matrix interface allowing one to see how they affect the slippage behavior.
Two such techniques, which do not involve generation of new chemical bonds, can be proposed. First, one can coat the metallic particles with the components of the polymer or with its liquid form before properly mixing the powder and elastomer. Second, one can use particles of irregular shapes which would prevent them from rotating inside their elastomer cavities easily. Further techniques might be provided by a separate meticulous physico-chemical study of the nature of the adhesion and/or friction at the particle/matrix interface.
A practical conclusion concerning any application of real MAEs is that due to the unstable nature of the adhesion, the magnetic properties of any such composites should be measured by driving them through several cycles of magnetic field. Otherwise, the properties of any devices possessing parts made of MAE will unpredictably change in time.
Conflicts of interest
There are no conflicts to declare.Acknowledgements
The research was accomplished with the financial support by RFBR project 19-52-12045 and DFG projects Bo 3343/3-1 and Od 18/24-1.Notes and references
- A. Yu. Zubarev, D. N. Chirikov, D. Y. Borin and G. V. Stepanov, Soft Matter, 2016, 12, 6473–6480 RSC.
- M. Krautz, D. Werner, M. Schrödner, A. Funk, A. Jantz, J. Popp, J. Eckert and A. Waske, J. Magn. Magn. Mater., 2017, 426, 60–63 CrossRef CAS.
- A. M. Biller, O. V. Stolbov and Yu. L. Raikher, Phys. Rev. E: Stat., Nonlinear, Soft Matter Phys., 2015, 92, 23202 CrossRef CAS.
- M. V. Vaganov and Yu. L. Raikher, J. Phys. D: Appl. Phys., 2020, 53, 405002 CrossRef CAS.
- J. M. D. Coey, Magnetism and Magnetic Materials, Cambridge University Press, 2010 Search PubMed.
- B. D. Cullity and C. D. Graham, Introduction to Magnetic Materials, Wiley, 2009 Search PubMed.
- G. V. Stepanov, D. Yu Borin, Yu. L. Raikher, P. V. Melenev and N. S. Perov, J. Phys.: Condens. Matter, 2008, 20, 204121 CrossRef CAS.
- T. Gundermann, P. Cremer, H. Löwen, A. M. Menzel and S. Odenbach, Smart Mater. Struct., 2017, 26, 45012 CrossRef.
- M. Puljiz, S. Huang, K. A. Kalina, J. Nowak, S. Odenbach, M. Kästner, G. K. Auernhammer and A. M. Menzel, Soft Matter, 2018, 14, 6809–6821 RSC.
- M. Schümann, D. Y. Borin, S. Huang, G. K. Auernhammer, R. Müller and S. Odenbach, Smart Mater. Struct., 2017, 26, 95018 CrossRef.
- M. Schümann and S. Odenbach, Phys. Sci. Rev., 2021, 20190105 Search PubMed.
- P. Cremer, H. Löwen and A. M. Menzel, Appl. Phys. Lett., 2015, 107, 171903 CrossRef.
- J. J. Croat, Rapidly Solidified Neodymium-Iron-Boron Permanent Magnets, Woodhead Publishing, 2018, pp. 65–122 Search PubMed.
- M. V. Vaganov, D. Yu Borin, S. Odenbach and Yu. L. Raikher, Soft Matter, 2019, 15, 4947–4960 RSC.
- M. V. Vaganov, D. Yu Borin, S. Odenbach and Yu. L. Raikher, J. Magn. Magn. Mater., 2018, 459, 92–97 CrossRef CAS.
- L. Roeder, P. Bender, A. Tschöpe, R. Birringer and A. M. Schmidt, J. Polym. Sci., Part B: Polym. Phys., 2012, 50, 1772–1781 CrossRef CAS.
- K. A. Kalina, J. Brummund, P. Metsch, M. Kästner, D. Y. Borin, J. M. Linke and S. Odenbach, Smart Mater. Struct., 2017, 26, 105019 CrossRef.
- M. Puljiz and A. M. Menzel, Phys. Rev. E, 2017, 95, 53002 CrossRef.
- M. V. Vaganov, D. Y. Borin, S. Odenbach and Y. L. Raikher, Adv. Theory Simul., 2021, 4, 2000327 CrossRef CAS.
- Neo Magnequench, MQP-S-11-9-20001-070 isotropic powder. Material description, 2022.
- R. K. Mishra, J. Magn. Magn. Mater., 1986, 54–57, 450–456 CrossRef CAS.
- J. J. Croat, J. F. Herbst, R. W. Lee and F. E. Pinkerton, J. Appl. Phys., 1984, 55, 2078–2082 CrossRef CAS.
- A. P. Guimarães, Principles of Nanomagnetism, Springer-Verlag, Berlin-Heidelberg, 2009, pp. 71–124 Search PubMed.
- G. Bertotti, Hysteresis in Magnetism: for Physicists, Materials Scientists, and Engineers, Academic Press, 1998 Search PubMed.
- W. F. Brown, Micromagnetics, J. Wiley, New York-London, 1963, p. 143 Search PubMed.
- E. C. Stoner and E. P. Wohlfarth, Philos. Trans. R. Soc. London, 1948, 240, 599–642 CrossRef.
- D. Y. Borin, G. V. Stepanov and E. Dohmen, Arch. Appl. Mech., 2019, 89, 105–117 CrossRef.
- D. Yu. Borin, N. Kolsch, G. V. Stepanov and S. Odenbach, Rheol. Acta, 2018, 57, 217–227 CrossRef.
- M. V. Vaganov, D. Yu Borin, S. Odenbach and Yu. L. Raikher, J. Magn. Magn. Mater., 2020, 499, 166249 CrossRef CAS.
- D. Y. Borin and M. V. Vaganov, J. Phys. D: Appl. Phys., 2022, 55, 155001 CrossRef.
- G. V. Stepanov, D. Yu Borin and P. A. Storozhenko, J. Magn. Magn. Mater., 2017, 431, 138–140 CrossRef CAS.
- M. V. Vaganov, D. Yu Borin, S. Odenbach and Yu. L. Raikher, Phys. B: Condens. Matter, 2020, 578, 411866 CrossRef CAS.
| This journal is © The Royal Society of Chemistry 2022 |

