 Open Access Article
Creative Commons Attribution 3.0 Unported Licence
Stability of the high-density Jagla liquid in 2D: sensitivity to parameterisation
Livia B.
Pártay
 *a and
György
Hantal
 b
b
aDepartment of Chemistry, University of Warwick, Coventry, CV4 7AL, UK. E-mail: Livia.Bartok-Partay@warwick.ac.uk
bInstitute of Physics and Materials Science, University of Natural Resources and Life Sciences, Peter-Jordan-Strasse 82, 1190 Vienna, Austria
First published on 27th June 2022
Abstract
We computed the pressure-temperature phase diagram of the hard-core two-scale ramp potential in two-dimensions, with the parameterisation originally suggested by Jagla [E. A. Jagla, Phys. Rev. E, 63, 061501 (2001)], as well as with a series of systematically modified variants of the model to reveal the sensitivity of the stability of phases. The nested sampling method was used to explore the potential energy landscape, allowing the identification of thermodynamically relevant phases, such as low- and high-density liquids and various crystalline forms, some of which have not been reported before. We also proposed a smooth version of the potential, which is differentiable beyond the hard-core. This potential reproduces the density anomaly, but forms a dodecahedral quasi-crystal structure at high pressure. Our results allow to hypothesise on the necessary modifications of the original model in order to improve the stability of the metastable high-density liquid phase in 3D.
I. Introduction
The development of simple isotropic interaction potentials are largely motivated by the desire to construct analytically and computationally tractable models of real materials, which retain qualitative features or key properties. The family of core-softened models among these potentials has attracted particular attention, as they can display unusually rich and varied behaviour: anomalous thermodynamical and structural features, polymorphism, liquid-liquid transitions, or allegedly multiple critical points.1Core-softened models are characterised by a harder repulsive core, and a softer region (often described by a ramp or shoulder), giving rise to two different characteristic lengths scales in the system: one at a shorter distance representing the core, and the other one at an intermediate distance corresponding to the penetrable softer shell. This gives the system the ability to form a variety of structures characterized by different competing interparticle distances and local arrangements. These characteristics can be achieved by a range of different potential functional forms: the hard sphere model with an added repulsive ramp,2,3 step,4 or well,5–7 the smooth and continuous version of these models,8–14 as well as more complex functions constructed via e.g. sums of Gaussians combined with the Lennard-Jones model.15–19 For an excellent review on the properties of core softened models, we recommend the work of Ryzhov et al.1
Within the family of core softened models, particular attention has been given to those that can potentially form distinct liquid phases of different densities.14,20 While this phenomenon is well known for systems with directional interaction potentials, such as water21 or patchy particles,22 this is less obvious in the absence of directionality, that is, when the particles interact through a purely isotropic potential. In such cases, this can be achieved by using specific functional forms: e.g. the collapsing hard-spheres23 or the double-step well potential,6 which can yet lead to qualitatively very different phase diagrams. Special attention has been given to potentials showing a critical point at the end of the liquid-liquid phase boundary, (the liquid-liquid critical point, or LLCP), as it has been speculated to be the source of the anomalous behaviour observed in some materials, such as in case of water or silicon.21,24 However, for most of these potentials the liquid-liquid transition is known to be metastable with respect to a crystalline solid phase, hence the LLCP is also in the metastable region of the phase diagram making its direct studying challenging. A notable example which had been thought to be an exception until recently,25 is the spherically symmetric hard-core double-ramp model. This potential was first studied by Hemmer and Stell, revealing the existence of a second critical point in case of the one-dimensional fluid.2 Jagla showed in 2001 that this critical point manifests in the liquid region of the phase diagram both in the 2D and 3D cases.3 Since then, the double-ramp model (often referred to as the ‘Jagla model’) has attracted considerable interest.26–31 While the liquid phases of this model have been extensively studied, its solid phases (apart from the detailed work of Lomba et al.,32 who determined the melting line accurately), and in particular, the question of solid polymorphism has received little attention. This is partly due to challenges related to equilibrating the simulations and observing crystallisation via simple gradual cooling of the liquid. On the other hand, relevant high temperature crystalline phases are usually not ground state structures, hence they are difficult to identify by global optimisation techniques. As we have shown in our recent work, this led to missing crucial features of the Jagla phase diagram.25 We performed an exhaustive unbiased search of the potential energy surface with the nested sampling method at multiple pressures, revealing the existence of a complex high-temperature and high-pressure phase, which is more stable than the high-density liquid (HDLiq) phase. Thus, this does not only show that the crystalline phases of the Jagla model are more complex than described before, but more importantly, that the high-density liquid is metastable.
In the current work we employ the same sampling technique as in our previous study, nested sampling,33 to compute the phase diagram of the Jagla model in two dimensions, where the LLCP is known to be in the stable liquid region of the phase diagram. Furthermore, we also explore the parameter space by varying the three potential parameters of the model (the slope of the linear ramps and the location of the potential minimum), in order to study their effect on the phase diagram. Understanding how these parameters affect phase stability – particularly that of the high-density liquid – is an important step towards creating a parameterisation in the future, which has a thermodynamically stable liquid-liquid transition in 3D. Finally, we propose a smoothed and hence differentiable (beyond the hard sphere core) version of the Jagla model, highlighting that small changes to the shape of the particle interactions can induce qualitative changes in the macroscopic behaviour of the model material.
II. The 2D Jagla model
A. Potential functions and parameterisations
The Jagla model is the combination of a hard-sphere core and two linear functions accounting for the repulsive and the attractive ramps. The potential can be defined in different, but mathematically equivalent forms.29Eqn (1) describes the definition we adapt in our work, and eqn (2) shows our suggested smoothed version of the potential function. | (1) |
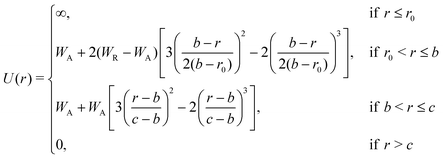 | (2) |
In the current work we started with the original parameters presented in Jagla's publication. The hard sphere radius, r0, determines the length unit, and the depth of the potential well, U0, determines the energy unit of the model. In the 2D case, the remaining parameters are set as b = 1.72r0 (the minimum energy distance), c = 4.8r0 (where the potential goes to zero), WR = 3.336WA (the height of the repulsive ramp) and WA = −U0 (the depth of the potential energy well).3 The pressure and the temperature of the system can be conveniently given in units of U0/r02 and U0/kB, respectively. In order to explore the sensitivity of the phase behaviour to the potential parameters, we repeated our calculations with six further variants of the model, in each case changing one of the three parameters, WR, b or c, both to a slightly lower and a slightly higher value than in the original model.
In order to allow continuous differentiation of the potential, and thus the calculation of forces, smoothed versions of the ramp and double-well type potentials have been employed before.12,14 These modifications, however, often result in qualitatively different behaviours.10,18 To examine this effect, we propose a smoothed version of the model beyond the hard-core component. Since the customarily used spline functions require the introduction of new fitting constants, we decided to use a combination of two sigmoidal smooth step-functions (presented in eqn (2)), which preserves the physical meaning of the original characteristic potential parameters and closely follows the original shape. Fig. 1 shows the potential with the original parameterisation, together with the modifications indicated by coloured dashed lines, as well as our proposed smoothed version of the potential.
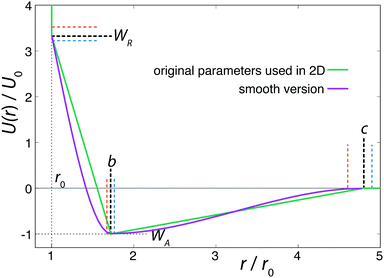 | ||
| Fig. 1 Spherically symmetric Jagla ramp model, with the original parameters used in 2D3 (green), and our smoothed version (purple). Coloured dashed lines represent the variation of the potential parameters we explored. | ||
B. Known phases
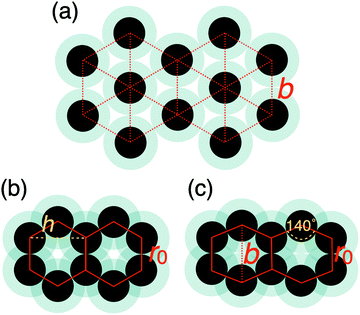
Despite their apparent simplicity, even one-component systems interacting through non-directional potentials can show very complex phase behaviour in 2D: they can exhibit multiple critical points, anomalous properties,34 several stable crystalline polymorphs,1,35–39 as well as intriguing melting scenarios that can involve two continuous transitions with a new quasi-long-range orientationally ordered intermediate phase, the hexatic phase.1,40,41The closest possible packing of monodisperse discs is the hexagonal packing, where each disc has six nearest neighbours. This structure is often the lowest energy configuration, however, it has been shown in several cases that depending on the details of the potential model, a wide range of exotic structures can be stabilised thermodynamically.1,35–38 To aid our discussion of the different solid phases, we will refer to the hexagonal lattice as the triangular phase, reflecting its triangular packing,36,42 and reserve the name hexagonal phase, where the particle positions represent tiling of the plane by regular hexagons. Having more than one characteristic distance of the potential can lead to the formation of isocrystalline structures: having the same spatial arrangement of particles, but with different lattice constants.35,36 To distinguish such phases, we will refer to them as low-density and high-density structures, e.g. LD triangular phase and HD triangular phase, the latter being the global minimum of the studied system.
III. Simulation details
The configuration space of the Jagla model was explored using the nested sampling (NS) method. NS is a Bayesian inference method developed by Skilling43,44 that has been adapted to sample the potential energy landscape of atomistic systems.33,45–47 NS is a “top-down” approach, starting from randomly generated configurations representing the high enthalpy region (or the high energy in case of the canonical ensemble) of the phase-space, propagating towards the global minimum through a series of iterative steps which shrink the available phase space by a constant fraction. During the iterative step, the highest enthalpy configuration is substituted with a new lower enthalpy one, generated from a randomly chosen existing configuration through a series of uniform changes to atomic positions and simulation cell dimensions. One of the greatest advantages of the method is that this process allows the calculation of the partition function and hence gives access to thermodynamic properties, moreover, this can be achieved without any prior knowledge of the structure of relevant phases. The powerfulness of NS in calculating structural and thermodynamic properties under a wide range of conditions has been demonstrated in case of a range of bulk materials45,48–53 and clusters.46,54–56 For a detailed review of materials application of NS we recommend ref. 33.NS calculations were performed using the pymatnest program package57 and configurations were sampled by utilising single-atom MC moves, and changing the volume and shape of the simulation cell. The studied pressure range was chosen in every case such that it spans the entire HDLiq-LDLiq phase boundary with additional pressure values above the LLCP. The simulation cell contained in most cases 120 particles, however, calculations with certain parameter sets were repeated using 60, 144 and 240 atoms in order to evaluate finite size effects and allow the formation of crystalline structures with potentially different unit cell symmetry. In all cases these extra runs identified the same stable phases, including the crystalline structures, as the original calculations, suggesting that we have not missed any thermodynamically relevant structures due to unit cell incommensurability. Using systems of 60–100 particles usually causes the melting temperature to be overestimated with NS by 5–8%.33,47 Our observation that increasing the system size from 120 to 240 particles decreased the melting temperature by 4% suggests that our results are only marginally affected by finite size effects.
There are two parameters controlling the convergence of NS calculations. The number of configurations constituting the live set, K, determines the resolution of the energy landscape, and the length of the random walk used to generate the new sample configurations, L. Our calculations showed that using K = 560 walkers and L = 1200 MC sweeps per iterations result in good convergence, with peaks of the heat capacity to vary less than 0.005U0/kB.
To evaluate the expected value of an observable at a given temperature, we can calculate its weighted average over all the generated samples:33,46
 | (3) |
 | (4) |
IV. Results and discussion
A. Original parameterisation
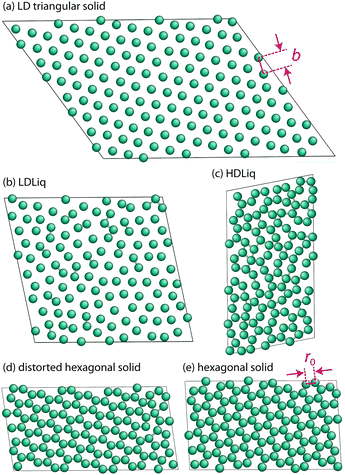
The overall phase diagram calculated by NS is compared to that published in the original work of Jagla in Fig. 2. Samplings at lower pressures explored the low-density liquid phase (LDLiq), showing the density anomaly observed before. Upon freezing of the LDLiq, the low-density “triangular” solid is formed, with the nearest neighbour particles being at the distance corresponding to the location of the potential minimum, b, as seen in Fig. 3(a). In further agreement to previous results, the melting line has a negative slope as the pressure increases. At p = 0.26U0/r02 the observed behaviour changes significantly, with two additional peaks appearing on the heat capacity curve, where the peak at the higher temperature is associated with a significant increase in density. In order to aid the identification of the phases, we calculated the weighted average of the radial distribution function at a series of temperatures, which are shown in Fig. 4 for two different pressures along with the heat capacity and density curves. The high-temperature peak of the heat capacity corresponds to the transition from the low-density liquid to the high-density liquid as the temperature decreases (two example snapshots are shown in Fig. 3(b) and (c)). As the pressure increases, the HDLiq-LDLiq transition shifts to higher temperature while the heat capacity peak gradually broadens and then disappears suggesting that this transition ends in a critical point (see Fig. 4b). To locate the critical point we drew on the results of Bruce and Wilding:58 at the temperature corresponding to the maximum of the heat capacity peak at a given pressure, the density distribution appears bimodal below the critical point and unimodal above it for finite systems. Hence, by calculating the density distribution we can determine whether the peak represents a first order phase transition, or the shallower and broader peak of the heat capacity corresponds to crossing the respective Widom-line (shown by open symbols in Fig. 2), providing an upper and lower estimate of the critical pressure. This analysis confirms that the LLCP is in the range of pc = 0.3 − 0.35U0/r02 and Tc = 0.42 − 0.45U0/kB, while the liquid-vapour critical point is in the range of pc = 0.06 − 0.1U0/r02 and Tc = 1.51 − 1.71U0/kB.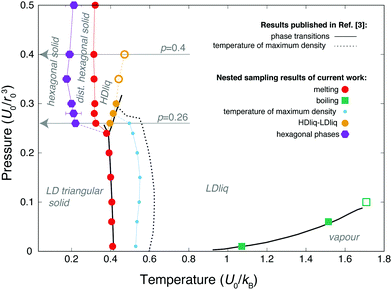 | ||
| Fig. 2 Temperature-pressure phase diagram of the 2D Jagla model. Black line represent data from literature,3 coloured symbols are nested sampling results of the current work. Error bars represent the temperature range within which the heat capacity peaks were located. Open circles and square show where peaks on the heat capacity were found to be above the liquid-liquid and liquid-vapour critical point, respectively, corresponding to the respective Widom-lines. The dashed black line and smaller light-blue symbols correspond to the temperature of the maximum density line. Grey vertical arrows point to the two pressures where the radial distribution functions shown on Fig. 4 were calculated. | ||
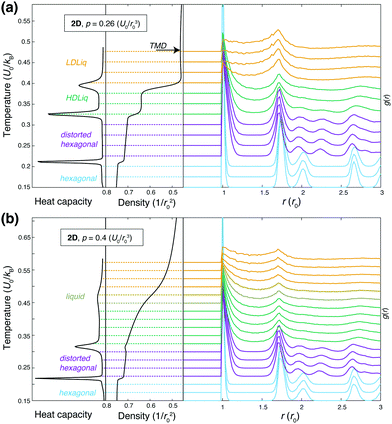 | ||
| Fig. 4 Heat capacity (left panels), density (middle panels) and the weighted average (see eqn (3)) of the radial distribution function (RDF) at different temperatures (right panels), calculated by nested sampling, using the original parameterisation. RDFs are shifted vertically, such that their baseline matches the corresponding temperature. Panel (a) shows results below the liquid-liquid critical point at p = 0.26U0/r02, the black arrow points to the temperature of the maximum density (TMD), panel (b) shows results above the liquid-liquid critical point at p = 0.4U0/r02, where the transition from LDLiq to HDLiq is continuous. These two pressures are highlighted by grey arrows on the phase diagram shown in Fig. 2. | ||
The two other peaks in the heat capacity (see Fig. 4a) correspond to two phase transitions: first the high-density liquid phase freezes into a distorted hexagonal structure, which then undergoes a phase transformation to a regular hexagonal arrangement. In the distorted phase, the hexagons formed by the particles have two ∼140 degree angles at opposite vertices, with the nearest neighbour particles being at the hard sphere distance, r0. The distortion also causes the second nearest neighbour distances to split, resulting in two distinct peaks around 2r0, as can be seen in the radial distribution functions in Fig. 4. This structure has been known to be a ground state of repulsive ramp models at medium pressures36,39 and for the double-step potentials as a medium-pressure high-temperature phase.59
As the sampling progresses, and the lower energy part of the phase space is explored, we found this distorted structure to transform to regular hexagons at around T = 0.2, but found the transition temperature varying more in independent runs, suggesting that this transition is more challenging to converge. Characteristic structures of the solid phases are shown in Fig. 5.
While we identified the boundaries of two new solid phases at higher pressures, the rest of the phase diagram agrees excellently with Jagla's published work.3 The only difference appears in the temperature of the maximum densities at a given pressure. In order to examine this discrepancy, we performed a series of constant pressure Monte Carlo simulations of 400 Jagla particles using the HOOMD package.60,61 The equilibrium density of these NPT simulations agreed with our NS results perfectly. One also has to note that the ground state structure is the close-packed high-density triangular phase, with nearest neighbour distances at r0. This structure has not been explored by nested sampling at the current resolution, due to its anticipated very small phase space volume at the melting temperature, hence we do not provide an estimate for this solid–solid transition.
B. Varied parameterisation
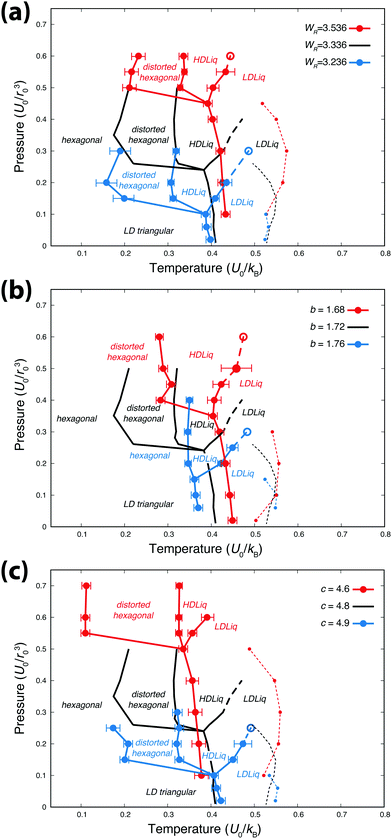
Our recent calculations on the 3D system have shown that the most widely used parameterisation of the Jagla potential displays, contrary to the earlier consensus, the LLCP in a region where the liquid phases are metastable with respect to a newly identified solid phase.25 Hence, the question naturally arises: is it possible to find a parameter set where the HDLiq phase becomes thermodynamically stable? Motivated by this question, we use the 2D system to explore the sensitivity of the phase behaviour to changes of the potential parameters: 2D systems are inherently simpler, with fewer crystalline structures emerging, moreover, the HDLiq appears to be a thermodynamically stable phase of the 2D Jagla model. In this section, we change each potential parameter independently, then calculate and compare the resulting phase diagrams. In the following, the results are discussed primarily from the point of view of the stability range of the HDLiq phase.Fig. 6 shows the phase diagrams of the six variants of the potential model. The main qualitative features of the phase diagram are not affected by the small parameter variations: the melting line of the low-density solid has a negative slope, both liquid phases are thermodynamically stable in certain regions, and all systems show density anomaly. The significant shift of the phase boundaries to larger pressure is due to making the overall potential more repulsive (either by increasing the slope of the repulsive ramp, such as increasing WR, or shortening the attractive region, i.e. decreasing c).
Increasing WR causes the melting and solid–solid transitions to shift slightly towards higher temperatures, but as the LDLiq–HDLiq phase boundary does not change significantly, this only causes a minor change in the temperature range where the HDLiq phase is stable (see Fig. 6a). In contrast, varying the location of the potential minimum has a more complex and stronger effect. Changing the b parameter alters the steepness of both the repulsive and the attractive ramps, as well as the proportion of neighbour shells corresponding to these, hence also the number of particles contributing with forces of opposite signs. Therefore, it is expected that not only the phase boundaries will be shifted, but the stability of the solid phases might change as well, with potentially new structures emerging or disappearing form the phase diagram.
While the increase in the b parameter shifts the freezing of the LDLiq to lower temperatures, the effect is the opposite on the solid–HDLiq phase transition temperature. As is seen in Fig. 6b, at b = 1.76r0 (that is, at the increased b value) the melting temperature of both the HDLiq and the LDLiq phases are almost the same, but they are becoming increasingly different as b decreases. Decreasing the b parameter shifts the stability region of HDLiq to higher pressures and lower temperatures. Furthermore, varying parameter b causes the disappearance of one of the solid phases. With b = 1.68r0 the liquid freezes into the distorted hexagonal structure, where the distance of the opposite vertices is exactly the modified minimum energy distance (1.68r0), with no evidence of further transition to regular hexagonal structure at lower temperatures. However, using b = 1.76r0 causes the liquid to freeze straight into the regular hexagonal structure. This might be explained by the fact that this minimum location is larger than the second neighbour distance (i.e. the height) of a regular hexagon,  , and hence the distorted structure does not have an energetic advantage any more.
Increasing the value of parameter c shifts both the solid–solid and the LDLiq–HDLiq phase transitions to higher temperatures (as illustrated in Fig. 6c), while the melting temperature seems to be insensitive to these changes. As a consequence, the stability range of the HDLiq phase changes drastically upon variation of c. Decreasing c shrinks the stability region of HDLiq significantly, while increasing it widens the temperature range where HDLiq is stable.
C. Smoothed version of the potential
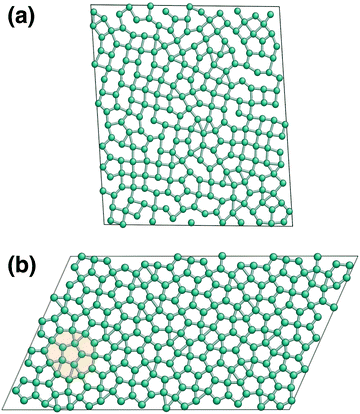
In the low-pressure region, the phase behaviour of the smoothed potential is very similar to that of the original linear ramp model (see Fig. 7). The low-density liquid forms the LD triangular phase upon freezing, the slope of the melting line is negative and displays the density maximum anomaly, although both are shifted to lower temperatures. Interestingly, however, the high pressure behaviour is markedly different. The simulations do not show a clear transition to another liquid of different density at higher pressure, but the continuous increase in density is accompanied by the formation of orthogonal structural units. As Fig. 8 demonstrates, as more particles move closer to the hard-core radius upon increasing the pressure, the characteristic angle between three nearest neighbours becomes 90°, but only a shoulder appears on the heat capacity curve, suggesting this transition is not of first-order. As the temperature decreases, a sharp peak marks the transition to a solid of a different angular order: characteristic angles become approximately 45°, 90° and 108°, as the explored structures are built up by regular pentagons surrounded by distorted pentagons, squares and right-angled triangles to form larger 12-membered rings (see Fig. 9). However, the relative orientation and packing of these motifs were different among different walkers, with a lack of obvious long-range periodicity except what is enforced by the periodic boundary conditions, hence we refer to this phase as quasi-crystalline. Similar structures have been described for hard-core shoulder62,63 and soft shoulder potentials,39 if the ratio of the two characteristic lengths scales of the model is around 1.4. This ratio is larger in our system, b/r0 = 1.72, since our smoothed Jagla potential also has an attractive interaction range. Interestingly, Pattabhiraman et al. has also found the quasicrystalline phase to be preceded by a liquid phase dominated by orthogonal motifs.63 This can originate from the thermodynamic competition between the tiling polygons: the square arrangement becomes less favourable at higher density.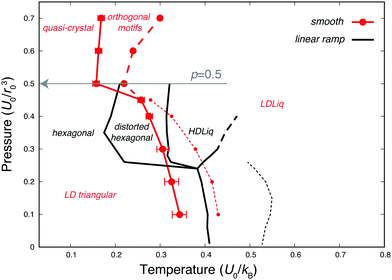 | ||
| Fig. 7 Temperature-pressure phase diagram of the smoothed version of the 2D Jagla model (red symbols) compared to results obtained with the original linear ramp model (black lines). Lines are only guides to the eye. Dotted lines with smaller symbols show the temperature of maximum density line. The grey vertical arrow points to the pressure where the radial distribution functions shown on Fig. 8 were calculated. | ||
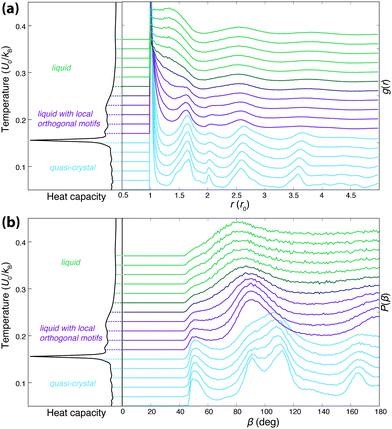 | ||
| Fig. 8 Heat capacity, radial distribution functions, and angular distribution functions of nearest neighbours computed with the smoothed version of the 2D Jagla model, at p = 0.5U0/r02 (highlighted by a grey arrow in Fig. 7). Heat capacity is shown on the left of both panels, while the top panel (a) displays the weighted average of the radial distribution function (RDF) at different temperatures, and the bottom panel (b) shows the weighted average of the angular distribution function of nearest neighbours at different temperatures, computed on configurations sampled by NS, using eqn (3). Distributions are vertically shifted such that the baseline matches the corresponding temperature on the heat capacity. | ||
In order to examine the stability of both the liquid with orthogonal motifs and the quasi-crystalline phases, we performed a series of Monte Carlo simulations at p = 0.5U0/r02 using the HOOMD package with 400 particles interacting through the smoothed potential. In the temperature range 0.18–0.24 the orthogonal motifs are formed, but even starting from a perfect square lattice of various densities results in a partially disordered phase, suggesting that under these conditions the perfect square-lattice crystal structure is indeed unstable. Finding the quasi-crystal structure via cooling proved to be more challenging, with the simulation getting easily trapped in the LD triangular packing if the initial conditions were unfavourable. This highlights the powerfulness of phase space exploration methods, such as NS, which uses independent sample configurations to explore the phase space, unbiased by our intuition. However, when getting trapped in the triangular phase was avoided, the obtained structures showed great structural similarity with configurations sampled by NS, without any apparent periodicity in the simulation cell.
V. Conclusions
With the nested sampling technique, we performed an extensive exploration of the potential energy surface of the original two-dimensional hard-core double ramp model used by Jagla3 as well as a series of modified versions of it, and computed their pressure-temperature phase diagram. Our calculations using Jagla's original parameterisation reproduced the known phase diagram. We extended our phase space exploration to higher pressures which allowed to identify two new solid phases of hexagonal arrangement.We examined the impact of small modifications to the different potential parameters, to reveal their effect on the stability of different phases, with particular focus on the stability of the high-density liquid.
Decreasing WR, the slope of the short range repulsive ramp causes the closer neighbour shells to have a reduced repulsive contribution, which widens the stability region of the HDLiq phase. Increasing c, the length of the attractive ramp results in taking into account more neighbour shells, all with a negative contribution to the energy. This has a stronger effect, with the temperature range in which the HDLiq is stable being more sensitive to changes to c than to that of the WR parameter. Changing b, the location of the potential minimum has a more complex consequence. It not only changes the slope of both ramps, but the most favourable neighbour distance as well, which significantly alters the stability of different crystalline configurations leading eventually to the disappearance of one of the solid phases.
Based on these results we hypothesise that making the potential more attractive by increasing the length of the attractive ramp or (to a lesser extent) decreasing the height of the repulsive ramp in 3D might increase the stability of the HDLiq phase. This could bring the LLCP of the 3D model to the stable liquid range. Indeed, increasing c extends the range of particles that have a favourable energetic contribution, which is expected to be more pronounced in the high-density phases. However, if the potential parameters are changed, the appearance of novel crystalline phases should be anticipated (this is in particular true in 3D), which could still render the HDLiq metastable.
We also proposed a continuously differentiable (beyond the hard-core) version of the Jagla model, which preserves its characteristic parameters. Similar smoothed potentials are often used as substitutes to discreet step or well potentials, to allow the easier use of molecular dynamics. While the proposed smooth model shows similar behaviour to the ramp model at low pressures, the high pressure behaviour is markedly different, with a quasi-crystal structure emerging. This highlights, that small changes to the potential function can result in a qualitatively different phase behaviour. Consequently, a full exploration of the phase space becomes necessary every time an interaction potential is modified even to the slightest extent.
Conflicts of interest
There are no conflicts to declare.Acknowledgements
L. B. P. acknowledges support from the EPSRC through an Early Career Fellowship (EP/T000163/1). Computing facilities were provided by the Scientific Computing Research Technology Platform of the University of Warwick. Atomic structures were visualised using AtomEye64 This research was funded in part by the EPSRC, EP/T000163/1. For the purpose of open access, the authors have applied a Creative Commons Attribution (CC BY) licence to any Author Accepted Manuscript version arising from this submission. Simulation data, structures and thermodynamic data are available in the repository at https://github.com/albapa/Jagla.References
- V. N. Ryzhov, E. E. Tareyeva, Y. D. Fomin and E. N. Tsiok, Complex phase diagrams of systems with isotropic potentials: results of computer simulations, Physics, 2020, 63, 417–439 Search PubMed.
- P. C. Hemmer and G. Stell, Fluids with several phase transitions, Phys. Rev. Lett., 1970, 24, 1284–1287 CrossRef.
- E. A. Jagla, Phys. Rev. E: Stat., Nonlinear, Soft Matter Phys., 2001, 63, 061501 CrossRef CAS PubMed.
- J. Fornleitner and G. Kahl, Pattern formation in two-dimensional square-shoulder systems, J. Phys.: Condens. Matter, 2010, 22, 104118 CrossRef PubMed.
- G. Franzese, G. Malescio, A. Skibinsky, S. V. Buldyrev and H. E. Stanley, Generic mechanism for generating a liquid-liquid phase transition, Nature, 2001, 409, 692–695 CrossRef CAS PubMed.
- G. Franzese, G. Malescio, A. Skibinsky, S. V. Buldyrev and H. E. Stanley, Metastable liquid-liquid phase transition in a single-component system with only one crystal phase and no density anomaly, Phys. Rev. E: Stat., Nonlinear, Soft Matter Phys., 2002, 66, 051206 CrossRef CAS PubMed.
- A. Skibinsky, S. V. Buldyrev, G. Franzese, G. Malescio and H. E. Stanley, Liquid-liquid phase transitions for soft-core attractive potentials, Phys. Rev. E: Stat., Nonlinear, Soft Matter Phys., 2004, 69, 061206 CrossRef CAS PubMed.
- Y. D. Fomin, N. V. Gribova, V. N. Ryzhov, S. M. Stishov and D. Frenkel, Quasibinary amorphous phase in a three-dimensional system of particles with repulsive-shoulder interactions, J. Chem. Phys., 2008, 129, 064512 CrossRef PubMed.
- N. V. Gribova, Y. D. Fomin, D. Frenkel and V. N. Ryzhov, Waterlike thermodynamic anomalies in a repulsive-shoulder potential system, Phys. Rev. E: Stat., Nonlinear, Soft Matter Phys., 2009, 79, 051202 CrossRef CAS PubMed.
- Y. D. Fomin, E. N. Tsiok and V. N. Ryzhov, Complex phase behavior of the system of particles with smooth potential with repulsive shoulder and attractive well, J. Chem. Phys., 2011, 134, 044523 CrossRef PubMed.
- A. Jain, J. R. Errington and T. M. Truskett, Inverse design of simple pairwise interactions with low-coordinated 3d lattice ground states, Soft Matter, 2013, 9, 3866–3870 RSC.
- G. Franzese, Differences between discontinuous and continuous soft-core attractive potentials: The appearance of density anomaly, J. Mol. Liq., 2007, 136, 267–273 CrossRef CAS.
- E. O. Rizzatti, M. Aurélio, A. Barbosa and M. C. Barbosa, Core-softened potentials, multiple liquid-liquid critical points, and density anomaly regions: An exact solution, Front. Phys., 2018, 13, 136102 CrossRef.
- S. Pant, T. Gera and N. Choudhury, Effect of attractive interactions on the water-like anomalies of a core-softened model potential, J. Chem. Phys., 2013, 139, 244505 CrossRef PubMed.
- T. Urbic, Two-dimensional core-softened model with water like properties: Monte carlo and integral equation study, J. Chem. Phys., 2013, 139, 164515 CrossRef PubMed.
- A. B. de Oliveira, P. A. Netz, T. Colla and M. C. Barbosa, Thermodynamic and dynamic anomalies for a three-dimensional isotropic core-softened potential, J. Chem. Phys., 2006, 124, 084505 CrossRef PubMed.
- A. Metere, P. Oleynikov, M. Dzugutov and M. OKeeffe, Formation of a new archetypal metal- organic framework from a simple monatomic liquid, J. Chem. Phys., 2014, 141, 234503 CrossRef PubMed.
- D. Quigley and M. I. J. Probert, Phase behavior of a three-dimensional core-softened model system, Phys. Rev. E: Stat., Nonlinear, Soft Matter Phys., 2005, 71, 065701 CrossRef CAS PubMed.
- E. Salcedo, A. B. de Oliveira, N. M. Barraz, C. Chakravarty and M. C. Barbosa, Core-softened fluids, water-like anomalies, and the liquid-liquid critical points, J. Chem. Phys., 2011, 135, 044517 CrossRef PubMed.
- M. Aurelio, A. Barbosa, E. Salcedo and M. C. Barbosa, Multiple liquid-liquid critical points and density anomaly in core-softened potentials, Phys. Rev. E: Stat., Nonlinear, Soft Matter Phys., 2013, 87, 032303 CrossRef.
- P. H. Poole, F. Sciortino, U. Essmann and H. Eugene Stanley, Phase behaviour of metastable water, Nature, 1992, 360, 324–328 CrossRef CAS.
- F. Smallenburg, L. Filion and F. Sciortino, Erasing no-mans land by thermodynamically stabilizing the liquid-liquid transition in tetrahedral particles, Nat. Phys., 2014, 10(9), 653–657 Search PubMed.
- V. N. Ryzhov and S. M. Stishov, A liquid-liquid phase transition in the “collapsing” hard sphere system, J. Exp. Theor. Phys., 2002, 95, 710–713 CrossRef CAS.
- F. Sciortino, E. L. Nave and P. Tartaglia, Physics of the Liquid-Liquid Critical Point, Phys. Rev. Lett., 2003, 91, 155701 CrossRef PubMed.
- A. P. Bartok, G. Hantal and L. B. Partay, Insight into liquid polymorphism from the complex phase behavior of a simple model, Phys. Rev. Lett., 2021, 127, 015701 CrossRef CAS PubMed.
- L. Xu, I. Ehrenberg, S. V. Buldyrev and H. E. Stanley, J. Phys.: Condens. Matter, 2006, 18, 2239–2246 CrossRef.
- L. Xu, S. V. Buldyrev, N. Giovambattista and H. E. Stanley, Int. J. Mol. Sci., 2010, 11, 5184–5200 CrossRef CAS PubMed.
- H. M. Gibson and N. B. Wilding, Metastable liquid-liquid coexistence and density anomalies in a core-softened fluid, Phys. Rev. E: Stat., Nonlinear, Soft Matter Phys., 2006, 73, 061507 CrossRef CAS PubMed.
- F. Ricci and P. G. Debenedetti, A free energy study of the liquid-liquid phase transition of the jagla two-scale potential, J. Chem. Sci., 2017, 129, 801–823 CrossRef CAS.
- N. B. Wilding and J. E. Magee, Phase behavior and thermodynamic anomalies of core-softened fluids, Phys. Rev. E: Stat., Nonlinear, Soft Matter Phys., 2002, 66, 031509 CrossRef PubMed.
- M. L. de Haro, Á. Rodrìguez-Rivas, S. B. Yuste and A. Santos, Structural properties of the Jagla fluid, Phys. Rev. E, 2018, 98, 012138 CrossRef CAS PubMed.
- E. Lomba, N. G. Almarza, C. Martin and C. McBride, Phase behavior of attractive and repulsive ramp fluids: Integral equation and computer simulation studies, J. Chem. Phys., 2007, 126, 244510 CrossRef CAS PubMed.
- L. B. Pártay, G. Csányi and N. Bernstein, Nested sampling for materials, Eur. Phys. J. B, 2021, 94, 159 CrossRef.
- A. Scala, M. R. Sadr-Lahijany, N. Giovambattista, S. V. Buldyrev and H. E. Stanley, Waterlike anomalies for core- softened models of fluids: Two-dimensional systems, Phys. Rev. E: Stat., Nonlinear, Soft Matter Phys., 2001, 63, 041202 CrossRef CAS PubMed.
- G. Stell and P. C. Hemmer, Phase transitions due to softness of the potential core, J. Chem. Phys., 1972, 56, 4274–4286 CrossRef CAS.
- E. A. Jagla, Phase behavior of a system of particles with core collapse, Phys. Rev. E: Stat. Phys., Plasmas, Fluids, Relat. Interdiscip. Top., 1998, 58, 1478–1486 CrossRef CAS.
- E. A. Jagla, Minimum energy configurations of repelling particles in two dimensions, J. Chem. Phys., 1999, 110, 451–456 CrossRef CAS.
- N. P. Kryuchkov, S. O. Yurchenk, Y. D. Fomin, E. N. Tsiok and V. N. Ryzhov, Complex crystalline structures in a two-dimensional core-softened system, Soft Matter, 2018, 14, 2152–2162 RSC.
- W. R. C. Somerville, A. D. Law, M. Rey, N. Vogel, A. J. Archer and D. M. A. Buzz, Pattern formation in two-dimensional hard-core/soft-shell systems with variable soft shell profiles, Soft Matter, 2020, 16, 3564 RSC.
- D. R. Nelson and B. I. Halperin, Phys. Rev. B: Condens. Matter Mater. Phys., 1979, 19, 2457 CrossRef CAS.
- A. P. Young, Phys. Rev. B: Condens. Matter Mater. Phys., 1979, 19, 1855 CrossRef CAS.
- R. Connelly and W. Dickinson, Periodic planar disc packings, Philos. Trans. R. Soc., A, 2014, 372, 20120039 CrossRef PubMed.
- J. Skilling, Bayesian Anal., 2006, 1, 833–859 Search PubMed.
- G. Ashton, N. Bernstein, J. Buchner, X. Chen, G. Csányi, F. Feroz, A. Fowlie, M. Griffiths, M. Habeck, W. Handley, E. Higson, M. Hobson, A. Lasenby, D. Parkinson, L. B. Pártay, M. Pitkin, D. Schneider, L. South, J. S. Speagle, J. Veitch, P. Wacker, D. J. Wales and D. Yallup, Nested Sampling for physical scientists, Nat. Rev. Methods Primer, 2022, 2, 39 CrossRef CAS.
- R. J. N. Baldock, N. Bernstein, K. M. Salerno, L. B. Pártay and G. Csányi, Phys. Rev. E, 2017, 96, 43311–43324 CrossRef PubMed.
- L. B. Pártay, A. P. Bartók and G. Csányi, J. Phys. Chem. B, 2010, 114, 10502–10512 CrossRef PubMed.
- R. J. N. Baldock, L. B. Pártay, A. P. Bartók, M. C. Payne and G. Csányi, Phys. Rev. B, 2016, 93, 174108 CrossRef.
- J. Dorrell and L. B. Pártay, Pressure-Temperature Phase Diagram of Lithium, Predicted by Embedded Atom Model Potentials, J. Phys. Chem. B, 2020, 124, 6015–6023 CrossRef CAS PubMed.
- A. Gola and L. Pastewka, Embedded atom method potential for studying mechanical properties of binary cu-au alloys, Modell. Simul. Mater. Sci. Eng., 2018, 26, 055006 CrossRef.
- L. B. Pártay, A. P. Bartók and G. Csányi, Nested sampling for materials: The case of hard spheres, Phys. Rev. E: Stat., Nonlinear, Soft Matter Phys., 2014, 89, 022302 CrossRef PubMed.
- C. W. Rosenbrock, K. Gubaev, A. V. Shapeev, L. B. Pártay, N. Bernstein, G. Csànyi and G. L. W. Hart, Machine-learned interatomic potentials for alloys and alloy phase diagrams, npj Comput. Mater., 2021, 7, 24 CrossRef CAS.
- L. B. Pártay, On the performance of interatomic potential models of iron: comparison of the phase diagrams, Comput. Mater. Sci., 2018, 149, 153–157 CrossRef.
- M. J. Pfeifenberger, M. Rumetshofer and W. von der Linden, Nested sampling, statistical physics and the Potts model, J. Comput. Phys., 2018, 375, 368–392 CrossRef.
- J. Dorrell and L. B. Pártay, Thermodynamics and the potential energy landscape: case study of small water clusters, Phys. Chem. Chem. Phys., 2019, 21, 7305–7312 RSC.
- K. Rossi, L. B. Pártay, G. Csányi and F. Baletto, Thermodynamics of cupt nanoalloys, Sci. Rep., 2018, 8, 9150 CrossRef CAS PubMed.
- S. Martiniani, J. D. Stevenson, D. J. Wales and D. Frenkel, Superposition enhanced nested sampling, Phys. Rev. X, 2014, 4, 031034 Search PubMed.
- N. Bernstein, R. J. N. Baldock, L. B. Pártay, J. R. Kermode, T. D. Daff, A. P. Bartók and G. Csányi. pymatnest. https://github.com/libAtoms/pymatnest, 2016.
- A. D. Bruce and N. B. Wilding, Phys. Rev. Lett., 1992, 68, 193 CrossRef PubMed.
- A. M. Almudallal, S. V. Buldyrev and I. Saika-Voivod, Phase diagram of a two-dimensional system with anomalous liquid properties, J. Chem. Phys., 2012, 137, 034507 CrossRef PubMed.
- J. A. Anderson, C. D. Lorenz and A. Travesset, General purpose molecular dynamics simulations fully implemented on graphics processing units, J. Comput. Phys., 2008, 227(10), 5342–5359 CrossRef HOOMD-blue feature: HOOMD-blue.
- J. Glaser, T. D. Nguyen, J. A. Anderson, P. Liu, F. Spiga, J. A. Millan, D. C. Morse and S. C. Glotzer, Strong scaling of general-purpose molecular dynamics simulations on gpus, Comput. Phys. Commun., 2015, 192, 97–107 CrossRef CAS HOOMD-blue feature: HOOMD-blue.
- T. Dotera, T. Oshiro1 and P. Ziherl, Mosaic two-lengthscale quasicrystals, Nature, 2014, 506, 208 CrossRef CAS PubMed.
- H. Pattabhiraman, A. P. Gantapara and M. Dijkstra, On the stability of a quasicrystal and its crystalline approximant in a system of hard disks with a soft corona, J. Chem. Phys., 2015, 143, 164905 CrossRef PubMed.
- J. Li, AtomEye: an efficient atomistic configuration viewer, Modell. Simul. Mater. Sci. Eng., 2003, 11, 173 CrossRef.
| This journal is © The Royal Society of Chemistry 2022 |

