 Open Access Article
Metachronal patterns by magnetically-programmable artificial cilia surfaces for low Reynolds number fluid transport and mixing†
Rongjing
Zhang
 a,
Jaap den
Toonder
 b and
Patrick R.
Onck
 *a
*a
aZernike Institute for Advanced Materials, University of Groningen, 9747AG Groningen, The Netherlands. E-mail: p.r.onck@rug.nl
bDepartment of Mechanical Engineering and Institute for Complex Molecular Systems, Eindhoven University of Technology, P.O. Box 513, 5600 MB Eindhoven, The Netherlands
First published on 8th April 2022
Abstract
Motile cilia can produce net fluid flows at low Reynolds number because of their asymmetric motion and metachrony of collective beating. Mimicking this with artificial cilia can find application in microfluidic devices for fluid transport and mixing. Here, we study the metachronal beating of nonidentical, magnetically-programmed artificial cilia whose individual non-reciprocal motion and collective metachronal beating pattern can be independently controlled. We use a finite element method that accounts for magnetic forces, cilia deformation and fluid flow in a fully coupled manner. Mimicking biological cilia, we study magnetic cilia subject to a full range of metachronal driving patterns, including antiplectic, symplectic, laeoplectic and diaplectic waves. We analyse the induced primary flow, secondary flow and mixing rate as a function of the phase lag between cilia and explore the underlying physical mechanism. Our results show that shielding effects between neighboring cilia lead to a primary flow that is larger for antiplectic than for symplectic metachronal waves. The secondary flow can be fully explained by the propagation direction of the metachronal wave. Finally, we show that the mixing rate can be strongly enhanced by laeoplectic and diaplectic metachrony resulting in large velocity gradients and vortex-like flow patterns.
Bio-inspiration in the design of dynamic surfaces to control fluid motion requires a deep understanding of the behaviour of living organisms. Biological cilia are hair-like slender structures on the micrometre scale. Due to their small size, a single cilium operates at low Reynolds numbers with viscous forces dominating over inertial forces.1 During the effective stroke, the cilium moves fast and almost like a straight rod, while during the recovery stroke, it rolls close to the surface in a slow tangential motion.2,3 In addition to this individual asymmetric motion, biological cilia are also engaged in collective metachronal waves, where neighbouring cilia beat out-of-phase rather than synchronously.1,4–7 Cilia can be found abundantly in humans and microorganisms to sense and generate motion.8–10 Motile cilia can produce a net fluid flow at very low Reynolds numbers, and play an essential role in many living systems, such as the self-propulsion of Paramecium,4 enhancement of feeding functions in coral reefs,11 and the swimming and capturing of food by starfish larvae.12 Also inside our body, cilia play an important role by pumping biofluids, such as mucus in the airways13 and cerebrospinal fluid in the brain ventricle.14
By mimicking this biological function, large arrays of collectively beating artificial cilia also provide possibilities for fluid manipulation in lab-on-chip devices,10,15 mobile microrobots,16,17 and bioengineering systems.18–21 Much work has been done on cilia material design and fabrication, that can be actuation strategies, and cilia motion optimization.22 Cilia can be fabricated by various methods, such as self-assembly techniques,23 casting processes,24,25 and photolithography,26 and actuated in many ways, for instance, by electric fields,27 magnetic fields,28–30 light31,32 and pH.33 The experimental realization of metachronal motion has recently become possible by using pneumatic34 or magnetic cilia.26,35 In these systems, the asymmetric motion of individual cilia and metachronal waves can be independently controlled.
Metachrony is widely observed in nature, from single-celled marine organisms to insects and crustaceans.36 In cilia-driven flows, there are four metachronal wave patterns:37 antiplectic metachrony (AM) and symplectic metachrony (SM), where the direction of the wave propagation and the effective stroke are in the opposite and in the same direction, respectively, and laeoplectic metachrony (LM) and diaplectic metachrony (DM), where the effective stroke are to the left and to the right, respectively, of the propagation direction of the metachronal wave. The metachronal waves that are generated by cilia have been studied by many research groups, e.g. ref. 3,38,39 using a wide range of theoretical and computational techniques. The envelope model, for instance, has been used in many studies, including Blake40 and Michelin and Lauga.41,42 Guo and co-workers used surface undulations to represent the envelope of the cilia tips to identify two optimal metachronal beating patterns for pumping and swimming.43 A 3D lattice spring model (LSM) was used to model cilia motion with a bead-spring configuration,15,44,45 also coupled to the lattice Boltzmann method for the fluid.46 Chateau et al.47 studied the formation of antipleptic and symplectic metachronal waves in 3D cilia arrays that were immersed in a two-fluid environment, while others48–50 studied metachronal waves by employing slender body theory.
Many studies have shown that antiplectic metachronal waves are more efficient than symplectic metachronal waves in transporting fluid, and different explanations and views have been proposed.10,26,28,35,39,51–54 Some of these studies also include the metachronal effect on mixing.10,26,53 In 2015 and 2020, Gorissen et al.55 and Milana et al.52 used a pneumatically actuated array of artificial cilia to create metachronal motion, showing that the fluid pumping capability is improved compared to synchronous motion. In 2017, Marume et al.56 experimental created a metachronal motion by designing an array of magnetic artificial cilia with different magnetizations by controlling the orientation of the magnetic particle distribution inside the cilia. In 2018, Hanasoge et al.57 also reported metachronal motion of an array of magnetic artificial cilia in which the cilia length was varied. In 2020, both Gu et al.35 and Dong et al.26 demonstrated programmable metachronal waves of magnetic cilia and showed their capability of fluid pumping. In 2021, Zhang et al.58 created metachronal motion of microscopic magnetic artificial cilia (μMAC) and demonstrated that the metachronal μMAC can create pronounced fluid pumping in a microfluidic device. However, most investigations of artificial cilia only considered fluid transport and mixing due to SM and AM while in biological systems also waves can develop in perpendiculer directions (LM and DM). The advent of experimental artificial cilia systems in which the cilia motion and the metachronal wave direction can be indepently controlled, opens the exciting opportunity to fully exploit the coupled effect of metachrony in two perpendicular directions (AM/SM versus LM/DM) on fluid transport and mixing. This is the aim of the current paper. To do so, we carry out numerical simulations based on programmable magnetic artificial cilia developed recently.26
In this paper, we simulate the beating kinematics and induced fluid flow of nonidentical, pre-programmed magnetic cilia subjected to a uniformly rotating magnetic field and analyse the resulting mixing response and primary/secondary fluid flow. In Section 1, we summarize the coupled three-dimensional computational solid-fluid interaction model that is used to describe the coupled cilia deformation and fluid flow, subjected to magnetic actuation. In Section 2, the fluid transport and mixing due to one cilium is optimized, based on the initial cilium orientation and magnetization profile angle. In addition, we investigate the fluid transport and mixing due to an array of programmable magnetic cilia subject to a broad range of metachronal waves. The final conclusions are presented in Section 3.
1 Methods
To describe the cilia deformation induced by the rotating magnetic field and the accompanying fluid flow at low Reynolds numbers, a three-dimensional computational solid-fluid interaction model is used based on the finite element method.48 In this model, the cilia are represented by shell elements accounting for large deflections using an updated-Lagrange framework. Since we focus on low Reynolds numbers, we modelled the fluid flow by using the Stokes equation, the solution of which can be written by Green's functions in a semi-infinite fluid.59 The drag forces on the cilia surface are regarded as a distribution of point forces f(r). The fluid velocity uf(r) at a point due to these point forces f(r) exerted on the fluid by the cilia surface S at a position r′ can be written as| uf(r) = G(r − r′, h(r′))f(r′), | (1) |
 | (2) |
The cilia pumping efficiency was quantified by the average fluid volume transported through specific planes. The average volumetric flow rate in the x-direction through the plane (y1 < y < y2 and z1 < z < z2) for x = x0, is defined by
 | (3) |
 | (4) |
 | (5) |
| ln(m/m0) = −βNcycles, | (6) |
The initial configuration of each cilium is the one shown in Fig. 1(a), with no-slip boundary conditions taken on the cilia surface and the substrate. Before the flow is evaluated, the simulations have run for three periods to make sure that the flow has reached a steady state. We also changed the initial state of the driving magnetic field to make sure that the results are not affected by the initial transient.
2 Results
2.1 Fluid transport and mixing by a single cilium
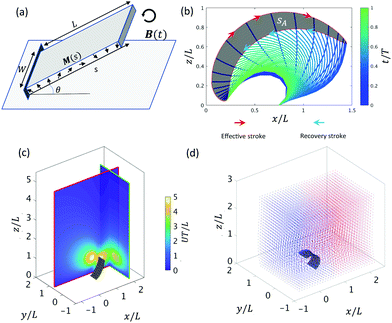
Subject to a rotating magnetic field, the motion of the cilium is determined by its magnetic and geometric properties. We analyze a cilium of length L = 1 mm, width W = 0.75 mm, thickness T = 100 μm with Young's modulus 144 kPa and Poisson ratio 0.5. In this paper, the cilia beat frequency f is set to 1 Hz, the viscosity μ and density ρ of glycerol are 0.876 Pa s and 1.260 g cm−3, so that the Reynolds number equals 0.001, comparable to the recent experimental study.26 The cilium's initial orientation θ and pre-programmed magnetization profile M (s), depicted in Fig. 1a, determine the motion of a single cilium. The non-reciprocal ciliary motion consists of an effective and a recovery stroke (Fig. 1b), leading to a non-zero swept area SA in one beating period.
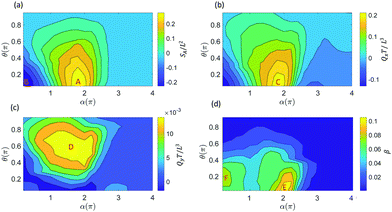
The ciliary non-reciprocal motion can generate a non-zero net flow.48 We calculate the average volumetric flow rate Qx and Qy in the x-direction and y-direction through two perpendicular planes, as shown in Fig. 1c. In addition, tracer particles were added in the box around the cilium to compute the mixing rate β (Fig. 1d). By changing the cilium's magnetic and geometric properties, we obtain different fluid transport and mixing rates. Specifically, we analyse the effect of different initial orientations of the cilium, θ, and different angles α in the magnetization profile M(s) = M0(cos(αs),0,sin(αs)) (see Fig. 1a and Fig. S1, ESI†) when subjecting the cilium to an external rotating magnetic field B(t) with frequency 1 Hz and magnitude 40 mT. It should be noted that the results in Fig. 2 will also depend on the cilia stiffness and actuation frequency. However, since our simulations are based on the experimental system that we developed in our previous paper, only small variations in elastic properties are allowed to ensure robust devices without chemical degradation. We therefore did not vary the elastic properties in the optimization procedure shown in Fig. 2. In addition, to ensure low Reynolds number conditions in both the experiments as well as the simulations, we constrained the frequency to values that are in accordance with the low Re regime.
For fluid transport, we explore the volumetric flow rate through the selected planes y = 0.8L and plane x = 2L in the x-direction (Qx) and the y-direction (Qy), respectively, see Fig. 1c. From Fig. 2a and b we can deduce that there can be a positive swept area A (Fig. 1b), which leads to a positive flow in the x-direction, and a negative swept area B (Fig. S2, ESI†) which leads to a negative flow in the x-direction. In previous work,26,48,61 we found that the fluid transport in the x-direction closely correlates with the swept area SA, which is confirmed in Fig. 2a and b. The swept areas in Fig. 2a shows the existence of an optimal ciliary motion that maximizes fluid transport Qx around area C (Fig. 2b). From Fig. 2c we see that the fluid transport is much smaller than Qx and maximizes around area D. It should be noted that the non-zero fluid flow in the y-direction is due to the fact that we report the flow through a side-plane (y = 0.8L in Fig. 1c). The flow through the symmetry plane (y = 0.5L in Fig. 1c) is exactly equal to zero. Furthermore, the flow in the y-direction is suppressed if the cilium position is close to the surface with θ < 0.2π and when the swept area is zero (θ > 0.2π). Fig. 2d shows the fluid mixing rate β from which we can see that the optimal mixing happens in area E, which is very close to the maximum positive swept area A. At the same time, there is a second mixing area F, caused by the maximum negative swept area B, showing that the mixing effect is related to the amplitude of the swept area. Clearly, the reciprocal motion of the cilium can not only generate net flow but also mix the fluid (and possibly particles) around it.
For the study of the cilia arrays in the next section, we choose α = 1.85π and θ = 0.125π for each cilium as the optimal parameters for the swept area SA which are close to the values used in the experimental set-up.26 Note that in that case we have a positive swept area and the effective stroke is along the positive x-direction, see Fig. 1b.
2.2 Fluid transport induced by a 6 × 6 cilia array
Biological cilia typically form arrays and usually exhibit a collective wavelike metachronal motion. In this section, we study the dynamics of a 6 × 6 cilia array (Fig. 3). The period of metachronal waves is the period of the magnetic driven field, which is 1s. The wavelength can be expressed as . The cilia are geometrically identical and magnetically different due to a variation in phase shift in their magnetization distribution (Mij(s) = M0(cos(αs + Δϕij),0,sin(αs + Δϕij))) where Δϕij = Δϕx·i + Δϕy·j for the i-th cilium in the primary direction along the x-axis and the j-th cilium in the secondary direction along the y-axis. Here, the primary direction is the beating direction of each cilium, while the secondary direction is orthogonal to the primary direction. When Δϕx = 0 and Δϕy = 0, all the cilia beat in phase, i.e. we have synchronous beating (see movie ESI,† 1). When Δϕx ≠ 0, Δϕy = 0, antiplectic metachrony (AM) (see movie ESI,† 2) and symplectic metachrony (SM) (see movie ESI,† 3) occur, when the wave propagation and the effective stroke are in the opposite and same direction, respectively.37 On the other hand, with Δϕx = 0, Δϕy ≠ 0, laeoplectic metachrony (LM) and diaplectic metachrony (DM) occur, when the effective stroke is to the left and right, respectively, of the propagation direction of the metachronic wave (see movies ESI,† 4, 5 and 6 for laeoplectic metachrony for different values of Δϕy). The laeoplectic metachrony (LM) and diaplectic metachrony (DM) are symmetric in the plane y = 0. If both Δϕx ≠ 0 and Δϕy ≠ 0, antiplectic-laeoplectic metachrony occurs with Δϕx < 0 and Δϕy > 0 (see movie ESI,† 7 and 9) and symplectic-laeoplectic metachrony occurs when Δϕx > 0 and Δϕy > 0 (see movie ESI,† 8).
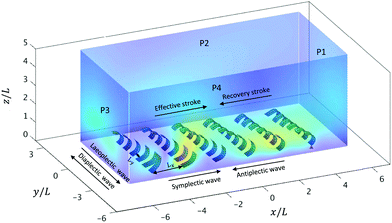 | ||
| Fig. 3 The simulation box of the 6 × 6 cilia array arrangement. A snapshot is shown for an antiplectic-laeoplactic metachronal wave with Δϕx = −π/6 and Δϕy = π/6 at a fixed spacing Lx = 1.75L and Ly = 0.75W (see also movie ESI,† 7). The dimensions of the box are −6L ≤ x ≤ 6L, −3L ≤ y ≤3L, 0 ≤ z ≤ 5L. The cilium (i, j) = (1,1) is marked by the red triangle. | ||
As readouts we compute the net fluid flow in the x-direction (Qx) by subtracting the flow through plane P3 from the flow through P1. Similarly, we compute the net fluid flow in the y-direction (Qy) by subtracting the flow through plane P4 from the flow through plane P2. Furthermore, we note that for the ciliary array studied, the system is fully symmetric with respect to laeoplectic and diaplectic metachrony: Qx in the primary direction will remain unchanged upon a transition from LM to DM, while for Qy in the secondary direction the flow will change sign but its magnitude will remain equal. In this work, we therefore only compute Qx and Qy for LM and use the inherent symmetries to generate the results for DM.
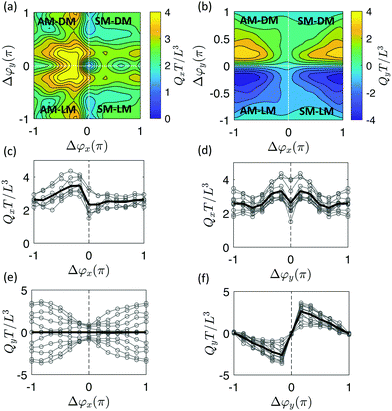
For the effect of Δϕx, antiplectic metachronal waves produce a larger directional average volumetric flow rate Qx when Δϕx ∈ [−π/2, −π/6] than the symplectic waves (Fig. 4a and c). Our simulation results are in close agreement with the experiments that studied the effect of Δϕx with Δϕy = 0.26 We know from previous studies26,28,52,54 that, despite the different cilia kinematics, the average flow for antiplectic waves is larger than from symplectic waves. The reason for this phenomenon is the shielding effect, meaning that the flow that is generated by each cilium is obstructed by the cilia surrounding it. Both the positive flow (Qxp) caused by the effective stroke and the negative flow (Qxn) caused by the recovery stroke decrease compared to synchronous waves28 due to shielding. When the shielding effect is more prominent for the negative flow than for the positive flow, the net flow will be larger and vice versa. Fig. 5a shows that for antiplectic waves, the negative flow is more obstructed than for the symplectic waves, resulting in larger net flow for antiplectic metachrony. It is interesting to note that for a kinematically different motion28 also AM was found to be more efficient, but with the shielding effect leading to an enhanced positive flow instead of a reduced negative flow as we found here.
In Fig. 4a and d, we see that diaplectic metachrony and laeoplectic metachrony can increase the flow rate Qx further for Δϕy ∈ [−π/2, −π/6] ∪ [π/6, π/2]. This phenomenon can also be explained by the shielding effect, as shown in Fig. 5b, where the negative flow is more obstructed than the positive flow, especially in the region Δϕy ∈ [−π/2, −π/6] ∪ [π/6, π/2] where all six cilia in a lateral row have different phases. This fact results in stronger flow for Δϕy ∈ [−π/2, −π/6] ∪ [π/6, π/2]. By combining these two factors, we found a maximum Qx for antiplectic-laeoplectic metachronal waves with and Δϕy ∈ [π/6, π/2] and, similarly, for antiplectic-diaplectic metachronal waves with Δϕx ∈ [−π/2, −π/6] and Δϕy ∈ [−π/2, −π/6].
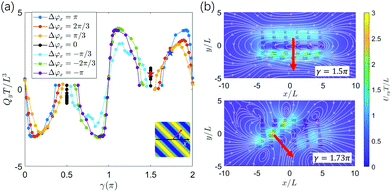
To further investigate the effect of metachrony on the secondary flow Qy, we analyze the direction of the metachronal wave. The metachronal wave direction is described by the angle of the wave with the positive x-direction, denoted as γ ∈ [0,2π] with tanγ = (−Δϕy)/Δϕx·c. Here, c = Lx/Ly is a geometrical factor that incorporates the relative spacing of the cilia, see Fig. 3. The fluid volume Qy for all cases studied is plotted as a function of γ in Fig. 6a (movies of a selection of these cases can be found in the ESI,†i.e. ESI,† 10–14). We observe that Qy is zero when γ = 0 or π, i.e. when Δϕy = 0 and the wave only travels in the horizontal (primary) direction. For the cases with γ = π/2 and γ = 3π/2, the metachronal wave travels along the y-axis with Δϕx = 0. As can be observed in Fig. 6b, the flow pattern is almost circular, generating only a very small flow travelling in the y-direction. The small flow in these cases occurs because of a peristalsis-like mechanism, pushing the fluid in the direction of the metachronal wave. We see from Fig. 6b that the secondary flow direction coincides with the metachronal wave direction γ and peaks at wave directions that are at an angle of around π/4 with the principal axes.
 | ||
| Fig. 7 The volumetric flow rate Qx (a) and Qy (b) as a function of cilia spacing Lx and Ly at a fixed phase shift and Δϕy = π/6. The red point indicates the reference spacing used in Fig. 3–6. | ||
Fig. 7a shows that Qx decreases with an increase in spacing Lx due to a reduction of cilia density in the flow direction. However, here the lateral spacings between cilia Ly also has an effect on primary flow Qx, with a pronounced minimum for spacings around Ly = 1.5W. To investigate this further, we plot the negative and positive flow as a function of Ly for a fixed value of Lx (=4L) in Fig. S4 (ESI†). It can be observed that both Qxp and Qxn increase with spacing Ly due to a reduction in shielding. However, since the dependences of Qxp and Qxn on Ly differ, a maximum total flow is reached around Ly = 1.5W. Fig. 7b shows a similar effect of cilia density on flow, with a decreasing flow Qy with increasing spacing Ly. The effect of Lx on Qy is small.
2.3 Fluid mixing induced by a 6 × 6 cilia array
In addition to fluid transport, fluid mixing is another function that can be achieved by metachronal cilia beating. Similar to the single cilium mixing analysis, we use the forward evolution of tracer particles62 with an initial distribution in patterns of two colours, as shown in Fig. 8a. The propagating tracer particles displace in time, see Fig. 8b for the particle distribution after one cycle. To quantitatively explore the effect of the metachronal phase lag Δϕ on fluid mixing, the fluid mixing rate β due to different ciliary motions is studied for various cases with Δϕx ranging from −π to π and Δϕy from 0 to π (see Fig. 9). As discussed above, the system is fully symmetric with respect to laeoplectic and diaplectic metachrony, so we only compute β for laeoplectic metachrony and use the inherent symmetry to generate the results for diaplectic metachrony. | ||
| Fig. 8 3D tracer particle distribution for Δϕx = π/6 and Δϕy = π/6 at a fixed spacing Lx = 1.75L and Ly = 0.75W at initial time t = 0 (a) and after one beating cycle t = T (b). | ||
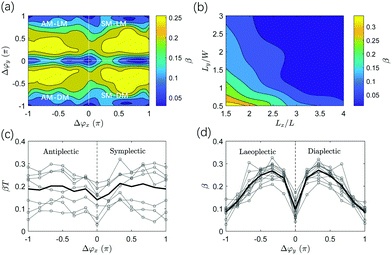
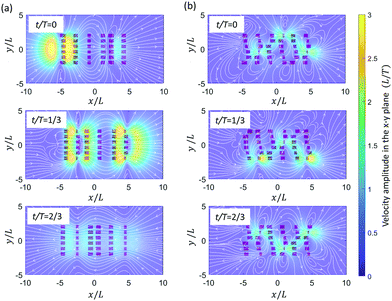
We observe in Fig. 9a and c that both antiplectic metachronal beating as well as symplectic beating can enhance the fluid mixing rate compared to synchronous motion (Δϕx = 0 and Δϕy = 0), in accordance with previous studies.53,63 However, where the previous studies only focused on metachronal waves in the primary direction (Δϕy = 0), here, we also show that the mixing rate β is strongly enhanced by laeoplectic (and diaplectic) metachrony, increasing it by more than twice when Δϕy∈ [π/6, π/2] ∪ [−π/6, −π/2] compared to Δϕy = 0 (see Fig. 9d). From a comparison between Fig. 9c and d, it follows that the fluctuations due to a variation of Δϕx are rather shallow and discrete, but that the principal effect on the mixing rate is due to variations in Δϕy, creating trends that are much more pronounced than the local variations in the plateau region shown in Fig. 9a. The velocity field in the plane z = L is shown in Fig. 10. It is almost uniform for Δϕy = 0 (Fig. 10a), but for the velocity field is strongly inhomogeneous with pronounced velocity gradients (Fig. 10b). Because of the existence of both Δϕx and Δϕy, all the 6 cilia in a row and column have different phases. The cilia in the effective stroke generate a strong forward flow while those in the recovery stroke generate a backward flow. This leads to clockwise and anticlockwise vortex-like flow patterns formed between the neighbouring cilia which results in a largely increased mixing process. This phenomenon underlines the importance of combining LM (and DM) in the secondary direction with AM and SM in the primary direction to enhance mixing.
To study the effect of cilia spacing, Fig. 9b shows the effect of Lx and Ly on the mixing rate for Δϕx = −2π/3 and Δϕy = π/6. The initial positions of the 20 × 10 × 10 particles in the x, y, and z directions are scaled with the box dimensions. We observe that the fluid mixing rate β increases when the cilia spacing Lx and Ly decreases. Clearly, by placing cilia closer together, the local flow profiles become more non-uniform, enhancing the propensity to form vortex-like flow patterns, which enhances mixing.
3 Conclusions
We computationally studied fluid transport and mixing by magnetically-programmable artificial cilia surfaces at low Reynolds number, using the finite element method. The beating kinematics of magnetically-actuated cilia with pre-programmed magnetization profiles was studied to explore the induced flow and mixing due to one single cilium. We showed that the induced primary volumetric flow rate, in the beating direction, Qx strongly correlates with the swept area, which can be tuned through the magnetization profile to be positive as well as negative. Flow in the secondary direction Qy (perpendicular to the primary direction) was found to be two orders of magnitude smaller than in the primary direction. The single cilium mixing rate maximizes around the regions where the swept area is maximially positive or negative.To mimic the collective metachronal waves of biological cilia, a 6 × 6 cilia array was investigation. Flow in the primary direction was found to be larger for antiplectic metachrony compared to symplectic metachrony due to the enhanced shielding of negative flow in case of antiplectic metachrony. The effect of laeoplectic metachrony (and diaplectic metachrony) on primary flow was found to be symmetric, resulting in a small increase of flow compared to synchronous beating in the secondary direction. Also here, this increase was found to be due to enhanced shielding of negative flow. The effect of metachrony on secondary flow is of a completely different origin and can be ascribed to the metachronal wave direction γ leading to a strongly-enhanced flow for wave directions that are at an angle of approximately π/4 with the principal (primary and secondary) axes. Finally, we found that laeoplectic metachrony and diaplectic metachrony strongly enhance the mixing rate compared to synchronous, antiplectic and symplectic metachronal waves which is caused by a very inhomogeneous flow field with large velocity gradients inducing local vortex-like flow patterns. The results of this study can be used as a guideline for the design of programmable ciliated surfaces with optimal fluid transport and mixing rates.
Conflicts of interest
There are no conflicts to declare.Acknowledgements
We would like to thank Xiaoguang Dong and Metin Sitti (Max Planck Institute for Intelligent Systems, Stuttgart, Germany) for insightful discussions. Rongjing Zhang is financially supported by the Chinese Scholarship Council. The authors would like to thank the Centre for High-Performance Computing at the University of Groningen for providing HPC resources and support.Notes and references
- E. M. Purcell, Am. J. Phys., 1977, 45, 3–11 CrossRef.
- J. Gray and J. S. Gardiner, Proc. R. Soc. London, Ser. B, 1922, 93, 104–121 CAS.
- S. Gueron and K. Levit-Gurevich, Proc. Natl. Acad. Sci. U. S. A., 1999, 96, 12240–12245 CrossRef CAS PubMed.
- S. L. Tamm, J. Cell Biol., 1972, 55, 250 CrossRef CAS PubMed.
- M. Fliegauf, T. Benzing and H. Omran, Nat. Rev. Mol. Cell Biol., 2007, 8, 880–893 CrossRef CAS PubMed.
- W. Gilpin, M. S. Bull and M. Prakash, Nat. Rev. Phys., 2020, 2, 74–88 CrossRef.
- J. Elgeti, R. G. Winkler and G. Gompper, Rep. Prog. Phys., 2015, 78, 056601 CrossRef CAS PubMed.
- P. Satir and S. T. Christensen, Annu. Rev. Physiol., 2007, 69, 377–400 CrossRef CAS PubMed.
- G. J. Pazour and G. B. Witman, Curr. Opin. Cell Biol., 2003, 15, 105–110 CrossRef CAS PubMed.
- A. Shields, B. Fiser, B. Evans, M. Falvo, S. Washburn and R. Superfine, Proc. Natl. Acad. Sci. U. S. A., 2010, 107, 15670–15675 CrossRef CAS PubMed.
- O. H. Shapiro, V. I. Fernandez, M. Garren, J. S. Guasto, F. P. Debaillon-Vesque, E. Kramarsky-Winter, A. Vardi and R. Stocker, Proc. Natl. Acad. Sci. U. S. A., 2014, 111, 13391–13396 CrossRef CAS PubMed.
- W. Gilpin, V. N. Prakash and M. Prakash, Nat. Phys., 2017, 13, 380–386 Search PubMed.
- M. R. Knowles and R. C. Boucher, et al. , J. Clin. Invest., 2002, 109, 571–577 CrossRef CAS.
- R. Faubel, C. Westendorf, E. Bodenschatz and G. Eichele, Science, 2016, 353, 176–178 CrossRef CAS PubMed.
- A. Alexeev, J. Yeomans and A. C. Balazs, Langmuir, 2008, 24, 12102–12106 CrossRef CAS PubMed.
- M. Sitti, Nat. Rev. Mater., 2018, 3, 74–75 CrossRef.
- M. Cianchetti, C. Laschi, A. Menciassi and P. Dario, Nat. Rev. Mater., 2018, 3, 143–153 CrossRef.
- R. M. Arco, J. R. Vélez-Cordero, E. Lauga and R. Zenit, Bioinspiration Biomimetics, 2014, 9, 036007 CrossRef PubMed.
- V. Cacucciolo, J. Shintake, Y. Kuwajima, S. Maeda, D. Floreano and H. Shea, Nature, 2019, 572, 516–519 CrossRef CAS PubMed.
- H. A. Stone, A. D. Stroock and A. Ajdari, Annu. Rev. Fluid Mech., 2004, 36, 381–411 CrossRef.
- C.-Y. Lee, C.-L. Chang, Y.-N. Wang and L.-M. Fu, Int. J. Mol. Sci., 2011, 12, 3263–3287 CrossRef CAS PubMed.
- X. Zhang, J. Guo, X. Fu, D. Zhang and Y. Zhao, Adv. Intelligent Systems, 2020, 2000225 CAS.
- M. Vilfan, A. Potočnik, N. Osterman, I. Poberaj, A. Vilfan and D. Babič, Proc. Natl. Acad. Sci. U. S. A., 2010, 107, 1844–1847 CrossRef CAS PubMed.
- S. Zhang, Z. Cui, Y. Wang and J. M. den Toonder, Lab Chip, 2020, 20, 3569–3581 RSC.
- S. Zhang, R. Zhang, Y. Wang, P. R. Onck and J. M. den Toonder, ACS Nano, 2020, 14, 10313–10323 CrossRef CAS PubMed.
- X. Dong, G. Z. Lum, W. Hu, R. Zhang, Z. Ren, P. R. Onck and M. Sitti, Sci. Adv., 2020, 6, eabc9323 CrossRef CAS PubMed.
- W. Jiang, L. Wang, H. Liu, H. Ma, H. Tian, B. Chen, Y. Shi, L. Yin and Y. Ding, RSC Adv., 2014, 4, 42002–42008 RSC.
- S. N. Khaderi, J. M. J. den Toonder and P. R. Onck, J. Fluid Mech., 2011, 688, 44–65 CrossRef.
- E. M. Gauger, M. T. Downton and H. Stark, Eur. Phys. J. E: Soft Matter Biol. Phys., 2009, 28, 231–242 CrossRef CAS PubMed.
- N. Banka, Y. L. Ng and S. Devasia, J. Med. Dev., 2017, 11, 031003 CrossRef.
- H. Zeng, P. Wasylczyk, D. S. Wiersma and A. Priimagi, Adv. Mater., 2018, 30, 1703554 CrossRef PubMed.
- A. H. Gelebart, M. Mc Bride, A. P. Schenning, C. N. Bowman and D. J. Broer, Adv. Funct. Mater., 2016, 26, 5322–5327 CrossRef CAS.
- L. D. Zarzar, P. Kim and J. Aizenberg, Adv. Mater., 2011, 23, 1442–1446 CrossRef CAS PubMed.
- E. Milana, B. Gorissen, S. Peerlinck, M. De Volder and D. Reynaerts, Adv. Funct. Mater., 2019, 29, 1900462 CrossRef.
- H. Gu, Q. Boehler, H. Cui, E. Secchi, G. Savorana, C. De Marco, S. Gervasoni, Q. Peyron, T.-Y. Huang and S. Pane, et al. , Nat. Commun., 2020, 11, 1–10 CrossRef PubMed.
- Y. Collard, G. Grosjean and N. Vandewalle, Commun. Phys., 2020, 3, 1–10 CrossRef.
- S. Childress, Mechanics of Swimming and Flying, Cambridge University Press, 1981 Search PubMed.
- J. Blake, J. Fluid Mech., 1972, 55, 1–23 CrossRef.
- J. Elgeti and G. Gompper, Proc. Natl. Acad. Sci. U. S. A., 2013, 110, 4470–4475 CrossRef CAS PubMed.
- J. R. Blake, J. Fluid Mech., 1971, 46, 199–208 CrossRef.
- S. Michelin and E. Lauga, Phys. Fluids, 2010, 22, 111901 CrossRef.
- S. Michelin and E. Lauga, Phys. Fluids, 2011, 23, 101901 CrossRef.
- H. Guo, J. Nawroth, Y. Ding and E. Kanso, Phys. Fluids, 2014, 26, 091901 CrossRef.
- A. C. Balazs, A. Bhattacharya, A. Tripathi and H. Shum, J. Phys. Chem. Lett., 2014, 5, 1691–1700 CrossRef CAS PubMed.
- A. Tripathi, A. Bhattacharya and A. C. Balazs, Langmuir, 2013, 29, 4616–4621 CrossRef CAS PubMed.
- Z. Guo, C. Zheng and B. Shi, Phys. Rev. E: Stat., Nonlinear, Soft Matter Phys., 2002, 65, 046308 CrossRef PubMed.
- S. Chateau, J. Favier, U. D’Ortona and S. Poncet, J. Fluid Mech., 2017, 824, 931–961 CrossRef.
- S. Khaderi and P. Onck, J. Fluid Mech., 2012, 708, 303 CrossRef.
- S. Gueron, K. Levit-Gurevich, N. Liron and J. J. Blum, Proc. Natl. Acad. Sci. U. S. A., 1997, 94, 6001–6006 CrossRef CAS PubMed.
- D. Smith, E. Gaffney and J. Blake, Bull. Math. Biol., 2007, 69, 1477–1510 CrossRef CAS PubMed.
- N. Osterman and A. Vilfan, Proc. Natl. Acad. Sci. U. S. A., 2011, 108, 15727–15732 CrossRef CAS PubMed.
- E. Milana, R. Zhang, M. R. Vetrano, S. Peerlinck, M. De Volder, P. R. Onck, D. Reynaerts and B. Gorissen, Sci. Adv., 2020, 6, eabd2508 CrossRef CAS PubMed.
- Y. Ding, J. C. Nawroth, M. J. McFall-Ngai and E. Kanso, J. Fluid Mech., 2014, 743, 124–140 CrossRef.
- R. Zhang, J. den Toonder and P. R. Onck, Phys. Fluids, 2021, 33, 092009 CrossRef CAS.
- B. Gorissen, M. De Volder and D. Reynaerts, Lab Chip, 2015, 15, 4348–4355 RSC.
- R. Marume, F. Tsumori, K. Kudo, T. Osada and K. Shinagawa, Jpn. J. Appl. Phys., 2017, 56, 06GN15 CrossRef.
- S. Hanasoge, P. J. Hesketh and A. Alexeev, Soft Matter, 2018, 14, 3689–3693 RSC.
- S. Zhang, Z. Cui, W. Ye and J. den Toonder, ACS Appl. Mater. Interfaces, 2021, 13, 20845–20857 CrossRef CAS PubMed.
- J. R. Blake, Math. Proc. Cambridge Philos. Soc., 1971, 70, 303–310 CrossRef.
- J. B. Weiss and A. Provenzale, Transport and mixing in geophysical flows, Springer, 2007, vol. 744 Search PubMed.
- S. Khaderi, M. Baltussen, P. Anderson, D. Ioan, J. Den Toonder and P. Onck, Phys. Rev. E: Stat., Nonlinear, Soft Matter Phys., 2009, 79, 046304 CrossRef CAS PubMed.
- Z. Stone and H. A. Stone, Phys. Fluids, 2005, 17, 063103 CrossRef.
- S. Chateau, U. d'Ortona, S. Poncet and J. Favier, Front. Physiol., 2018, 9, 161 CrossRef PubMed.
Footnote |
| † Electronic supplementary information (ESI) available. See DOI: https://doi.org/10.1039/d1sm01680f |
| This journal is © The Royal Society of Chemistry 2022 |

