Cationic surfactant-directed structural control of NaCl crystals from evaporating sessile droplets†
Jayant K.
Dewangan
a,
Nandita
Basu
b and
Mithun
Chowdhury
 *a
*a
aLab of Soft Interfaces, Department of Metallurgical Engineering and Materials Science, Indian Institute of Technology Bombay, Mumbai 400076, India. E-mail: mithunc@iitb.ac.in
bDepartment of Chemistry, Indian Institute of Technology Bombay, Mumbai 400076, India
First published on 23rd November 2021
Abstract
We report morphological regulation of NaCl (sodium chloride) crystals through the evaporative crystallisation process of microdroplets containing a cationic surfactant CTAB (cetyltrimethylammonium bromide). Various fascinating evaporative salt morphologies are observed using different combinations of salt (CNaCl) and surfactant (CCTAB) concentrations. Each observed morphology is carefully explained by the interplaying physical phenomena, such as crystallisation, micellisation, evaporative dewetting, and surface adsorption of anionic couneterions. Salt morphologies are investigated for low (CNaCl = 0.1 (M)), intermediate (CNaCl = 0.5 (M)) and high (CNaCl = 2 (M)) concentrations, whereas surfactant concentrations are varied four orders of magnitudes (from 0.0001 (M) to 0.1 (M)). Interestingly, we observe a threshold in CCTAB at 0.001 (M), beyond which the peripheral rings of dried deposits are found to be composed of CTAB for CNaCl = 0.1 (M), while the same is seen to be made up of NaCl for CNaCl = 2 (M). We have explained the morphological evolution by the process of competitive surface adsorption phenomenon between Cl− and Br− counter ions. Such a detailed study of saline droplet crystallisation in the presence of a cationic surfactant underpins the fundamental understanding of the crystallisation process. In addition, it may further impact application sectors where crystallisation of saline solution plays an important role, especially in the presence of additives.
Introduction
Sodium chloride is the most common salt on earth and is used for various purposes, such as in food and paper production, and as an essential de-icing component to melt the snow on the road during winter. During de-icing, the dissolved salt water penetrates through the cracks in the streets, which then combines with the groundwater leading to capillary-wicking mediated lifting of the salt solution within the buildings. Crystallisation pressure generated during the growth of these salt crystals can lead to efflorescence,1 cause cracks and create damage. Therefore, knowledge of evaporative crystallisation is essential to prevent such deterioration of stone-made building materials or statues that usually remain exposed to the weather.2,3 To avoid this difficulty, modification of crystallisation phenomena by using additives has known to be a significant approach which leads to the prevention of evolution of crystallisation pressure.4,5NaCl crystals are generally obtained as a cubic lattice. Its various crystallographic forms depend on the corresponding surface energies of different crystallographic planes of the crystal.6,7 Dendritic patterns with branching are also obtained when the crystal growth rate is reasonably decreased in the presence of additives. The morphology of crystals grown in a gel-like viscous solution is generally governed by the diffusion of solutes, as gel media typically suppress the mobility of ions. Densification of the media decreases the rate of solute diffusion and finally results in the development of various diffusion-limited morphologies, including dendrites and branches.8–10 Several theoretical11,12 and experimental13,14 studies are available in the literature explaining the diffusion-limited branching growth process in the presence of additives such as biological molecules (including proteins and their associated forms)15–20 and polymers.21 Surfactants are known to be a significant category of additives, in which the crystal growth process gets significantly modified.22–24 When present in lower proportions, these surfactant molecules can be preferentially adsorbed onto different faces of crystals. Surfactants can also be adsorbed at solid–liquid interfaces, which has a significant impact on the processes of crystal nucleation and growth.23,24 Interaction between electrolytes and surfactants has become a large field of research due to many applications spanning through industrial to domestic needs. Surfactants have also been used for shape modification of inorganic crystals using electro-deposition technique.25,26 But the role of surfactants in the crystallisation process has been a matter of debate. Although most of the studies claim that the process of crystallisation gets inhibited in the presence of surfactants, still, some of the studies have shown that the rate of nucleation or the crystal growth process gets significantly faster in the presence of surfactants.27 In this regard, Shahidjadeh and co-workers28 recently demonstrated that both non-ionic and cationic surfactants remain stable in an aqueous solution even at a very high salt concentration close to the saturation point of NaCl. In the presence of these surfactants, crystallisation gets significantly delayed leading to very high supersaturation, which in turn modifies the kinetics of the crystal growth process.28
Evaporation-driven drying mediated fabrication of large area, uniform films of colloidal,29–32 polymeric33,34 and biological fluids35,36 on solid substrates has been a subject of extensive study amongst scientists in the last few decades. While the fundamental understanding and easiness of experimental accessories are the main drivers for such studies, one cannot deny its enormous importance in several valuable fields, such as biological diagnostic processes,36 painting and coating industries,37 inkjet printing and printed electronics,38,39 microfluidics,40 and many others. The most general morphology as a result of this evaporation-driven drying process is a coffee-like stain29,41,42 at the pinned periphery of drying droplets, which appears due to the accumulation of maximum solute particles there transported by a capillary drag created by the highest evaporation rate at the edge. Due to the uniformity required for most applications, several strategies have been employed to avoid such inhomogeneous structures43–45 by converting the radially outward capillary flow into an inward solutal Marangoni flow.46 Crystallisation during liquid evaporation within a droplet-based system47,48 is of paramount fundamental importance. This is associated with complex evaporation and supersaturation-based drying processes. Temperature, concentration, and relative humidity are the main factors affecting the essential droplet shape-guiding functions here.21,49–52 In a recent publication, one of us has shown how the morphology of NaCl crystal is modulated and remarkably varies in the presence of an anionic surfactant sodium dodecyl sulfate (SDS).48
Under ambient humidity-controlled conditions, utilizing the advantages of evaporation-driven drying mediated structuring in sessile droplets, using a cationic surfactant CTAB as an additive across different concentrations (CCTAB), we have shown diverse crystalline morphologies of NaCl, which have not been reported previously. The presence of surfactants significantly reduces the droplet surface tension and water vapour pressure, leading to faster crystallisation dynamics and a much shorter drying (solidification) time. A threshold in CCTAB has been observed at 0.001 (M), beyond which the principal component of the droplet peripheral rings is seen to be CTAB for a low concentration of salt (CNaCl = 0.1 (M)). In contrast, the same is composed mainly of NaCl for a high salt concentration (CNaCl = 2 (M)). Based on the interplay of several physical phenomena, like the crystallisation of salt, micellisation of surfactant, the process of competitive surface adsorption between Cl− and Br− counter ions., etc., such diverse deposit morphologies of salt and surfactant mixtures are explained. Such a detailed study on the morphological evolution of NaCl crystals using various combinations of salt and surfactants will enrich the fundamental understanding of saline droplet crystallisation, especially in the presence of additives, e.g., surfactants. The novelty of the current work lies in the simplicity of the experimental method, resource, and time effectiveness. At the same time, it boasts implications from the molecular length scale to the geological length scale involving many technological sectors, from food to conservation and transport.
Materials and methods
Sodium chloride (NaCl, extra pure) was purchased from Loba Chemie. Cetyltrimethylammonium bromide, ([(C16H33)N(CH3)3]Br, (CTAB) powder was obtained from Sigma-Aldrich. Five similar NaCl aqueous solutions of CNaCl = 0.1 (M) (0.58%) were prepared. Into each of the solution five different proportions of CTAB [CCTAB = 0.1 (M), 0.02 (M), 0.01 (M), 0.001 (M) and 0.0001 (M)] were added to prepare five different CTAB-NaCl solution mixtures where CNaCl remains constant, but CCTAB varies. For the second and third set of experiments, similarly, the mentioned five proportions of CCTAB were added to prepare five different solution mixtures each by keeping the salt concentration (CNaCl) fixed at an intermediate value of 0.5 (M) (2.92%) and a high value of 2 (M) (11.69%). CNaCl used in our study is much lower than the saturation concentration of NaCl (26.4%).53 The critical micelle concentration (CMC) of CTAB in pure water is usually 0.0009 (M). While the initial concentration of CTAB in one of the solution mixtures is kept well below CMC (0.0001 (M)), others have an initial CTAB content that is much above the CMC (0.001 (M), 0.01 (M), 0.02 (M), and 0.1 (M)). We measured solution viscosities for all the solution mixtures we have investigated in this study using an Ostwald viscometer. The results are presented in Table S1, ESI.† We compared the viscosity values of a few samples with those found using a rheometer (Discovery Hybrid HR1, TA Instruments). The solutions were made homogeneous using a shaker for a few minutes before dispensing each droplet to avoid agglomeration. Clean, smooth glass substrates have been used as the substrate in this study which has been thoroughly cleaned with acetone and water. It was completely dried right before performing each of the experiments. These hydrophilic substrates can be treated ideal for droplet evaporation and similar kind of crystallisation experiments.18,42Two μL of the droplet was dispersed on the substrate under an optical microscope using a microsyringe. The initial droplet diameter was varied between 2.1 to 2.9 mm depending on CNaCl and CCTAB. Droplets continued to spread for a certain time after dispensing, leading to ca. 0.1 to 0.4 mm increase in droplet diameters which also depends on CCTAB. The evaporation dynamics were followed in situ using a stereo zoom optical microscope (OLYMPUS-SZ2-ILST) attached to a digital CCD camera. The side profiles of the evaporating droplets were captured using a contact-angle goniometer (Dataphysics, model OCA15SEC). Detailed morphologies of the deposits were characterized using a scanning electron microscope (Hitachi S-3400N). The energy-dispersive X-ray spectroscopies (EDS) were carried out at several dried deposit regions for elemental analysis using an FESEM instrument (JEOL-JSM7600F). For differently branched crystalline deposits, different crystallographic planes were investigated using a PANalytical X’pert Pro, X-ray diffractometer (XRD) (voltage and current used 45 kV & 40 mA) using the Cu Kα line of the X-ray source (1.54184 Å). All experiments were performed at least five times for each CCTAB and CNaCl combination to confirm the reproducibility of the observed drying dynamics and pattern morphology. All the experiments were performed at 24 °C and 45% relative humidity (RH).
Results and discussion
Deposition, spreading, and drying behaviour of the CTAB containing NaCl solution droplets
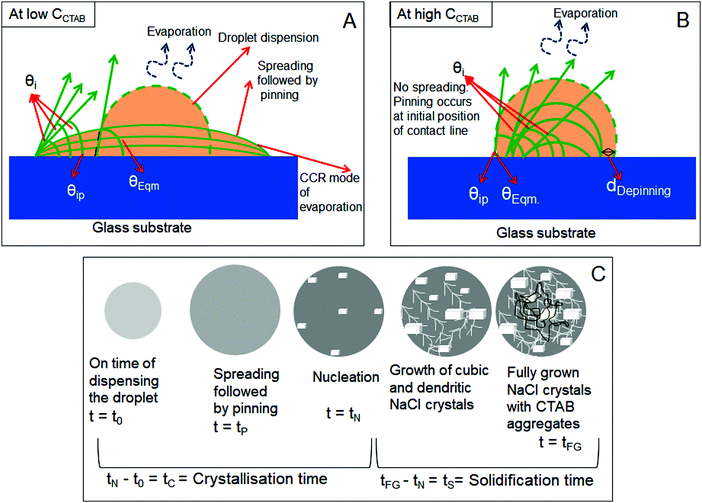
In this section, we have schematically presented the contact angles associated with the processes of dispensing [θEqm.(°)], spreading [θi (°)], and pinning [θiP (°)] of CTAB containing NaCl solution droplets of different concentrations on solid glass substrates. As the behaviour of spreading and pinning is different (will be discussed in detail in the next three sections) in the presence of various concentrations of surfactants, these two scenarios are shown separately in Fig. 1A and B. Fig. 1A shows that in the presence of low CCTAB, droplets spread significantly before getting pinned on glass substrates (for a certain period, tP). The spreading area starts to decrease with an increase in CCTAB. Droplets get immediately pinned on their initial deposition position in the presence of a significant amount of CCTAB. [0.1 (M) in our study] irrespective of CNaCl, as shown in Fig. 1B. In this case, the contact line starts to move inward and, after traversing a certain distance, gets pinned for the second time. The radial distance between the double pinned zones is dDepinning, as presented using a black arrow in Fig. 1B. The value of dDepinning depends on CNaCl. θEqm. (°) is the contact angle obtained right after dispensing the droplet on the substrate. θi (°) is the contact angle at a particular time obtained during evaporation, and θiP (°) is the contact angle obtained during the pinning of the contact line on the substrate. We note that the schematic representation in Fig. 1C is not focused on any particular combination of CCTAB and CNaCl presented in this study rather for a better understanding of all the time scales associated with the general process of nucleation and growth of NaCl crystals in the presence of CTAB. The time we dispense the droplet is t0. After a certain time, the spreading droplet gets pinned on the substrate. The time when a few tiny crystalline domains start to nucleate from the supersaturated solution is called the nucleation time (tN). The time gap between nucleation and droplet dispensing is called the crystallisation time (tC). At the end of the complete drying process, fully grown crystals are obtained within the drying deposits. Thus, the time lag between the complete growth of crystals and nucleation initiation is the solidification time (tS). In other words, this is the duration of the entire growth period of crystals.Evaporative salt morphologies from low concentration (0.1 (M)) NaCl solution droplets in the presence of various amounts of CTAB
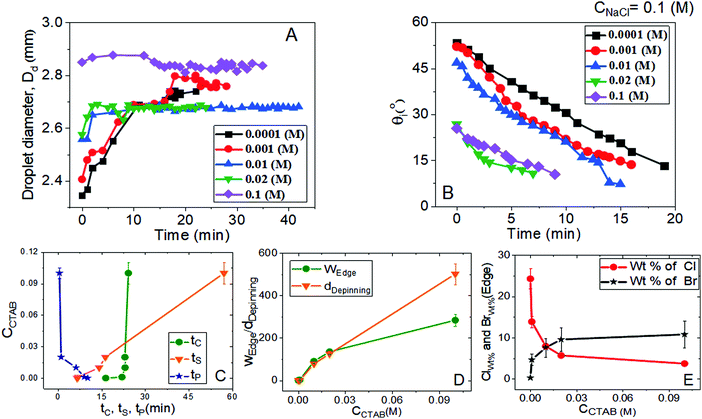
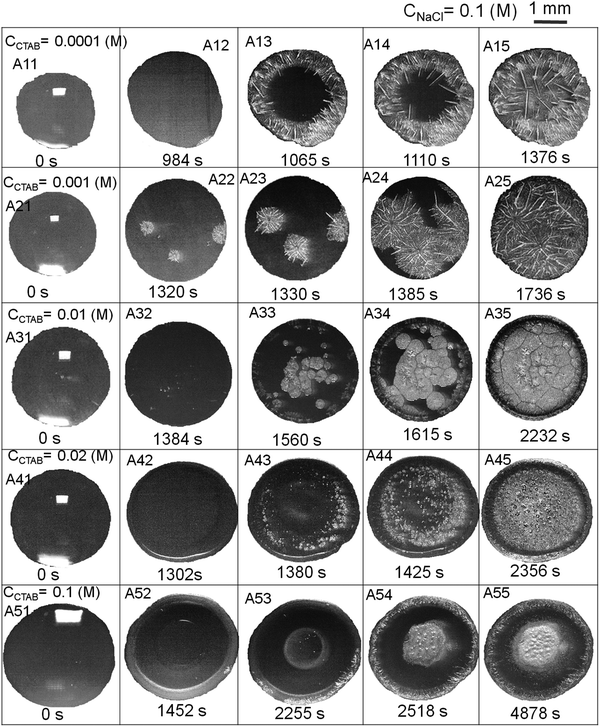
Relevant salient features and the route of evaporative crystallisation of NaCl are shown in Fig. 2–4 and Table S2 (ESI†). In each solution, the salt concentration, CNaCl was kept constant at a value of 0.1 (M), while the concentration of the cationic surfactant CCTAB was varied. Several stages of real-time evaporation-mediated drying processes of NaCl solution droplets in the presence of CTAB, along with the final salt deposits, are shown in Fig. 3.From Fig. 2A and B, the diameter of the droplets (Dd) and the time-dependent contrast in intrinsic contact angle (θi) can be seen with progressive water loss from the evaporative systems. Fig. 2A, 3 and Table S2 (ESI†) simultaneously show the spreading and pinning behaviours of the droplets. At a relatively lower value of CTAB, i.e., CCTAB ≤ 0.001 (M), the equilibrium contact angle (θEqm.) shows a value of ca. 55°. Here the duration and the extent of droplet spreading become significantly high leading to a longer pinning time (tP), as seen in frames A11 and A12 in Fig. 3.
In contrast, with a progressive increase in CCTAB, a larger area is covered by the droplets right upon dispensing (frames A21, A22, A31, and A32 in Fig. 3), associated with a decrease in the θEqm. value to ca. 45° (Fig. 2A). Eventually, the duration of initial spreading gets sufficiently reduced, leading to earlier pinning and lower tP values. At a significantly high CCTAB of 0.1 (M), the droplet gets immediately pinned at the initial deposition position right after dispensing (A51 and A52 in Fig. 3) without further spreading, leading to a significant reduction in both tP and θEqm. values (to ca. 27°). This implies that the addition of more surfactant reduces the surface tension and eventually leads to a decrease in θEqm. CCR (constant contact radius) mode of evaporation continues once the droplets get pinned. The difference between the pinning time (tP) and the crystallisation time (tC) also increases with CCTAB (Table S2, ESI†), which implies that at low CCTAB, events of pinning and nucleation occur almost closely. In contrast, these two phenomena occur at a more significant time gap at CCTAB > 0.001 (M).
It can be seen from Fig. 2C that tP decreases progressively with CCTAB. In contrast, both tC and tS exhibit an increasing trend with increasing proportions of CCTAB. Interestingly, at CCTAB ≤ 0.001 (M), the values of tS are seen to be remarkably low, which indicates the faster growth period of NaCl crystals; tS increases beyond a CCTAB of 0.001 (M). At a large proportion of CCTAB (0.1 M), a long solidification time tS (ca. 57 minutes) is observed, which is indicative of the remarkably high growth period of the salt crystals. θiP in Table S2 (ESI†) indicates the values of intrinsic contact angles for different CCTAB at which pinning phenomena occur. Low values of θiP at CCTAB ≤ 0.001 (M) point out that the pinning of contact line occurs once the liquid film gets significantly flat and simultaneously turns supersaturated, enabling instantaneous nucleation and much faster growth of crystals. Beyond this, θiP increases with an increase in CCTAB.
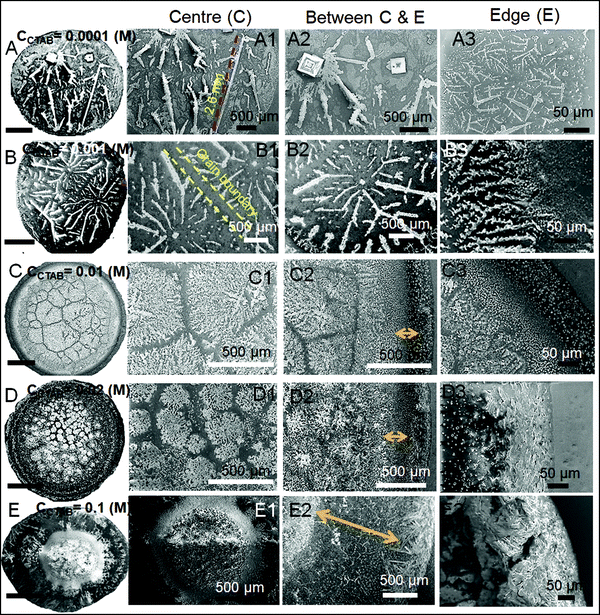
A wide range of crystalline morphologies can be seen from Fig. 4 as obtained from high-resolution SEM imaging at the different dried deposit regions. Interestingly, a threshold has been noticed at a CCTAB of 0.001 (M), beyond which the dried deposit is seen to contain a wide peripheral ring which gets even wider with further increase in CCTAB (see Fig. 2D and C3, D3 and E3 in Fig. 4). In contrast, at CCTAB ≤ 0.001 (M), the drying deposits are seen to be devoid of any peripheral ring (A3 and B3 in Fig. 4).
The evolution of various morphologies upon evaporation-driven drying of NaCl solution droplets in the presence of CTAB can be explained based on micellisation and competitive surface adsorption processes between negative counter ions. The characteristics of surfactant-containing inorganic salt solutions are controlled by the total molality of the mixture m, which can be expressed as54
| m = 2m1 + 2m2 | (1) |
 | (2) |
 | (3) |
The values of m1, m2, x1and x2 for different surfactants containing 0.1 (M) NaCl solutions are calculated and given in Table S3 of the ESI.†
Mole fraction of CTAB (x2) in the solution is a crucial parameter, and it determines the final deposit morphology. From Table S3 of the ESI,† it can be seen that at a constant CNaCl of 0.1 (M), while the initial mole fraction of NaCl in the mixture (x1) decreases, there is a simultaneous increase in x2 with a gradual rise in CCTAB. Although x1 and x2 change gradually with the solvent loss from the system. However, none of the solutions turn turbid even after the pinning occurs. This observation contradicts the previous impression where one of us studied NaCl salt morphologies at a constant concentration of the anionic surfactant SDS.48 There, it was shown that as soon as the droplet gets pinned on a low-energy PDMS substrate, it simultaneously achieves turbidity, which indicates the beginning of the process of salt solidification. Our current observation essentially indicated that while the process of NaCl crystal nucleation started quite earlier in the presence of SDS,48 it gets significantly delayed in the presence of CTAB. This observation is in perfect agreement with the results of Shahidjadeh-Bonn and co-workers, where an extensive study of NaCl crystallisation within a micro-channel from a highly saturated salt solution showed that CTAB acts as a crystallisation inhibitor or delays the process of crystallisation.28
The current study has been performed on glass substrates. The possible influence of the substrate on dried deposits was checked by carrying out similar experiments on cross-linked PDMS (Sylgard® 184, ca. 10–15 μm thick film coated on glass substrate) and on Si/SiOx (100)-wafers. Glass and Si/SiOx (100)-wafer substrates can be considered as hydrophilic high-energy substrates, whereas cross-linked PDMS is a low energy hydrophobic substrate. We noticed no remarkable differences in dried deposit morphologies, except for some minor differences, possibly related to the wettability of substrates (Fig. S1 of ESI†). This observation tentatively indicates that current crystallisation processes and morphological evolution are independent of any significant substrate-mediated influence.
As evident from Fig. 3, A15 and frames A1 and A2 in Fig. 4, a droplet with initial CCTAB < CMC has the evaporative deposit composed of a few extremely long (in mm range) ‘skeletal’ or ‘hopper’ NaCl crystals55 along with some thin branched morphologies scattered all over the deposit area. Nucleation of salt crystals begins from the pinned edge. A subsequent rapid growth of a few skeletal crystals is observed. These are directed towards the central part of the deposit footprint, in which a series of small-scale cubic crystals are seen to be interconnected, one by one, mostly without forming branches around. This interconnected hopper growth of crystals can be attributed to the adsorption of CTAB at the air–liquid interface, which crucially supports the nucleation from the solid–liquid interface or an essentially flat and highly supersaturated solution.55 This led to a significantly fast growth period of ca. 70 to 80 seconds of these millimeter-long crystals (Movie 1 of ESI†). Energy-dispersive X-ray spectroscopy (EDS) measurement on such a millimeter-long crystal also exhibits that the sodium (Na) and chlorine (Cl) contents are significantly higher. In comparison, carbon (C) and bromine (Br) contents are relatively lower, which essentially supports the formation and growth of skeletal NaCl crystals in the solution (Fig. S2 of ESI†).
Slightly above the CMC, at CCTAB = 0.001 (M), once droplets get pinned, very few nucleation points are generated (Fig. 3 A22, Movie 2 of ESI†) at close proximity from which growth of crystals starts simultaneously. Once the growing crystals are approaching nearer, the growth of these crystals is restricted by another crystal having a mismatch in orientation. Each of the oriented domain is a single grain. The growth stops eventually in that direction, due to which a new interface between the neighboring crystals is created. This interface is known as the grain boundary, as indicated by the parallel dotted lines in frame B2 in Fig. 4 (see also Movie 2 of the ESI†). This can be attributed to the rupture of the significantly thin liquid film occurring during the evaporative dewetting process, as previously shown by Christenson and co-workers.56 Here, small crystalline domains nucleate on the substrate and perforate the film due to surface contamination or defects. Radial growth of such rupturing crystalline domains can be considered as a radial hole growth. Consequently, 2D crystal dendrites get deposited as the liquid front retreats over the entire deposit footprint. Each of the grains can be considered as a dewetting cell. Steady growths of some continuous dendrites are also seen to be hindered in the presence of Rayleigh-type instability57 within each grain.
It is noteworthy that with the progressive increase in CCTAB, the number of grains increases. This can be attributed to the increase in solution viscosity due to the increasing composition of surfactants. As the grain boundaries appear at CCTAB > CMC, the viscosity increases swiftly with the inclusion of more surfactants.58 An increased proportion of surfactants also prohibits the crystal aggregation at the same region, leading to more nucleation sites, which can be considered surface defects. As a combination of these two factors, the number of grains increases, leading to a progressive reduction in the length of the skeletal crystals within each grain.
Measuring the viscosity of evaporating tiny droplets is experimentally challenging. Additionally, viscosity changes there continuously upon solvent evaporation from droplets. We measured the initial solution viscosities of all the salt-surfactant mixtures investigated in this study using an Ostwald viscometer. We have presented the results in Table S1 of the ESI.† From Table S1 (ESI†), it is clear that at a fixed value of CNaCl, the solution viscosity steadily increases with increasing CCTAB. Also, at a fixed value of CCTAB, the solution viscosity increases with increasing CNaCl, while this observation is prominent for high concentrations of salt and surfactant. This observation, along with the ranges of viscosity values we found, perfectly agrees with the existing literature, which suggests that the viscosity of salt–surfactant mixture in general increases with the inclusion of more surfactants and inorganic salts.58–60 However, the negligible influence of CTAB has been reported in the presence of very high CNaCl (5.5 (M)) and significantly low CCTAB (on the order of 0.001 (M)).59
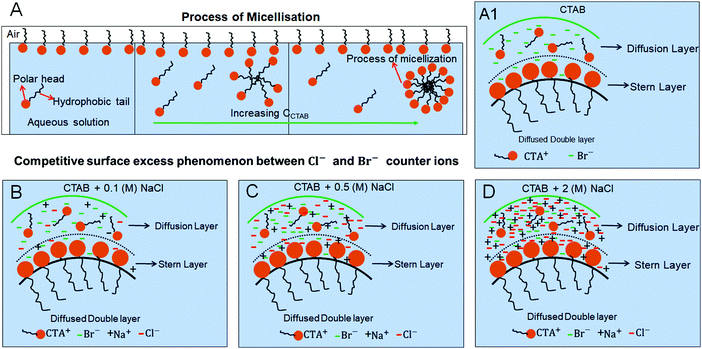
The process of micellisation is schematically shown in Fig. 5A without the presence of any salt. In our study, an increase in surfactant concentration (i.e., CCTAB) facilitates the micelle formation through micellisation. How the process of micellisation gets modified in the presence of a salt is the key point to understand. Cations (CTA+, Na+) and anions (Cl−, Br−) in solution (salt-surfactant mixtures) stay in both the Diffusion and Stern layers as schematically shown in Fig. 5. As peripheral rings are observed beyond 0.001 (M) of CCTAB, a generalised schematic is shown in the mentioned range of CCTAB for various CNaCl. Frames A1, B, C, and D in Fig. 5 represent the competitive surface excess phenomena between the negative counter ions in the absence of salt, a low amount of salt (0.1 (M), an intermediate amount of salt (0.5 (M), and a high amount of salt (2 (M)) respectively.
It is known that Br− counter ions are more effective in decreasing surface tension and micelle aggregation than Cl− ions.61 Upon the addition of a salt to the system, a competitive interaction between the negative counter ions, i.e., between Cl− and Br− ions starts playing a role in controlling the surface adsorption process. As the CTAB concentrations remain the same and the added concentration of the salt is low, i.e., 0.1 (M), the competitive interaction is less pronounced at CCTAB ≤ 0.001 (M) as the quantities of both Cl− ions and Br− ions are low and comparable. As a result, at CCTAB ≤ 0.001 (M), the deposited morphologies do not have any peripheral ring made of either NaCl salt or CTAB micelles. Instead, those comprise dendritic salt morphologies of different types. The peripheral ring-free final morphologies in the concentration zone of CCTAB ≤ 0.001 (M) also signify that a remarkably higher value of x1 and a lower value of x2 shift the CMC to a lower value leading to the prohibition of micelle formation (see Table S3 of ESI†). Thus nucleation occurs from an extremely flat and supersaturated thin liquid film.
Beyond CCTAB of 0.001 (M), i.e., significantly above the CMC,61 the number of Br− ions exceeds over the number of Cl− ions in both the diffusion and stern layers leading to a surface excess of Br− ions (see frame B in Fig. 5). As a large number of free Br− ions are available on the droplet surface, the formation of a more significant number of micelles is facilitated, while the salt concentration remains the same at CNaCl = 0.1 (M). These free micelles are dispersed over the whole droplet surface. During evaporation, the mole fraction of CTAB (x2) continues to increase as compared to the mole fraction of salt (x1) as can be seen from Table S3 of the ESI.† As a result, the movement of the dispersed micelles towards the pinned droplet edge takes place by an outward capillary drag. The accumulation of many micelles at the droplet's peripheral zone leads to the formation of CTAB micellar rings well before the nucleation begins (see frames A32, A42, A52 in Fig. 3). This observation can be confirmed by the electron dispersive X-ray spectroscopy measurements carried out at the edge. Fig. 2E shows that while the proportion of bromine at the peripheral zone increases, the same for chlorine decreases with an increase in CCTAB. Further rise in CCTAB leads to a steady increase in the value of x2 which is also associated with the increased surface excess of Br− ions. As a result, the number of micelle aggregates at the droplet periphery increases, and the peripheral ring gets wider (see Movie 3 and 4 of ESI†).
After forming the outer ring, the contact line gets disconnected from it and continues to retreat inward and gets pinned again after traversing a certain distance, dDepinning, which also increases with CCTAB (see Fig. 2D). At CCTAB = 0.1 (M), a significant number of micellar molecules are used up in the formation of a thick outer ring leading to the largest drop in the local value of x2 among all the droplets. Eventually, dDepinning is greatly enhanced (see Movie 4 of ESI†). This observation can be attributed to a notable enhancement in the diffusivity of Br− ions due to the significant extent of surface excess in the remaining solution. Thus enhanced diffusion-controlled transport of the dissociated Br− ions and inward Marangoni flow simultaneously shield the outward capillary flow and delay the contact line's further pinning. The liquid front continues to retreat until the solution becomes highly saturated with salt and surfactant molecules leading to a small area of centrally deposited patterns. The pinning event is associated with a turbid appearance of the solution (frame A53 in Fig. 3). Many of the tiny crystalline domains were seen to be nucleated within such smaller areas, the growth of which could not be clearly followed in the presence of a significant amount of surfactant molecules.
Evaporative salt morphologies from intermediate concentration (0.5 (M)) of NaCl solution droplets in the presence of different amounts of CTAB
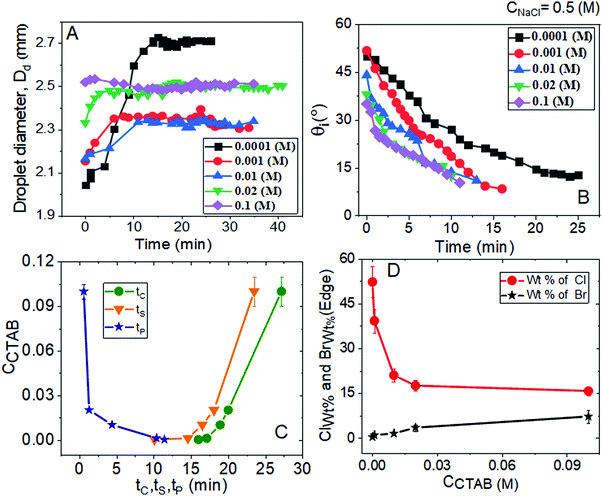
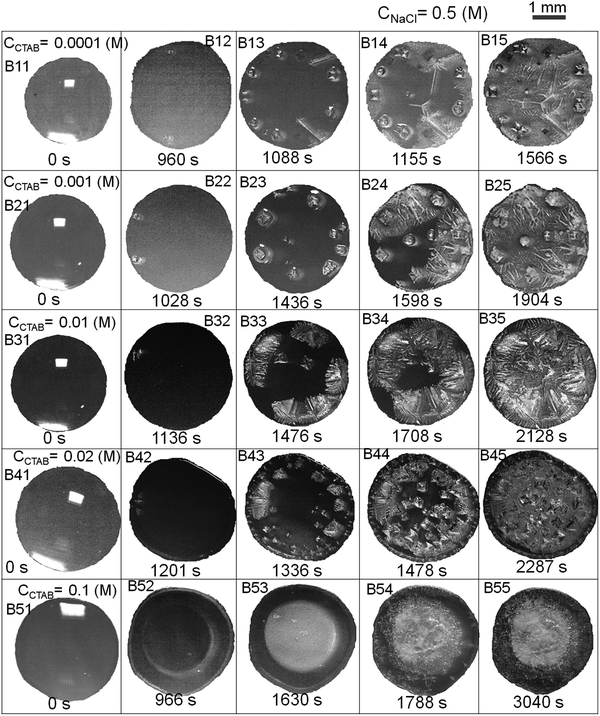
One can observe different phases of evaporation-driven droplet drying and the process of crystallisation of NaCl crystals from different aqueous solution mixtures containing a fixed amount of intermediate salt concentration CNaCl = 0.5 (M) and various proportions of CTAB in Fig. 6–8 and Table S4 (ESI†). Stepwise evaporation-driven drying processes of the droplets containing the solution mixtures and the dried morphologies are shown in Fig. 7. Variation in the diameter of the droplets (Dd) and the intrinsic contact angle (θi) with time are shown in Fig. 6A and B. The spreading phenomenon upon dispensing the droplets is shown in Fig. 6A, 7, and Table S4 (ESI†); this happens for a particular duration of time, tP, i.e., until pinning occurs. So, tP depends on CCTAB and θi.At CCTAB ≤ 0.001 (M), the initial equilibrium contact angle, θEqm. shows a value of ca. 50°. In this concentration regime, droplets spread for a longer duration before getting pinned, leading to relatively higher values of tP (ca. 10 to 12 minutes depending on CCTAB). Beyond CCTAB = 0.001 (M), the values of θEqm. and duration of droplet spreading decrease progressively with increasing CCTAB, leading to a gradual reduction in tP (Fig. 6C and frames B11, B12, B21, B22, B31, B32, B41, B42, B51, B52 in Fig. 7).
It is important to note that the event of pinning occurs at a relatively higher value of θiP (34°) at the highest CCTAB of 0.1 (M) (which was 25° in the case of CNaCl = 0.1 (M)) used in our study. This can be attributed to the increase in the amount of salt in the system (see Tables S2 and S4, ESI†). Once the droplet gets pinned, the constant contact area (CCR) mode of evaporation continues until the completion of the drying process. Table S4 (ESI†) also indicates that the difference between tC and tP gradually increases with CCTAB. This indicates that pinning and nucleation occur between a short time at low CCTAB, while the same happens at a more extended time gap when CCTAB > 0.001 (M).
Both the tC and the tS increase with a gradual increase in CCTAB (see Fig. 6C). Interestingly, even at CCTAB ≤ 0.001 (M), the values of tS are relatively larger than those we obtained for CNaCl = 0.1 (M). This observation implies the much slower crystal growth period of some big cubic crystals arranged around the droplet periphery, as shown in the frames B13 and B23 in Fig. 7. At a large CCTAB = 0.1 (M), an extremely high value of tS (57 minutes) was observed with CNaCl = 0.1 (M), which remarkably drops to a value of 23.5 minutes with CNaCl = 0.5 (M). This can be attributed to the faster growth rate of crystals for this particular composition of salt–surfactant mixtures. One can also confirm this fact from frame B52 in Fig. 7, where the event of depinning occurs much earlier and the area of the turbid zone is observed to be of a much larger size than that obtained with CNaCl = 0.1 (M) (see A53 in Fig. 3 and B53 in Fig. 7). The values of intrinsic contact angles (θiP) at the time of pinning as a function of CCTAB indicate that the liquid film gets remarkably flat at the time of pinning at CCTAB ≤ 0.001 (M). In contrast, beyond 0.001 (M) of CCTAB, pinning occurs well before θiP gets lower or liquid film attains enough spreading.
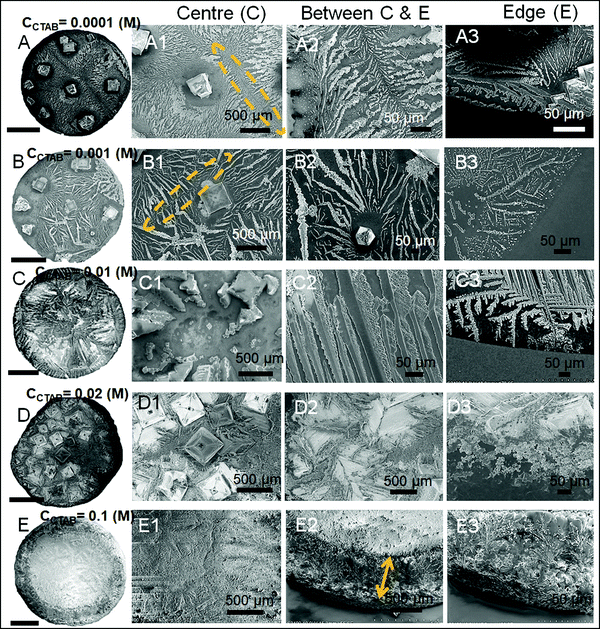
Fig. 8 summarises the diverse salt patterns for all the salt deposits at CNaCl = 0.5 (M). At CCTAB ≤ 0.001 (M), the dried deposits encompass a few large cubic crystals mainly organised around the dried droplet periphery. They grow large due to the Ostwald ripening process62 until the remaining liquid film turns significantly thin. Further solvent loss from the system happens quickly, leading to dendritic morphologies over the whole deposit area (see Movies 5 and 6 in the ESI†). Interestingly, the dendritic growth is associated with remarkably thin grain boundaries, as indicated by yellow dashed ellipses in frames A1 and B1 in Fig. 8. Some long skeletal crystals that also appear in this concentration regime are seen to break towards the grain boundaries (frames B and B1 in Fig. 8). The cubic shape of crystals gets modified into a wider and highly branched crystalline morphology with further increase in CCTAB to 0.01 (M) (frames B35 in Fig. 5 and C1, C2 in Fig. 8). Long and thin skeletal crystals are arranged around the peripheral deposit zone. At the same time, some branched crystalline domains are located in the middle of the deposit footprint keeping a small area of the central zone almost devoid of crystals (see Movie 7 in the ESI† and C1 in Fig. 8). Frames B15, B25, B35 in Fig. 7 and A3, B3, C3 in Fig. 8 show that the dried droplets’ peripheral zone is entirely devoid of any ring-like structures and instead surrounded by dendritic crystalline morphologies. Beyond 0.01 (M) of CCTAB the deposit morphology is composed of a thin peripheral ring, whose width slightly increases with further increase in CCTAB in the mixture (see frames B43, B53 in Fig. 7 and D3, E3 in Fig. 8). Energy-dispersive X-ray spectroscopy measurements for drying droplets having CCTAB > 0.01 (M) indicate that while the weight percentage of bromine (Br) increases, there is a simultaneous decrease in the weight percentage of chlorine (Cl) at the edges of deposits (see Fig. 6D). Notably, the deposit edges are dominated by chlorine (Cl) irrespective of CCTAB. Many faceted cubic crystals are scattered over the deposit footprint at CCTAB = 0.02 (M) (see frames B45 in Fig. 7 and D, D1 in Fig. 8).
The evaporative crystallisation process at CCTAB < 0.02 (M) is not associated with any stick-slip mode33 of deposition. In contrast, at CCTAB ≥ 0.02 (M), the contact line detaches from the peripheral ring and starts to move inward before getting pinned for a second time. At CCTAB = 0.02 (M) the contact line immediately separates from the extremely thin peripheral ring of the drying droplet (see Movie 8 in the ESI† and frames B42 and B43 in Fig. 7). The distance between the detached contact line and the peripheral ring, i.e., the dDepinning, increases with CCTAB. Incidentally, this process of pinning at CCTAB = 0.1 (M) occurs at a much closer distance for CNaCl = 0.5 (M) than that in the case of CNaCl = 0.1 (M) (see frames B55 in Fig. 7, E2 in Fig. 8, A55 in Fig. 3 and E2 in Fig. 4). Here the much reduced diffusion-controlled transport of the Br− ions gets easily overcome by the outward capillary flow, facilitating the earlier pinning (as compared to CNaCl = 0.1 (M)) of the contact line for the second time as clear from the frames B53, B54 in Fig. 7 and E2 in Fig. 8. From Table S5 of the ESI,† it can be seen that in the current experiment the initial value of x2 is already quite low (x2 = 0.167), much lower than that for CNaCl = 0.1 (M) (x2 = 0.5). Additionally, the formation of the micellar peripheral ring leads to a significant decrease in the local value of x2. Consequently, the conditions for super saturation-based nucleation are achieved, which is also confirmed by the appearance of turbidity (see Movie 9 of the ESI† and frame B53 in Fig. 7). Due to crystallisation from a significant flat film and the presence of both salt and CTAB molecules in large proportions, the branched crystalline morphology is not visible (see frames E1 and E2 in Fig. 8).
When the added salt concentration is increased to a value from 0.1 (M) to 0.5 (M), the number of Cl− ions in both the diffusion and stern layers greatly increased over the number of Br− ions at CCTAB ≤ 0.001 (M). Thus the deposit morphology is dominated by some cubical salt crystals along with some branched morphologies. Beyond CCTAB of 0.001 (M), even though the number of Br− ions increases upon the addition of more CTAB, there is an excess of Cl− ions on the surface that stays up to CCTAB = 0.01 (M). As a result, the deposit morphologies are devoid of any outer CTAB micellar ring. It is also important to note that although Cl− ions are present in excess than Br− ions, these excess Cl− ions fail to form any NaCl salt ring. At a CCTAB of 0.02 (M) for the first time Br− slightly dominates over Cl− ions (see frame C in Fig. 5), leading to the generation of very few micelles that get deposited as a thin peripheral ring in the dried deposit. With a further increase in CCTAB to 0.1 (M), the number of micelles increases marginally (as x2 gets higher) giving rise to a slightly wider peripheral micellar ring. However, a remarkable reduction (ca. 5 times) in the peripheral ring width, from ca. 500 μm for CNaCl = 0.1 (M) to a value of ca. 107 μm for CNaCl = 0.5 (M) is observed (see frame E2 of both Fig. 4 and 8).
Evaporative salt morphologies from high concentration (2 (M)) NaCl solution droplets in the presence of different amounts of CTAB
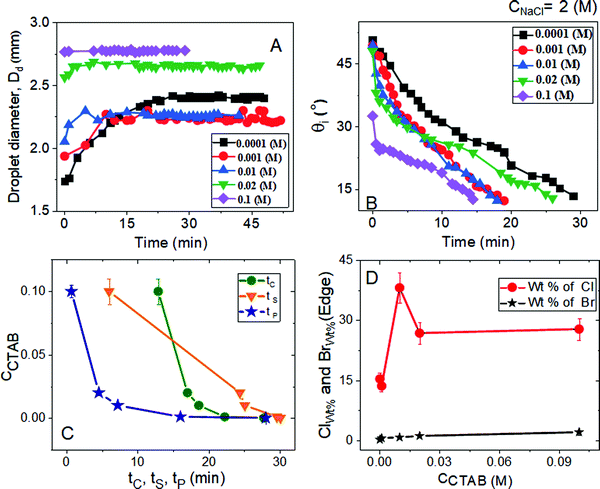
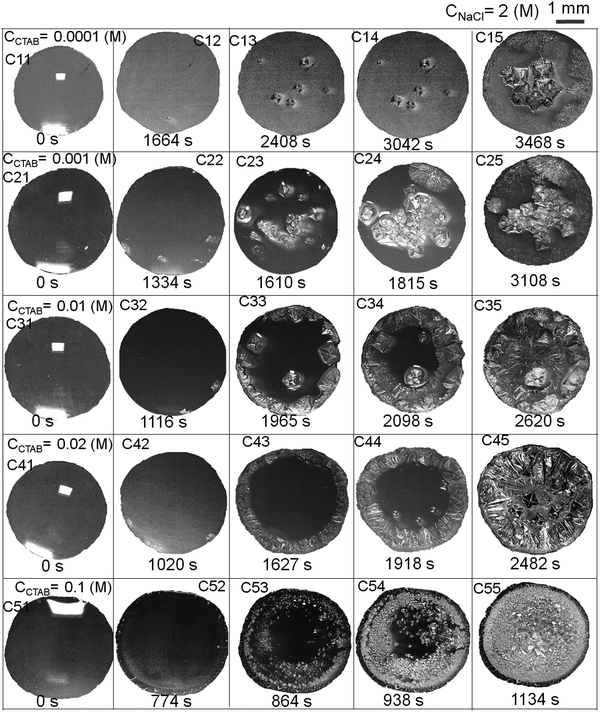
Time evolution microscopy images of the evaporative crystallisation process and detailed morphologies at various regions of deposit footprints are presented (see Fig. 9–11 and Table S6, ESI†). The experimental solution mixtures contain a constant high salt concentration of CNaCl = 2 (M) and various proportions of CTAB, as has been already used in the previous two sets of experiments. The diameter of the droplets (Dd) and the intrinsic contact angle (θi) as a function of time are graphically summarized in Fig. 9A and B. Depending on the values of CCTAB and θi, the duration of initial spreading, i.e., the tP values, vary, as observed in Fig. 9A, C, 10, and Table S6 (ESI†).In the presence of a high proportion of salt, the initial equilibrium contact angle θEqm. is ca. 50° irrespective of CCTAB, with the only exception at CCTAB = 0.1 (M) having θEqm. = 32°. But at CCTAB = 0.0001 (M), which is well below the CMC, tP is seen to be much higher than those of other droplets, and it involves a long spreading time of 27 minutes. As the CCTAB crosses the CMC, tP progressively decreases with CCTAB suggesting reduced spreading and early pinning (see Fig. 9C and frames C22, C32, and C42 in Fig. 10). At CCTAB = 0.1 (M), the droplet immediately pins on the substrate (see frames C51 and C52 in Fig. 10) right after dispensing, leading to a relatively higher value of θiP (32°). Further process of drying follows the CCR mode of evaporation. From Table S6 (ESI†), it is clear that the value of (tC − tP) increases with CCTAB. The extent of this increment is relatively lower than that observed at low CNaCl = 0.1 (M) and intermediate CNaCl = 0.5 (M). This observation suggests that both the processes of pinning and nucleation occur at shorter time intervals irrespective of CCTAB.
While both tC and the tS show an increase with the increasing amount of CCTAB, the tS values are large in general for almost all CCTAB (see Table S6, ESI†). This observation indicates a long duration for crystal formation and growth process at high CNaCl = 2 (M). Interestingly, tS shows a minimal value of 6 minutes (see Table S6, ESI†) while crystallising from salt–surfactant mixtures containing a large proportion of CCTAB = 0.1 (M) in lieu of a significantly faster growth of branched NaCl crystalline morphologies as compared to cubic crystals. It is important to note that at a large CCTAB = 0.1 (M) tS shows an extremely high value of 57 minutes (see Table S2, ESI†) with CNaCl = 0.1 (M), it lowers down to a value of 23.5 minutes (see Table S4, ESI†) with CNaCl = 0.5 (M) and significantly reduces to 6 minutes (see Table S6, ESI†)) with CNaCl = 2 (M). This indicates that an increase in CNaCl leads to a faster growth rate of NaCl crystals. θiP, the intrinsic contact angle values point out that at CCTAB ≤ 0.001 (M), liquid films get pinned once it becomes flat, but beyond CCTAB of 0.001 (M), pinning occurs at higher values of θiP.
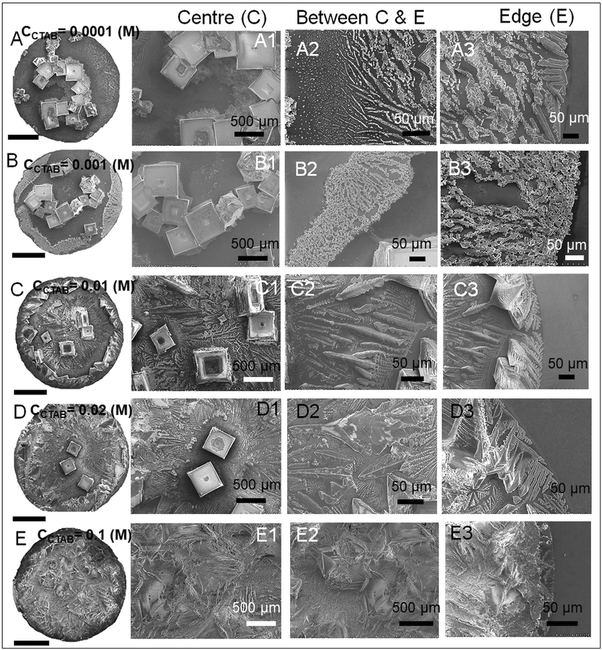
Scanning electron microscopy images in Fig. 11 display manifold crystalline structural diversity in the current experiment at high CNaCl = 2 (M). Frames A, A1, B, and B1 in Fig. 11 show that the evaporative deposits contain a few large cubic crystalline chunks. These are located almost in the central part of the deposit footprint surrounded by a remarkably thin crystalline outer layer at the pinned areas (see Movie 10 of the ESI† and A3 and B3 in Fig. 11). The remaining deposit footprint contains a thin branched dendritic coverage of crystallites (see frames A2 and A3 in Fig. 11). Slightly above CMC at CCTAB = 0.001 (M), thin dendritic crystalline domains are seen to be deposited around the peripheral zone (frames B, B2, and B3 in Fig. 11), unable to form a continuous dendritic ring of crystals. Beyond 0.001 (M) of CCTAB, the deposit morphology is dominated by a thick crystalline peripheral ring (Movie 11 in the ESI† and frames C, D, C3, and D3 in Fig. 11). The morphology of the outer ring is also seen to vary with CCTAB (see Movies 11 and 12 in the ESI†). It can be seen that at the peripheral ring (see frames C, C3, D, and D3 in Fig. 11), the extent of branching enhances with an increase in CCTAB from a value of 0.01 (M) to 0.02 (M) (see Movies 11 and 12 in the ESI†). At a very high CCTAB, uniformly distributed crystalline domains are observed over almost the whole droplet deposit. Again, the outer crystalline ring gets significantly thin (see Movie 13 (ESI†) and E3 in Fig. 11).
Beyond 0.001 (M) of CCTAB, a significant decrease in the number and the size of the cubic crystals is observed (see figure C, D, and E in Fig. 11). With the increase in CCTAB, the extent of crystal branching increases. It is noteworthy that at CCTAB = 0.1 (M), a ring-like morphology is modified to a uniform salt deposit (see frames E1, E2, and E3 in Fig. 11). Interplays of two processes can explain this. From Table S7 of the ESI,† it can be seen that while the initial value of x2 remains extremely low the same of x1 becomes significantly high, which indicates the significant surface excess of Cl− ions over Br− in the system irrespective of CCTAB (see frame D in Fig. 5). The significant surface excess of Cl− ions leads to central salt deposits at CCTAB ≤ 0.001 (M) and peripheral salt deposits beyond CCTAB of 0.001 (M). Much higher excess of Cl− ions in both the diffusion and stern layers leads to complete suppression of micelle formation. Thus no micellar peripheral rings are observed at any CCTAB used in this study.
Significant excess of Cl− ions creates a shielding layer of Cl− ions over the small quantity of Br− ions leading to an extreme reduction in diffusivity and effective surface excess of the dissociated Br− ions. This eventually suppresses the diffusion-limited inward motion of the contact line. Therefore, a thin peripheral salt deposit is formed. The absence of a turbid zone can also evidence this during attaining supersaturation (see frames C52 and C53 in Fig. 10). Eventually, the contact line gets pinned in close vicinity to the extremely thin peripheral salt ring leading to a significant drop in the depinning distance (see frame C52 in Fig. 10), signifying the domination of the outward capillary flow over the inward diffusion-limited flow. Immediately after pinning, many tiny crystalline domains start to nucleate over the whole deposit area (see Movie 13 in ESI†), leading to the suppression of the outward flow. The growth of the tiny crystals gives rise to homogeneous salt morphologies over the entire deposit footprint. Due to many salt and surfactant molecules, the branched crystalline morphology shows poor contrast in the SEM micrographs (see frames E, E1, and E2 in Fig. 11). All the deposits formed at high salt concentrations are thus composed of salt-made peripheral rings of various types. High x2 and diminished surface excess of Br− ions lead to the accumulation of salt molecules at the periphery. Therefore, thick peripheral salt rings are observed at CCTAB > 0.001 (M).
X-ray diffraction patterns of dried deposits
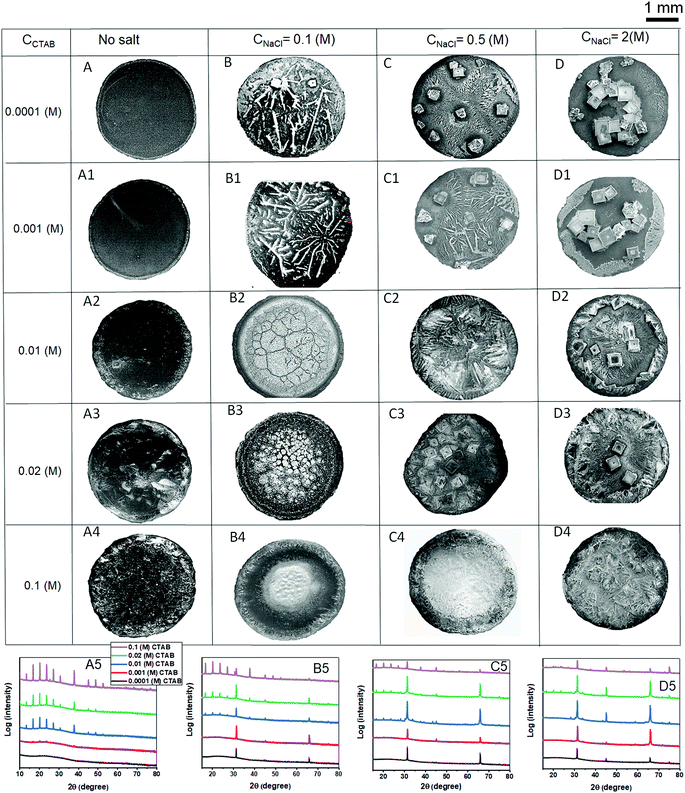
Fig. 12 summarises the final deposit morphologies of NaCl crystals for low CNaCl (0.1 (M)), intermediate CNaCl (0.5 (M)) and high CNaCl (2 (M)) in presence of various CCTAB contents (0.0001 (M), 0.001 (M), 0.01 (M), 0.02 (M) and 0.1 (M)). Frames A, A1, A2, A3, and A4 in Fig. 12 show the deposit morphologies obtained from evaporation-driven drying of aqueous solutions droplets containing CTAB at various concentrations without any salt. At CCTAB ≤ 0.001 (M) the morphology of dried deposits is primarily dominated by prominent peripheral rings (see frames A and A1 in Fig. 12). Such features get wholly suppressed in the presence of any concentration of salts (see frames B, B1, C, C1, D, and D1 in Fig. 12). At CCTAB > 0.001 (M), the deposits approach towards uniformly organised structures (see frames A2, A3, and A4 in Fig. 12). CCTAB = 0.1 (M) shows few peaks (at 2θ = 10°, 13.4°, 16.7°, 20.2°, 23.7°, 27.35°, 30.7°, 37.8°, 45.2°, 48.7°, and 52.7°) in the XRD pattern (see frame A5 in Fig. 12). This observation is indicative of pure CTAB in the absence of any NaCl.63 At CCTAB < 0.1 (M) (e.g., at 0.01 (M) and 0.02 (M)), the first nine peaks appear, but their intensities drop down significantly with a decrease in CCTAB. Some of the peaks (at 2θ = 45.2°, 48.7°, and 52.7°) are suppressed. It is important to note that at CCTAB ≤ 0.001 (M), no peaks appear for CTAB in the XRD patterns. Interestingly, in the absence of any salt, the aggregates of SDS do not show any XRD peaks; on the other hand, at high CCTAB, aggregates of CTAB generally show high-intensity XRD peaks.63On adding a lower amount of salt (CNaCl = 0.1 (M)) to the solution containing CCTAB = 0.1 (M), some of the crystalline peaks which appeared for pure CTAB at 2θ = 10°, 13.4°, 45.2°, 48.7°, and 52.7° get completely suppressed (frame B5 in Fig. 12). While peaks do appear at 2θ = 16.7°, 20.2°, 23.7°, and 27.35°, their intensities get slightly reduced compared to those of pure CTAB. This observation can be attributed to the short-range repulsive interaction between some of the large number of Br− ions and very few numbers of Cl− ions. As a result, the number of free Br− ions gets reduced, leading to a slight decrease in the intensities of the mentioned XRD peaks.
Two additional peaks appear at 2θ = 31.4° (with a small shift from 30.7°) and 66.1° for (200) and (400) NaCl crystalline planes, respectively. Having further one order of magnitude reduced concentration in CTAB (CCTAB = 0.02 (M) and CCTAB = 0.01 (M)), the intensity of the CTAB peaks at 2θ = 16.7°, 20.2°, 23.7° and 27.35° gets reduced. Notably, NaCl (200) peak at 2θ = 31.4° is significantly enhanced with a decrease in CCTAB. At CCTAB ≤ 0.001, all the peaks for CTAB get completely suppressed, and only two peaks stay intact at 2θ = 31.4° and 66.1°, corresponding to the (200) and (400) crystalline planes of NaCl. XRD results support our structural argument made during the discussion of morphological evolution, i.e., intense peaks for CTAB appear for an increased surface excess of Br− ions in the presence of high CCTAB and low CNaCl. So it gets suppressed with a decrease in CCTAB, which corresponds to a reduced number of Br− ions on the surface.
In the presence of an intermediate salt concentration of CNaCl = 0.5 (M) the diffraction peaks for CTAB appear for all high CCTAB > 0.1 (M) at 2θ = 16.7°, 20.2°, 23.7°, 27.35°, 37.8°, and 45.3°. Intensities of these peaks reduce with the decrease in CCTAB. These peaks are of relatively lower intensities than similar peaks at low CNaCl = 0.1 (M). For NaCl (200) and (400) crystalline planes, peaks appear at 2θ = 31.4° and 66.1° and stay for remaining all the lower CTAB concentrations spanning over three orders of magnitudes of CCTAB. A significant decrease in the intensities of all other peaks for CCTAB < 0.1 (M) (frame C5 in Fig. 12) likely suggests the surface excess of Cl− ions, in the presence of a higher amount of NaCl.
Interestingly, the addition of a very high amount of salt of CNaCl = 2 (M) is associated with a remarkable reduction in intensities of all the CTAB peaks that appear at 2θ = 16.7°, 20.2°, 23.7°, and 27.35° for CCTAB > 0.01 (M). For CCTAB ≥ 0.01 (M), all the CTAB peaks get completely suppressed, which essentially indicates that no excess Br− ions are present on the surface to form micelles. In other words, the small number of Br− ions remain entirely shielded by the much higher excess of Cl− ions. Eventually, XRD peaks can also be seen at 2θ = 31.4° and 66.1° for NaCl (200) and (400) crystallites for all salt and surfactant mixtures (frame D5 in Fig. 12). At CCTAB = 0.1 (M), an additional peak appears at 2θ = 75° for the (420) crystal plane of NaCl, corresponding to highly branched salt morphology in the presence of such high CCTAB. From the above discussion, we can conclude that the morphological variation of NaCl crystallisation with CCTAB is not associated with any XRD pattern changes and remains almost unchanged. So, the extent of the competitive surface adsorption process between the Cl− and Br− ions controls the number of peaks related to CTAB and their corresponding intensities.
Conclusions
In this study we have shown that diverse salt morphologies appear through evaporation-driven drying of droplets containing various combinations of NaCl salt (a low CNaCl of 0.1 (M), an intermediate CNaCl of 0.5 (M), and a high CNaCl of 2 (M)) and surfactant (CCTAB = 0.0001 (M), 0.001 (M), 0.01 (M), 0.02 (M) and 0.1 (M)) mixtures. In the presence of a low CNaCl of 0.1 (M) faceted cubic shape of crystals can be easily modified to a few millimeter-long skeletal crystals at CCTAB < CMC. At CCTAB, slightly above CMC, few crystalline grains are separated by grain boundaries. With a gradual increase in CCTAB, the number of grains increases, decreasing the size of the skeletal crystals within the grains. The dried deposit morphology contains a thick peripheral ring of CTAB molecules at CCTAB ≥ 0.001 (M), whose width increases with CCTAB. On the other hand, deposit morphologies are completely devoid of any peripheral ring at CCTAB ≤ 0.001. For intermediate CNaCl = 0.5 (M), most of the dried deposits are seen to be devoid of ring-like morphologies. A thin outer ring is formed at a very high CCTAB of 0.1 (M). A few large cubic crystalline chunks are scattered over the whole deposits surrounded by thin branched salt morphologies. For high CNaCl = 2 (M), the dried deposit is dominated by a few large cubic crystals in the central region. Detailed elemental analysis performed at the peripheral zones through EDS measurements reveals that at CCTAB ≤ 0.001 (M), the principal component of the zone is NaCl crystallites of various shapes obtained at different CCTAB. Above CCTAB = 0.02 (M) the salt-made peripheral rings get thinner. 0.001 (M) of CCTAB exhibits a threshold, beyond which while the droplet deposit morphology contains a peripheral ring composed of NaCl crystals for a high CNaCl of 2 (M), the same is seen to be composed of micellar CTAB molecules with a low CNaCl of 0.1 (M). Additionally, XRD measurements indicate that even in the presence of various concentrations of salts, irrespective of morphologies, crystalline peaks for NaCl remain almost the same. Intense diffraction peaks for CTAB are visible at CCTAB > 0.001 (M) and remain almost comparable in intensity to those of low CNaCl of 0.1 (M) (slight reduction in intensities of the peaks). In contrast, the intensities of the same diffraction peaks for CTAB get significantly reduced upon increasing CNaCl to 0.5 (M) and get remarkably suppressed in the presence of a significantly high salt content of CNaCl = 2 (M).We explain, in the presence of a high CCTAB > 0.001 and low CNaCl, the number of Br− ions (of CTAB) is much higher than that the number of Cl− ions in both the diffusion and stern layer, leading to an increased surface excess of Br− ions through the formation of a large number of micelles. Thus the morphologies are dominated by CTAB-micellar peripheral rings. Keeping the CCTAB at the same high values while increasing CNaCl to 0.5 (M) increases the number of Cl− ions leading to a surface excess of Cl− ions. This process eventually leads to a decrease in the number of micelles formed by CTAB. As a result, most of the deposit morphologies are seen to be devoid of peripheral CTAB micellar rings. At a high CNaCl of 2 (M), Cl− ions become significantly excess on the surface as compared to Br− ions. As a result, no free Br− ions remain on the surface to form micelles. Thus the morphologies are dominated by peripheral rings predominantly made of NaCl crystals of different types depending on CCTAB. In any combination of CNaCl and CCTAB, as long as Cl− remains surface excessed, the micelle formation becomes prohibited. As a result, XRD peaks corresponding to CTAB get remarkably suppressed.
Author contributions
JKD performed the entire experiments. NB and MC wrote the manuscript. NB and MC conceived the idea of the research. All the authors discussed and analysed the outcome of the research. MC supervised the whole progress.Conflicts of interest
There are no conflicts to declare.Acknowledgements
MC acknowledges support by the Science and Engineering Research Board through Ramanujan Fellowship (Grant No. SB/S2/RJN-084/2018) and through the Early Career Research Award (ECR/2018/001740) of the Department of Science and Technology, India. Additionally, MC acknowledges support from IIT Bombay through a SEED grant (RD/0519-IRCCSH0-033). We acknowledge IIT Bombay for Departmental/Central research facilities at the Department of MEMS for SEM, FESEM, Rheometry, and XRD measurements and at the CEN for contact angle measurements.References
- S. Veran-Tissoires, M. Marcoux and M. Prat, Phys. Rev. Lett., 2012, 108, 054502 CrossRef CAS PubMed.
- N. Sghaier, M. Prat and S. B. Nasrallah, Chem. Eng. J., 2006, 122, 47–53 CrossRef CAS.
- A. Goudie and H. A. Viles, Salt Weathering Hazard, Wiley, Chichester, 1997 Search PubMed.
- G. Van Rosmalen and P. Bennema, J. Cryst. Grow., 1990, 99, 1053–1060 CrossRef CAS.
- C. Rodriguez-Navarro, E. Doehne and E. Sebastian, Langmuir, 2000, 16, 947–954 CrossRef CAS.
- J. Mullin, Crystallization, Butterworth-Heinemann, London, UK, 2001 Search PubMed.
- H. E. Buckley, Crystal Growth, John Wiley and Sons Inc., New York, 1951 Search PubMed.
- A. Chernov, J. Cryst. Grow., 1974, 24, 11–31 CrossRef.
- T. Kuroda, T. Irisawa and A. Ookawa, J. Cryst. Grow., 1977, 42, 41–46 CrossRef CAS.
- M. Goto, Y. Oaki and H. Imai, Cryst. Growth Des., 2016, 16, 4278–4284 CrossRef CAS.
- C. N. Nanev, Prog. Cryst. Growth Charact. Mater., 1997, 35, 1–26 CrossRef CAS.
- V. A. Bogoyavlenskiy and N. A. Chernova, Phys. Rev. E: Stat. Phys., Plasmas, Fluids, Relat. Interdiscip. Top., 2000, 61, 1629 CrossRef CAS PubMed.
- A. A. Vargeese, S. S. Joshi and V. Krishnamurthy, Cryst. Growth Des., 2008, 8, 1060–1066 CrossRef CAS.
- D. Tokutomi, R. Ise, Y. Oaki and H. Imai, Cryst. Growth Des., 2013, 13, 3011–3017 CrossRef CAS.
- S. Sarkar, A. Maity, A. Sarma Phukon, S. Ghosh and R. Chakrabarti, J. Phys. Chem. B, 2018, 123, 47–56 CrossRef.
- T. Yakhno, Tech. Phys., 2015, 60, 1601–1608 CrossRef CAS.
- M. D. Choudhury, T. Dutta and S. Tarafdar, Soft Matter, 2015, 11, 6938–6947 RSC.
- A. Giri, M. Dutta Choudhury, T. Dutta and S. Tarafdar, Cryst. Growth Des., 2013, 13, 341–345 CrossRef CAS.
- R. Kubinek, J. Hozman and J. Varenka, J. Cryst. Grow., 1998, 193, 174–181 CrossRef CAS.
- C. Annarelli, L. Reyes, J. Fornazero, J. Bert, R. Cohen and A. W. Coleman, Cryst. Eng., 1999, 2, 79–89 CrossRef CAS.
- D. Kaya, V. Belyi and M. Muthukumar, J. Chem. Phys., 2010, 133, 114905 CrossRef CAS PubMed.
- X. Shao, Y. Hou and X. Zhong, Colloids Surf., A, 2021, 623, 126701 CrossRef CAS.
- K. R. Cho, Y.-Y. Kim, P. Yang, W. Cai, H. Pan, A. N. Kulak, J. L. Lau, P. Kulshreshtha, S. P. Armes and F. C. Meldrum, et al. , Nat. Commun., 2016, 7, 1–7 Search PubMed.
- X. Wei, J. Yang, Z. Li, Y. Su and D. Wang, Colloids Surf., A, 2012, 401, 107–115 CrossRef CAS.
- M. J. Siegfried and K.-S. Choi, Adv. Mater., 2004, 16, 1743–1746 CrossRef CAS.
- R. Venkatasubramanian, J. He, M. W. Johnson, I. Stern, D. H. Kim and N. S. Pesika, Langmuir, 2013, 29, 13135–13139 CrossRef CAS PubMed.
- A. König and H.-H. Emons, Cryst. Res. Technol., 1988, 23, 319–326 CrossRef.
- M. J. Qazi, R. W. Liefferink, S. J. Schlegel, E. H. Backus, D. Bonn and N. Shahidzadeh, Langmuir, 2017, 33, 4260–4268 CrossRef CAS PubMed.
- R. Bhardwaj, X. Fang and D. Attinger, New J. Phys., 2009, 11, 075020 CrossRef.
- S. Das, A. Dey, G. Reddy and D. Sarma, J. Phys. Chem. Lett., 2017, 8, 4704–4709 CrossRef CAS PubMed.
- M. Jose, M. Mayarani, M. G. Basavaraj and D. K. Satapathy, Phys. Chem. Chem. Phys., 2021, 23, 7115–7124 RSC.
- A. Zaibudeen, S. Khawas and S. Srivastava, Colloid Interface Sci. Commun., 2021, 44, 100492 CrossRef CAS.
- N. Basu, A. Osichow, S. Mecking and G. Reiter, Eur. Phys. J. E: Soft Matter Biol. Phys., 2012, 35, 1–12 CrossRef CAS PubMed.
- C. Rosu, P.-H. Chu, C. J. Tassone, K. Park, P. L. Balding, J. O. Park, M. Srinivasarao and E. Reichmanis, ACS Appl. Mater. Interfaces, 2017, 9, 34337–34348 CrossRef CAS PubMed.
- L. Bahmani, M. Neysari and M. Maleki, Colloids Surf., A, 2017, 513, 66–75 CrossRef CAS.
- T. A. Yakhno, V. G. Yakhno, A. G. Sanin, O. A. Sanina, A. S. Pelyushenko, N. A. Egorova, I. G. Terentiev, S. V. Smetanina, O. V. Korochkina and E. V. Yashukova, IEEE Eng. Med. Biol. Mag., 2005, 24, 96–104 Search PubMed.
- D. Soltman and V. Subramanian, Langmuir, 2008, 24, 2224–2231 CrossRef CAS PubMed.
- P. Calvert, Chem. Mater., 2001, 13, 3299–3305 CrossRef CAS.
- B. Zhao, Y. Wang, S. Sinha, C. Chen, D. Liu, A. Dasgupta, L. Hu and S. Das, Nanoscale, 2019, 11, 23402–23415 RSC.
- S. T. Chang and O. D. Velev, Langmuir, 2006, 22, 1459–1468 CrossRef CAS PubMed.
- R. D. Deegan, O. Bakajin, T. F. Dupont, G. Huber, S. R. Nagel and T. A. Witten, Nature, 1997, 389, 827–829 CrossRef CAS.
- D. Zang, S. Tarafdar, Y. Y. Tarasevich, M. D. Choudhury and T. Dutta, Phys. Rep., 2019, 804, 1–56 CrossRef CAS.
- P. J. Yunker, T. Still, M. A. Lohr and A. Yodh, Nature, 2011, 476, 308–311 CrossRef CAS PubMed.
- D. Mampallil and H. B. Eral, Adv. Colloid Interface Sci., 2018, 252, 38–54 CrossRef CAS PubMed.
- N. Basu and G. L. Cross, Nanotechnology, 2015, 26, 485301 CrossRef PubMed.
- H. Hu and R. G. Larson, J. Phys. Chem. B, 2006, 110, 7090–7094 CrossRef CAS PubMed.
- S. A. McBride, S. Dash and K. K. Varanasi, Langmuir, 2018, 34, 12350–12358 CrossRef CAS PubMed.
- N. Basu and R. Mukherjee, Soft Matter, 2018, 14, 7883–7893 RSC.
- P. Takhistov and H.-C. Chang, Ind. Eng. Chem. Res., 2002, 41, 6256–6269 CrossRef CAS.
- N. Shahidzadeh-Bonn, S. Rafa, D. Bonn and G. Wegdam, Langmuir, 2008, 24, 8599–8605 CrossRef CAS PubMed.
- N. Shahidzadeh, M. F. Schut, J. Desarnaud, M. Prat and D. Bonn, Sci. Rep., 2015, 5, 10335 CrossRef PubMed.
- N. Basu and R. Mukherjee, J. Phys. Chem. B, 2020, 124, 1266–1274 CrossRef CAS PubMed.
- S. P. Pinho and E. A. Macedo, J. Chem. Eng. Data, 2005, 50, 29–32 CrossRef.
- H. Iyota and R. Krastev, Colloid Polym. Sci., 2009, 287, 425–433 CrossRef CAS PubMed.
- J. Desarnaud, H. Derluyn, J. Carmeliet, D. Bonn and N. Shahidzadeh, J. Phys. Chem. Lett., 2018, 9, 2961–2966 CrossRef CAS PubMed.
- G. F. Harrington, J. M. Campbell and H. K. Christenson, Cryst. Growth Des., 2013, 13, 5062–5067 CrossRef CAS.
- J.-y. Park, K. Y. Suh, S.-m. Seo and H. H. Lee, J. Chem. Phys., 2006, 124, 214710 CrossRef PubMed.
- E. Nowak, N. M. Kovalchuk, Z. Che and M. J. Simmons, Colloids Surf., A, 2016, 505, 124–131 CrossRef CAS.
- M. J. Qazi, S. J. Schlegel, E. H. Backus, M. Bonn, D. Bonn and N. Shahidzadeh, Langmuir, 2020, 36, 7956–7964 CrossRef CAS PubMed.
- J. Wang, Colloids Surf., A, 1993, 70, 15–21 CrossRef CAS.
- C. Zhang, T. Geng, Y. Jiang, L. Zhao, H. Ju and Y. Wang, J. Mol. Liq., 2017, 238, 423–429 CrossRef CAS.
- J. H. Yao, K. Elder, H. Guo and M. Grant, Phys. Rev. B: Condens. Matter Mater. Phys., 1993, 47, 14110 CrossRef PubMed.
- S.-J. Ding, F. Nan, X.-L. Liu, Z.-H. Hao, L. Zhou, J. Zeng, H.-X. Xu, W. Zhang and Q.-Q. Wang, Sci. Rep., 2017, 7, 43282 CrossRef PubMed.
Footnote |
| † Electronic supplementary information (ESI) available. See DOI: 10.1039/d1sm01357b |
| This journal is © The Royal Society of Chemistry 2022 |

