
Measurements of interactions between fluorescent molecules and polyethylene glycol self-assembled monolayers
Feng
Cao
,
Yinan
Li
,
Jiahao
Wu
,
Wei
Liu
 * and
To
Ngai
*
* and
To
Ngai
*
Department of Chemistry, The Chinese University of Hong Kong, N.T., Shatin, Hong Kong, China. E-mail: tongai@cuhk.edu.hk
First published on 23rd November 2021
Abstract
Blocking the non-specific binding of fluorescent biomolecules to substrates is one of the most important approaches to minimize the background noise in single-molecule fluorescence detection. Polyethylene glycol (PEG) and its derivatives are the most frequently used self-assembled monolayers (SAMs) for surface passivation because they are particularly effective to reduce the adsorption of a majority of biomolecules. Most studies related to PEG SAMs focus only on the interactions between biomolecules and substrates, while few reports exist in which the interactions between fluorophores and organosilane SAMs are directly examined. The objective of this study is to try to clarify the interactions between fluorescein isothiocyanate (FITC) and PEG SAMs at different ionic strengths. Total internal reflection microscopy (TIRM) was utilized for quantitative analysis of the interactions. At low ionic strength, long-range attractions between FITC-modified polystyrene–silica particles and PEG SAM grafting substrates were observed, even though both of them had an ensemble-averaged negative charge. The origin of this attraction could be correlated to their nonuniformly charged surfaces. At high ionic strength, van der Waals attraction at short distances was measured as the electrostatic interactions were completely screened. Due to the polarizability of the FITC molecule, the van der Waals attractions increased with the thickness of the PEG SAMs. This phenomenon is explained by the hydration shell of the PEG SAMs.
1 Introduction
The single-molecule fluorescence technique has cast new light on physical, chemical, and biological problems since it was invented several decades ago.1–7 Its greatest advantage over the traditional ensemble-averaged measurement is that the intrinsically heterogeneous properties of individual molecules can be directly observed and studied, facilitating the precise study of molecular mechanisms, dynamics, and interactions.8–14 One of the key points for successful single-molecule measurements is the requirement for a high signal-to-noise ratio, which means that the weak fluorescent signals should be detectable over the noisy background. Scientists have developed several approaches to increase the signal-to-noise ratio, such as improving the fluorophore photostability and substrate passivation, minimizing the biomolecule concentration and sample volume, and developing highly sensitive cameras and robust software algorithms.15–17 Among these methods, surface passivation to prevent non-specific adsorption of the fluorescent probe to substrates is most widely used to minimize the background noise.As glass or quartz substrates are typically involved in single-molecule detection, there are two approaches to block non-specific binding of fluorescent biomolecules and preserve their biological properties: non-specific blocking proteins like bovine serum albumin (BSA) and self-assembled monolayers (SAMs) of organosilanes.18 Although surface modification with BSA is simple and widely used,19–21 organosilane SAMs provide better passivation in many situations. Hexamethyldisilazane has been utilized to inhibit DNA binding for high-efficiency genome sequencing, thereby reducing background noise in genomic arrays.22 Supported lipid bilayers were introduced as an inert layer to minimize nonspecific interactions and provide solid anchor spots for DNA tethering simultaneously.23 Perfluorodecyltriethoxysilane strongly repelled green fluorescent protein during electron beam lithography, enabling high-resolution patterning.24 A trimethylsilyl passivation strategy was combined with fluorescently tagged DNA origami to study the diffusion effect in binding mechanisms.25
Polyethylene glycol (PEG) and its derivatives are the most frequently used SAMs because they are particularly effective to reduce the adsorption of a majority of biomolecules.26,27 PEG with molecular weights from 3000 to 20![[thin space (1/6-em)]](https://www.rsc.org/images/entities/char_2009.gif) 000 g mol−1 has been utilized to reject the non-specific adsorption of proteins28–30 or DNA.31,32 Studies of the influence of PEG grafting density on the protein resistance showed that higher density provided better surface passivation,33 while defects on the glass surface might strengthen the non-specific adsorption of fluorescent biomolecules.34 Tween-20, a PEG derivative, showed a better performance for surface passivation, which was attributed to its smaller molecular size and higher coverage.35,36 Another PEG derivative widely used for biomolecule resistance is poly[oligo(ethylene glycol) methyl methacrylate] (POEGMA), due to the controllability of its grafting density and length through surface-initiated atom transfer radical polymerization.37,38 In summary, PEG and its derivatives have become the gold standard for surface passivation in single-molecule fluorescence techniques.
000 g mol−1 has been utilized to reject the non-specific adsorption of proteins28–30 or DNA.31,32 Studies of the influence of PEG grafting density on the protein resistance showed that higher density provided better surface passivation,33 while defects on the glass surface might strengthen the non-specific adsorption of fluorescent biomolecules.34 Tween-20, a PEG derivative, showed a better performance for surface passivation, which was attributed to its smaller molecular size and higher coverage.35,36 Another PEG derivative widely used for biomolecule resistance is poly[oligo(ethylene glycol) methyl methacrylate] (POEGMA), due to the controllability of its grafting density and length through surface-initiated atom transfer radical polymerization.37,38 In summary, PEG and its derivatives have become the gold standard for surface passivation in single-molecule fluorescence techniques.
Many studies have been carried out to understand the thermodynamics and molecular mechanisms of PEG SAMs for the prevention of non-specific adsorption. Theoretical models showed that steric hindrance effects play important roles in the impenetrability of polymer brushes for biomolecule resistance.39,40 The grafting density of polymer brushes was found to be the most important parameter for the prevention of protein adsorption, other than the chain length or thickness. Another significant effect that contributes to biomolecular resistance is the hydration shell of PEG SAMs.41–44 Ethylene glycol forms strong hydrogen bonds with water molecules, creating a permanent hydration layer. The attachment of proteins or other biomolecules requires extra energy to dehydrate and break the hydrogen bonds, which creates a thermodynamically unfavourable osmotic penalty. Although the molecular mechanisms of surface passivation have not yet been fully identified, steric repulsion and the hydration shell are commonly considered to be two main contributors.
It should be noted that all the biomolecules in single-molecule fluorescence techniques are conjugated with fluorescent labels. Most studies focus only on the biomolecules themselves, and little literature examining the interactions between fluorophores and organosilane SAMs exists.45–47 Zanetti-Domingues et al. investigated multiple protein–fluorophore conjugates interacting with different passivation treatments and reported that the non-specific binding of fluorescent probes to a glass surface depended primarily on the dye, and less on the protein to which it was bound.48,49 Net molecular charge and hydrophobicity both contributed to the non-specific binding of fluorophores. Reichert et al. examined the adsorption of various dyes on micropatterned octadecyltrichlorosilane and perfluorooctylsilane.50 Rhodamine B and cyanine 3 were preferentially adsorbed by hydrophobic SAMs, while oxazine 170 and fluorescein showed preferential adsorption of hydroxyl groups on a bare glass surface. Daniels et al. utilized fluorescence correlation spectroscopy and discovered that dyes with small hydrodynamic radii permeated the PEG SAMs, while large ones were excluded.51 All these studies demonstrate that fluorophores alter the behavior of biomolecular probes to a large extent, and that it is important to measure the fluorophore–surface interactions quantitatively.
Total internal reflection microscopy (TIRM) is a suitable technique to understand the fluorophore–SAM interactions because of its good surface-sensitivity in measuring weak interactions on biological interfaces. In brief, TIRM uses the evanescent-wave scattering intensity of a tracer particle in Brownian motion near a surface to determine the particle–surface separation, interactions, and the associated potential energy profiles. Herein, we employed a home-built TIRM to quantitatively describe the interactions between a widely used fluorophore, fluorescein isothiocyanate (FITC), and PEG SAMs at different ionic strengths. First, glass slides were pre-cleaned and modified with PEG silanes with different molecular weights. The PEG-modified slides were further characterized by the contact angle, thickness, and grafting density. Simultaneously, PS–silica core–shell hybrid particles were coated with FITC and used as tracer particles in TIRM measurements. Finally, we assessed the interactions between FITC-modified particles and PEG-grafted glass slides with TIRM, allowing for a comprehensive interpretation of the factors influencing the potential energies.
2 Experimental
2.1 Materials
Monodispersed 2.1 μm polystyrene (PS) particles with a silica coating were synthesized via dispersion polymerization.52 Plain glass microscope slides were purchased from Fisher Scientific, USA. N-type silicon wafers, 〈111〉, were purchased from Zhejiang Lijing Silicon Materials Co, China. Chemicals including sucrose, ethanol, toluene, hydrochloric acid, and acetic acid were purchased from BDH Analytical Chemicals, United Arab Emirates. Sodium chloride (NaCl) was purchased from EMD Millipore Co., USA. Sulfuric acid was purchased from ACI Labscan, Thailand. Hydrogen peroxide was purchased from Scharlau, Spain. (3-Aminopropyl)triethoxysilane (APTES) was purchased from Sigma-Aldrich, USA. N-Hydroxysuccinimide (NHS)-ester labelling fluorescein isothiocyanate (FITC) was purchased from Thermo Fisher Scientific Co., USA. Organosilanes including 2-[methoxy(polyethyleneoxy)6-9propyl]trimethoxysilane (PEG500, Mw = 459–591 g mol−1, Gelest) and methoxy PEG silane with two molecular weights (PEG5k, Mw ∼ 5000 g mol−1; PEG20k, Mw ∼ 20000 g mol−1, Jenkem Technology Co., China) were used for surface modification. All chemicals were of analytical grade and were used as received.
2.2 Surface modification
:H2O2 (30% v/v) = 3:1) at room temperature for 30 min. After being washed repeatedly with deionized water, the slides were dried with nitrogen and further cleaned via an ultraviolet–ozone plasma cleaner (Harrick Scientific Products Inc., USA) for 5 min immediately before surface modification. To construct PEG500, PEG5k and PEG20k SAMs, 0.5% PEG silane in ethanol with 1% acetic acid was prepared. One droplet of the PEG silane solution was dropped onto the middle of a slide and another slide was placed on the top of the droplet to spread the PEG solution. The glass slide sandwich was placed in a 70 °C oven for 30 min and finally rinsed with deionized water three times before TIRM measurements.
2.3 Characterization
2.4 Surface interaction energy analysis
The surface interactions between the FITC–modified PS–silica particles and PEG–SAM-coated glass slides were measured using a home-built TIRM, which has been described in detail elsewhere.47 PS–silica core–shell particles were chosen as tracer particles here based on the strong scattered light intensity from the PS core and the available surface modification of the silica shell. 0.5 and 1 mM NaCl aqueous solutions with low ionic strength were used in equilibrium measurements to ensure that the electrostatic repulsion was strong enough to cancel out gravity. The scattered light intensities at zero particle–surface separation for the deposited particles were determined after salting out using 100 mM NaCl solution. 1 M NaCl with 5% w/w sucrose aqueous solutions were prepared for non-equilibrium measurements. The electrostatic interaction was completely screened by the high ionic strength, so that gravity and van der Waals attractions could be measured by recording the depositing processes. The equilibrium potential energy profiles in 0.5 and 1 mM NaCl solutions were given as an ensemble average of five particles, while the non-equilibrium profiles in 1 M NaCl with 5% w/w sucrose aqueous solutions were calculated from around 50 particles.TIRM measurements can be carried out in equilibrium and non-equilibrium systems. Equilibrium measurements require solutions with low ionic strength so that the particle–surface electrostatic repulsion balances with gravity. For a traditional equilibrium system, the theoretical potential of a bare particle–surface interaction can be described as53

For the non-equilibrium system, the separation distance h is determined by the diffusion coefficient via the drift velocity method.52 The potential energy profiles were constructed via numeric integration of the corresponding force F(h) using the following equation.

3 Results and discussion
3.1 Characterization of the PEG SAMs
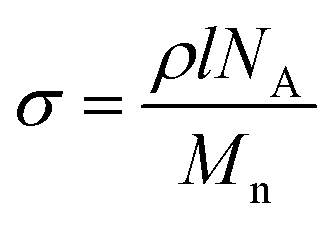
Before the grafting of PEG, the contact angles of both the bare glass slides and silicon wafers are close to zero (<10°) because their surfaces are so hydrophilic that water droplets spread and cover the entire surface quickly. After being modified with PEG silanes, the contact angle changes to ∼33° (Table 1), which agrees well with the measured value from Papra et al., proving the success of surface modification.54 The grafting densities σ of the PEG SAMs were calculated from the equationwhere ρ is the density of silane (ρ ≈ 1.12 g cm−3 for PEG), l is the thickness, NA is Avogadro's Number, and Mn is the molecular weight. The grafting density decreases apparently as the molecular weight increases because the steric hindrance of the large PEG silane increases the separation distance between adjacent molecules grafted to flat surfaces. As a result, PEG500 forms the thickest SAM, which may not be a single molecular layer, while PEG20k has the lowest grafting density (see Table 1).
| SAM | Contact angle (°) | Thickness (nm) | Grafting density (nm−2) |
|---|---|---|---|
| PEG500 | 34.8 ± 2.0 | 4.88 ± 0.20 | 6.58 ± 0.27 |
| PEG5k | 31.6 ± 2.5 | 2.96 ± 0.19 | 0.40 ± 0.03 |
| PEG20k | 33.6 ± 2.2 | 1.54 ± 0.20 | 0.052 ± 0.007 |
3.2 Characterization of the particles
As shown in Table 2, the zeta potential of the bare 2.1 μm PS–silica hybrid particles is the most negatively charged; the charges are mainly from the dissociation of the terminal silanol groups on the silica shell. After the reaction with APTES, the positive amine functional groups replace the negative charges, and the zeta potential thus increases greatly. The particle surfaces were further modified with the negatively charged FITC molecules through the NHS/amine coupling (confirmed by CLSM measurements, see Fig. 1), causing a reduction in the zeta potential. Although the zeta potential of the PS–silica–FITC particle is not as negative as that of the bare particles, it still provides sufficient electrostatic repulsion in equilibrium interaction measurements at low ionic strength. Both the zeta potential and CLSM characterizations confirmed that the PS–silica–FITC particles for interaction measurements were successfully prepared.| Particle | Zeta potential (mV) |
|---|---|
| Bare 2.1 μm PS–silica hybrid particles | −58.1 ± 2.1 |
| 2.1 μm PS–silica–NH2 particles | −10.3 ± 1.8 |
| 2.1 μm PS–silica–FITC particles | −24.1 ± 1.5 |
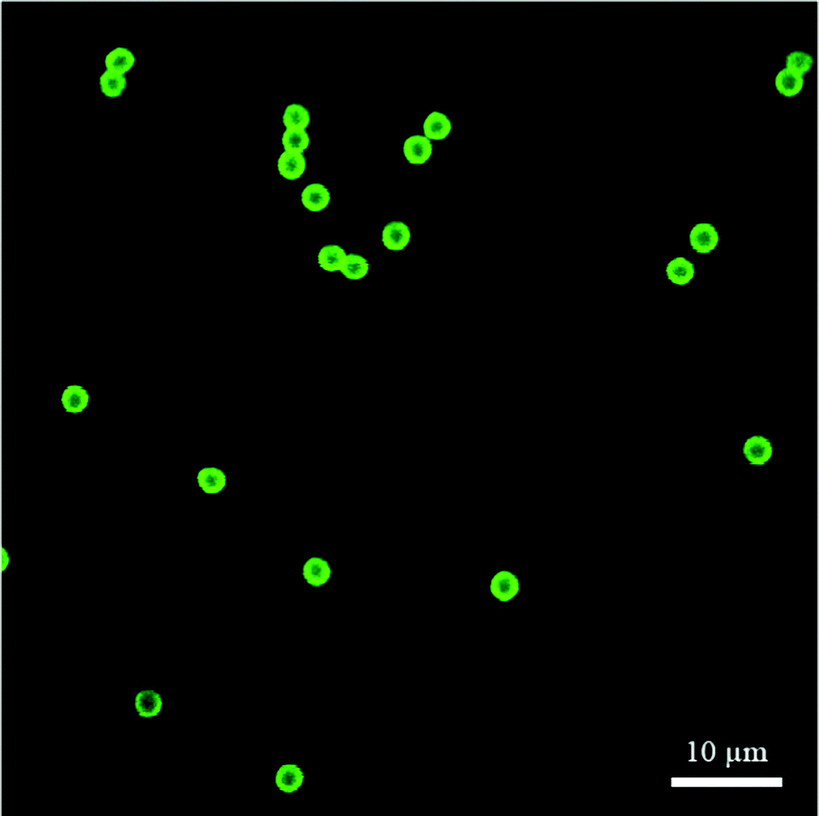 | ||
| Fig. 1 Confocal laser scanning microscopy (CLSM) image of 2.1 μm PS–silica–FITC particles. | ||
3.3 FITC/PEG SAM interactions in low-ionic-strength solutions
The interactions between the PS–silica particles and PEG SAMs at low ionic strength (in 0.5 and 1 mM NaCl aqueous solutions) are first described in this section. It should be noted that the PEG5k and PEG20k SAMs were not sufficiently negatively charged, so all the particles stuck to the surfaces irreversibly. In contrast, the PEG500 SAMs provided intense repulsion to ensure that the particles could reach their equilibrium positions in this study. Fig. 2 shows the potential energy profiles of bare and/or PS–silica–FITC particles interacting with bare and/or PEG500-SAM-coated glass slides in 0.5 mM NaCl solution. After subtracting the bare particle–surface interaction potentials, an extra attractive interaction appears for the modified surfaces of either PS–silica particles or glass slides (see Fig. 2b). This shows that PEG500 SAM introduces the weakest attraction and the FITC molecule contributes to a moderate potential energy, while the FITC–PEG500 SAM pair-interaction is the strongest (−3kT at a separation distance of 70 nm).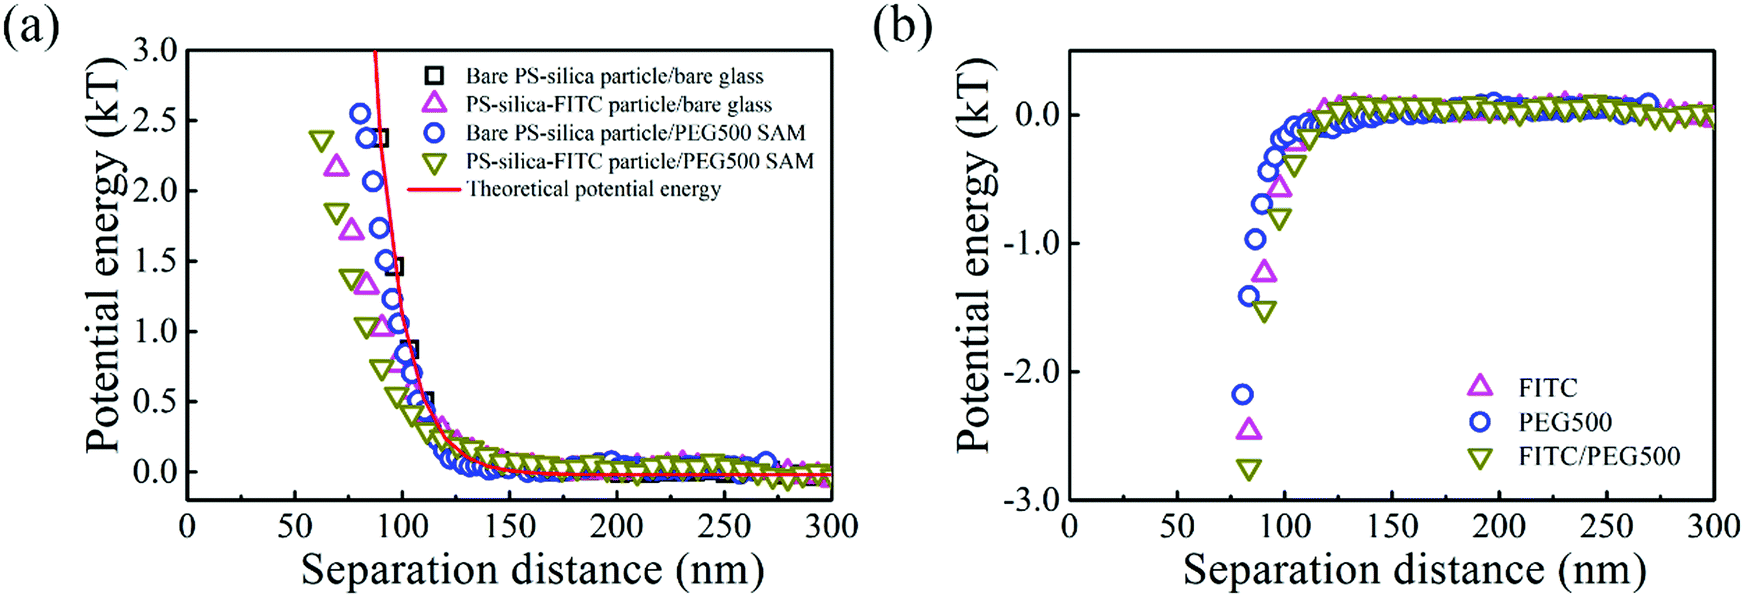 | ||
| Fig. 2 (a) Potential energy profiles of 2.1 μm bare and PS–silica–FITC particles interacting with bare and PEG500-SAM-coated glass slides in 0.5 mM NaCl solutions. (b) Measured attractive interactions in the presence of FITC, PEG500 SAM, or both. | ||
In order to more deeply examine the origin of the observed attraction between the FITC-modified PS–silica particles and the PEG–SAM-coated glass substrates, we measured and compared the attractions in solutions with two ionic strengths. Fig. 3 shows the similar potential energy profiles in 1 mM NaCl solution; the corresponding attractions for the different surface modifications become weaker as compared to those in the 0.5 mM NaCl solution. Fig. 4 more clearly shows that all the attractions are weaker at higher ionic strength. It should be noted that the van der Waals interaction is not sensitive to the ionic strength, and it is much weaker than the measured attractions at long separation distances (>75 nm). Hence, van der Waals interactions should be ruled out as the origin of the particle–surface attractions. Silbert et al. reported a long-range attraction between disordered heterogeneous surfaces. This long-range attraction generally arises between two heterogeneous surfaces covered with random charge domains. The attraction was proved to be orders of magnitude stronger than van der Waals forces, and it also depends on the ionic strength; this situation is quite similar to our findings here.55 Non-uniformly charged surfaces are ubiquitous in nature, even for an overall positively or negatively charged surface. Miklavcic theoretically calculated the long-range attraction between heterogeneously charged surfaces when the composite surface is net-neutral or close to it.56 In our case, namely, in the case of the slightly negatively charged surfaces for both the FITC-modified particles and PEG–SAM-coated substrates, we believe that this long-range attraction exists, since the surface modification procedures using FITC or PEG SAMs are stochastic, and the charge domains are not strictly controlled to make a uniform distribution. In detail, the bare PS–silica particles are uniformly charged to a certain extent, and the PEG chains are almost neutral. Hence, the electrostatic interactions are not strong, and are not sensitive to the ionic strength, as shown in Fig. 4b. However, various charged functional groups exist on the surface of the PS–silica–FITC particles: negative silanol, positive amine, and slightly negative hydroxy groups on the FITC molecules. These charged domains, which certainly include both positive and negative ones, are distributed randomly on the surface of the PS–silica–FITC particles, leading to the observed long-range attractions in our TIRM measurements (Fig. 4a and c).
 | ||
| Fig. 3 (a) Potential energy profiles of 2.1 μm bare and PS–silica–FITC particles interacting with bare and PEG500-SAM-coated glass slides in 1 mM NaCl solutions. (b) Measured attractive interactions in the presence of FITC, PEG500 SAM, or both. | ||
 | ||
| Fig. 4 Comparison of long-range electrostatic attractions in 0.5 mM and 1 mM NaCl solutions in the presence of (a) FITC, (b) PEG500 SAM, or (c) both. | ||
3.4 FITC/PEG SAM interactions in high-ionic-strength solution
To measure van der Waals interactions between the PS–silica–FITC particles and PEG SAMs, we used 1 M NaCl aqueous solutions to completely screen the electrostatic interactions via the non-equilibrium measurements. Steric repulsions are too weak to be considered because the PEG SAMs are not thick enough. The interactions between the bare PS–silica particles and PEG–SAM-coated glass slides are illustrated in Fig. 5a. All the potential energy profiles overlap with each other, regardless of the molecular weight or thickness of the PEG SAMs, implying that the PEG SAMs contribute little to the van der Waals attractions due to the thin polymer layer. Bevan et al. detected evident van der Waals attractive forces for a PEG layer with a 30 nm thickness.57 However, in our case, the thickest PEG SAM is only ∼5 nm, which is too thin to induce a detectable van der Waals attraction via the non-equilibrium measurements. However, the potential energy profiles of the PS–silica–FITC particles interacting with PEG SAMs show a positive dependence on the PEG layer thickness (Fig. 5b), i.e., the thicker the polymer layer, the stronger the measured attractions. The effect of FITC on the potential energies can be more obviously observed via comparison of the potential energy profiles before and after FITC modification (Fig. 6). We deduced that the attractive force measured in the non-equilibrium system is predominantly contributed by the van der Waals interaction, which is proportional to molecular polarizability and the PEG SAM thickness. The van der Waals potential energy between a sphere and a layer with a finite thickness is described as58where A is the Hamaker constant, which depends on the molecular polarizability, R is the particle radius, and l is the thickness of the polymer layer. Clearly, the van der Waals forces become stronger with increased molecular polarizability and polymer layer thickness. The polarizability of the silica shell on the hybrid particles is negligible as silicon dioxide has its own permanent dipole, preventing the molecule from being polarized. However, the polarizability of the FITC molecules is around 41.4 ± 0.5 Å3, which is much larger than those of silica (∼2.9 Å3) and water (∼1.0 Å3), increasing the Hamaker constant and in turn, the van der Waals potential energy.59–61 Moreover, the van der Waals attraction between the FITC-modified particles and PEG SAMs is positively correlated with the thickness of the PEG layers. The slight enhancement of the van der Waals attractions by FITC modification seems to be contradictory to the well-known biomolecular resistance of PEG SAMs, since FITC and its derivatives are widely used to label biomolecules, such as protein, DNA, and vesicles. However, this could be explained by the mechanism of energy dissipation and the hydration shell. The energy penalty for small molecules to penetrate into polymer layers is much lower than that for large biomolecules. Therefore, it is easier for small molecules with a high polarizability to be attracted by the van der Waals interaction, while the hydration shell (constituted by a large amount of water molecules with strong hydrogen bonding) around large biomolecules could prevent the non-specific binding to PEG SAMs.

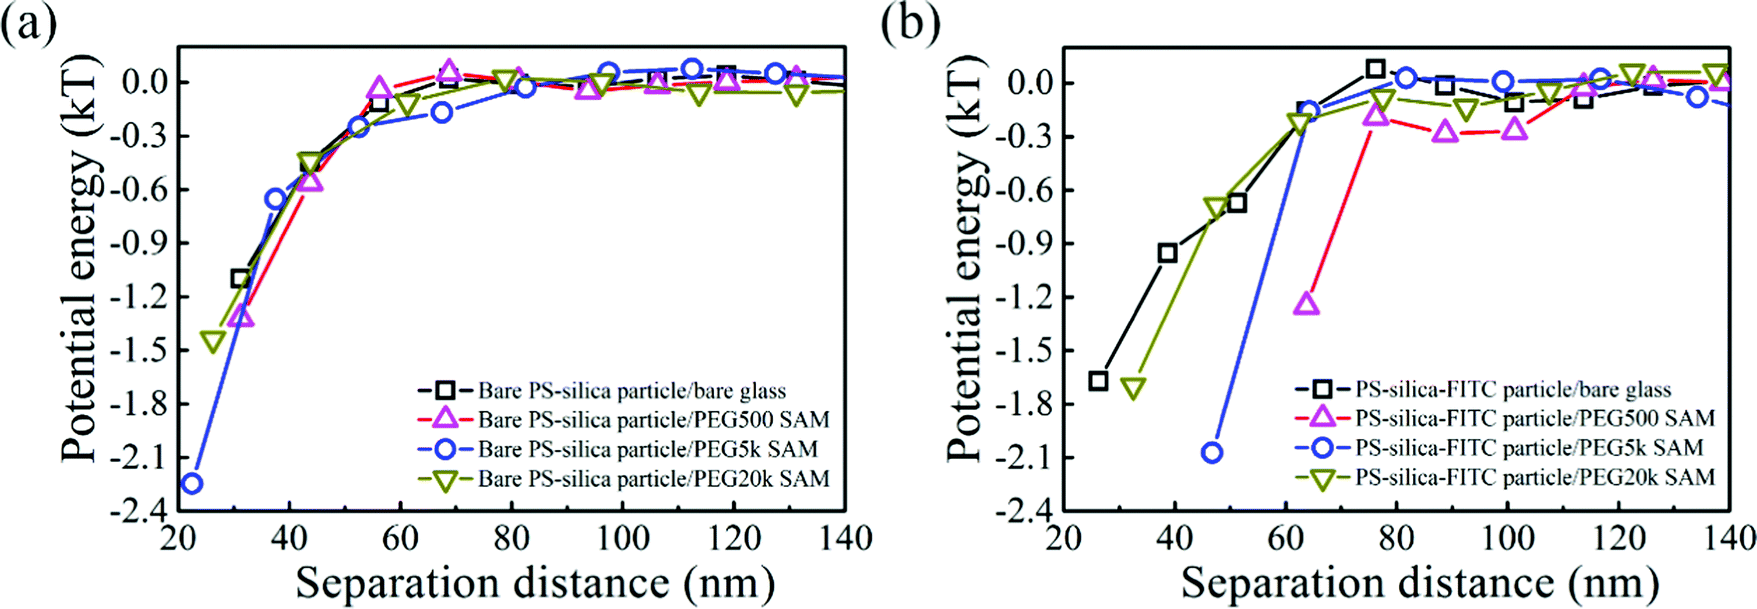 | ||
| Fig. 5 Potential energy profiles of 2.1 μm (a) bare PS–silica particles and (b) PS–silica–FITC particles interacting with bare and PEG-SAM-coated glass slides in 1 M NaCl aqueous solutions with 5% w/w sucrose. | ||
 | ||
| Fig. 6 Comparison of potential energy profiles of 2.1 μm bare and PS–silica–FITC particles interacting with (a) bare, (b) PEG500, (c) PEG5k, and (d) PEG20k SAM coated glass slides in 1 M NaCl aqueous solutions with 5% w/w sucrose. | ||
4. Conclusions
The interactions between FITC-modified PS–silica core–shell particles and PEG–SAM-coated glass slides have been investigated. PEG silanes with various molecular weights were grafted to glass slides for particle–surface interaction measurements. Contact angle and ellipsometer measurements indicated the successful surface modification of the PEG SAMs. CLSM images and zeta potentials were used to examine the modification of the FITC fluorophores on the surface of the PS–silica particles. TIRM was utilized to measure the interactions between the prepared FITC-modified PS–silica core–shell hybrid particles and PEG-SAM-coated glass slides. Quantitative analysis of the interactions at low ionic strength first indicated a long-range attraction emerged between the PS–silica–FITC particles and PEG500 SAMs. The origin of the attraction was the charge correlations between the heterogeneous surfaces with random positive and negative charge domains. Theoretical and simulation evidence can be found elsewhere.55,56 At high ionic strength, van der Waals attraction between the PS–silica–FITC particles and PEG SAMs was observed, since the electrostatic interactions were completely screened. The considerable polarizability of the FITC molecules increased the Hamaker constant and, in turn, enhanced the van der Waals attractions.Conflicts of interest
There are no conflicts to declare.Acknowledgements
The financial support of this work by the Hong Kong Special Administration Region (HKSAR) General Research Fund (CUHK14302120, 2130704) is gratefully acknowledged. We acknowledge Christopher Fetterly for support with the knowledge of the single-molecule fluorescence technique.Notes and references
- W. E. Moerner and L. Kador, Phys. Rev. Lett., 1989, 62, 2535–2538 CrossRef CAS.
- W. E. Moerner, Science, 1994, 265, 46–53 CrossRef CAS.
- R. M. Dickson, A. B. Cubitt, R. Y. Tsien and W. E. Moerner, Nature, 1997, 388, 355–358 CrossRef CAS.
- A. A. Deniz, S. Mukhopadhyay and E. A. Lemke, J. R. Soc., Interface, 2008, 5, 15–45 CrossRef CAS PubMed.
- C. Joo, H. Balci, Y. Ishitsuka, C. Buranachai and T. Ha, Annu. Rev. Biochem., 2008, 77, 51–76 CrossRef CAS PubMed.
- J. Wagner, T. Sungkaworn, K. G. Heinze, M. J. Lohse and D. Calebiro, Methods Mol. Biol., 2015, 1335, 53–66 CrossRef.
- S. Shashkova and M. C. Leake, Biosci. Rep., 2017, 37, BSR20170031 CrossRef CAS.
- T. Funatsu, Y. Harada, M. Tokunaga, K. Saito and T. Yanagida, Nature, 1995, 374, 555–559 CrossRef CAS PubMed.
- T. Schmidt, G. J. Schutz, W. Baumgartner, H. J. Gruber and H. Schindler, Proc. Natl. Acad. Sci. U. S. A., 1996, 93, 2926–2929 CrossRef CAS.
- Y. Sowa, A. D. Rowe, M. C. Leake, T. Yakushi, M. Homma, A. Ishijima and R. M. Berry, Nature, 2005, 437, 916–919 CrossRef CAS.
- H. Park, E. Toprak and P. R. Selvin, Q. Rev. Biophys., 2007, 40, 87–111 CrossRef CAS PubMed.
- M. Dyla, D. S. Terry, M. Kjaergaard, T. L. Sorensen, J. Lauwring Andersen, J. P. Andersen, C. Rohde Knudsen, R. B. Altman, P. Nissen and S. C. Blanchard, Nature, 2017, 551, 346–351 CrossRef CAS PubMed.
- Y. Ito, K. Sakata-Sogawa and M. Tokunaga, Sci. Rep., 2017, 7, 6994 CrossRef PubMed.
- Z. Liu, Z. Gong, Y. Cao, Y. H. Ding, M. Q. Dong, Y. B. Lu, W. P. Zhang and C. Tang, Biochemistry, 2018, 57, 305–313 CrossRef CAS.
- M. C. Leake, Phys. Chem. Chem. Phys., 2014, 16, 12635–12647 RSC.
- W. E. Moerner and D. P. Fromm, Rev. Sci. Instrum., 2003, 74, 3597–3619 CrossRef CAS.
- Y. Tang, L. Dai, X. Zhang, J. Li, J. Hendriks, X. Fan, N. Gruteser, A. Meisenberg, A. Baumann, A. Katranidis and T. Gensch, Sci. Rep., 2015, 5, 11073 CrossRef.
- M. L. Visnapuu, D. Duzdevich and E. C. Greene, Mol. BioSyst., 2008, 4, 394–403 RSC.
- R. Jungmann, C. Steinhauer, M. Scheible, A. Kuzyk, P. Tinnefeld and F. C. Simmel, Nano Lett., 2010, 10, 4756–4761 CrossRef CAS PubMed.
- Y. L. Jeyachandran, J. A. Mielczarski, E. Mielczarski and B. Rai, J. Colloid Interface Sci., 2010, 341, 136–142 CrossRef CAS PubMed.
- B. Sweryda-Krawiec, H. Devaraj, G. Jacob and J. J. Hickman, Langmuir, 2004, 20, 2054–2056 CrossRef CAS PubMed.
- R. Drmanac, A. B. Sparks, M. J. Callow, A. L. Halpern, N. L. Burns, B. G. Kermani, P. Carnevali, I. Nazarenko, G. B. Nilsen, G. Yeung, F. Dahl, A. Fernandez, B. Staker, K. P. Pant, J. Baccash, A. P. Borcherding, A. Brownley, R. Cedeno, L. S. Chen, D. Chernikoff, A. Cheung, R. Chirita, B. Curson, J. C. Ebert, C. R. Hacker, R. Hartlage, B. Hauser, S. Huang, Y. Jiang, V. Karpinchyk, M. Koenig, C. Kong, T. Landers, C. Le, J. Liu, C. E. McBride, M. Morenzoni, R. E. Morey, K. Mutch, H. Perazich, K. Perry, B. A. Peters, J. Peterson, C. L. Pethiyagoda, K. Pothuraju, C. Richter, A. M. Rosenbaum, S. Roy, J. Shafto, U. Sharanhovich, K. W. Shannon, C. G. Sheppy, M. Sun, J. V. Thakuria, A. Tran, D. Vu, A. W. Zaranek, X. D. Wu, S. Drmanac, A. R. Oliphant, W. C. Banyai, B. Martin, D. G. Ballinger, G. M. Church and C. A. Reid, Science, 2010, 327, 78–81 CrossRef CAS PubMed.
- A. Graneli, C. C. Yeykal, T. K. Prasad and E. C. Greene, Langmuir, 2006, 22, 292–299 CrossRef CAS PubMed.
- G. J. Zhang, T. Tanii, T. Zako, T. Hosaka, T. Miyake, Y. Kanari, T. Funatsu and I. Ohdomari, Small, 2005, 1, 833–837 CrossRef CAS PubMed.
- A. Gopinath and P. W. Rothemund, ACS Nano, 2014, 8, 12030–12040 CrossRef CAS PubMed.
- R. Roy, S. Hohng and T. Ha, Nat. Methods, 2008, 5, 507–516 CrossRef CAS PubMed.
- S. Zalipsky and J. M. Harris, ACS Symp. Ser., 1997, 680, 1–13 CrossRef CAS.
- C. D. Heyes, A. Y. Kobitski, E. V. Amirgoulova and G. U. Nienhaus, J. Phys. Chem. B, 2004, 108, 13387–13394 CrossRef CAS.
- A. Jain, R. Liu, Y. K. Xiang and T. Ha, Nat. Protoc., 2012, 7, 445–452 CrossRef CAS.
- S. J. Sofia, V. V. Premnath and E. W. Merrill, Macromolecules, 1998, 31, 5059–5070 CrossRef CAS PubMed.
- T. Ha, I. Rasnik, W. Cheng, H. P. Babcock, G. H. Gauss, T. M. Lohman and S. Chu, Nature, 2002, 419, 638–641 CrossRef CAS PubMed.
- I. Rasnik, S. Myong, W. Cheng, T. M. Lohman and T. Ha, J. Mol. Biol., 2004, 336, 395–408 CrossRef CAS PubMed.
- P. Kingshott, H. Thissen and H. J. Griesser, Biomaterials, 2002, 23, 2043–2056 CrossRef CAS PubMed.
- H. Cai and S. J. Wind, Langmuir, 2016, 32, 10034–10041 CrossRef CAS PubMed.
- B. Hua, K. Y. Han, R. Zhou, H. Kim, X. Shi, S. C. Abeysirigunawardena, A. Jain, D. Singh, V. Aggarwal, S. A. Woodson and T. Ha, Nat. Methods, 2014, 11, 1233–1236 CrossRef CAS PubMed.
- H. Pan, Y. Xia, M. Qin, Y. Cao and W. Wang, Phys. Biol., 2015, 12, 045006 CrossRef PubMed.
- H. W. Ma, J. H. Hyun, P. Stiller and A. Chilkoti, Adv. Mater., 2004, 16, 338–341 CrossRef CAS.
- H. W. Ma, M. Wells, T. P. Beebe and A. Chilkoti, Adv. Funct. Mater., 2006, 16, 640–648 CrossRef.
- S. I. Jeon, J. H. Lee, J. D. Andrade and P. G. De Gennes, J. Colloid Interface Sci., 1991, 142, 149–158 CrossRef CAS.
- S. I. Jeon and J. D. Andrade, J. Colloid Interface Sci., 1991, 142, 159–166 CrossRef CAS.
- W. R. Gombotz, G. H. Wang, T. A. Horbett and A. S. Hoffman, J. Biomed. Mater. Res., 1991, 25, 1547–1562 CrossRef CAS PubMed.
- I. Banerjee, R. C. Pangule and R. S. Kane, Adv. Mater., 2011, 23, 690–718 CrossRef CAS PubMed.
- P. Harder, M. Grunze, R. Dahint, G. M. Whitesides and P. E. Laibinis, J. Phys. Chem. B, 1998, 102, 426–436 CrossRef CAS.
- L. Li, S. Chen, J. Zheng, B. D. Ratner and S. Jiang, J. Phys. Chem. B, 2005, 109, 2934–2941 CrossRef CAS PubMed.
- L. D. Hughes, R. J. Rawle and S. G. Boxer, PLoS One, 2014, 9, e87649 CrossRef PubMed.
- T. Lu, Z. Lin, J. Ren, P. Yao, X. Wang, Z. Wang and Q. Zhang, PLoS One, 2016, 11, e0149751 CrossRef PubMed.
- W. Li, F. Cao, C. He, K. Ohno and T. Ngai, Langmuir, 2018, 34, 8798–8806 CrossRef CAS PubMed.
- L. C. Zanetti-Domingues, M. L. Martin-Fernandez, S. R. Needham, D. J. Rolfe and D. T. Clarke, PLoS One, 2012, 7, e45655 CrossRef CAS PubMed.
- L. C. Zanetti-Domingues, C. J. Tynan, D. J. Rolfe, D. T. Clarke and M. Martin-Fernandez, PLoS One, 2013, 8, e74200 CrossRef CAS PubMed.
- J. Reichert and J. M. Kohler, Biosens. Bioelectron., 2004, 19, 1387–1393 CrossRef CAS PubMed.
- C. R. Daniels, C. Reznik, R. Kilmer, M. J. Felipe, M. C. Tria, K. Kourentzi, W. H. Chen, R. C. Advincula, R. C. Willson and C. F. Landes, Colloids Surf., B, 2011, 88, 31–38 CrossRef CAS PubMed.
- F. Cao, J. Wu, Y. Li and T. Ngai, Langmuir, 2019, 35, 8910–8920 CrossRef CAS PubMed.
- D. C. Prieve, Adv. Colloid Interface Sci., 1999, 82, 93–125 CrossRef CAS.
- A. Papra, N. Gadegaard and N. B. Larsen, Langmuir, 2001, 17, 1457–1460 CrossRef CAS.
- G. Silbert, D. Ben-Yaakov, Y. Dror, S. Perkin, N. Kampf and J. Klein, Phys. Rev. Lett., 2012, 109, 3076–3080 CrossRef PubMed.
- S. J. Miklavcic, J. Chem. Phys., 1995, 103, 4794–4806 CrossRef CAS.
- M. A. Bevan and D. C. Prieve, Langmuir, 2000, 16, 9274–9281 CrossRef CAS.
- R. Tadmor, J. Phys.: Condens. Matter, 2001, 13, 195–202 CrossRef.
- R. Rajabi-Toustani, Q. S. Akter, E. A. Almadaly, Y. Hoshino, H. Adachi, K. Mukoujima and T. Murase, J. Vet. Med. Sci., 2019, 81, 694–702 CrossRef CAS PubMed.
- H. Kakiuchida, K. Saito and A. J. Ikushima, J. Appl. Phys., 2004, 43, 743–745 CrossRef.
- E. Harder, J. D. Eaves, A. Tokmakoff and B. J. Berne, Proc. Natl. Acad. Sci. U. S. A., 2005, 102, 11611–11616 CrossRef CAS PubMed.
| This journal is © The Royal Society of Chemistry 2022 |