
 Open Access Article
 This Open Access Article is licensed under a Creative Commons Attribution-Non Commercial 3.0 Unported Licence
Transition from viscoelastic to fracture-like peeling of pressure-sensitive adhesives†
Marion
Grzelka
 *a,
Stefan
Kooij
a,
Sander
Woutersen
b,
Mokhtar
Adda-Bedia
c and
Daniel
Bonn
a
*a,
Stefan
Kooij
a,
Sander
Woutersen
b,
Mokhtar
Adda-Bedia
c and
Daniel
Bonn
a
avan der Waals-Zeeman Institute, Institute of Physics, University of Amsterdam, Amsterdam 1098XH, The Netherlands. E-mail: m.grzelka@uva.nl
bVan’t Hoff Institute for Molecular Science, University of Amsterdam, Amsterdam 1098XH, The Netherlands
cUniversité de Lyon, Ecole Normale Supérieure de Lyon, Université Claude Bernard, CNRS, Laboratoire de Physique, Lyon F-69342, France
First published on 11th January 2022
Abstract
We investigate the process of the slow unrolling of a roll of typical pressure-sensitive adhesive, Scotch tape, under its own weight. Probing the peeling velocities down to nm s−1 resolution, which is three orders of magnitudes lower than earlier measurements, we find that the speed is still non-zero. Moreover, the velocity is correlated to the relative humidity. A humidity increase leads to water uptake, making the adhesive weaker and easier to peel. At very low humidity, the adhesive becomes so stiff that it mainly responds elastically, leading to a peeling process akin to interfacial fracture. We provide a quantitative understanding of the peeling velocity in the two regimes.
1 Introduction
Adhesion is important for many everyday engineering and biological processes, but it remains ill-understood at a fundamental level. Different adhesion mechanisms, such as mechanical interlocking and electrostatic, chemical and van der Waals bonding, have all been proposed.1 However there is no unified theory for adhesion, and many adhesion mechanisms are believed to be specific to particular material combinations. In addition, adhesion forces can depend very sensitively on the specific geometry of the debonding, with the peeling force differing by orders of magnitude for the same adhesion energy.1 This makes it notoriously difficult to predict the adhesion behavior. One of the key examples here is pressure sensitive adhesives (PSAs) that are typically used in adhesive tape and sticky notes.2 In spite of the fact that these are materials that are used by many people every day, there is no fundamental understanding of the adhesive strength and consequently the force necessary to undo the adhesive bond.3In this paper we provide such an understanding for the unsticking of PSAs under different environmental conditions. In these and many other adhesive systems the adhesive is typically ‘soft’, i.e., visco-elastic,4,5,6,7 and this turns out to provide the key to a quantitative understanding. Most of us have experienced sticking the end of a piece of scotch tape to the edge of a table or desk, while using a freshly cut bit from the roll. The generic observation is that the tape stuck to the table does not appear to unroll under the weight of the roll. Contrary to this idea, we show here that at long timescales the tape does in fact start to unroll right away, with a speed scaling with the force, i.e., the weight of the remaining tape on the roll. We find that the adhesive properties depend strongly on the environment, notably on the humidity, with a very strong dependence of the peeling speed on the environmental humidity. At very low humidity, the PSA becomes very rigid and exhibits a solid-like elastic behavior. In this second regime, we suggest that the unsticking is due to an interfacial fracture that propagates with a speed that depends on the fracture energy.
2 Methods and results
The studied tape (3M 810 Magic Scotch) is a PSA composed of a synthetic acrylic adhesive layer of thickness e = 28 μm, and a 38 μm-thick matte cellulose acetate backing. To investigate the ease with which this tape can be peeled from itself, we first study the unrolling of a suspended roll of tape of approximately 21 g under the action of gravity over a period of one month. The changing mass of the roll of tape is less than 1.3 g over a month, leading to a change of 6% on the applied force: we neglected this change in further discussion. The time of flight of a laser pulse is used to measure the vertical distance from the roll of tape to a reference point (see Fig. 1(a)). The setup is surrounded by a metal casing to prevent any airflow from disturbing the tape roll. However, the casing is not isolated from fluctuating atmospheric conditions of the laboratory. Throughout the experiments, we monitor the relative humidity, RH, and temperature (Testo 560).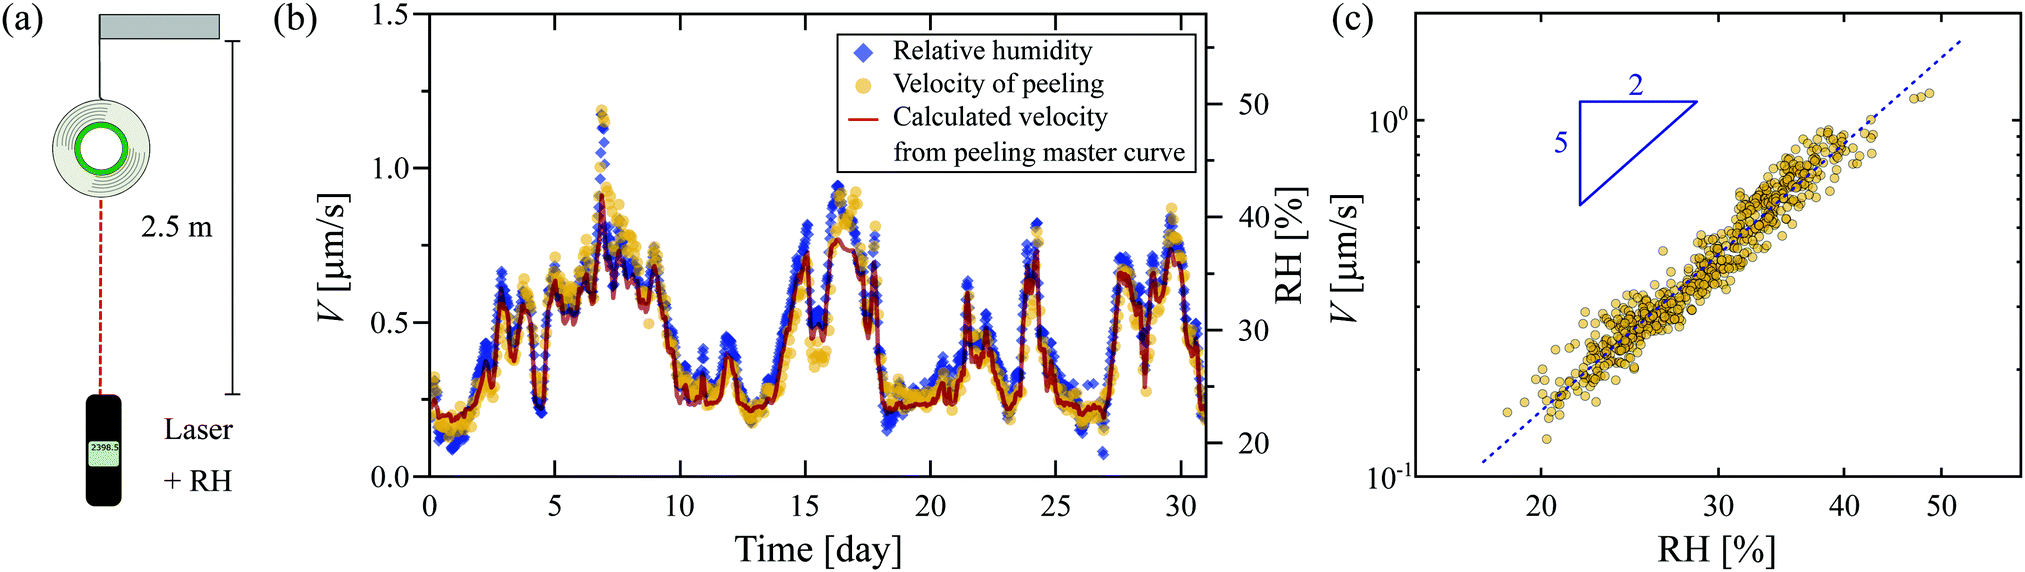 | ||
| Fig. 1 Unrolling of a suspended roll of tape over a period of one month. (a) Illustration of the set-up. A roll of Scotch tape (m ≈ 21 g) is suspended 2.5 m above a reference point, with the exact distance measured as a function of time using a laser distance meter. Temperature and relative humidity (RH) are monitored throughout the experiments. (b) Both the downward velocity V of the roll of tape and the relative humidity RH fluctuate strongly with time. The red line is the velocity of peeling calculated using the time–humidity superposition principle. (c) Peeling velocity, as extracted from (b), as a function of relative humidity. The dotted line shows a fitted power law of exponent 5/2. | ||
The peeling velocity V of the tape displays large fluctuations over the measurement period (Fig. 1(b)) that are strongly correlated with the variation in the relative humidity (RH), with a higher RH resulting in faster peeling of the tape. A close inspection of the time-dependencies of V and RH reveals that changes in V are delayed by roughly one hour with respect to changes in the RH, suggesting a time-dependent water uptake by the hygroscopic adhesive layer. Note that the fluctuations in RH over this timescale are negligible (<1.7%). Quantitatively, Fig. 1(c) shows that the velocity scales as a power law with the RH with an exponent of 5/2: the higher the RH, the lower the resistance of the PSA, leading in turn to faster unrolling of the tape.
Next, we investigate the effect of the peeling force. In addition to the peeling of the roll of tape, where we attach different weights to the suspended roll, we also tape two layers of the adhesive over each other on a glass plate and peel the upper layer away from the lower layer using a controlled force, mimicking what happens during the unrolling of a roll of Scotch tape. The peeling velocity is measured by tracking the peeling front using a CCD camera (Nikon D850 equipped with a macro-lens Laowa 25 mm 1![[thin space (1/6-em)]](https://www.rsc.org/images/entities/char_2009.gif) :2.8 and Phantom Miro M310 high-speed camera with a macro-lens Sigma 105 mm 1:2.8), both for the roll and the two layers. The peeling of the two layers allows us to study the peeling process at the debonding region in more detail, in addition to determining the Young's modulus of the backing of the tape (see Fig. S1–S3, ESI†). Both set-ups are placed in a sealed box through which a mixture of compressed air and water vapor is flowing; varying the relative proportions allows a constant RH to be maintained in the range of 1.9–98%. The temperature is kept constant at 20 ± 0.5 °C. The highest applied force of 1.27 N is chosen to avoid stick-slip effects: we focus on the steady-state regime of peeling for a low peeling velocity (V < 10 μm s−1). It is customary to discuss the peeling speed as a function of the strain energy release rate G, which is directly linked to the applied load F through the Rivlin equation,8G = F(1 − cosθ)/b, where b = 19 mm is the tape width and θ≈π/2 is the peeling angle in our experiment (see Fig. S1, ESI†).
:2.8 and Phantom Miro M310 high-speed camera with a macro-lens Sigma 105 mm 1:2.8), both for the roll and the two layers. The peeling of the two layers allows us to study the peeling process at the debonding region in more detail, in addition to determining the Young's modulus of the backing of the tape (see Fig. S1–S3, ESI†). Both set-ups are placed in a sealed box through which a mixture of compressed air and water vapor is flowing; varying the relative proportions allows a constant RH to be maintained in the range of 1.9–98%. The temperature is kept constant at 20 ± 0.5 °C. The highest applied force of 1.27 N is chosen to avoid stick-slip effects: we focus on the steady-state regime of peeling for a low peeling velocity (V < 10 μm s−1). It is customary to discuss the peeling speed as a function of the strain energy release rate G, which is directly linked to the applied load F through the Rivlin equation,8G = F(1 − cosθ)/b, where b = 19 mm is the tape width and θ≈π/2 is the peeling angle in our experiment (see Fig. S1, ESI†).
As usually found in the literature, we plotted in Fig. 2(a) the energy release rate G as a function of the velocity of peeling V on a log–log scale; note that we are able to determine the velocity of the tape roll down to ∼nm s−1 – it is therefore not surprising that one does not observe the unpeeling of roll of tape that is stuck on a desk. At a fixed RH, it is tempting to interpret our data with the extensively used9,10,11 but hitherto unexplained power-law behavior of Maugis and Barquins,12G∝Vn. However, when looking at the effect of the RH, it would appear that the exponent n depends strongly on RH, varying from 0.166 ± 0.003 at RH = 1.9% up to 0.507 ± 0.031 at RH = 98%. This means that for small applied forces, a humid environment boosts the peeling velocity by four orders of magnitude. The strong dependence of the exponent on the RH is not completely understood. Moreover, a second mystery arises for these simple experiments: at low RH, we find an exponent close to the very small value of n ≈ 1/8 that was found by Barquins for a different adhesive tape.13 In the following, we focus our discussion on understanding the effect of the humidity on the peeling and then try to understand this small exponent for low RH.
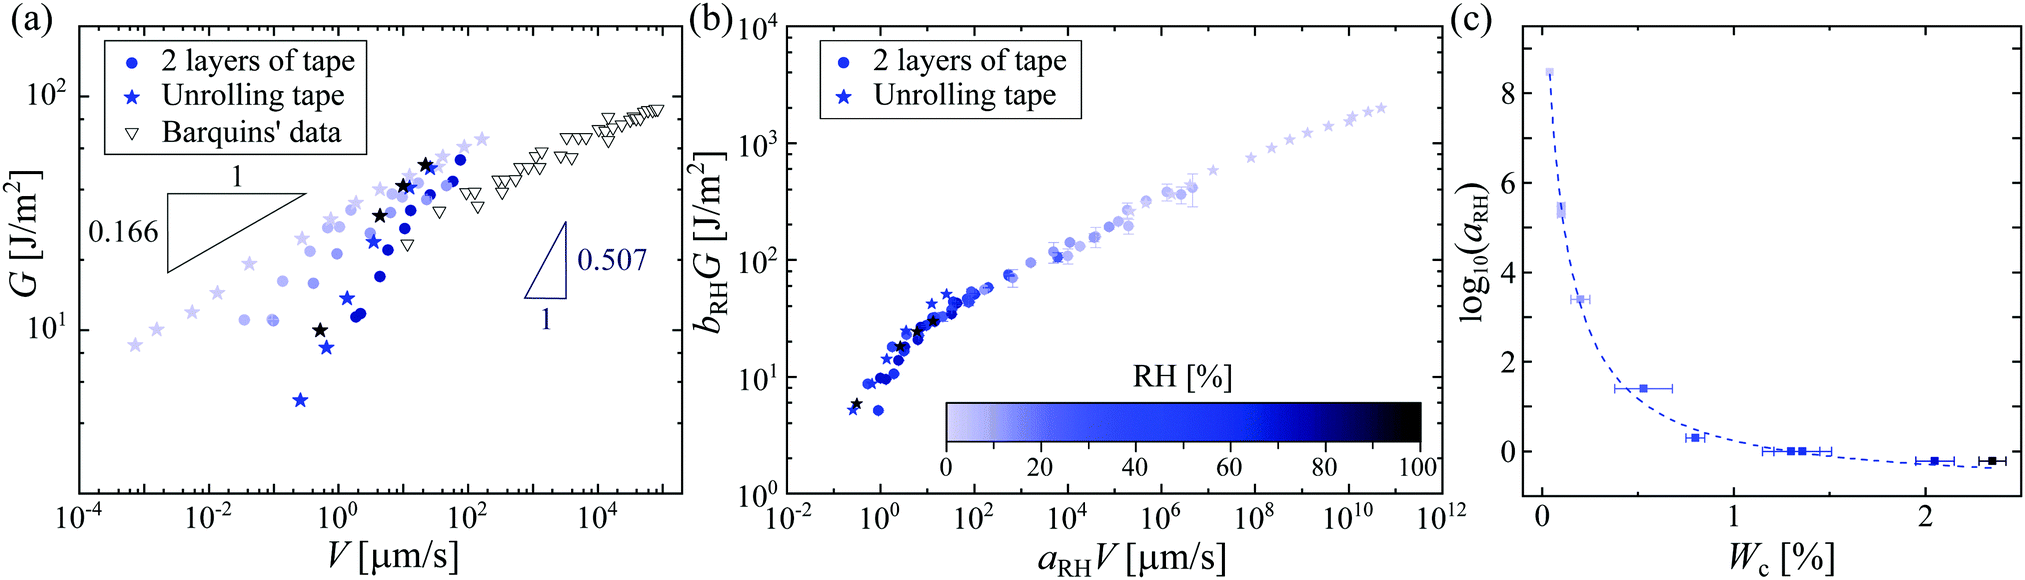 | ||
| Fig. 2 (a) Strain energy release rate G as a function of peeling velocity V of the adhesive for a suspended unrolling roll of tape (stars) and two layers of tape on glass (filled circles). The color scale (same as in (b)) indicates the different relative humidities. For comparison, we plot Barquins’ data13 for the peeling of Scotch 3M 600. (b) Peeling master curve with RHref = 56.7%. The rescaled strain energy release rate bRH·G (with bRH = RHref/RH) is plotted against the rescaled peeling velocity aRH·V. The master curve is built using the data reported in Fig. S4 (ESI†). (c) Logarithm of the rescaling factor aRH as a function of the water content Wc in the adhesive tape. The dashed line is the best fit with eqn (1), following the concept of ‘time–humidity’ superposition. | ||
3 Discussion
The minimal peeling energies measured in the present work at the low peeling velocities are about 4 J m−2, which are still much higher than the Dupré interfacial work of adhesion for typical adhesive interfaces, which is around 0.1 J m−2.3 Thus, there must be a source of visco-elastic dissipation in the peeling dynamics. As the Young's modulus of the backing of the tape is found to be almost independent of RH, 〈Eback〉 = 1.44 ± 0.26 GPa (see Fig. S3, ESI†), such differences in the peeling within a dry and a humid environment must be due to important changes in the adhesive material itself. Contrary to the effect of humidity, the effect of temperature on the peeling of adhesives has been widely studied.4,5,6,14 Gent et al.5 and Kaelble4 were among the first to show that increasing the temperature leads to a smaller dissipation in the adhesive, and hence a larger peeling speed for a given force. They proposed a scaling procedure to collapse all temperature-dependent peeling curves onto a single master curve, following the same approach as the time–temperature superposition (TTS) principle in polymer rheology.15 The peeling measurements for different temperatures are then rescaled in time using a coefficient aT(T), comparable to the rheological factor in the TTS principle, to create a master curve that collapses around the data for a reference temperature Tref, which is usually chosen as the ambient temperature. The dependence of aT on temperature follows the Williams–Landel–Ferry prediction for polymer liquids.14 The parameter aT reflects the molecular mobility of the polymer chains: the higher aT, the less mobile are the chains.15Our observations here are very similar, but are as a function of humidity rather than temperature; we therefore propose the construction of a peeling master curve for different relative humidities. Rescaling the peeling velocity by a factor aRH(RH) and the strain energy release rate G by bRH = RHref/RH with RHref being the reference relative humidity, we build the master curve with a reference data set for RHref = 56.7%, such that aRH(56.7%) = 1. This peeling master curve is plotted in Fig. 2(b), based on the data presented in Fig. S4 (ESI†). As in the construction of the rheology master curve,15 the rescaling factor aRH(RH) is manually tuned to obtain this peeling master curve (Fig. S5, ESI†). We find that aRH varies over 9 orders of magnitude, similarly as was reported in the time–humidity rheology of different polymers.16,17,18 The factor aRH has the same physical meaning as aT: a high value of aRH means less mobile polymer chains in the adhesive.
In order to connect the RH to the adhesion characteristics of the Scotch tape material, we apply the concept of ‘time–humidity’ superposition18,19,20 to the dependence of aRH with the water content Wc absorbed by the hygroscopic adhesive:
 | (1) |
Another way to estimate the visco-elasticity of the adhesive is to calculate the Deborah number: for high Deborah numbers, elasticity dominates, whereas viscous effects become important for small Deborah numbers. Following the analogy with the TTS principle,23 it is possible to estimate the Deborah number De for our peeling experiments:
| De = τdaRHV/e | (2) |
Finally, to support the robustness of our approach, we calculated the evolution of the velocity of peeling V(t) for the unrolling of the tape followed over a month (Fig. 1) based on the measurement RH(t) (see details in the ESI†). We show in Fig. 1(b) the the calculated V(t) indeed collapses with the experimental data. To summarize, the high impact of the relative humidity on the peeling of Scotch tape is due to changes in the bulk visco-elastic properties of the adhesive. The hydroplastization of the adhesive then gives a satisfactory explanation for the dependence of the peeling velocity on the relative humidity: the higher the RH, the more easily the adhesive is peeled.
It is then tempting to attribute the very low exponent n = 0.166 at RH = 1.9% presented in Fig. 2(a) to the hydroplastization of the adhesive. However, this exponent is surprisingly close to the one found by Barquins (n = 0.146)13 where they did not monitor the RH for their experiments. The IR characterization of the tape 3M 600 they used presents no trace of water (see Fig. S7, ESI†): the time–humidity superposition principle is not applicable for their experiments. Bulk viscoelastic dissipation is not the main peeling mechanism there. Chopin et al.7,11 recently proposed an explanation for such a low exponent by taking into account the non-linear rheology of the stretched fibrils. Within the resolution of our experiments, the stretching of fibrils is rate independent (see Fig. S11, ESI†): the adhesion curve G(V) is dominated by the linear viscoelasticity of the adhesive and not the non-linear rheology of the fibrils. Here, we rather propose to take into account interfacial dissipation. These peeling experiments are close to the limit in which the adhesive behaves elastically. Therefore, in order to detach, a fracture has to propagate within the adhesive or between the adhesive and the backing. To rationalize the rate-dependence of the fracture energy of elastomers, Chaudhury et al. proposed a fracture mechanism based on the kinetic theory of bond rupture.24,25,26 According to Evans,27 when a polymer chain is stretched with a force f, its activation energy of dissociation decreases by fλ, where λ is the activation length of a bond, usually approximated to the length of a chemical bond (λ ≈ 0.1 nm).24 This allows quantification of how the probability of failure of any bond in the polymer chain varies with the applied force. Chaudhury's model proposes the strain energy release rate G to depend on the stretching velocity of a bond Vstretch as:
 | (3) |
In Fig. 3, we plot G1/2 as a function of ln(V) for our tape at RH = 1.9% and for Barquins’ data.13 Chaudhury's model describes both data sets very well, explaining the small exponent: the behavior is in fact not a power-law behavior with a small exponent, but rather a logarithmic dependence due to the presence of an activated process.
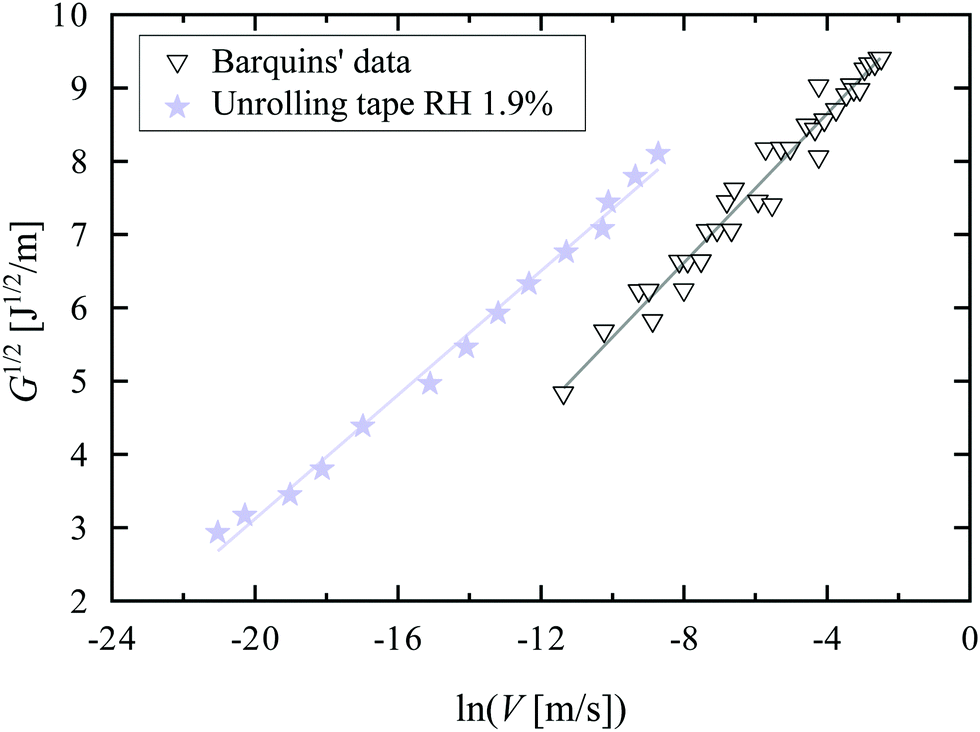 | ||
| Fig. 3 Square root of the strain energy release rate G as a function of the logarithm of the peeling velocity V for the unrolling tape roll at RH = 1.9% (stars) and Barquins’ data13 (triangles). For our experiments, we assume the stretching velocity of a bond Vstretch to be equal to the peeling velocity V. The solid lines are fits to eqn (3). | ||
From the fits, we can then obtain estimates of the spring constant ks and the characteristic time τ−. Assuming nbond ∈ [100–1000],24,26,28 and Σ0 ≈ 108 chains per m2,24,28,29 we find, respectively, ks = 11.6 ± 0.6 mN m−1 and τ− between 3.4 × 10⁴ and 3.4 × 10⁵ s for our data and ks = 8.0 ± 0.6 mN m−1 and τ− between 6.6 × 10² and 6.6 × 10³ s for the data of Barquins’. Note that these stiffnesses are one order of magnitude lower than the typical stiffness of the polymer chain for a strong bond (ks = 0.5 N m−1), meaning that the bond in the adhesive breaks long before its full extension.30 Furthermore, according to Eyring's model, the bond dissociation time τ− is:
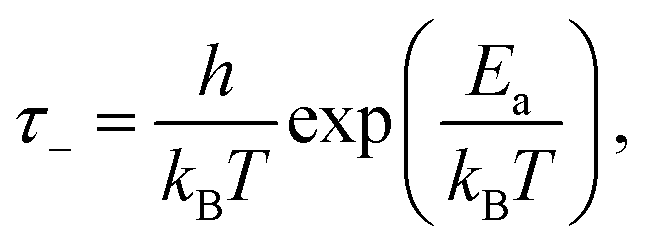 | (4) |
Such a fracture-like theory does not preclude any influence of visco-elasticity on the fracture behavior. For instance, viscoelastic fracture that agrees with Griffith fracture theory has been observed on much softer materials than the PSA we used.32 Then arises the question of how to link Chaudhury's theory and the building of a peeling master curve. In Fig. 4, the data presented in the peeling master curve (Fig. 2(b)) are plotted to be compared with Chaudhury's model (see eqn (2)): the square root of the rescaled strain energy release rate bRHG as a function of the rescaled peeling velocity aRHV in a log–linear scale.
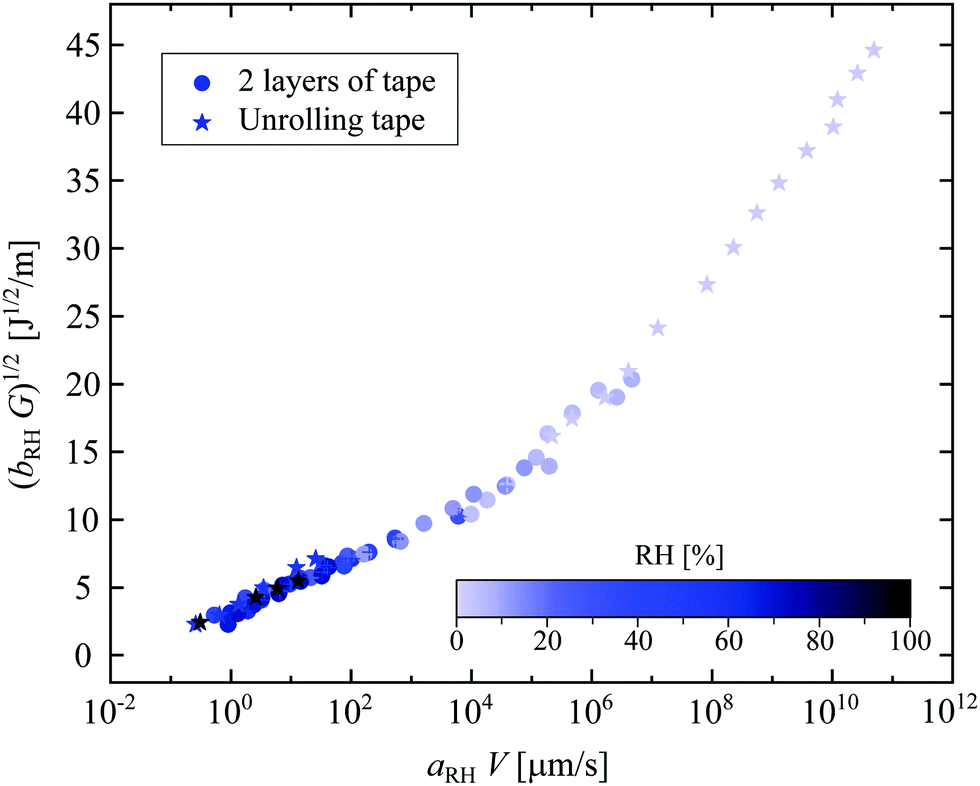 | ||
| Fig. 4 Square root of the rescaled strain energy release rate bRHG as a function of the rescaled peeling velocity aRHV on a log–linear scale. This graph presents the same data as in Fig. 2(b) but plotted so that it can be compared with Chaudhury's theory. | ||
As the data follow two lines, we distinguish two regimes. We attribute the regime at ‘high’ humidity to a competition between the interfacial dissipation, described by Chaudhury's model, and the viscous dissipation in the adhesive. Indeed, such bulk dissipation is not taken into account in Chaudhury's model. To our knowledge, there is no complete theory that proposes a picture of the whole mechanism. Note that the limit between these two behaviors is not sharp since part of the data at RH = 7.4% follows the same trend as some at RH = 1.7%. More extensive experiments with a controlled chemistry of the adhesive would be needed to clearly distinguish the boundary between bulk dissipation, reflected with the construction of the peeling master curve, and interfacial dissipation, explained by Chaudhury's model. Probe tests might be used to quantify the adhesion and investigate further these bulk and interfacial effects, as recently proposed by Wang et al.33 In addition, extra theoretical efforts are desired to construct a model that can include both the bulk and interfacial dissipation.
4 Conclusion
In summary, we provided an understanding of the force necessary to peel a typical PSA depending on the environmental conditions. The first surprise is the sensitivity to the humidity: the more humid the environment, the faster the tape peels for a given force, with a power-law relationship between speed and force that can be successfully described using a master curve applying ‘time–humidity’ superposition. The second surprise is that for very low humidities, the adhesive becomes strongly elastic and a completely different regime emerges. Chaudhury's theory of rate-dependent bond fracture allows the observed logarithmic dependence of the peeling velocity on the strain energy release rate to be quantitatively described as an activated process, which explains also the previously reported power-law behavior with an inexplicably small exponent in this regime. This work opens the way to developing a complete quantitative understanding of soft visco-elastic adhesives by showing that, depending on the external parameters, either viscous or elastic behavior can be expected and explained.Conflicts of interest
There are no conflicts to declare.Acknowledgements
This project has received funding from the European Research Council (ERC) under the European Union's Horizon 2020 research and innovation program (Grant agreement No. 833240). We are much indebted to M. Golden who first suggested this experiment, and acknowledge very helpful discussions with M. Ciccotti and C. Creton.Notes and references
- J. N. Israelachvili, Intermolecular and Surface Forces, Academic Press, 3rd edn, 2015 Search PubMed.
- C. Creton, MRS Bull., 2003, 28, 434–439 CrossRef CAS.
- C. Creton and M. Ciccotti, Rep. Prog. Phys., 2016, 79, 046601 CrossRef PubMed.
- D. H. Kaelble, J. Colloid Sci., 1964, 19, 413–424 CrossRef.
- A. N. Gent, R. P. Petrich and D. Tabor, Proc. R. Soc. London, Ser. A, 1969, 310, 433–448 Search PubMed.
- C. Derail, A. Allal, G. Marin and P. Tordjeman, J. Adhes., 1998, 68, 203–228 CrossRef CAS.
- J. Chopin, R. Villey, D. Yarusso, E. Barthel, C. Creton and M. Ciccotti, Macromolecules, 2018, 51, 8605–8610 CrossRef CAS.
- R. S. Rivlin, in Collected Papers of R.S. Rivlin: Volume I and II, ed. G. I. Barenblatt and D. D. Joseph, Springer, New York, NY, 1997, pp. 2611–2614 Search PubMed.
- M. Barquins and D. Maugis, J. Adhes., 1981, 13, 53–65 CrossRef CAS.
- A. J. Crosby and K. R. Shull, J. Polym. Sci., Part B: Polym. Phys., 1999, 37, 3455–3472 CrossRef CAS.
- R. Villey, C. Creton, P.-P. Cortet, M.-J. Dalbe, T. Jet, B. Saintyves, S. Santucci, L. Vanel, D. J. Yarusso and M. Ciccotti, Soft Matter, 2015, 11, 3480–3491 RSC.
- D. Maugis and M. Barquins, J. Phys. D: Appl. Phys., 1978, 11, 1989–2023 CrossRef.
- M. Barquins and M. Ciccotti, Int. J. Adhes. Adhes., 1997, 17, 65–68 CrossRef CAS.
- G. Marin and C. Derail, J. Adhes., 2006, 82, 469–485 CrossRef CAS.
- J. D. Ferry, Viscoelastic Properties of Polymers, Wiley, 1961 Search PubMed.
- S. Onogi, K. Sasaguri, T. Adachi and S. Ogihara, J. Polym. Sci., 1962, 58, 1–17 CrossRef CAS.
- S.-M. Zhou, K. Tashiro and T. Ii, J. Polym. Sci., Part B: Polym. Phys., 2001, 39, 1638–1650 CrossRef CAS.
- V. Fabre, G. Quandalle, N. Billon and S. Cantournet, Polymer, 2018, 137, 22–29 CrossRef CAS.
- A. Ishisaka and M. Kawagoe, J. Appl. Polym. Sci., 2004, 93, 560–567 CrossRef CAS.
- N. B. Hatzigrigoriou, S. N. Vouyiouka, C. Joly, P. Dole and C. D. Papaspyrides, J. Appl. Polym. Sci., 2012, 125, 2814–2823 CrossRef CAS.
- N. B. Hatzigrigoriou, C. D. Papaspyrides, C. Joly, J. Pinte and P. Dole, Polym. Eng. Sci., 2011, 51, 532–541 CrossRef CAS.
- N. Bianchi, F. Garbassi, R. Pucciariello and G. Romano, Int. J. Adhes. Adhes., 1990, 10, 19–23 CrossRef CAS.
- H. Lakrout, C. Creton, D. Ahn and K. R. Shull, Macromolecules, 2001, 34, 7448–7458 CrossRef CAS.
- M. K. Chaudhury, J. Phys. Chem. B, 1999, 103, 6562–6566 CrossRef CAS.
- A. Ghatak, K. Vorvolakos, H. She, D. L. Malotky and M. K. Chaudhury, J. Phys. Chem. B, 2000, 104, 4018–4030 CrossRef CAS.
- C.-Y. Hui, T. Tang, Y.-Y. Lin and M. K. Chaudhury, Langmuir, 2004, 20, 6052–6064 CrossRef CAS PubMed.
- E. Evans and K. Ritchie, Biophys. J., 1997, 72, 1541–1555 CrossRef CAS PubMed.
- Z. Zhu, Y. Xia, J. Li, C. Jiang and H. Jiang, Eng. Fract. Mech., 2019, 222, 106743 CrossRef.
- J. Macron, B. Bresson, Y. Tran, D. Hourdet and C. Creton, Macromolecules, 2018, 51, 7556–7566 CrossRef CAS.
- F. J. Cedano-Serrano, U. Sidoli, A. Synytska, Y. Tran, D. Hourdet and C. Creton, Macromolecules, 2019, 52, 3852–3862 CrossRef CAS.
- Y. Wang, J. Long, Y. Bai, L. Shao and S. Qi, J. Adhes. Sci. Technol., 2016, 30, 300–312 CrossRef CAS.
- D. Bonn, H. Kellay, M. Prochnow, K. Ben-Djemiaa and J. Meunier, Science, 1998, 280, 265–267 CrossRef PubMed.
- Q. Wang, W. B. Griffith, M. Einsla, S. Zhang, M. L. Pacholski and K. R. Shull, Macromolecules, 2020, 53, 6975–6983 CrossRef CAS.
Footnote |
| † Electronic supplementary information (ESI) available: Complete data of peeling experiments, details on the measurement of the absorbed water content in the adhesive, IR spectrophotometry of tape 3M 810 and 3M 600 and a discussion on the stretching of fibrils. More details on the procedure used to extract the Young's modulus of the backing of the Scotch tape and how to calculate the peeling velocity from humidity measurements. See DOI: 10.1039/d1sm01270c |
| This journal is © The Royal Society of Chemistry 2022 |