 Open Access Article
Coupling of PET waste electroreforming with green hydrogen generation using bifunctional catalyst†
Ying
Li‡
ab,
Li Quan
Lee‡
 b,
Zhi Gen
Yu
 c,
Hu
Zhao
 b,
Yong-Wei
Zhang
 c,
Pingqi
Gao
 *a and
Hong
Li
 *b
*b
aSchool of Materials, Guangdong Provincial Key Laboratory of Photovoltaic Technology, State Key Laboratory of Optoelectronic Materials and Technologies, Sun Yat-sen University, Guangzhou, 510275, China. E-mail: gaopq3@mail.sysu.edu.cn
bSchool of Mechanical and Aerospace Engineering, Nanyang Technological University, 639798, Singapore. E-mail: ehongli@ntu.edu.sg
cInstitute of High Performance Computing, 138632, Singapore
First published on 28th September 2022
Abstract
Cost-effective and high-efficiency bifunctional electrocatalysts for electrooxidation of polyethylene terephthalate (PET) waste and green hydrogen generation are very crucial for practical implementation yet rarely reported. Herein, a bifunctional catalyst of cobalt modified nickel phosphide nanosheet arrays on nickel foam (Co-Ni2P/NF) for both PET hydrolysate oxidation reaction and hydrogen evolution reaction (HER) is reported, which is obtained by a facile hydrothermal and phosphidation treatment. The electrocatalyst is highly active for both PET hydrolysate oxidation reaction and HER with low overpotentials of 90 and 148 mV, respectively, to achieve a current density of 50 mA cm−2. By coupling PET hydrolysate oxidation reaction with HER, the assembled electrolyzer with Co-Ni2P/NF as a bifunctional catalyst only requires 1.43 V to afford 10 mA cm−2, much lower than that needed for pure water splitting (1.55 V). Complementary DFT study provides an in-depth understanding of HER and electrooxidation of PET on Co-Ni2P/NF. Our work suggests that electroreforming of abundant PET waste could be an energy-efficient and sustainable strategy for both plastic waste valorization and green hydrogen production via using a cost-effective and active bifunctional catalyst.
Introduction
Hydrogen (H2) has been dubbed “the cleanest energy source in the world” because its combustion product is pure water. Moreover, H2 is also a stable media for storing intermittent renewable energy, thus is expected to play a pivotal role for a sustainable energy future.1–3 Nevertheless, only green H2 is clean and emits negligible carbon in its life cycle. Water splitting is the only method to produce green H2.4–6 A thermodynamic voltage of at least 1.23 V is required for H2O molecular breakage, where substantial amount of energy is used to oxidize water that produces the by-product oxygen.7,8 Therefore, replacing water oxidation with a new oxidation reaction to reduce energy consumption and to produce higher value product (than oxygen) is attracting ever-increasing interest.9,10 Electrooxidation of many different organic molecules has been reported to couple with HER for green H2 generation, such as biomass,11–13 hydrazine,14,15 isopropanol,16 benzylamine,17 urea,18 formic acid,19 and so on.To this end, polyethylene terephthalate (PET) plastic, as an organic polymer, also can be used to assist the production of green H2. Due to its excellent tensile strength, thermal stability, electrical insulation, processability, chemical resistance, non-toxicity, and tastelessness, PET is often used in electronic devices, clothing, and product packaging, etc.20 Among them, PET bottles account for about one third of the total amount of PET produced (∼24 million tons),21 and are widely used for food, chemical, and pharmaceutical packaging. Although PET bottles have brought a lot of convenience to our daily life, the natural degradation of their waste requires hundreds of years, which causes serious environmental issues, i.e., “white pollution”.22 The recycling of PET waste can not only address environment issue but also recover important resources, being very crucial for sustainable development. Therefore, it is undoubtedly attractive to combine the electroreforming of waste PET bottles with H2 production.
As far as we know, only few reports to date focus on the plastic electroreforming-assisted green H2 generation. Duan and coworkers successfully synthesized CoNi0.25P electrocatalyst for electrocatalytic upcycling of PET to produce formate and H2. The results reveal that the Faradaic efficiency and selectivity of formate reach more than 80% in a membrane-electrode assembly reactor when the current density is 500 mA cm−2.21 Zhao's group successfully converted PET to formate by using CuO NWs/CF and meanwhile assisted H2 production. Experimental and density functional theory (DFT) calculation demonstrated that the optimal reaction pathway on CuO NWs is to generate the glyoxal intermediate and obtain formate through the C-C bond cleavage with a high selectivity of 86.5%.23 However, pure PET plastics were used in these studies, and there is no report on the electroreforming of raw plastic waste coupled with H2 generation yet.
Herein, we electroreform raw waste PET bottles to assist H2 production via electrolysis. We firstly explore the maximum solubility of waste PET bottles in sodium hydroxide (NaOH), and then optimize an efficient and active electrocatalyst for electrooxidation of PET bottles hydrolysate, namely cobalt-modified nickel phosphide nanosheets on the nickel foam (Co-Ni2P/NF). Moreover, Co-Ni2P/NF serving as a bifunctional electrocatalyst are assembled to form an electrolytic cell, which only requires a voltage of 1.43 V to achieve a current density of 10 mA cm−2 in 1 M NaOH electrolyte with 5 g L−1 PET, and the Faradaic efficiency of formate can reach 85%, while the recovery of terephthalic acid (TPA) was as high as 80%.
Experimental section
The synthesis of Co-modified Ni2P nanosheets on Ni foam (Co-Ni2P/NF)
To produce a series of ultrathin Cox-Ni2P/NF nanosheets (x = 0.2, 0.4, 0.6, 0.8), (1 − x) mL 0.5 M nickel(II) chloride hexahydrate (NiCl2·6H2O), x mL 0.5 M cobaltous chloride (CoCl2·6H2O), and 1 mL ammonium hydroxide (NH3·H2O) were mixed to obtain a uniform solution. And then 1 × 1 cm2 nickel foam (NF) was immerged into the uniform solution and 1 mL hydrazine hydrate (N2H4) solution was added. The solution was then heated at 75 °C for 10 h, obtaining layered cobalt modified nickel hydroxide precursor on NF [termed as Cox-Ni(OH)2/NF].Afterward, a piece of Cox-Ni(OH)2/NF and 0.05 g sodium hypophosphite (NaH2PO2·H2O) were placed in two different combustion boats with NaH2PO2·H2O boat located at upstream of a tube furnace and then heated at 300 °C for 2 h with a flow of argon. The excess PH3 in the product was absorbed by the saturated copper(II) sulfate (CuSO4) solution after treatment at the downstream. Finally, the product (Cox-Ni2P/NF) was obtained after being naturally cooled down to room temperature, followed by repeat water cleaning, and then drying at 60 °C for 10 h.
CoP/NF and Ni2P/NF were also fabricated as control samples. The synthetic method of CoP/NF nanosheets and Ni2P/NF nanosheets was similar to that of Cox-Ni2P/NF nanosheets, except that the mixture solution of NiCl2·6H2O and CoCl2·6H2O was substituted by pure CoCl2·6H2O or NiCl2·6H2O, respectively.
Electrochemical characterizations
HER characterization and PET hydrolysate electrooxidation process were carried out in a typical three-electrode system. Electrocatalyst supported on NF was used as working electrode, Ag/AgCl electrode and carbon rod acted as reference electrode and counter electrode, respectively. LSV curves were compensated according to: Ecompensated = Emeasured − IRs, where Rs is the solution resistance extracted from the electrochemical impedance spectroscopy (EIS) measurement.24 And according to the equation ERHE = EAg/AgCl + 0.197 V + 0.0591 pH, all electrode potentials have been calibrated as reversible hydrogen electrode (RHE).In addition, the Faradaic efficiency (FE) for the PET electrooxidation to formate is determined by equation: FE = (3Fn)/Q, where F is Faraday's constant (96![[thin space (1/6-em)]](https://www.rsc.org/images/entities/char_2009.gif) 485 C mol−1), n represents the moles of the formate produced, and Q is the total charge passed across the electrode during electrolysis.21,25
485 C mol−1), n represents the moles of the formate produced, and Q is the total charge passed across the electrode during electrolysis.21,25
Hydrolysis of waste PET bottles
The mixture of various white waste PET plastic bottles was briefly rinsed with water and dried at 70 °C (for precise weighing). Different amounts of the PET bottle fragment (0.5 g, 1.25 g, 3.75 g) were added to 25 mL 10 M sodium hydroxide (NaOH) solution, and stirred at 80 °C for 10 h. After cooling to room temperature, water was added to increase solution volume to 250 ml, and then it was stirred until the PET fragments were completely dissolved. The electrolytes with different PET contents (marked as 2 g L−1, 5 g L−1, 15 g L−1) were prepared.Computational method
All the calculations were carried out using the density functional theory (DFT) with the generalized Perdew–Burke–Ernzerhof (PBE)26 with DFT + U (Ueff = U − J = 5.3 for Ni and Ueff = U − J = 4.0 for Co) and the projector augmented-wave (PAW) pseudopotential plane-wave method27 as implemented in the VASP code.28 For the PAW pseudopotential, we included 3d84s1, 3d84s2, 2s22p4, 2s22p2 and 1s1 were treated as valence electrons for Co, Ni, O, C and H atoms, respectively. A 5 × 5 × 3 Monkhorst–Pack (MP) k-point grid was used for Ni2P bulk optimization and a plane-wave basis set with an energy cutoff of 400 eV considering the spin polarization. Good convergence was obtained with these parameters and the total energy was converged to 1.0 × 10⁻⁶ eV per atom. The optimized bulk model was used to build the (201) surface unitcell and further expanded to a 6-atom layer 3 × 2 × 1 supercell with a vacuum separation of ∼18 Å for H adsorption and ethylene glycol (EG) reduction process studies. We carried out calculations with the van der Waals (vdW) correction by employing optB86b-vdW functional using a 2 × 2 × 1 MP k-point grid.29Results and discussion
Synthesis and characterization of electrocatalysts
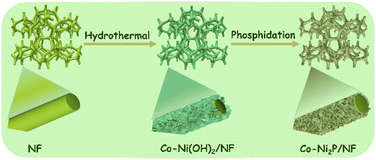
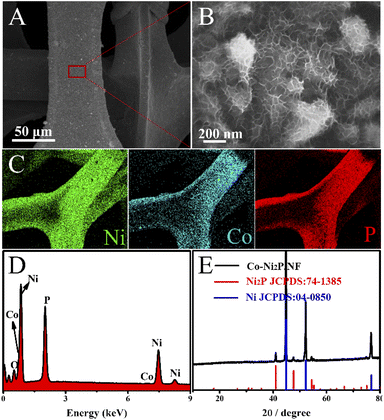
Co-Ni2P/NF electrode was successfully obtained through a facile two-step process. As shown in the Scheme 1, cobalt modified nickel hydroxide nanosheet arrays on nickel foam (denoted as Co-Ni(OH)2/NF) was first achieved (Fig. S1†). Secondly, the final electrocatalyst of Co-Ni2P/NF was obtained by phosphidation with NaH2PO2·H2O at 300 °C for 2 h.The morphological characterizations of Co-Ni2P/NF were analyzed by the scanning electron microscopy (SEM). As depicted in Fig. S2,† the morphologies of four Co-Ni2P/NF samples are nanosheets, indicating that the variation of Co content does not affect the unique lamellar structure of the electrocatalysts. We chose Co0.6-Ni2P/NF for more detailed characterization. As shown in Fig. 1A and B, the Co0.6-Ni2P/NF nanosheets are uniformly distributed over the entire surface of 3D porous NF and inherit the highly cross-linked ultrathin layered structure of Co-Ni(OH)2. The chemical composition of the Co0.6-Ni2P/NF were characterized by SEM-mapping, energy-dispersive X-ray spectrum (EDS), and the X-ray diffraction (XRD). The mapping images display the uniform distribution of Ni, Co, and P element (Fig. 1C), indicating the successful synthesis of metal phosphide. And the EDS spectrum further proves the Co element in the product (Fig. 1D). As depicted in Fig. 1E, the XRD pattern suggests that the remaining peaks perfect match with (111), (210), (300) and (211) planes of hexagonal Ni2P (JCPDS no. 74-1385) expect for the NF substrate (JCPDS no. 04-0850), suggesting the main component of the product is Ni2P. Due to its low content and the influence of the substrate, the peaks of cobalt species could not be observed. Putting together, the Co modified Ni2P nanosheets were successfully obtained.
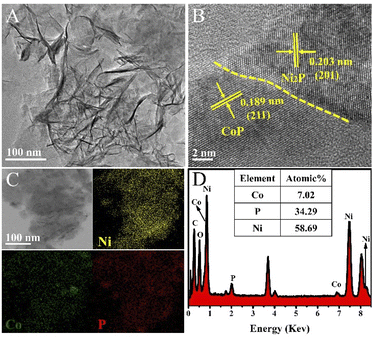
Transmission electron microscopy (TEM) images further show that Co modified Ni2P nanosheets have been synthesized successfully (Fig. 2A). More detail about the composition and structures were established by high-resolution transmission electron microscopy (HRTEM). As shown in Fig. 2B, the HRTEM reveals that the heterointerface structure exists in the ultrathin Co0.6-Ni2P nanosheets, and the interfaces between CoP and Ni2P marked with yellow dotted line can be clearly observed. The lattice fringes in different regions can match with two different material of CoP and Ni2P, respectively. The interplanar spacing of 0.203 nm is agreement with the (201) plane of Ni2P, and the lattice fringe spacing of 0.189 nm can be indexed to (211) plane of CoP. The EDS elemental mapping analysis of Co0.6-Ni2P nanosheets are depicted in Fig. 2C. It can be observed that the elements of Co, Ni and P are uniformly dispersed in the nanosheets. Furthermore, the composition ratio of CoP and Ni2P in Co0.6-Ni2P/NF is about 1![[thin space (1/6-em)]](https://www.rsc.org/images/entities/char_2009.gif) :
:![[thin space (1/6-em)]](https://www.rsc.org/images/entities/char_2009.gif) 4 (Fig. 2D), as obtained from EDS analysis.
4 (Fig. 2D), as obtained from EDS analysis.
As presented in Fig. 3, the chemical valence of Co0.6-Ni2P/NF was analyzed by X-ray photoelectron spectroscopy (XPS). The Co, Ni and P elements can be obviously seen from the full spectrum of Co0.6-Ni2P/NF (Fig. 3A). As illustrated in Fig. 3B, two narrow peaks at 874.5 eV and 856.7 eV in the Ni 2p XPS spectrum correspond to Ni 2p1/2 and Ni 2p3/2 of the oxidized Ni species, while the peaks located at 861.8 eV and 880.3 eV belong to satellite peaks.30,31 Furthermore, other two peaks centered at 852.9 eV and 869.8 eV are consistent with Ni–P bonds.32–34 On the Co 2p XPS spectrum, the two peaks located at 778.6 eV and 793.7 eV correspond to Co 2p3/2 and Co 2p1/2 of Co–P, respectively. And the two peaks located at 782.0 eV and 798.2 eV are consistent with Co–O bond, with two satellites detected at 803.4 eV and 786.0 eV (Fig. 3C).35,36 As presented in Fig. 3D, one can observe two peaks located at 129.0 eV and 130.0 eV, which are corresponding to P 2p3/2 and P 2p1/2, respectively.37 In addition, a broad peak located at 134.0 eV is originating from a surface oxidization.38–40
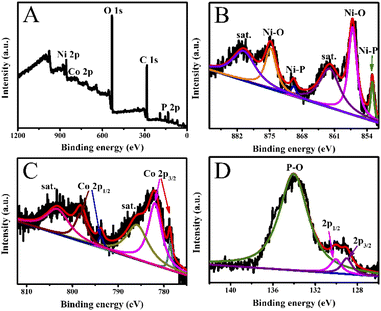 | ||
| Fig. 3 (A) XPS survey spectrum, and high-resolution XPS spectra of (B) Ni 2p, (C) Co 2p, and (D) P 2p of Co0.6-Ni2P/NF. | ||
HER electrocatalytic performance of the prepared catalysts
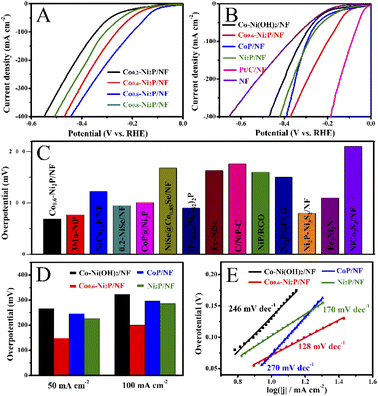
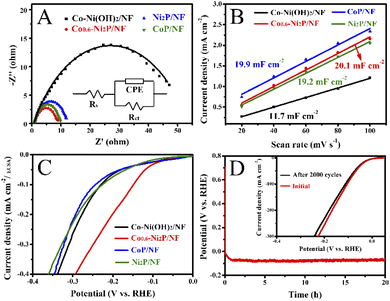
As shown in Fig. 4A, HER activity was assessed by linear sweep voltammetry (LSV) curves in 1 M NaOH electrolyte. Co0.6-Ni2P/NF exhibits the highest HER activity, which only requires an overpotential of 69 mV to achieve a current density of 10 mA cm−2. As depicted in Fig. 4B and D, the overpotential (148 mV) of Co0.6-Ni2P/NF at 50 mA cm−2 is much smaller than that of Ni2P/NF (226 mV), CoP/NF (246 mV), Co-Ni(OH)2/NF (266 mV) and NF (284 mV). To achieve a current density of 100 mA cm−2, Co0.6-Ni2P/NF only requires an overpotential of 200 mV (Fig. 4D). Notably, although the HER activity of Co0.6-Ni2P/NF is inferior to that of Pt/C/NF (24 mV), it is still superior to most of reported Ni/Co-based HER electrocatalysts (Fig. 4C).14,41–52As illustrated in Fig. 4E, the Tafel slope value of Co0.6-Ni2P/NF, Ni2P/NF, CoP/NF, and Co-Ni(OH)2/NF are 128, 170, 297, and 275 mV dec−1, respectively, suggesting that Co0.6-Ni2P/NF exhibits significantly faster HER kinetics than other electrocatalysts. As presented in Fig. 5A, the electrochemical impedance spectroscopy (EIS) analysis shows that Co0.6-Ni2P/NF has the lowest Rct value (7.6 Ω) among Co-Ni(OH)2/NF (46.4 Ω), CoP/NF (8.5 Ω), and Ni2P/NF (10.8 Ω), suggesting Co0.6-Ni2P/NF's strongest charge transfer ability and fastest kinetics among all electrocatalysts tested.53,54 The electrochemically active surface (ECSA) of the electrocatalysts are obtained by calculating the double layer capacitances (Cdl) (Fig. S3†). As depicted in Fig. 5B, Co0.6-Ni2P/NF exhibits a highest Cdl (20.1 mF cm−2) and thus largest ECSA among Co-Ni(OH)2/NF (11.7 mF cm−2), CoP/NF (19.2 mF cm−2), and Ni2P/NF (19.9 mF cm−2). The improved ECSA can be ascribed to the rough surface and 3D porous nanostructure that offers abundant active sites. Undoubtedly, the increase of the active edges/sites is favorable to enhance the interface with electrolyte, the adsorption of water molecule, and the release of H2, thereby enhancing the HER electrocatalytic activity.55,56Fig. 5C shows that Co0.6-Ni2P/NF exhibits higher intrinsic HER activity (normalized by ECSA), implying that the high total activity of Co0.6-Ni2P/NF is not only due to its large ECSA but also to its high intrinsic activity.
We further support the excellent HER performance of Co-Ni2P/NF with theoretical investigation. The optimized unit cell of Ni2P was shown in Fig. S4.† The expanded (210) supercell contains 108 Ni and 54 P atoms. Only one Co atom was considered embedded into the Ni2P surface. Considering three different embedding sites for Co on the surface and the relative energy reveal that the Co prefer to replace Ni at the 4-fold site.
The first step of HER is the electrochemical adsorption process: H+ + e− → H*, the second step is the electrochemical discharge process: H* + H+ +e− → H2 or chemical desorption process: 2H* → H2.57 The Gibbs free energy of ΔGH has been successfully used as a suitable descriptor for evaluating the HER catalytic activity of various materials. Generally, the optimal value of ΔGH is 0 eV, where hydrogen is adsorbed neither too strongly nor too weakly to facilitate both hydrogen adsorption and desorption.57
The adsorption energy (ΔEH) is computed as
| ΔEH = E(*H) − E(*) − 1/2 E(H2) |
The Gibbs free energy of H (ΔGH) is defined as:
| ΔGH = ΔEH + ΔEZPE − TΔSH |
 ), where
  is the entropy of gas phase H2 at standard conditions.
The calculated Gibbs free energies of hydrogen (ΔGH) on the pristine and Co doped Ni2P surfaces are shown in Fig. S5.† It can be observed that the ΔGH is 418 meV on the pristine surface and dramatically decreases to 190 meV on Co doped surface. Based on our simulation results, it can be considered that doping Co atoms in Ni2P can reduce the HER overpotential. It should be noted that only one Co atom was embedded into Ni2P systems. Since the active site for HER is changed to Co, we consider that more Co doping within the solubility may further reduce the overpotential. Notably, our theoretical results are consistent with the experimental values, in which it was found that Co0.6-Ni2P/NF exhibits the highest HER activity with an overpotential of 69 mV.
Finally, the stability of Co0.6-Ni2P/NF in 1 M NaOH is accessed by the chronopotentiometric curve. As depicted in Fig. 5D, there was no noticeable decrease of HER current density during a 20 h continuous electrolysis. Indeed, SEM image reveals the morphology of Co0.6-Ni2P/NF retained well after 20 h continuous operation thanks to the great structural integrity due to the direct growth of Co0.6-Ni2P on NF (Fig. S6A†). Moreover, the HER activity was retained well with a small increase of only 10 mV at 100 mV cm−2 after 2000 potential cycles (inset of Fig. 5D). It should be noted that the composition of Co0.6-Ni2P/NF after HER test showed no noticeable changes (Fig. S6B–F†). The excellent HER performances of Co0.6-Ni2P/NF can be explained as follows. Firstly, the in situ growth of Co0.6-Ni2P on NF support not only reinforces the interaction between Co0.6-Ni2P nanosheet and NF, enhancing the structural integrity, but also improves electrical conductivity, facilitating efficient charge transport.58–60 Secondly, Co0.6-Ni2P possesses ultrathin nanosheet structure and a large electrochemical active area, beneficial for the exposure of more active sites. Also, the 3D porous structure can provide abundant channels to facilitate ion transfer and release of product (H2), thus giving rise to the boosted catalytic kinetics.61,62 Thirdly, the phosphorus and metal in Co0.6-Ni2P nanosheets play an important role in capturing nearby protons and act as acceptor centers for adsorbed hydrides, promoting HER process.63,64 Lastly, Co doping and the interface formed between CoP and Ni2P can further improve the catalytic activity by adjusting the electronic structure of the electrocatalyst.65–67
The effect of PET hydrolysate concentration on electrooxidation activity
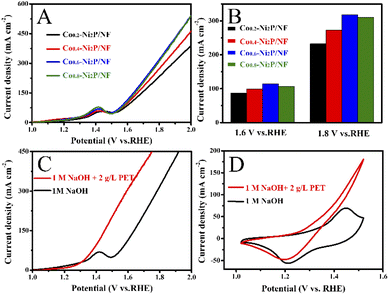
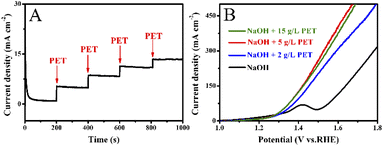
Fig. 6A and B show that Co0.6-Ni2P/NF nanosheet exhibits the highest current density for oxygen evolution reaction (OER) at the same voltage in 1 M NaOH. The LSV curves show that the voltage required for the PET hydrolysate electrooxidation of Co0.6-Ni2P/NF is significantly lower than that of OER at the same current density (Fig. 6C). To achieve 100 mA cm−2, Co0.6-Ni2P/NF only requires an overpotential of 174 mV in 1 M NaOH with 2 g L−1 PET, which is much lower than that of OER (350 mV). CV curves further show that the PET hydrolysate electrooxidation current density of Co0.6-Ni2P/NF at 1.5 V vs. RHE has reached 183 mA cm−2 while that of OER is only 46 mA cm−2 (Fig. 6D). These observations indicate that PET hydrolysate electrooxidation is much more favorable than OER thermodynamically.Fig. 7A shows that the current density gradually increases with the addition of 0.5 mL PET hydrolysate (5 g L−1) at 1.5 V. However, the magnitude of each increase in current density gradually decreases. As illustrated in Fig. 7B, one can observe that the current density increases at first and then decreases with increasing PET hydrolysate concentration, and peaks at 5 g L−1. Too high concentration (>5 g L−1) could severely affect the mass transfer and ionic conductivity, and thus decrease the total activity.
PET hydrolysate electrooxidation activity comparison
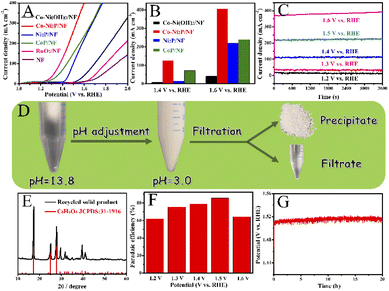
Next, we investigate the PET hydrolysate electrooxidation performance of the five electrocatalysts under the same experimental conditions. As depicted in Fig. 8A, the PET hydrolysate electrooxidation activity of Co-Ni2P/NF is much better than other electrocatalysts. Specifically, Co-Ni2P/NF only requires an overpotential of 90 mV to reach a current density of 50 mA cm−2, which is much smaller than those of CoP/NF (140 mV), Ni2P/NF (230 mV), Co-Ni(OH)2/NF (385 mV), RuO2/NF (422 mV) and NF (544 mV). The current density of Co-Ni2P/NF at 1.4 V and 1.6 V are 125 and 402 mA cm−2, respectively, which are higher than those of the rest electrocatalysts (Fig. 8B). Continuous electrolysis for 1 h at different voltages (Fig. 8C) was conducted, followed by pH adjust using HCl. White substances were precipitated during this process (Fig. 8D). The liquid electrolyte and precipitate were separated by filtration, wherein the precipitate was confirmed to be terephthalic acid (TPA, C8H6O4) by XRD with recovery yield of 80% (Fig. 8E). Additionally, the liquid product was characterized by high-performance liquid chromatography (HPLC). As depicted in Fig. S7,† the content of ethylene glycol (EG) was the highest at 1.2 V vs. RHE, and the electrooxidation rate of EG accelerated when the applied voltage increased. After 1 h electrolysis, the main product was formate, and its maximum FE was about 85% at 1.5 V vs. RHE (Fig. 8F).To further verify the durability of Co-Ni2P/NF for electroreforming of PET hydrolysate, continuous electrolysis was conducted for 20 h at a constant current density of 200 mA cm−2, as illustrated in Fig. 8G. The imperceptible potential change shows the excellent stability of Co-Ni2P/NF electrode for PET electroreforming. Moreover, the morphology of Co-Ni2P/NF was dominated by nanosheets after 20 h continuous electrolysis (Fig. S8A†). As depicted in Fig. S8B–F,† Co-Ni2P/NF underwent partial reconstruction and oxidation after PET hydrolysate oxidation, generating metal oxy(hydroxide) analogue. Based on our experimental results and previous studies,21,25 we proposed the process of waste PET bottle recycling, as shown in Fig. S9,† which mainly includes three steps, namely: (1) waste PET bottle hydrolysis (red part), (2) electrooxidation of EG (blue part) and (3) the separation of TPA and formic acid (black part).
We have also investigated the energy landscape of electrooxidation ethylene glycol (EG). Here, we proposed the possible reaction steps and the sketch of the electrooxidation process of the EG is shown in Fig. S10.†
The electrooxidation reaction energy (ΔEiEG) of each step is defined as
| CH2OHCH2OH* + 2OH− → CH2OCH2O* + 2 H2O + 2e− ΔE1EG |
| CH2OCH2O* + 2OH− → CHOCHO* + 2 H2O + 2e− ΔE2EG |
| CHOCHO* → CHO* + CHO* ΔE3EG |
| CHO* + 2OH− → HCOO* + H2O + 2e− ΔE4EG |
The calculated energy landscapes of EG electrooxidation on the pristine and Co doped Ni2P surfaces are shown in Fig. S11.† We calculated the reaction energy of each step based on the proposed EG electrooxidation process. In comparison, removing two protons from EG (ΔE1EG) needs 2.193 eV on the pristine Ni2P surface, it dramatically decreases to 1.243 eV on Co doped Ni2P surface. However, the value of ΔE2EG is 1.916 eV, slightly lower than 2.043 eV with Co doping. Therefore, we consider that embedding Co atoms can't reduce the energy step for removing two additional protons. Breaking the C–C bond needs the energy of 3.400 eV on the pristine Ni2P surface, which is much higher than that on Co doped Ni2P surface of 1.774 eV. The final step of adsorption of OH− is an exothermic reaction on the pristine and Co doped Ni2P surface. Overall, breaking the C–C bonds is the energy-determining step for the electrooxidation of EG based on our DFT simulations, and chemical doping of Co should be responsible for enhancing the reaction process and reduce the energy consumption for EG electrooxidation reactions.
PET hydrolysate electroreforming-assisted water splitting
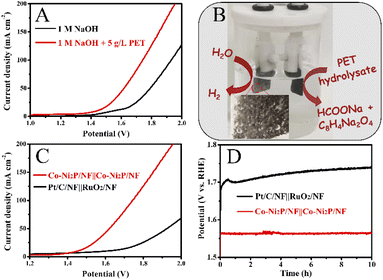
Lastly, we explore the waste PET bottle electroreforming-assisted water splitting in a two-electrode system with Co-Ni2P/NF as the bifunctional electrode in 1 M NaOH electrolyte with 5 g L−1 PET. As depicted in Fig. 9A, the Co-Ni2P/NF‖Co-Ni2P/NF electrolyzer requires an overall voltage of 1.43 V to achieve 10 mA cm−2, which is much less than that of the pure water electrolysis (1.55 V), indicating the PET electrooxidation-assisted water electrolyzer has higher energy conversion efficiency for H2 fuel than traditional water electrolyzer. During the electrolysis process, a great deal of H2 gas bubbles was observed from the cathode and the value-added chemicals (sodium formate and disodium terephthalate) were obtained from the anode (Fig. 9B), which effectively eliminated the potential explosion risk of H2/O2 mixture in the traditional water electrolyzer. Additionally, the potential of the Co-Ni2P/NF‖Co-Ni2P/NF electrolyzer (1.62 V) was much lower than that of commercial electrocatalysts, i.e., Pt/C/NF‖RuO2/NF electrolyzer (1.92 V) to achieve current density of 50 mA cm−2 (Fig. 9C). Furthermore, chronopotentiometric curves display that Co-Ni2P/NF‖Co-Ni2P/NF electrolyzer is more stable (with unnoticeable voltage change) than the Pt/C/NF‖RuO2/NF electrolyzer (voltage increase of 40 mV) during 10 h continuous electrolysis (Fig. 9D).Conclusion
We have successfully developed cobalt modified nickel phosphide electrocatalyst supported on Ni foam (Co-Ni2P/NF) by a facile hydrothermal and phosphidation treatment. With a large specific surface area, eminent electrical conductivity, and abundant active sites, the resultant Co-Ni2P/NF catalyst acts as a highly active and robust bifunctional electrocatalyst for HER and PET electrooxidation. The Co element is atomically dispersed in the Ni2P structure, forming unsaturated atomic heterometallic CoxNi1−xP sites that can effectively regulate the electronic structure of Ni and P atoms. As a result, the catalyst exhibits superior activity for electrooxidation PET hydrolysate in alkaline media, affording 50 mA cm−2 at a low potential of 1.32 V. A two-electrode electrolyzer with the Co-Ni2P/NF as a bifunctional electrocatalyst can achieve 10 mA cm−2 current density at a low voltage of 1.43 V for concurrent PET electroreforming and green H2 generation. This work not only provides a new facile method for the synthesis of bifunctional electrocatalysts through surface and interface engineering, but also opens a pathway for a sustainable recycling of PET bottles.Author contributions
Ying Li and Li Quan Lee: methodology, investigation, characterization, and writing—original draft. Hu Zhao: investigation and characterization. Zhi Gen Yu and Yong-Wei Zhang: density functional theory (DFT) calculation. Hong Li and Pingqi Gao: supervision, validation, writing—review & editing, and funding acquisition. All authors have given approval to the final version of the manuscript.Conflicts of interest
There are no conflicts to declare.Acknowledgements
This work was supported by the Nanyang Technological University (Grant no. NTU-ACE2021-02) and Natural Science Foundation for Distinguished Young Scholars of Guangdong Province (Grant no. 2019B151502053), and Chinese Scholarship Council is acknowledged for providing financial support to Ying Li as a Visiting PhD Student at the Nanyang Technological University.References
- T. N. Veziroğlu and S. Şahin, Energy Convers. Manage., 2008, 49, 1820–1831 CrossRef.
- H. Balat and E. Kırtay, Int. J. Hydrogen Energy, 2010, 35, 7416–7426 CrossRef CAS.
- M. Li, Z. Xu, Y. Li, J. Wang and Q. Zhong, Nano Select, 2021, 3, 147–156 CrossRef.
- N. Grimaldos-Osorio, F. Sordello, M. Passananti, P. Vernoux and A. Caravaca, J. Power Sources, 2020, 480, 228800 CrossRef CAS.
- S. Shiva Kumar and V. Himabindu, Mater. Sci. Energy Technol., 2019, 2, 442–454 Search PubMed.
- H. Li, H. Li, Y. Qiu, S. Liu, J. Fan and X. Guo, Nano Select, 2021, 2, 2148–2158 CrossRef CAS.
- A. Buttler and H. Spliethoff, Renewable Sustainable Energy Rev., 2018, 82, 2440–2454 CrossRef CAS.
- H. Okada, E. Tsuji, M. Hisada, S. Kitano, H. Habazaki, S. Suganuma and N. Katada, Sustainable Energy Fuels, 2022, 6, 2709–2717 RSC.
- K. Ye, G. Wang, D. Cao and G. Wang, Top. Curr. Chem., 2018, 376, 42 CrossRef PubMed.
- Y. Li, Z. Dang and P. Gao, Nano Select, 2021, 2, 847–864 CrossRef CAS.
- G. Yang, Y. Jiao, H. Yan, Y. Xie, A. Wu, X. Dong, D. Guo, C. Tian and H. Fu, Adv. Mater., 2020, 32, 2000455 CrossRef CAS PubMed.
- H. Zhao, D. Lu, J. Wang, W. Tu, D. Wu, S. W. Koh, P. Gao, Z. J. Xu, S. Deng, Y. Zhou, B. You and H. Li, Nat. Commun., 2021, 12, 2008 CrossRef CAS PubMed.
- S. Sreekantan, A. A. Balachandran Kirali and B. Marimuthu, Sustainable Energy Fuels, 2022, 6, 3681–3689 RSC.
- Y. Li, Y. Zhao, F. M. Li, Z. Dang and P. Gao, ACS Appl. Mater. Interfaces, 2021, 13, 34457–34467 CrossRef CAS.
- Q. Sun, Y. Li, J. Wang, B. Cao, Y. Yu, C. Zhou, G. Zhang, Z. Wang and C. Zhao, J. Mater. Chem. A, 2020, 8, 21084–21093 RSC.
- Y. Zhao, S. Xing, X. Meng, J. Zeng, S. Yin, X. Li and Y. Chen, Nanoscale, 2019, 11, 9319–9326 RSC.
- Y. Ding, B.-Q. Miao, S.-N. Li, Y.-C. Jiang, Y.-Y. Liu, H.-C. Yao and Y. Chen, Appl. Catal., B, 2020, 268, 118393 CrossRef CAS.
- M. Yao, J. Ge, B. Sun, J. Hu, S. W. Koh, Y. Zhao, J. Fei, Z. Sun, W. Hong, Z. Chen, W. Hu and H. Li, Chem. Eng. J., 2021, 414, 128753 CrossRef CAS.
- Q. Xue, X. Y. Bai, Y. Zhao, Y. N. Li, T. J. Wang, H. Y. Sun, F. M. Li, P. Chen, P. Jin, S. B. Yin and Y. Chen, J. Energy Chem., 2022, 65, 94–102 CrossRef.
- L. Wang, G. A. Nelson, J. Toland and J. D. Holbrey, ACS Sustainable Chem. Eng., 2020, 8, 13362–13368 CrossRef CAS.
- H. Zhou, Y. Ren, Z. Li, M. Xu, Y. Wang, R. Ge, X. Kong, L. Zheng and H. Duan, Nat. Commun., 2021, 12, 4679 CrossRef CAS PubMed.
- X. Jiao, K. Zheng, Q. Chen, X. Li, Y. Li, W. Shao, J. Xu, J. Zhu, Y. Pan, Y. Sun and Y. Xie, Angew. Chem., Int. Ed., 2020, 59, 1–6 CrossRef.
- J. Wang, X. Li, T. Zhang, Y. Chen, T. Wang and Y. Zhao, J. Phys. Chem. Lett., 2022, 13, 622–627 CrossRef CAS PubMed.
- H. Wang, Y. Li, R. Wang, B. He and Y. Gong, Electrochim. Acta, 2018, 284, 504–512 CrossRef CAS.
- J. Wang, X. Li, M. Wang, T. Zhang, X. Chai, J. Lu, T. Wang, Y. Zhao and D. Ma, ACS Catal., 2022, 12, 6722–6728 CrossRef CAS.
- J. P. Perdew, K. Burke and M. Ernzerhof, Phys. Rev. Lett., 1996, 77, 3865–3868 CrossRef CAS PubMed.
- P. E. Blöchl, Phys. Rev. B, 1994, 50, 17953–17979 CrossRef PubMed.
- G. Kresse and J. Furthmüller, Comput. Mater. Sci., 1996, 6, 15–50 CrossRef CAS.
- J. Klimeš, D. R. Bowler and A. Michaelides, Phys. Rev. B, 2011, 83, 195131 CrossRef.
- J. Liu, C. Li, Q. Ye, L. Lin, Y. Wang, M. Sun and Y. Cheng, Catal. Commun., 2022, 163, 106416 CrossRef CAS.
- S. Li, Y. Zou, L. Li, Y. Dong and Y. Zhu, ChemistrySelect, 2019, 4, 6295–6303 CrossRef CAS.
- T. Wang, X. Cao and L. Jiao, eScience, 2021, 1, 69–74 CrossRef.
- J. Xu, Y. Zhang, Z. Liu, Y. H. Chen and Z. Liu, Mater. Today Commun., 2021, 29, 102731 CrossRef CAS.
- Y. Liu, B. Wang, K. Srinivas, M. Wang, Z. Chen, Z. Su, D. Liu, Y. Li, S. Wang and Y. Chen, Int. J. Hydrogen Energy, 2022, 47, 12903–12913 CrossRef CAS.
- Y. Li, F. Li, Y. Zhao, S. N. Li, J. H. Zeng, H. C. Yao and Y. Chen, J. Mater. Chem. A, 2019, 7, 20658–20666 RSC.
- J. Sun, M. Ren, L. Yu, Z. Yang, L. Xie, F. Tian, Y. Yu, Z. Ren, S. Chen and H. Zhou, Small, 2019, 15, 1804272 CrossRef PubMed.
- X. Yang, A. Y. Lu, Y. Zhu, M. N. Hedhili, S. Min, K. W. Huang, Y. Han and L. J. Li, Nano Energy, 2015, 15, 634–641 CrossRef CAS.
- L. Ji, J. Wang, X. Teng, T. J. Meyer and Z. Chen, ACS Catal., 2019, 10, 412–419 CrossRef.
- Y. Li, H. Zhang, M. Jiang, Y. Kuang, X. Sun and X. Duan, Nano Res., 2016, 9, 2251–2259 CrossRef CAS.
- T. J. Wang, Y. C. Jiang, J. W. He, F. M. Li, Y. Ding, P. Chen and Y. Chen, Carbon Energy, 2022, 4, 283–293 CrossRef CAS.
- C. X. Zhang, D. Li and Y. Xu, J. Mater. Res., 2022, 37, 807–817 CrossRef CAS.
- T. Kong, Y. W. Sui, J. Q. Qi, F. X. Wei, Y. J. Ren, Z. Z. Zhan, Z. Sun, M. H. Zhou, D. M. Meng, L. J. Zhang, L. Ma and Q. Wang, J. Mater. Sci.: Mater. Electron., 2021, 32, 1951–1961 CrossRef CAS.
- H. Jin, S. Liu, L. Pei, G. Li, Z. F. Ma, W. F. Bai, S. T. Wu, Y. J. Yuan and J. S. Zhong, RSC Adv., 2021, 11, 22467–22472 RSC.
- W. L. Ding, Y. H. Cao, H. Liu, A. X. Wang, C. J. Zhang and X. R. Zheng, Rare Met., 2021, 40, 1373–1382 CrossRef CAS.
- W. Zhang, Y. Zou, H. Liu, S. Chen, X. Wang, H. Zhang, X. She and D. Yang, Nano Energy, 2019, 56, 813–822 CrossRef CAS.
- Z. Zou, X. Wang, J. Huang, Z. Wu and F. Gao, J. Mater. Chem. A, 2019, 7, 2233–2241 RSC.
- F. Wang, Y. M. Liu and C. Y. Zhang, New J. Chem., 2019, 43, 4160–4167 RSC.
- Z. Li, J. Shang, C. Su, S. Zhang, M. Wu and Y. Guo, J. Fuel Chem. Technol., 2018, 46, 473–478 CrossRef CAS.
- M. Miao, R. Hou, Z. Liang, R. Qi, T. He, Y. Yan, K. Qi, H. Liu, G. Feng and B. Y. Xia, J. Mater. Chem. A, 2018, 6, 24107–24113 RSC.
- L. Zeng, K. Sun, X. Wang, Y. Liu, Y. Pan, Z. Liu, D. Cao, Y. Song, S. Liu and C. Liu, Nano Energy, 2018, 51, 26–36 CrossRef CAS.
- M. Jiang, Y. Li, Z. Lu, X. Sun and X. Duan, Inorg. Chem. Front., 2016, 3, 630–634 RSC.
- A. Sivanantham, P. Ganesan and S. Shanmugam, Adv. Funct. Mater., 2016, 26, 4661–4672 CrossRef CAS.
- S. Wang, J. Li, R. Zhang and L. Li, Mater. Lett., 2017, 198, 61–64 CrossRef CAS.
- X. H. Ji, Z. M. Wang, X. Y. Chen and R. B. Yu, Chem. J. Chin. Univ., 2021, 42, 1377–1394 Search PubMed.
- S. Huo, S. Yang, Q. Niu, F. Yang and L. Song, Int. J. Hydrogen Energy, 2020, 45, 4015–4025 CrossRef CAS.
- X. Jin, J. Li, Y. Cui, X. Liu, K. Wang, Y. Zhou, W. Yang, X. Zhang, C. Zhang, X. Jiang and B. Liu, Int. J. Hydrogen Energy, 2019, 44, 5739–5747 CrossRef CAS.
- B. Hinnemann, P. G. Moses, J. Bonde, K. P. Jørgensen, J. H. Nielsen, S. Horch, I. Chorkendorff and J. K. Nørsko, J. Am. Chem. Soc., 2005, 127, 5308–5309 CrossRef CAS PubMed.
- S. Yang, J. Y. Zhu, X. N. Chen, M. J. Huang, S. H. Cai, J. Y. Han and J. S. Li, Appl. Catal., B, 2022, 304, 120914 CrossRef CAS.
- H. Sun, Z. Yan, F. Liu, W. Xu, F. Cheng and J. Chen, Adv. Mater., 2020, 32, 1806326 CrossRef CAS PubMed.
- Z. B. Li, J. Wang, X. J. Liu, R. Li, H. Wang, Y. Wu, X. Z. Wang and Z. P. Lu, Scr. Mater., 2019, 173, 51–55 CrossRef CAS.
- J. Liu, D. Zhu, Y. Zheng, A. Vasileff and S.-Z. Qiao, ACS Catal., 2018, 8, 6707–6732 CrossRef CAS.
- M. Guo, Y. Qu, F. Zeng and C. Yuan, Electrochim. Acta, 2018, 292, 88–97 CrossRef CAS.
- J. K. Das, A. K. Samantara, S. Satyarthy, C. S. Rout and J. N. Behera, RSC Adv., 2020, 10, 4650–4656 RSC.
- R. Boppella, J. Tan, W. Yang and J. Moon, Adv. Funct. Mater., 2018, 29, 1807976 CrossRef.
- W. Li, D. Xiong, X. Gao, W.-G. Song, F. Xia and L. Liu, Catal. Today, 2017, 287, 122–129 CrossRef CAS.
- Y. Ji, J. Xie, Y. Yang, X. Fu, R. Sun and C. Wong, Chin. Chem. Lett., 2020, 31, 855–858 CrossRef CAS.
- C. Du, L. Yang, F. Yang, G. Cheng and W. Luo, ACS Catal., 2017, 7, 4131–4137 CrossRef CAS.
Footnotes |
| † Electronic supplementary information (ESI) available. See https://doi.org/10.1039/d2se01007k |
| ‡ Equal contribution. |
| This journal is © The Royal Society of Chemistry 2022 |

