
 Open Access Article
 This Open Access Article is licensed under a
 Creative Commons Attribution 3.0 Unported Licence
On the climate impacts of blue hydrogen production
Christian
Bauer
 a,
Karin
Treyer
a,
Cristina
Antonini
b,
Joule
Bergerson
c,
Matteo
Gazzani
d,
Emre
Gencer
e,
Jon
Gibbins
f,
Marco
Mazzotti
b,
Sean T.
McCoy
c,
Russell
McKenna
g,
Robert
Pietzcker
h,
Arvind P.
Ravikumar
i,
Matteo C.
Romano
j,
Falko
Ueckerdt
h,
Jaap
Vente
k and
Mijndert
van der Spek
*l
a,
Karin
Treyer
a,
Cristina
Antonini
b,
Joule
Bergerson
c,
Matteo
Gazzani
d,
Emre
Gencer
e,
Jon
Gibbins
f,
Marco
Mazzotti
b,
Sean T.
McCoy
c,
Russell
McKenna
g,
Robert
Pietzcker
h,
Arvind P.
Ravikumar
i,
Matteo C.
Romano
j,
Falko
Ueckerdt
h,
Jaap
Vente
k and
Mijndert
van der Spek
*l
aLaboratory for Energy Systems Analysis, Paul Scherrer Institute, Switzerland
bSeparation Process Laboratory, ETH Zurich, Switzerland
cDepartment of Chemical and Petroleum Engineering, University of Calgary, Canada
dCopernicus Institute of Sustainable Development, Utrecht University, The Netherlands
eMIT Energy Initiative, Massachusetts Institute of Technology, USA
fDepartment of Mechanical Engineering, University of Sheffield, UK
gSchool of Engineering, University of Aberdeen, UK
hPotsdam Institute for Climate Impact Research, Germany
iHildebrand Department of Petroleum and Geosystems Engineering, University of Texas, USA
jEnergy Department, Politecnico di Milano, Italy
kSustainable Process Technology, TNO, The Netherlands
lSchool of Engineering & Physical Sciences, Institute of Mechanical, Process & Energy Engineering, Heriot-Watt University, UK. E-mail: M.Van_der_Spek@hw.ac.uk
First published on 19th November 2021
Abstract
Natural gas based hydrogen production with carbon capture and storage is referred to as blue hydrogen. If substantial amounts of CO2 from natural gas reforming are captured and permanently stored, such hydrogen could be a low-carbon energy carrier. However, recent research raises questions about the effective climate impacts of blue hydrogen from a life cycle perspective. Our analysis sheds light on the relevant issues and provides a balanced perspective on the impacts on climate change associated with blue hydrogen. We show that such impacts may indeed vary over large ranges and depend on only a few key parameters: the methane emission rate of the natural gas supply chain, the CO2 removal rate at the hydrogen production plant, and the global warming metric applied. State-of-the-art reforming with high CO2 capture rates combined with natural gas supply featuring low methane emissions does indeed allow for substantial reduction of greenhouse gas emissions compared to both conventional natural gas reforming and direct combustion of natural gas. Under such conditions, blue hydrogen is compatible with low-carbon economies and exhibits climate change impacts at the upper end of the range of those caused by hydrogen production from renewable-based electricity. However, neither current blue nor green hydrogen production pathways render fully “net-zero” hydrogen without additional CO2 removal.
1. Introduction
Hydrogen is foreseen to be an important energy vector in (and after) the transition to net-zero Greenhouse Gas (GHG) emission economies.1–6 The prerequisite is that its production results in very low GHG emissions, such that the overall process of hydrogen production and use could be made net-zero with a feasible level of carbon dioxide removal from the atmosphere. There is common agreement among Life Cycle Assessment (LCA) studies that the climate change impact of hydrogen production can be low, when produced from certain biogenic resources (some wood, agricultural residues, etc.), as well as when produced using water electrolysis powered by low-carbon electricity (e.g. from wind power).7–17 However, there is less clarity on the climate change impact of hydrogen produced from natural gas (NG) and other fossil fuels, coupled with CO2 capture and storage (CCS) – often colloquially called blue hydrogen. Other colours associated with specific hydrogen production pathways are grey for natural gas reforming without CCS and green for water electrolysis using electricity from renewable sources such as hydro, wind, or solar photovoltaic (PV) power.Some of the authors of this contribution investigated life cycle impacts on climate change from a range of blue hydrogen production technologies for the European situation and published the results in 2020.8 The reductions in carbon dioxide equivalent (CO2-eq.) emissions per unit of hydrogen production were in the order of 50–80% when compared to standard NG-based hydrogen production without CCS, when calculated using 100 year global warming potentials (GWP). This result showed that at least some blue hydrogen configurations could contribute to a low-carbon future, if critical issues in the corresponding production chains could be addressed. In contrast, a recent analysis suggests only very minor climate benefits of blue hydrogen and concludes that “the use of blue hydrogen appears difficult to justify on climate grounds”.18 Such contradicting results demand an in-depth analysis and a transparent scientific discussion of the underlying assumptions and approaches to come to a common understanding.
Whether, and under which conditions, blue hydrogen could represent a low-carbon energy carrier is a key question at present, as society urgently needs to make decisions about low-carbon technologies.19 Beside requiring long-term and large investments, some of these technology choices imply systemic structural changes across the energy system, and long-lasting impacts on atmospheric concentrations of greenhouse gases and thus on climate change. Such decisions must therefore be taken based on solid scientific evidence, for which LCA – carried out in line with best practices20–22 – seems the most appropriate method. Such comprehensive evidence is currently scarce: our previous analysis8 did not explore the entire range of blue hydrogen production chains and thus did not reflect the range of potential climate change impacts. Similarly, Salkuyeh et al.23 performed an LCA of few very specific technology options for blue hydrogen production in Canada. The more recent analysis18 does not follow best practices in LCA as it, for example, takes into account neither GHG emissions associated with capital goods nor those originating from transportation and geological storage of CO2; and it relies on data for natural gas supply only in the US context. In addition, Mac Dowell et al. recently published a short commentary on the perspectives of hydrogen within low-carbon economies and its environmental performance.24
This article seeks to contribute to closing the described evidence gap by synthesizing the results from recent peer-reviewed LCA studies of blue hydrogen production and natural gas supply chains, using broad, and realistic, ranges of key parameters, and thus providing a fact-based perspective on the potential climate benefits of blue hydrogen. In addition, it seeks to explain what causes the large differences in climate change mitigation potential of different blue hydrogen production chains. Finally, it defines essential targets for technology development and regulations. In doing so, it aims to generate enhanced understanding of the complexities of blue hydrogen, thereby providing important insights and levers to policy- and decision-makers as well as to the scientific community.
2. Methodological and parameter choices
The climate change impacts of hydrogen production from natural gas with CCS – quantified by means of LCA – depend on several processes within the entire value chain, and on many assumptions and methodological choices. However, as will be demonstrated below, we find that the following three aspects are particularly important: the blue hydrogen production technology; the methane emissions from natural gas supply chains; and the choice of metrics for quantifying impacts.2.1 Blue hydrogen production technology with CO2 capture
Hydrogen production from natural gas is a well-established technology that has been used for decades in industry,25,26e.g. for oil refining and ammonia production. Currently, the most widely used technology for production of high purity hydrogen at the scale needed in chemical plants is Steam Methane Reforming (SMR). Large-scale ammonia and methanol production use a range of reformers to produce the ideal syngas composition for the final product synthesis, e.g. SMR, air-fed Autothermal Reformers (ATR) and Gas-Heated Reformers (GHR).27 Partial oxidation of natural gas is another commercially operating process that can be used for merchant hydrogen production. Common to all these proven processes is the production of a H2-rich synthesis gas (syngas for short), from which H2 and CO2 can be easily separated with high purity.For large-scale merchant production of hydrogen with CCS in the next decades, oxygen-based technologies with internal heating (e.g. ATR) are likely to become more commonplace due to good economies of scale, while the higher natural gas conversion may make the achievement of high CO2 capture efficiencies more energy efficient and less costly.28,29
The net efficiency of converting natural gas into hydrogen is high, about 76–77% of the energy content (Lower Heating Value, LHV) of the feedstock natural gas is contained in the hydrogen, both for SMR and for ATR processes.8 It is also notable that SMR, and to a somewhat lesser extent ATR, plants typically produce steam in excess of that needed in the reforming reaction, which can be used to generate electricity.8,26
CO2 capture and geological storage is an effective means of reducing the GHG footprint of hydrogen production from fossil feedstock. In a hydrogen plant with CCS, essentially 100% of the carbon in feedstock is fully oxidized to CO2, either through the water gas-shift reaction or combustion. It can then be readily removed by chemical solvents or physical separations. Depending on the reformer process configuration, the CO2 will be contained in a combination of syngas and combustion exhaust streams. The CO2 molecules can be removed from all the CO2-containing gas streams present in the hydrogen production plant (i.e. from syngas and/or combustion flue gas), and then transported to a permanent underground storage location. The energy required to run the capture system (e.g. steam for solvent regeneration and electricity for CO2 compression) can typically be recovered from the hydrogen production process. This means that, in contrast to CO2 capture for electric power, relatively little, if any, additional natural gas needs to be burned to supply energy for capture and the corresponding reduction in efficiency of hydrogen production is small.8,26 However, relative to a facility without CO2 capture, the opportunity for electricity generation is reduced, which slightly increases the life cycle GHG emissions of the hydrogen production.
In the context of reaching net-zero GHG emissions, it is imperative and technically feasible to remove the vast majority of the CO2 produced in the hydrogen plant. However, currently operating (first-of-a-kind) CO2 capture plants coupled to hydrogen production remove only 50–60% of the overall (hereafter “plant-wide”) CO2 emissions produced. This is mainly because they capture only CO2 from the syngas in SMR applications, but not the CO2 in the combustion products. Examples include the Shell Quest project,30 and the Port Arthur plant.31 These examples are not representative of the hydrogen CCS plant configurations planned in Europe and the US, however, where plant-wide CO2 removal rates higher than 90% are expected.32–35 The relevant CO2 capture technologies have been demonstrated in a number of commercial or demonstration scale plants over several years: commercial scale plants consistently achieve more than 92% removal of CO2 from coal combustion gas in the commercial-scale Petra Nova facility in Texas36 and more than 93% removal of CO2 from synthesis gas in the Coffeyville Resources ammonia plant in Kansas.37 More than 99% CO2 removal from hydrogen production syngas is commonplace in ammonia plants.38
2.2 Methane emissions from natural gas supply chains
Methane emissions from the oil and gas supply chain are an important contributor to global greenhouse gas emissions.39 With a global warming potential around 30 and 85 times higher than that of CO2 over 100 and 20 years, respectively, methane emissions can be an important contributor to GHG emissions associated with the natural gas supply chain.40 Recent research has demonstrated that methane emissions occur across the entire supply chain, including production, processing, pipeline transportation, and distribution.41–43 Furthermore, field measurements in North America have identified underestimation in official methane emissions inventories.44–46 The climate impacts of blue hydrogen can hinge on the sources and magnitude of these emissions, because they can make up a major fraction of the total GHG emissions when a high level of CO2 capture (and storage) is applied within the supply chain. The higher the CO2 capture rates, the higher the relative contributions of such methane emissions to the overall climate impact of blue hydrogen. Also, the life cycle impact of upstream methane emissions increases with application of shorter time horizons for measuring climate impacts.Incorporating methane emissions in an LCA model of blue hydrogen in a representative and context-specific manner is non-trivial. On the one hand, the characterization of methane emissions from natural gas supply chains in commonly used life cycle inventory databases is inconsistent and outdated, and likely to underestimate these emissions.47–49 On the other hand, reported methane emissions from natural gas supply chains based on field measurements exhibit large variability,44,50–52 making it difficult to select a representative “average” emission value for use in LCA calculations.
Several factors contribute to real and reported variability in methane emissions from the oil and gas sector. While some of these can be addressed through appropriate methodological choices in LCA, others require further research and data collection. The key challenges – in approximate descending order of importance – to incorporating representative methane emissions in the LCA of blue hydrogen are:
(1) Spatial and temporal variability.
(2) Lack of geographically representative field data.
(3) Lack of consistent reporting metrics.
(4) System boundaries.
Recent field studies have shown significant spatial and temporal variability in methane emissions across global oil and gas basins.42,53 These variations arise from differences in basin and resource characteristics, operational equipment, maintenance practices, and/or environmental conditions. For example, Burns and Grubert report production methane emission rates by US state varying between 0.9% and 3.6% based on a re-analysis of published literature.51 Furthermore, methane emission rates estimated in these studies differ substantially from official inventory estimates. In a comprehensive meta-analysis of field data in the US, Alvarez et al. report a national production-averaged methane emission rate of 2.3% across the US oil and gas supply chain, 60% higher than official U.S. Environmental Protection Agency (EPA) GHG inventory estimates.44 Similarly, a recent analysis of eight years of field observations in Western Canada by researchers at Environment and Climate Change Canada (ECCC) showed methane emissions to be 60% higher than that of official Canadian inventory estimates.45 Estimates of methane emissions across basins are continuously being updated as a result of improved measurement approaches – e.g. a recent analysis of aerial-based methane measurements in the Permian basin in the US exhibited leakage rates over 9%.54 Furthermore, differences in measurement platform (ground-based vs. aerial vs. satellite), time of measurement, and methodological approach renders direct comparison across studies challenging. Thus, although each of these individual studies might accurately report methane emissions in a specific time and place, the large observed variation makes simplistic country-level representation in LCA studies prone to errors.
Another major challenge for LCA studies is the lack of robust bottom-up field data on methane emissions outside North America. Over the past decade, several independent field campaigns across multiple oil and gas basins have been conducted in the US and Canada. These campaigns have significantly improved our understanding of oil and gas methane emissions, including recent breakthroughs in reconciling field measurements with inventory estimates.46 By comparison, there have been far fewer aircraft or ground-based field studies outside North America that can shed light on global oil and gas methane emissions. Much of the available non-U.S. or Canada field data are based on satellite observations that often have low spatial resolution resulting in large uncertainties associated with source attribution.55 An example for such satellite-based data is the methane tracker of the International Energy Agency,56 which provides country-specific methane emissions from natural gas supply chains. This data set highlights large country-level variations, with emissions ranging from near-zero for countries like Norway and Qatar to over 6% for countries like Libya and Iraq. However, the lack of direct measurements of methane emissions often means that country-level emission estimates are uncertain due to methodological issues.
Methane emissions from natural gas supply chains are usually reported as emission rates, e.g. in terms of “gram CH4 emitted per gram of natural gas delivered”.41 However, they can also be expressed as “mass methane emitted from natural gas production sites per mass methane withdrawn”.51 Comparing emission rates expressed in these two ways requires knowledge about natural gas compositions, which are often not explicitly provided. Similarly, if methane emission rates are based on the energy content of natural gas, it is not always clear whether net (lower) or gross (higher) calorific values are used, and the assumed value is also often unknown. Furthermore, natural gas is often produced as associated gas where it is extracted along with crude oil and other liquids, resulting in combined measurements of methane emissions associated with all products.
An LCA of blue hydrogen production requires specific emission factors for the natural gas used as feedstock. Therefore, methane emissions of combined production processes must be assigned or allocated to single products.50,51 Sometimes, methane emissions are entirely assigned to the natural gas supply chain, which results in an overestimation. But even if the emissions of combined production are subdivided, this allocation can be based either on energy content or mass of the co-products, or on the revenue generated by selling them, which can cause substantial differences in the NG-specific methane emission rates.57,58 Alternatively, a well-level purpose allocation can be applied,51 assigning emissions entirely to the product representing the primary purpose of the resource extraction infrastructure.
System boundaries are relevant, because the natural gas supply chain consists of various steps from exploration to final distribution and it is sometimes unclear which of these steps are included in reported estimates.49 In general, large-scale blue hydrogen production will be connected to the high-pressure natural gas transmission grid and therefore, methane emissions from final distribution to decentralized consumers (i.e. the low-pressure distribution network) should not be included in the quantification of climate impacts of blue hydrogen.
These challenges suggest that further research and data collection are required to develop a consistent and comprehensive inventory of our global natural gas system. In the meantime, an exploration of the variability in GHG emissions estimates is needed to understand the drivers of differences in GHG emissions from natural gas based hydrogen options.
2.3 Metrics for quantifying impacts on climate change
The evaluation of any methane-based mitigation option, in this case blue hydrogen, highly depends on the choice of GHG emission metric used to compare the impact of (fugitive) methane emissions to CO2 emissions and other greenhouse gases. The most prominent metric is the Global Warming Potential (GWP) that compares the future global warming caused by an idealized pulse of emissions of a specific greenhouse gas. Importantly, the GWP is a metric that aggregates impacts over time, hence its estimation requires the specification of a time horizon over which future warming is taken into account and compared (e.g. 100 years in GWP100). Given the short atmospheric lifetime of methane of roughly twelve years,59 the choice of time horizon has a strong impact on its GWP, and thus on the results of our analysis. This choice should be made in the context of the metric's application, and there is no general correct approach.A key aspect in this respect is the ambition and focus of climate targets envisaged when evaluating climate mitigation options. A focus on stabilizing the climate at below 2 °C warming in 2100 implies a longer time horizon such as that incorporated in the GWP100 index, which is commonly used in long-term scenario analysis and LCA. With the 2015 Paris Agreement60 as well as increasing awareness about near-term climate damages19 and potential tipping points,61 the scientific and political debate have shifted to limiting peak warming to close to 1.5 °C.62,63 As 1.5 °C will likely be reached before 2050, this shift emphasizes the importance of avoiding warming in the next decades, which supports using shorter global warming potential time horizons such as GWP20 in addition to GWP100 and thus balancing short-term with longer-term emissions.
3. Discussion of implications on GHG emissions
All three elements discussed above are crucial regarding the impacts of natural gas based (blue) hydrogen production on climate change: only a low methane emission rate of the natural gas supply chain combined with a high CO2 removal rate at the hydrogen production plant allows for substantial reductions of GHG emissions from a life cycle perspective. The methane emission rate becomes more important with a time horizon of 20 years instead of 100 years.In Fig. 1, we show life cycle GHG emissions of grey and blue hydrogen production considering the three major sources of variability. These include applying both GWP100 and GWP20, distinctly different plant configurations representing low (55%) and high (93%) plant-wide CO2 removal rates (see “methods” for a process specification) and variation of the methane emission rate of the natural gas supply chain between 0.2% and 8%. Hereby the selected CO2 capture rates and the resulting plant-wide CO2 removal rates do not represent absolute limits, but rather show an indicative range between low capture efficiency of the existing plants, focusing on the delivery of CO2 as product for Enhanced Oil Recovery (EOR), and a relatively high capture efficiency that will be achieved under proper regulatory constraints or carbon taxes. The range of methane emissions represents their very large geographical variability, which reflects differences in extraction techniques and procedures, transportation of the natural gas and the related methane emissions due to venting and leaks (see “methods” for details).
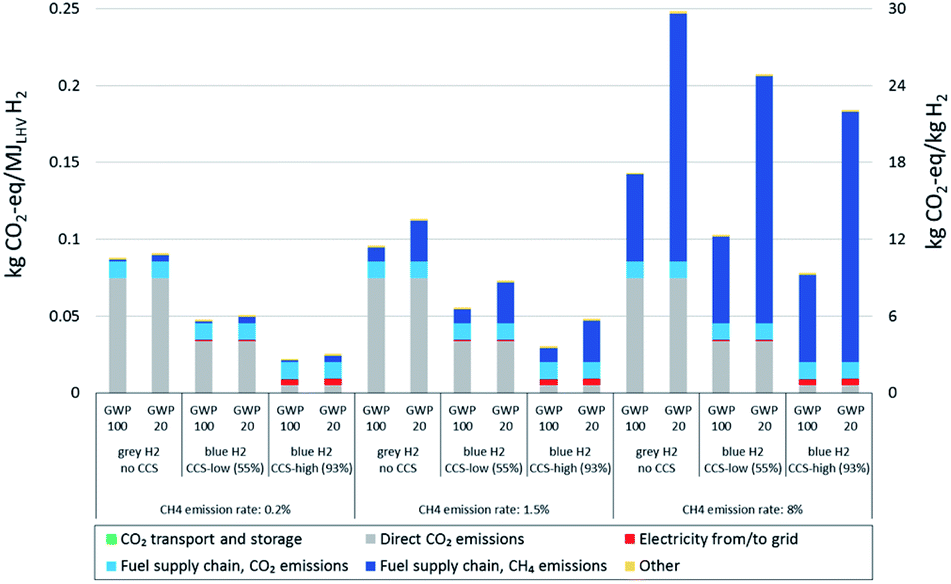 | ||
| Fig. 1 Impacts on climate change associated with the production of NG-based hydrogen with methane emission rates of 0.2%, 1.5%, and 8%, and two plant configurations with high and low CO2 removal rates, applying both GWP100 and GWP20. Stacked bars show the origin of GHG emissions along the value chain. “CCS-low” and “CCS-high” indicate low and high overall plant-wide CO2 removal rates of 55% and 93% at the hydrogen production plant, respectively (see discussion on hydrogen production technology and methods section). | ||
The possible climate impacts of blue hydrogen vary accordingly: while the climate impact of adding CCS with the highest assumed methane emission rate (8%) – even with high removal rates – is limited to a reduction of GHG emissions by about 45% (GWP100) or 26% (GWP20), using natural gas from a supply chain with only 0.2% methane emission rate leads to a reduction of GHG emissions by about 75% (GWP100) or 72% (GWP20) for a plant with a high CO2 removal rate. This shows that for natural gas supply chains with low methane emissions, the choice of global warming potential time horizon makes very little difference, whereas it gains importance for higher leakage rates. Long natural gas supply chains – be it for import to Europe by pipeline from Russia or as liquefied natural gas from the US and the Middle East – generally increase GHG emissions due to methane leakage as well as CO2 emissions associated with energy consumption along the chain. For natural gas supply chains with low methane emissions, CO2 emissions associated with electricity supply along the entire value chain become the main source of emissions in the high CO2 capture cases. If low-carbon electricity were supplied, high capture cases could achieve emission reductions of up to 90% compared to hydrogen production without capture.
In Fig. 2 we compare the impacts on climate change of grey and blue hydrogen with hydrogen from electrolysis, using renewable electricity or average grid electricity in Europe and the US – again for methane emission rates of natural gas supply chains up to 8% and for hydrogen plant configurations with low and high CO2 removal rates; applying global warming potentials with a time horizon of 100 years on top, below with a time horizon of 20 years. The figure reveals that, if methane emissions from natural gas supply are low and CO2 removal rates high, climate impacts of blue hydrogen are similar to those at the upper end of the range of climate impacts caused by green hydrogen. There is substantial variability regarding climate impacts of green hydrogen, because GHG emissions associated with renewable power generation can vary from close to zero (run-of-river hydropower) to about 60 g CO2-eq./kWh for solar photovoltaics (PV) at locations with rather low yields (e.g. in high northern latitudes),64 with wind power usually at the lower end of this range (resulting in around 1 kg CO2-eq./kg H2 (ref. 9)). Thus, using PV power in northern latitudes for electrolysis represents the upper end of the range of GHG emissions from green hydrogen shown in Fig. 2, and using run-of-river hydropower the lower end. In this context, supplying electrolysis entirely with renewable wind and solar power without connection to the power grid requires installation of electricity storage (e.g. batteries) to cope with short-term intermittency of renewable generation,65 which increases climate impacts of hydrogen from an LCA perspective. This increase has been quantified to be in the order of 10% for a given system configuration as investigated by Palmer et al.12 However, since this is site-specific and depends on the configuration of the electrolysis system, we do not consider such aspects here.
 | ||
| Fig. 2 Impacts on climate change associated with the production of NG-based hydrogen as a function of the methane emission rate of NG supply chains for configurations with high (“CCS-high”) and low (“CCS-low”) CO2 removal rates, applying both GWP100 (top) and GWP20 (lower). For comparison, the climate impacts of hydrogen produced via electrolysis using average grid electricity in Europe or the US (markers), or renewables (run-of-river hydropower, wind power or photovoltaics – green shaded area) are shown. Orange lines represent GHG emissions of NG combustion and the associated NG supply, which are also a function of NG supply chain methane emission rates. | ||
In order to be competitive with green hydrogen in terms of climate impacts over the long-term, blue hydrogen should exhibit a life cycle GHG footprint of not more than 2–3.5 kg CO2-eq./kg. This is only possible with high CO2 removal rates and methane emission rates below about 1% (GWP100) or 0.3% (GWP20).
Life cycle GHG emissions of hydrogen from electrolysis using current average grid electricity in Europe and the US are substantially higher than those of blue hydrogen up to very high methane emission rates from natural gas supply chains (in the order of 8% or above), even applying the 20 years time frame for global warming potentials. This indicates that electrolyzers that partially rely on electricity from grids with relevant shares of fossil fuels, e.g. to increase operational hours or buffer intermittency of renewables, will have a substantially higher GHG footprint of hydrogen production than off-grid systems.
Applying a 100 year time frame for global warming potentials, blue hydrogen is associated with lower GHG emissions than natural gas combustion within (and beyond) the range of methane emissions from natural gas supply shown here. With a 20 year time horizon, natural gas combustion generates lower GHG emissions than our blue hydrogen configuration with the low 55% CO2 removal rate at methane emission rates beyond 6–7%. Relative reductions of GHG emissions of blue vs. grey hydrogen production increase with increasing CO2 capture rates and decreasing methane emission rates.
In general, our findings are in line with those recently published by Mac Dowell et al. – despite somewhat different scope, modelled technologies and assumptions, one of their conclusions is that best-in-class natural gas supply chain management in combination with high CO2 capture rates is vital for blue hydrogen to be a viable option.24
4. Conclusions and recommendations
Our LCA of hydrogen production with CCS shows that the term “blue hydrogen” as such can only be taken as synonym for “low-carbon” hydrogen if two key requirements are met.First, natural gas supply must be associated with low GHG emissions, which means that natural gas leaks and methane emissions along the entire supply chain, including extraction, storage, and transport, must be minimized. This is already possible today in several countries, such as Norway, the UK and the Netherlands, where the natural gas sectors have emission rates typically below 0.5%.48,56 In the United States, emissions rates as low as 0.3–0.4% have been measured in one shale gas production region.66 In contrast, some regions in the US as well as several gas exporters like Russia, Algeria or Libya still have methane emission rates around or significantly higher than 2% and will require substantial investments into their existing infrastructure and operations to reach comparably low methane emission levels.44,54,56,67 There is very large uncertainty on these emissions, which needs to be urgently addressed by improved measurement, reporting, and disclosure.
Second, reforming technology with consistently high CO2 capture rates must be employed. Our assessment is that CO2 capture technology is already sufficiently mature to allow long-term removal rates at the hydrogen production plant of above 90%. Capture rates close to 100% are technically feasible, slightly decreasing energy efficiencies and increasing costs, but have yet to be demonstrated at scale. Hydrogen production and CO2 capture must be designed in an integrated way to minimize additional energy demand for CO2 capture, as well as compression of hydrogen and CO2. If this requires net electricity import, such demand should ideally be met using low-carbon electricity.
As long as the natural gas supply continues to have non-negligible methane emissions, the question whether using a global warming potential time horizon of 20 or 100 years is crucial for the evaluation of climate impacts of blue hydrogen. There is currently no conclusive answer to this question and we suggest testing the robustness of LCA results using different perspectives. However, to the extent that the focus of climate change mitigation shifts from long-term stabilization to carving the global temperature peak in the short to mid-term (e.g. around 2050), the importance of GWP20 and thus the relative impact of short-lived methane emissions increase.
Nevertheless, our main conclusion is that, if the above requirements are met, blue hydrogen can be close to green hydrogen in terms of impacts on climate change and can thus play an important and complementary role in the transformation towards net-zero economies, at least as a bridging technology during the coming decades. It is important to reiterate that no single hydrogen production technology (including electrolysis with renewables) is completely net-zero in terms of GHG emissions over its life cycle and will therefore need additional GHG removal from the atmosphere to comply with strict net-zero targets. Biomass-based hydrogen production represents an exception: adding CCS to wood gasification and reforming of biomethane can lead to net negative GHG emissions under certain circumstances.7,8 However, sustainable biomass availability is likely to be limited.68 In the context of net-zero economies with hydrogen playing an important role, the potential impact on climate change of hydrogen itself, emitted to the atmosphere, deserves attention and requires further research. Fugitive emissions of hydrogen infrastructures, similar to those of natural gas, seem likely.69 Additionally, recent research suggests that hydrogen exhibits a GWP100 of around 5.70 Thus, similar to the natural gas infrastructure, fugitive emissions from any future hydrogen system must be controlled and minimized.70
We conclude with some reflections on the main implications of this research. First and foremost, policies and regulations applying to any type of hydrogen, such as GHG emission standards or emissions pricing, should consider the life cycle emissions of electricity for electrolysis and the natural gas supply chain for blue hydrogen. Only in this way can the whole system implications of such measures be fully understood. This means emission monitoring, verification, and reporting is required for emissions across the life cycle. A combination of public disclosure, GHG emissions pricing, public funding tied to GHG performance, and regulation would incentivise industry to produce clean hydrogen and to differentiate between natural gas suppliers. As European gas extraction has strongly declined over the last decades, with no trend reversal in sight, and important producers such as The Netherlands announcing a phase-out of their production, importing gas from countries with good monitoring practices and low methane emission rates should be prioritized from a European perspective. From a US perspective, and for other countries with primarily domestic supplies, best practices regarding minimizing methane emissions from the entire natural gas sector must be ensured.
Second, with the transformation towards highly-renewable energy systems, the direct use of renewable electricity has advantages both in terms of life cycle emissions and costs. Hydrogen most likely has an important role to play in providing a long-term, low-carbon storage vector71 alongside decarbonising hard-to-abate sectors and applications, which can be prioritised according to climate impact, technical and economic viability.72 For example, hydrogen as a feedstock for chemical processes certainly needs to be decarbonized through green and blue routes, whereas residential heating should preferably be electrified. In addition, a similar prioritisation applies across the spectrum of hydrogen provenance and it should be noted that natural gas with CCS may be a more sustainable route than hydrogen to decarbonize such applications as power generation.
We have demonstrated the conditions under which blue hydrogen has a comparable climate impact to green hydrogen. If these conditions are not met, then green hydrogen should be preferred. Both of these merit orders, for supply and end-use cases, require targeted policies aiming at setting efficient incentives.
Third, the temporal development of the energy system transformation needs to be borne in mind. Given the short-to medium-term scarcity of green hydrogen, blue hydrogen can play a role as a bridging technology supporting the uptake of hydrogen infrastructure and hydrogen end-use transformation. Blue hydrogen projects can be developed under the recommendations presented here without crowding out the global ramp-up of green hydrogen supply. As both blue and green hydrogen have innovation potential, policies and regulations should support both options independently until they are fairly mature and can compete (e.g. based on carbon pricing accounting for full life cycle GHG emissions) – provided the above conditions for blue hydrogen are met and the necessary prioritization of demand areas is reflected.
Total costs of blue hydrogen are determined by the costs of achieving low methane leakage, high capture rates and permanent CO2 storage, as well as natural gas prices, residual emissions and (explicit or implicit) carbon pricing. The competitiveness with green hydrogen depends on the cost reductions of electrolysis and renewable electricity, as well as green hydrogen availability compared with overall hydrogen demands. The future of blue hydrogen in a climate-neutral world therefore depends strongly on the extent to which residual emissions can be avoided or compensated for via carbon dioxide removal as well as on the availability of geological CO2 storage sites.
5. Methods
We built our analysis upon the coupled process simulation and LCA model developed for our previous analysis8 and refer to this paper for a detailed description. Some key elements of the present analysis, including updates compared to our previous work, are provided in the following.Our reference product in the present work is “Hydrogen, gaseous, at 200 bar and with a purity of 99.9% or higher”. We selected two example, distinctly different hydrogen production plant configurations (here called “CCS-low” and “CCS-high'') from our previous analysis,8 they both include CO2 capture from the synthesis gas using methyl diethanolamine (MDEA) as absorbent. “CCS-low” represents configurations with low (i.e. ∼55%) removal of plant-wide CO2 emissions and corresponds to “SMR with CCS, HT, MDEA 90”. “CCS-high” represents a configuration with high removal of plant-wide CO2 emissions and corresponds to “ATR with CCS, HTLT, MDEA 98”. The acronyms HT and LT indicate the use of high temperature water gas-shift only or the use of a low temperature and high temperature water gas-shift, the latter leading to a higher hydrogen and CO2 content in the syngas. The numbers 90 and 98 represent the CO2 capture rates of the capture unit that captures CO2 from the produced synthesis gas. Plant-wide, overall CO2 capture rates amount to 55% and 93% for the SMR and ATR configuration, respectively.8 The lower overall capture rate of the SMR is a consequence of the fact that of the two sources of CO2 present in an SMR, applying capture from syngas only excludes capturing the CO2 from the natural gas (and reformer tail gas) combustion in the reformer furnace. A post-combustion unit would be needed to capture all the CO2 in the flue gas. The ATR configuration does not include a reformer furnace as it is driven by heat produced in the reformer itself. It therefore allows recovering the majority of the direct CO2 emissions from the syngas. The ATR does usually have a small fired heater that emits some CO2, which is why with 98% capture from the syngas, 93% of the total plant-wide emissions are removed.8
Our LCA is based on detailed process modelling, which quantifies the overall energy demand of the hydrogen production plants designed to produce 9 metric tons of hydrogen per hour with and without CO2 capture depending on the plant configuration and CO2 capture rates. Antonini et al.8 showed in Fig. 2 that some configurations generate excess electricity, which – in line with common LCA procedures20–22 – is assumed to substitute average grid electricity via an emission credit. Hydrogen production plant configurations that exhibit a negative electricity balance (including the compression of hydrogen to 200 bar) are supplied with average grid electricity. Our default location for hydrogen production is Europe – hence, average European electricity is used or substituted, corresponding to the “ENTSO-E” region in the ecoinvent database.73 As the grid CO2 intensity e.g. in the US is higher than in Europe, electricity substitution and consumption would lead to higher CO2 benefits and burdens, respectively.
The impacts on climate change of hydrogen from electrolysis are based on the analysis by Zhang et al.17 Electricity demand for the PEM electrolyzer has been updated12 and amounts to 55 kWh per kg of hydrogen (including compression from 25 bar at the electrolyzer to 200 bar). We used background LCI data from the ecoinvent database, v3.7.1, system model “allocation, cut-off by classification”73 instead of v3.5 in the previous analysis. GHG-intensities of average grid electricity in Europe and the US (used for electrolysis shown in Fig. 2), which represent technology market shares as well as imports and exports in 2018 and 2019, respectively, originate from version v3.8 of the ecoinvent database, released end of September 2021.
The methane emission rate from the natural gas supply chain is defined as “(kg) methane emitted per (kg) natural gas delivered at high-pressure pipeline” in our analysis, i.e. the associated system boundaries include natural gas extraction from the ground (often referred to as “production”), gathering and processing, and high-pressure transmission. Hydrogen production plants are supplied by high-pressure natural gas pipelines, and therefore, methane emissions from the local natural gas distribution grid are not considered.
Our quantification of life cycle GHG emissions of grey and blue hydrogen as well as natural gas combustion as a function of the methane emission rate of natural gas supply chains in Fig. 1 and 2 builds upon new Life Cycle Inventory (LCI) data of natural gas extraction in countries supplying the European market48 and associated supply chains.47 These have been verified by the German “Institut für Energie- und Umweltforschung”.74 This average European natural gas supply exhibits a methane emission rate of about 1.3%. We modified this rate, choosing a lower bound of 0.2%, a representative mid-range value of 1.5%, and an upper bound of 8% to cover a realistic range of these emissions. We keep all other factors, such as energy demand for (re-)compression of natural gas, transport infrastructure demand and CO2 emissions from flaring of natural gas constant, although we note that reductions in those emissions can likely be achieved as well. All these factors together cause impacts on climate change of 9 g CO2-eq. (GWP100) and 10 g CO2-eq. (GWP20), respectively, per MJ of natural gas supplied; these emissions are independent of the methane emission rate. A methane emission rate of 0.2% corresponds to the goal of the Oil and Gas Climate Initiative75 and emission rates below or around this target have been reported for natural gas supply from countries such as Norway, The Netherlands and the UK.47,48 In contrast, a methane emission rate of around 8% has been reported for Libya47,48 and some gas fields in the US,54 which indicates high methane emissions at the gas extraction wells and/or a dysfunctional natural gas infrastructure in general. We use 0.056 kg CO2 per MJ natural gas burned as emission factor for natural gas combustion.73
For geological storage of CO2, it is assumed to be injected into a saline aquifer at a depth of 1000 m, which is connected to the hydrogen production plant with a 200 km pipeline. Variation of CO2 storage depth and transport distance has shown minor impacts on LCA results for impacts on climate change.76
Author contributions
Conceptualization: CB, MvdS; formal analysis: KT; funding acquisition: CB, EG; investigation: CB, KT, MvdS; methodology: KT; software: KT; supervision: CB, MvdS; visualization: CB, KT; writing – original draft: CB, FU, MvdS, RM, RP, STM; writing – review and editing: all.Conflicts of interest
There are no conflicts to declare.Acknowledgements
Financial support was provided by the Kopernikus Project Ariadne (FKZ 03SFK5A) funded by the German Federal Ministry of Education and Research, the MIT Energy Initiative CCUS Low Carbon Energy Center and PSI's ESI platform. STM is supported, in part, with funding from the Canada First Research Excellence Fund.References
- International Energy Agency, Global Hydrogen Review, 2021 Search PubMed.
- International Energy Agency, Net Zero by 2050: A Roadmap for the Global Energy Sector, 2021 Search PubMed.
- HM Government, UK Hydrogen Strategy, 2021 Search PubMed.
- Bundesministerium für Wirtschaft und Energie, Die Nationale Wasserstoffstrategie, 2020 Search PubMed.
- European Commission, A hydrogen strategy for a climate-neutral Europe, 2020 Search PubMed.
- US DOE, Hydrogen Strategy - Enabling a low-carbon economy, 2020 Search PubMed.
- C. Antonini, K. Treyer, E. Mojoli, C. Bauer, T. Schildhauer and M. Mazzotti, Sustainable Energy Fuels, 2021, 5, 2602–2621 RSC.
- C. Antonini, K. Treyer, A. Streb, M. van der Spek, C. Bauer and M. Mazzotti, Sustainable Energy Fuels, 2020, 4, 2967–2986 RSC.
- A. Valente, D. Iribarren and J. Dufour, J. Clean. Prod., 2017, 149, 762–772 CrossRef CAS.
- R. Bhandari, C. A. Trudewind and P. Zapp, J. Clean. Prod., 2014, 85, 151–163 CrossRef CAS.
- A. P. Borole and A. L. Greig, Biohydrogen, 2019, 485–512 CAS.
- G. Palmer, A. Roberts, A. Hoadley, R. Dargaville and D. Honnery, Energy Environ. Sci., 2021, 14, 5113–5131 RSC.
- Y. K. Salkuyeh, B. A. Saville and H. L. MacLean, Int. J. Hydrogen Energy, 2018, 43, 9514–9528 CrossRef CAS.
- A. Susmozas, D. Iribarren, P. Zapp, J. Linβen and J. Dufour, Int. J. Hydrogen Energy, 2016, 41, 19484–19491 CrossRef CAS.
- A. Valente, D. Iribarren and J. Dufour, Sci. Total Environ., 2020, 728, 138212 CrossRef CAS PubMed.
- X. Zhang, J. Witte, T. Schildhauer and C. Bauer, Sustainable Energy Fuels, 2020, 4, 1427–1436 RSC.
- X. Zhang, C. Bauer, C. Mutel and K. Volkart, Appl. Energy, 2017, 190, 326–338 CrossRef CAS.
- R. W. Howarth and M. Z. Jacobson, Energy Sci. Eng., 2021, 1–12 Search PubMed.
- V. Masson-Delmotte, P. Zhai, H.-O. Pörtner, D. Roberts, J. Skea, P. R. Shukla, A. Pirani, W. Moufouma-Okia, C. Péan, R. Pidcock, S. Connors, J. B. R. Matthews, Y. Chen, X. Zhou, M. I. Gomis, E. Lonnoy, T. Maycock, M. Tignor and T. Waterfield, Global Warming of 1.5 °C. An IPCC Special Report on the impacts of global warming of 1.5 °C above pre-industrial levels and related global greenhouse gas emission pathways, in The Context of Strengthening the Global Response to the Threat of Climate Change, Intergovernmental Panel on Climate Change (IPCC), 2018 Search PubMed.
- European Commission, International Reference Life Cycle Data System (ILCD) Handbook – General Guide for Life Cycle Assessment – Detailed Guidance, European Commission, Joint Research Centre, Institute for Environment and Sustainability, Luxembourg, 2010 Search PubMed.
- ISO 14040, Environmental Management – Life Cycle Assessment – Prinicples and Framework, International Organisation for Standardisation (ISO), 2006 Search PubMed.
- ISO 14044, Environmental Management – Life Cycle Assessment – Requirements and Guidelines, International Organisation for Standardisation (ISO), 2006 Search PubMed.
- Y. Khojasteh Salkuyeh, B. A. Saville and H. L. MacLean, Int. J. Hydrogen Energy, 2017, 42, 18894–18909 CrossRef CAS.
- N. Mac Dowell, N. Sunny, N. Brandon, H. Herzog, A. Y. Ku, W. Maas, A. Ramirez, D. M. Reiner, G. N. Sant and N. Shah, Joule, 2021, 5, 2524–2529 CrossRef CAS.
- K. Liu, C. Song and V. Subramani, Hydrogen and Syngas Production and Purification Technologies, John Wiley & Sons, 2010 Search PubMed.
- IEAGHG, Techno-economic Evaluation of SMR Based Standalone (Merchant) Hydrogen Plant with CCS, 2017/02, Cheltenham, 2017 Search PubMed.
- K. Aasberg-Petersen, I. Dybkjær, C. V. Ovesen, N. C. Schjødt, J. Sehested and S. G. Thomsen, J. Nat. Gas Sci. Eng., 2011, 3, 423–459 CrossRef CAS.
- Zero Emission Platform (ZEP), Commercial Scale Feasibility of Clean Hydrogen, 2017 Search PubMed.
- P. Moser, G. Wiechers, S. Schmidt, J. G. M. S. Monteiro, E. Goetheer, C. Charalambous, A. Saleh, M. van der Spek and S. Garcia, Int. J. Greenhouse Gas Control, 2021, 109, 103381 CrossRef CAS.
- Shell Canada Energy, Quest Carbon Capture and Storage Project. Annual Summary Report-Alberta Department of Energy: 2019, 2020 Search PubMed.
- IEAGHG, The Carbon Capture Project at Air Product's Port Arthur Hydrogen Production Facility – 2018/05, 2018 Search PubMed.
- Air Products, Air Products Announces Multi-Billion Dollar Net-Zero Hydrogen Energy Complex in Edmonton, Alberta, Canada, https://www.airproducts.com/news-center/2021/06/0609-air-products-net-zero-hydrogen-energy-complex-in-edmonton-alberta-canada#/.
- Progressive Energy, BEIS Hydrogen Supply Programme – HyNet Low Carbon Hydrogen Plant Phase 1 Report for BEIS, 2019 Search PubMed.
- H-vision, Blue Hydrogen as Accelerator and Pioneer for Energy Transition in the Industry, Rotterdam, 2019 Search PubMed.
- Suncor, Suncor and ATCO partner on a potential world-scale clean hydrogen project in Alberta, https://www.suncor.com/en-ca/newsroom/news-releases/2226977.
- USDOE and NETL, W.A. Parish Post-Combustion CO2 Capture and Sequestration Demonstration Project, 2020 Search PubMed.
- J. Mak, D. Heaven, D. Kubek, C. Sharp and M. Clark, Synthesis Gas Purification in Gasification to Ammonia/Urea Complex, 2004 Search PubMed.
- T. Katz, J. Nichols, V. Pattabathula and G. Colman, Challenges in commissioning and operation of OASE® solvent systems, 2018, vol. 59 Search PubMed.
- M. Saunois, A. R. Stavert, B. Poulter, P. Bousquet, J. G. Canadell, R. B. Jackson, P. A. Raymond, E. J. Dlugokencky and S. Houweling, Earth Syst. Sci. Data, 2020, 12, 1561–1623 CrossRef.
- IPCC, Summary for Policymakers. In: Climate Change 2021: The Physical Science Basis. Contribution of Working Group I to the Sixth Assessment Report of the Intergovernmental Panel on Climate Change, 2021 Search PubMed.
- J. A. Littlefield, J. Marriott, G. A. Schivley and T. J. Skone, J. Clean. Prod., 2017, 148, 118–126 CrossRef CAS.
- M. Omara, N. Zimmerman, M. R. Sullivan, X. Li, A. Ellis, R. Cesa, R. Subramanian, A. A. Presto and A. L. Robinson, Environ. Sci. Technol., 2018, 52, 12915–12925 CrossRef CAS PubMed.
- D. Zimmerle, T. Vaughn, B. Luck, T. Lauderdale, K. Keen, M. Harrison, A. Marchese, L. Williams and D. Allen, Environ. Sci. Technol., 2020, 54, 7552–7561 CrossRef CAS PubMed.
- R. A. Alvarez, D. Zavala-Araiza, D. R. Lyon, D. T. Allen, Z. R. Barkley, A. R. Brandt, K. J. Davis, S. C. Herndon, D. J. Jacob, A. Karion, E. A. Kort, B. K. Lamb, T. Lauvaux, J. D. Maasakkers, A. J. Marchese, M. Omara, S. W. Pacala, J. Peischl, A. L. Robinson, P. B. Shepson, C. Sweeney, A. Townsend-Small, S. C. Wofsy and S. P. Hamburg, Science, 2018, 361, 186–188 CAS.
- E. Chan, D. E. J. Worthy, D. Chan, M. Ishizawa, M. D. Moran, A. Delcloo and F. Vogel, Environ. Sci. Technol., 2020, 54, 14899–14909 CrossRef CAS PubMed.
- J. S. Rutherford, E. D. Sherwin, A. P. Ravikumar, G. A. Heath, J. Englander, D. Cooley, D. Lyon, M. Omara, Q. Langfitt and A. R. Brandt, Nat. Commun., 2021, 12, 1–12 CrossRef PubMed.
- M. Bussa, N. Jungbluth and C. Meili, Life cycle inventories for long-distance transport and distribution of natural gas, Schaffhausen, Switzerland, 2021 Search PubMed.
- C. Meili, N. Jungbluth and M. Bussa, Life cycle inventories of crude oil and natural gas extraction, Schaffhausen, Switzerland, 2021 Search PubMed.
- E. A. Grubert and A. R. Brandt, J. Clean. Prod., 2019, 222, 760–767 CrossRef CAS.
- P. Balcombe, K. Anderson, J. Speirs, N. Brandon and A. Hawkes, ACS Sustainable Chem. Eng., 2017, 5, 3–20 CrossRef CAS.
- D. Burns and E. Grubert, Environ. Res. Lett., 2021, 16, 044059 CrossRef CAS.
- A. R. Ingraffea, P. A. Wawrzynek, R. Santoro and M. Wells, Environ. Sci. Technol., 2020, 54(9), 5783–5789 CrossRef CAS PubMed.
- S. Schwietzke, G. Pétron, S. Conley, C. Pickering, I. Mielke-Maday, E. J. Dlugokencky, P. P. Tans, T. Vaughn, C. Bell, D. Zimmerle, S. Wolter, C. W. King, A. B. White, T. Coleman, L. Bianco and R. C. Schnell, Environ. Sci. Technol., 2017, 51, 7286–7294 CrossRef CAS PubMed.
- Y. Chen, E. D. Sherwin, E. S. F. Berman, B. B. Jones, M. P. Gordon, E. B. Wetherley, E. A. Kort and A. R. Brandt, Submitt. to Nat. Energy.
- A. J. Turner, D. J. Jacob, J. Benmergui, J. Brandman, L. White and C. A. Randles, Atmos. Chem. Phys., 2018, 18, 8265–8278 CrossRef CAS.
- International Energy Agency (IEA), Methane Tracker 2021, https://www.iea.org/articles/methane-tracker-database.
- D. Zavala-Araiza, D. T. Allen, M. Harrison, F. C. George and G. R. Jersey, ACS Sustainable Chem. Eng., 2015, 3, 492–498 CrossRef CAS.
- D. T. Allen, Q. Chen and J. B. Dunn, Environ. Sci. Technol. Lett., 2021, 8, 345–349 CrossRef CAS.
- T. F. Stocker, D. Qin, G.-K. Plattner, M. Tignor, S. K. Allen, J. Boschung, A. Nauels, Y. Xia, V. Bex and P. M. Midgley, Climate Change 2013: The Physical Science Basis. Contribution of Working Group I to the Fifth Assessment Report of the Intergovernmental Panel on Climate Change, 2013 Search PubMed.
- United Nations, Paris Agreement, 2015 Search PubMed.
- T. M. Lenton, J. Rockström, O. Gaffney, S. Rahmstorf, K. Richardson, W. Steffen and H. J. Schellnhuber, Nature, 2019, 575, 592–595 CrossRef CAS PubMed.
- J. Rogelj, D. Huppmann, V. Krey, K. Riahi, L. Clarke, M. Gidden, Z. Nicholls and M. Meinshausen, Nature, 2019, 573, 357–363 CrossRef CAS PubMed.
- J. Rogelj, P. M. Forster, E. Kriegler, C. J. Smith and R. Séférian, Nature, 2019, 571, 335–342 CrossRef CAS PubMed.
- R. Frischknecht, P. Stolz, L. Krebs, M. de Wild-Scholten, P. Sinha, V. Fthenakis, H. C. Kim, M. Raugei and M. Stucki, Life Cycle Inventories and Life Cycle Assessment of Photovoltaic Systems, International Energy Agency (IEA) PVPS Task 12, Report T12-19:2020, 2020 Search PubMed.
- D. S. Mallapragada, E. Gençer, P. Insinger, D. W. Keith and F. M. O'Sullivan, Cell Rep. Phys. Sci., 2020, 1, 100174 CrossRef.
- Z. R. Barkley, T. Lauvaux, K. J. Davis, A. Deng, N. L. Miles, S. J. Richardson, Y. Cao, C. Sweeney, A. Karion, M. Smith, E. A. Kort, S. Schwietzke, T. Murphy, G. Cervone, D. Martins and J. D. Maasakkers, Atmos. Chem. Phys., 2017, 17, 13941–13966 CrossRef CAS.
- International Energy Agency (IEA), Driving Down Methane Leaks from the Oil and Gas Industry, Paris, France, 2021 Search PubMed.
- L. Rosa, D. L. Sanchez and M. Mazzotti, Energy Environ. Sci., 2021, 14, 3086–3097 RSC.
- A. Hormaza Mejia, J. Brouwer and M. Mac Kinnon, Int. J. Hydrogen Energy, 2020, 45, 8810–8826 CrossRef CAS.
- R. G. Derwent, D. S. Stevenson, S. R. Utembe, M. E. Jenkin, A. H. Khan and D. E. Shallcross, Int. J. Hydrogen Energy, 2020, 45, 9211–9221 CrossRef CAS.
- J. A. Dowling, K. Z. Rinaldi, T. H. Ruggles, S. J. Davis, M. Yuan, F. Tong, N. S. Lewis and K. Caldeira, Joule, 2020, 4, 1907–1928 CrossRef.
- F. Ueckerdt, C. Bauer, A. Dirnaichner, J. Everall, R. Sacchi and G. Luderer, Nat. Clim. Change, 2021, 11, 384–393 CrossRef CAS.
- G. Wernet, C. Bauer, B. Steubing, J. Reinhard, E. Moreno-Ruiz and B. Weidema, Int. J. Life Cycle Assess., 2016, 21, 1218–1230 CrossRef.
- A. Liebich, D. Münter, S. Ludmann and T. Fröhlich, Review Statement. Validation of LCI data and reports of the project ‘Update of life cycle inventory data for natural gas and crude oil supply to Switzerland and Europe with the reference year 2019’, Heidelberg, Germany, 2021 Search PubMed.
- Oil and gas climate initiative, OGCI reports significant progress on aggregate upstream methane and carbon intensity targets, https://www.ogci.com/ogci-reports-significant-progress-on-aggregate-upstream-methane-and-carbon-intensity-targets/.
- T. Terlouw, K. Treyer, C. Bauer and M. Mazzotti, Environ. Sci. Technol., 2021, 55, 11397–11411 CrossRef CAS PubMed.
| This journal is © The Royal Society of Chemistry 2022 |