
 Open Access Article
 This Open Access Article is licensed under a Creative Commons Attribution-Non Commercial 3.0 Unported Licence
Upconversion fluorescence of MXene nanosheets and the sensitive detection of L-tryptophan†
Feng
Wang
ac,
Hongye
Wang
a,
Xiaoqiang
Cui
 *b and
Yang
Liu
*a
*b and
Yang
Liu
*a
aDepartment of Chemistry, Key Laboratory of Bioorganic Phosphorus Chemistry & Chemical Biology, Tsinghua University, Beijing 100084, P. R. China. E-mail: liu-yang@mail.tsinghua.edu.cn
bSchool of Materials Science and Engineering, State Key Laboratory of Automotive Simulation and Control and Key Laboratory of Automobile Materials of MOE, Jilin University, 2699 Qianjin Street, Changchun 130012, Jilin, China
cShenzhen Key Laboratory of Energy Materials for Carbon Neutrality, Shenzhen Institutes of Advanced Technology, Chinese Academy of Sciences, Shenzhen, 518055, China
First published on 31st August 2022
Abstract
Innovating the fluorescence characteristic of MXene nanosheets and quantum dots could result in fascinating perspectives in the applications of sensing, imaging and photocatalysis. However, the currently reported MXene-based materials have only shown down-conversion fluorescence emission, while the exploration and research of up-conversion fluorescent performance are scarce. Herein, the upconversion emission behaviors of Ti3C2 MXene nanosheets are reported and investigated for the first time. It was observed that the Ti3C2 nanosheets present upconversion emission in a wide wavelength range with adjustable color, covering almost the entire visible spectrum. The unique features of larger anti-stokes displacement (over 200 nm), narrower full width at half maximum (∼17 nm) and longer lifetime (1.18 μs) were also exhibited, which are superior to those of the down-conversion fluorescence. The self-quenched fluorescence of the Ti3C2 nanosheets on the side of the highest fluorescence emission was also displayed. Based on the quenching effect of L-tryptophan on the Ti3C2 fluorescence by a fast charge transfer mechanism, a fast, simple and label-free fluorescence sensor for L-tryptophan detection was realized with a detection limit as low as 91 nM, which provides a valuable tool to widen their applications in food safety and diagnostics.
Introduction
Transition metal carbides/nitrides (MXenes), as novel inorganic 2D materials, have recently become a hot research area.1–4 Researchers have demonstrated that MXenes possess super performances, such as high metallic conductivity of 2400 S cm−1 and excellent hydrophilicity induced by terminated hydrophilic groups of –OH or –F on the surface.5–7 These special features, which distinguished them from those of traditional 2D materials, synergistically endow MXenes with intercalation or surface redox capacitances, greatly promoting their application potential in batteries,8 supercapacitors,9 and pollutant disposal.10 Furthermore, reducing their size to nanosheets or nanodots can endow them with extremely useful optical properties and functions because of the quantum confinement effect, which makes MXenes promising candidates for imaging,11,12 sensors,13,14 and photoelectric conversion.15 For instance, based on down-conversion fluorescence, it can be used as an intracellular pH sensor16 or for the highly sensitive analysis of hypochlorite,17 as well as the label-free detection and imaging of metal ions.18 The heterostructure composed of MXene quantum dots and Cu2O nanowires was developed for boosting the photocatalytic reduction of CO2 into methanol.19 Although the study of the optical application from MXenes has made significant progress, some drawbacks have been accompanied by the fact that the excitation and emission wavelengths of down-conversion fluorescence are always shorter, usually less than 500 nm. For photocatalysis, the energy in the visible and infrared regions may be squandered, resulting in low catalytic activity. For bio-analysis, it is hard to avoid fluorescence interference caused by cellular autofluorescence at nearby wavelengths, which is also harmful to animal and human cells to some extent.Upconversion luminescent materials are of great interest to analytical chemists, optical device engineers, and biologists and have achieved considerable development.20–23 Common upconversion luminescent materials consist of two-dimensional materials such as graphene,24 some quantum dots25 and rare earth materials.26–28 They have been used as fluorescent probes for the detection and imaging of tumors29 and quantification of microRNA in living cells.30 These studies suggest that upconversion materials tend to have longer excitation wavelength and emission wavelength, enabling more sensitive biological analysis and imaging with a higher signal-to-noise ratio, which could avoid fluorescence interference from cellular autofluorescence and enable less damage to cells. However, the relevant information from MXenes-based upconversion fluorescence is rarely reported. Combined with the above excellent features from MXenes with high biocompatibility, exploiting and revealing their upconversion fluorescence behaviors for reducing background fluorescence interference and developing a new signal conversion mechanism will, to some extent, provide promising potential in boosting biosensors and imaging.
In this study, we successfully synthesized MXene (Ti3C2) nanosheets with a few layers. The upconversion luminescence of the Ti3C2 nanosheets was observed for the first time, which presented unique features of wide spectral coverage from 450 nm to 600 nm with a narrow full width at half maximum (FWHM) of 17 nm, and a long fluorescence lifetime of about 1.18 μs. An emission mechanism of the upconversion luminescence of the Ti3C2 nanosheet was demonstrated. Given the excellent properties of the Ti3C2 nanosheets, a fluorescence sensor was developed for the analysis of L-tryptophan, which is an essential amino acid for the human body and its deficiency can cause skin disorders, cataracts, vitreous degeneration and myocardial fibrosis.31,32 Selective fluorescence quenching of the Ti3C2 nanosheets was observed in the presence of L-tryptophan. The fluorescence sensor showed high sensitivity and excellent selectivity with a limit of detection (LOD) as low as 91 nM. The excellent features of the upconversion luminescence of MXene showed great prospects in food analysis, disease diagnostics and therapies.
Materials and methods
Materials
Lithium fluoride (LiF), 50% hydrofluoric acid solution (HF), tetramethylammonium hydroxide (TMAOH), glutathione, L-histidine, alanine, L-cysteine, L-tryptophan, vitamin H, L-serine, urea, citric acid, L-lactic acid, and hydroxylamine were purchased from Aladdin Industrial Inc. Maltose, L-arginine, biphenyl, melamine, L-tyrosine, glycine and L-lysine were acquired form Macklin Inc. The Ti3AlC2 powders were purchased from Jilin Technology Co. Ltd. The 12 mol L−1 hydrochloric acid solution was obtained from Beijing Chemical Plant. All chemicals (A.R. grade) were used without further treatment.Preparation of Ti3C2 nanosheets by HCl/LiF
In the preparation of Ti3C2 nanosheets, as previously reported,6 15 mL of hydrochloric acid and 2 g of LiF were mixed in a Teflon reactor and stirred for 15 minutes until completely dissolved. Then, 2 g Ti3AlC2 powder was slowly added to the mixture for about 20 min. The mixed liquid was stirred at a constant temperature of 40 °C for 24 hours in a closed reactor. The reaction solution was added to distilled water, and washed several times with centrifugation. The rotation speed was increased from 3500 rpm until the supernatant achieved pH >6, and then the whole supernatant was decanted. After adding distilled water and ultrasound for one hour, the mixture was centrifuged for one hour at 3500 rpm, and the supernatant was collected and freeze-dried to obtain powdery Ti3C2 nanosheets.Preparation of S–Ti3C2
The S–Ti3C2 nanosheets were prepared based on previous reports.33,34 Here, 1 g of Ti3AlC2 was added slowly to 15 mL of 50% hydrofluoric acid solution within 20 minutes. The mixture solution was transferred to a Teflon reactor and stirred at a constant temperature of 35 °C for 24 hours. After the solution was cleaned by centrifugation several times until pH >6, the precipitate was placed in a vacuum drying oven and dried for 18 hours to obtain accordion-like Ti3C2. Afterwards, the obtained accordion-like Ti3C2 was added to the TMAOH solution. After stirring for 24 hours at room temperature, the mixed solution was centrifuged several times, and the supernatant was decanted until the final pH was <8. The resulting solution was shaken well and, finally, S–Ti3C2 was obtained after freeze-drying. It is worth noting that during each centrifugation process, after adding the distilled water solution for precipitation, just gently shaking the solution was required.Apparatus and characterizations
The morphology was determined using a scanning electron microscope (SEM) (Hitachi SU8010) operated at 5 kV, and a transmission electron microscope (TEM) (JEM-2000F) from JEOL Co., Japan. The thickness of the nanosheets was measured via atomic force microscopy (AFM) (Dimension Icon, Bruker, Germany) under the tapping mode in air. X-ray diffraction (XRD) was conducted at a scanning rate of 5° min−1 using a Bruker D8 diffractometer with 1.5418 Å Cu Kα radiation. The Raman spectra were acquired by a Smart Raman Spectrometer (LABRAM ARAMIS) with the laser sources under 633 nm excitation at ambient temperature. The FT-IR spectra were obtained by CDS-2000 Bio-Rad FTS-165 FT-IR apparatus. The elemental analysis of the samples was conducted via X-ray photoelectron spectroscopy (XPS) using an Escalab-250 instrument (Thermo Fisher Scientific, USA) with a hemisphere detector and a monochromatic Al Kα radiation source (1486.6 eV). The photoluminescence (PL) spectra were obtained using an LS55 spectrometer (PerkinElmer Inc., USA). Photoluminescence decay was measured using an Edinburgh FLS920 instrument. The test principle was Time-Correlated Single Photon Counting (TCSPC). The repetition frequency was 40 kHz, and the spectral resolution was 0.05 nm.Calculation of fluorescence lifetimes
The fluorescence decay curves in this article were fitted by a double-exponential function:35| y = A1e−(t/τ1) + A2et/τ2 |
The average lifetimes were calculated using the average lifetime model:
Construction of an L-tryptophan sensing platform based on Ti3C2 nanosheets
The Ti3C2 nanosheets-based Ti3C2 nanosheets detection platform was established as follows: 80 μL of Ti3C2 nanosheet solution was added to 100 μL phosphatic buffer solution (0.1 M, pH = 7.4), then 20 μL of L-tryptophan solution with various concentrations was mixed and incubated for 6 min at room temperature. The fluorescence performances of Ti3C2 aqueous solution mixed with 3 μM various small organic molecules, including other amino acids (alanine, L-histidine, glutathione, L-cysteine, L-lysine, hydroxylamine, melamine, glycine, L-tyrosine, L-arginine, L-serine, biphenyl, maltose, urea, citric acid, L-lactic acid, vitamin H) were investigated as the selectivity experiments.Detection of L-tryptophan in real samples based on L-tryptophan
To confirm the reliability of the sensor, L-tryptophan analysis in human serum was performed. Human serum was purchased from Kejing Biological Technology Co. Ltd. (Jiangsu, China). The content of L-tryptophan was determined by the standard addition method. Briefly, human serum solution was produced by diluting the serum sample 100 times with 1 X PBS (pH 7.4). Here, 10.0 μL Ti3C2 nanosheets (4 mg mL−1) and different amounts of L-tryptophan were mixed and diluted with the serum solution for a total volume of 10 mL.Results and discussion
The characterization of Ti3C2 nanosheets
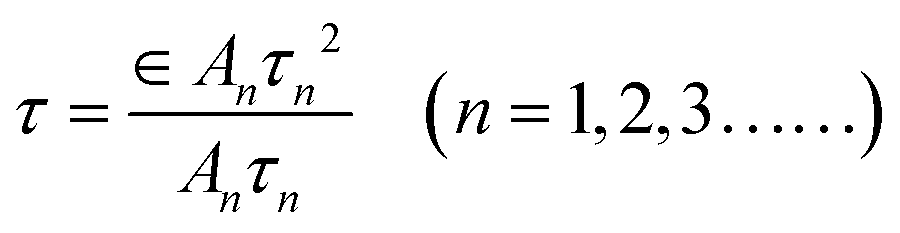
The Ti3C2 nanosheets were obtained by etching Ti3AlC2 with a mixed solution of LiF and HCl, repeated shaking and sonicating the resulting solution. The structures and morphologies of the as-prepared nanosheets were identified by SEM and AFM images, as shown in Fig. 1a and b. It was observed that ultra-thin nanosheets were obtained (Fig. 1a). As shown in the inset of Fig. 1a, the size of the nanosheets was ca. 400 nm. The Ti3C2 nanosheets can also be observed from the TEM images (Fig. S1†).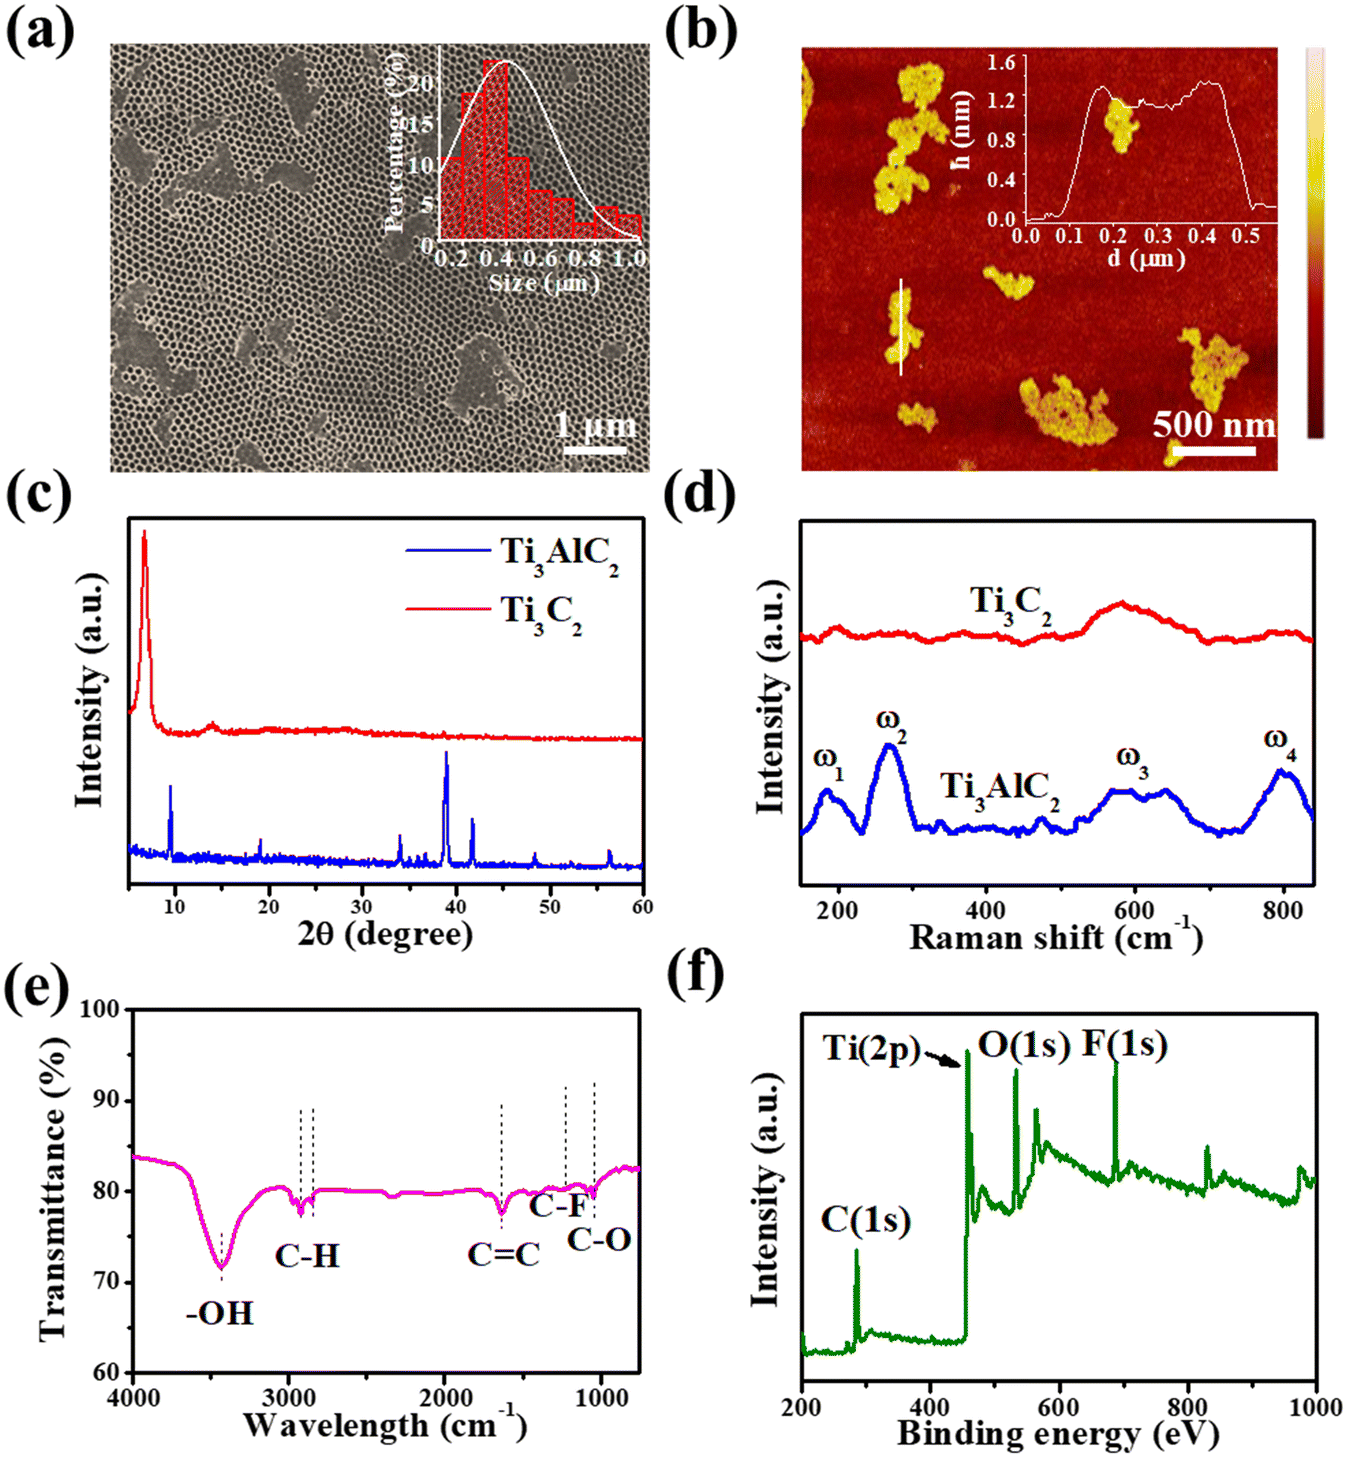 | ||
| Fig. 1 (a) SEM image of Ti3C2 nanosheets on AAO (inset shows the fitted normal distribution curve). (b) AFM topography image of Ti3C2 nanosheets. (c) XRD patterns of Ti3AlC2 and Ti3C2 nanosheets. (d) Raman spectrum of Ti3AlC2 and Ti3C2 nanosheets. (e) FTIR spectrum of Ti3C2 nanosheets. (f) XPS spectrum of Ti3C2 nanosheets. | ||
The AFM image shows that the average thickness of Ti3C2 nanosheets is nearly 1 nm (Fig. 1b), which means that they are monolayer nanosheets. The XRD patterns of powdered Ti3AlC2 and as-exfoliated Ti3C2 nanosheets are shown in Fig. 1c. The sharp XRD peak at 39°, compared to that of Ti3AlC2, disappeared in the pattern of Ti3C2 nanosheets, indicating that the interlayer Al of Ti3AlC2 was successfully etched by LiF/HCl solution. The peak position of the XRD diffraction peaks shifted to a small diffraction angle at about 7°, which may be ascribed to the formation of the single-layer structure of Ti3C2.36Fig. 1d shows the Raman spectra of Ti3AlC2 and Ti3C2 nanosheets; the first two peaks in the spectrum of Ti3AlC2, ω1 and ω2, could be attributed to the vibrations of Ti–Al, and the other two peaks (ω3 and ω4) at 579 cm−1 and 800 cm−1 originated from the vibrations of Ti–C. For the spectrum of Ti3C2 nanosheets, ω1 and ω2 disappeared and ω3 and ω4 remained, which also means that Al was removed. The FTIR spectrum of the as-exfoliated Ti3C2 nanosheets is shown in Fig. 1e, which exhibits a broad band around 3430 cm−1 corresponding to the –OH stretching vibration. Other FTIR bands at 1050 cm−1, 1110 cm−1, 1640 cm−1, 2850 cm−1 and 2925 cm−1 corresponded to the stretching vibrations of CO, C–F, C![[double bond, length as m-dash]](https://www.rsc.org/images/entities/char_e001.gif) C and C–H, respectively. These results indicate that a large number of functional groups, such as –OH and –F exist on the surface and sides of the Ti3C2 nanosheets. The nature of the chemical bonds can be determined by XPS, which is shown in Fig. 1f. The peaks in the XPS survey spectrum correspond to C 1s, O 1s, F 1s and Ti 2p, respectively. For the high-resolution spectrum of C 1s (Fig. S2†), the five deconvoluted peaks corresponded to CO, C–O, C–C, C–Ti–O, C–Ti, respectively.37 These results further support the existence of –O, –F and –OH terminations on the surface of the as-prepared Ti3C2 nanosheets.
C and C–H, respectively. These results indicate that a large number of functional groups, such as –OH and –F exist on the surface and sides of the Ti3C2 nanosheets. The nature of the chemical bonds can be determined by XPS, which is shown in Fig. 1f. The peaks in the XPS survey spectrum correspond to C 1s, O 1s, F 1s and Ti 2p, respectively. For the high-resolution spectrum of C 1s (Fig. S2†), the five deconvoluted peaks corresponded to CO, C–O, C–C, C–Ti–O, C–Ti, respectively.37 These results further support the existence of –O, –F and –OH terminations on the surface of the as-prepared Ti3C2 nanosheets.
The optical properties of Ti3C2 nanosheets
Fig. 2a shows the UV-vis absorption spectrum of the as-exfoliated Ti3C2 nanosheets, and there is a typical absorption peak at 330 nm. According to the results of first-principles density functional theory (DFT) calculations previously reported,38 the absorption peak at 330 nm can be attributed to the trapping of the surface excited state energy of Ti3C2 nanosheets. A peak was also observed at about 800 nm, attributed to the surface plasmon resonance of Ti3C2 nanosheets.39 The fluorescence emission spectra of Ti3C2 nanosheets in an aqueous solution with excitation wavelengths of 365 nm and 850 nm are shown in Fig. 2b. A fluorescence peak at 480 nm was observed at the excitation wavelength of 365 nm, due to the Stokes PL mechanism.40 It is interesting that an up-conversion fluorescence emission peak at 570 nm at the excitation wavelength of 850 nm was observed, which presented a narrower FWHM of 17 nm and was superior to most reported inorganic luminescent materials.35,41 In addition, both down-conversion and upconversion emission demonstrated excitation wavelength-dependent behaviors, as shown in Fig. S3† and 2c. The emission peak can be obtained from 465 nm to 605 nm by changing the excitation wavelength from 700 nm to 900 nm (Fig. 2c). Unexpectedly, at the excitation wavelength of 825 nm, the luminescence intensity had a sharp decline in the emission spectra. The excitation wavelength of 825 nm is close to that with the strongest intensity and is located in the plasmonic absorption range. Therefore, we speculate that the abnormal quenching effect, named the “interruption effect” herein, may result from the inner filter effect induced by the absorption of the surface plasmonic peak.42 Although the excitation wavelength-dependent behavior for down-conversion is similar to that of Ti3C2 quantum dots, this is the first report on the up-conversion emission behavior of Ti3C2 nanosheets. More importantly, the observed interruption effect will offer a great opportunity to enhance image resolution and sensor sensitivity because adjacent fluorescence quenching greatly reduces the interference to the optical application based on the highest emission peak.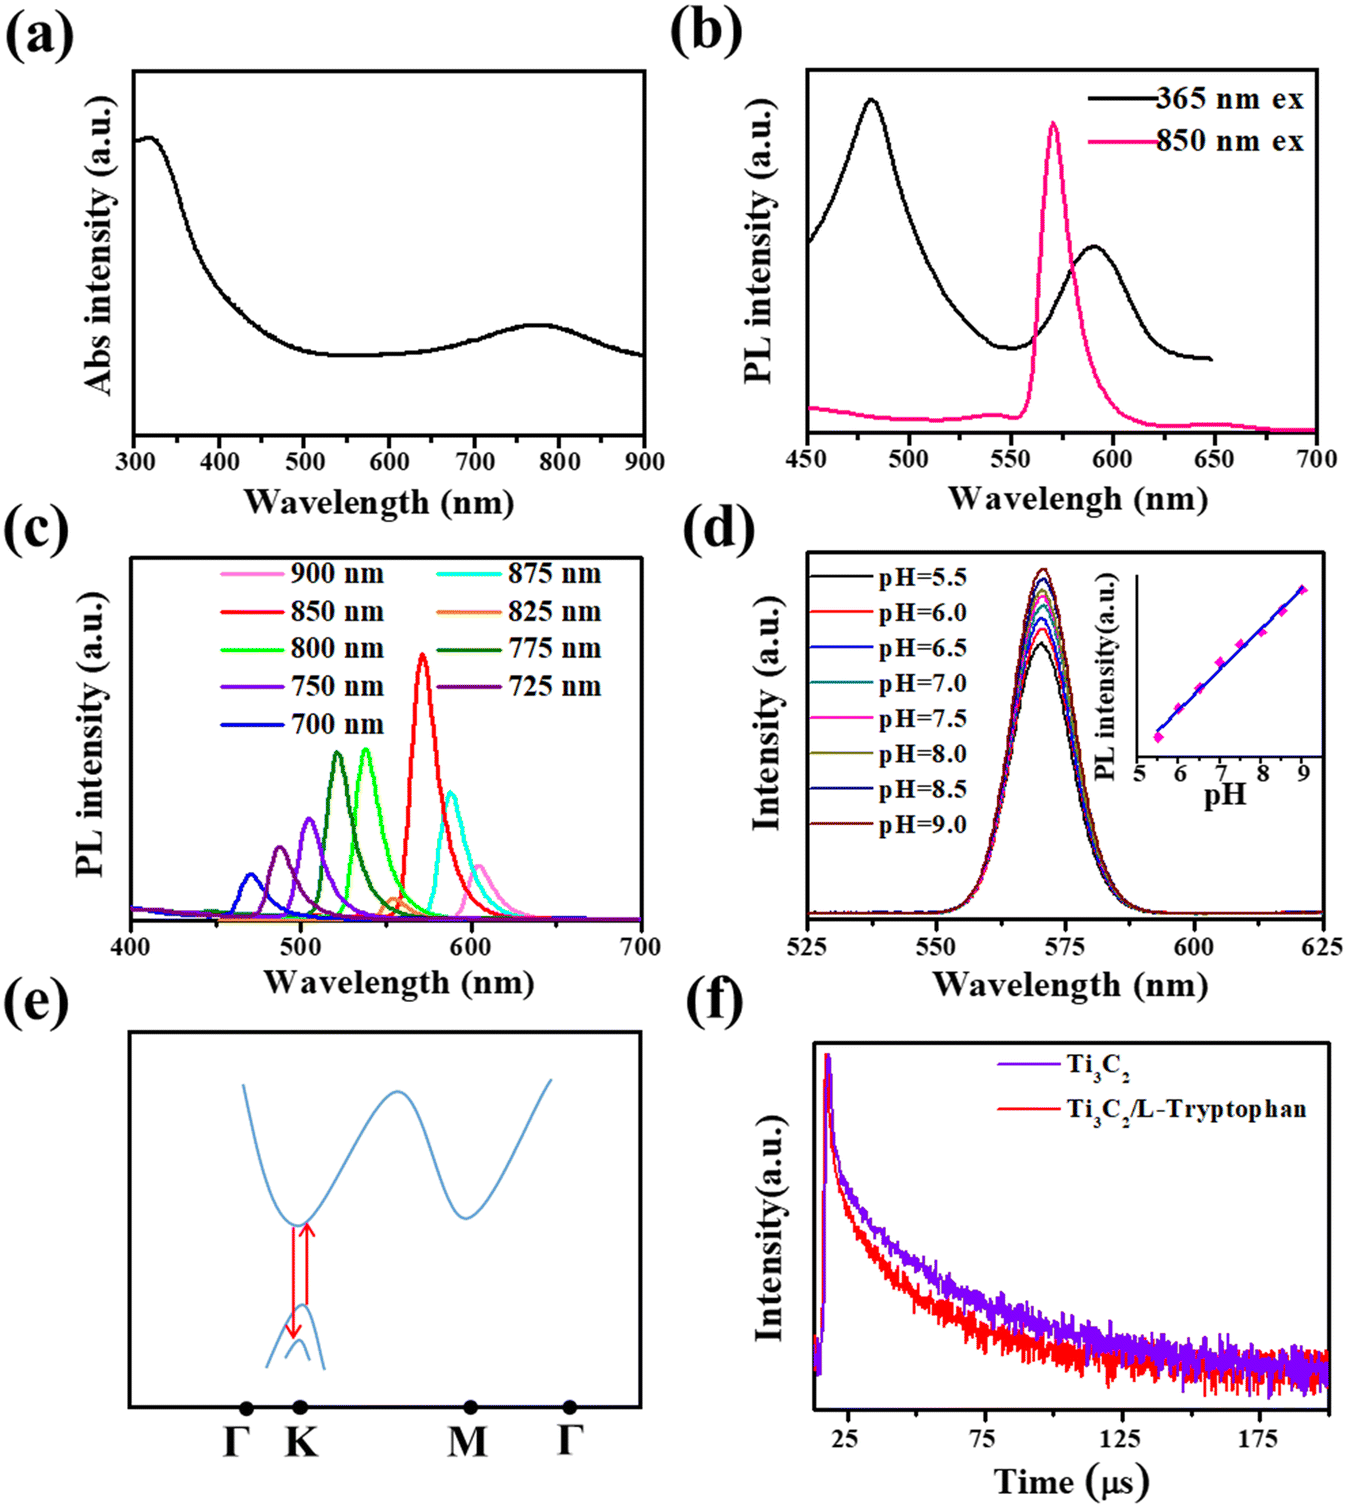 | ||
| Fig. 2 (a) UV-vis absorption of Ti3C2 nanosheets. (b) Fluorescence emission spectra of Ti3C2 nanosheets. (c) Fluorescence emission spectra of Ti3C2 nanosheets with different excitation wavelengths from 700 nm to 900 nm. (d) Fluorescence emission of Ti3C2 nanosheets with different pH values ranging from 5.5 to 9.0. The inset is the relationship of the PL intensity vs. the value of pH. (e) Schematic band structure of the electron transition process of Ti3C2 nanosheets. (f) Photoluminescence decay of an aqueous solution of Ti3C2 nanosheets before and after adding L-tryptophan. | ||
Neither Ti3AlC2 powder nor the accordion-like Ti3C2 has a fluorescence peak at 850 nm excitation (Fig. S4†), which possibly means that the upconversion luminescence only occurs when the dimensions are reduced to two dimensions or lower. Moreover, the larger size and multiple functional groups of the light-emitting Ti3C2, compared to other two-dimensional materials previously reported,35,41,43 may suggest the potential of multifunctional attachments in the development of novel probes. The energies of emission light and excitation light have a good linear relationship, whose fit line can be expressed as y = 1.48x + 0.01 eV (R2 = 0.99995) (Fig. S5†). This indicates that the conventional anti-Stokes PL mechanism induces up-conversion luminescence.35 To further study its luminescence properties, we investigated the effect of pH on PL emission behaviors in the Ti3C2 nanosheets at the excitation wavelength of 850 nm. The PL intensity of Ti3C2 nanosheets gradually increased with the pH changing from 5.5 to 9.0, as shown in the fluorescence emission spectra from Fig. 2d. The inset in Fig. 2d shows a good linear relationship between the peak intensity and the pH in aqueous solutions, and the PL intensity increased gradually with the increase in pH value. This can be attributed to the large amount of –OH groups that existed on the surface of the Ti3C2 nanosheets. The –OH group not only suppresses non-radiative processes, they also perfect the integrity of the π-conjugated system as an electron donator, resulting in the enhancement of the PL intensity.39 The previous reports have pointed out that Ti3C2 nanosheets have a direct band gap, similar to that of MoS2 quantum dots44,45 and graphene quantum dots.46,47 Therefore, a similar energy band structure and anti-Stokes PL mechanism were presented, as shown in Fig. 2e. Through absorbing photon energy from irradiation, the electrons transfer from the highest occupied molecular orbital (HOMO) to the lowest unoccupied molecular orbital (LUMO), forming excited electrons. Then, the excited electrons get down to a lower energy state than the HOMO, releasing higher energy than the absorbed photon energy, which leads to an upconversion behavior. The photoluminescence decay curve of an aqueous solution of Ti3C2 nanosheets in the process of upconversion luminescence is shown in Fig. 2f. The spectrum fit very well as a double exponential decay curve (the pink curve in the figure), and the average lifetime of the as-prepared Ti3C2 was calculated to be 1.18 μs.
The upconversion luminescence of Ti3C2 nanosheets with different synthetic paths
To investigate whether synthetic paths affect the presence of upconversion luminescence behaviors, we also chose another way to get Ti3C2 nanosheets. Ti3AlC2 were etched with HF, and then exfoliated with TMAOH (S–Ti3C2 NPs). S–Ti3C2 NPs also exhibited down-conversion fluorescence emission and upconversion fluorescence emission, just like the Ti3C2 nanosheets prepared by LiF and HCl. The fluorescence spectra of S–Ti3C2 NPs could be modulated by changing the excitation light wavelength (Fig. S6†). It could be summarized that the Ti3C2 nanosheets with upconversion luminescence properties could be prepared in different ways, and the upconversion phenomena are similar. The upconversion-emitted light intensity of S–Ti3C2 NPs was significantly higher than that of Ti3C2 nanosheets at 850 nm excitation (Fig. S7†), which can also be attributed to more –OH groups on the surface of nanosheets, similar to the previous report. Therefore, we can propose that Ti3C2 nanosheets with –OH groups may all exhibit their own upconversion behaviors with excitation dependence. In addition, the up-conversion emission behaviors from other MXene nanosheets or quantum dots will become worthy of study as new subjects in order to develop fluorescence probes with higher efficiency in the future.The detection of L-tryptophan based on up-conversion fluorescence
L-Tryptophan is an essential amino acid for the human body and its deficiency can cause phenylketonuria, cataracts, depression, and myocardial fibrosis.31,32,48 Furthermore, the photoluminescence decay of Ti3C2 nanosheets after mixing with L-tryptophan was also tested, as shown in the red curve of Fig. 2f. A shorter average lifetime of about 267 ns was observed, compared with that of Ti3C2 nanosheets, which means that a faster charge transfer process takes place from Ti3C2 nanosheets to L-tryptophan, causing the fluorescence quenching of the Ti3C2 nanosheets.49 In this study, based on the quenching effect of L-tryptophan on up-conversion emission, we developed the Ti3C2 nanosheets as a novel fluorescent probe with no label to directly detect L-tryptophan. Based on the optimal experimental conditions (Fig. S8 and S9†), 4 μg mL−1 Ti3C2 nanosheets and 6 min incubation time were selected for constructing the L-tryptophan sensor. As shown in Fig. 3a, the upconversion fluorescence intensity of the Ti3C2 decreased significantly, with gradually increasing the concentration of the L-tryptophan from 0 to 5 μM, until it was almost completely quenched. Fig. 3b shows the variation in the difference between the initial fluorescence intensity and the actual fluorescence intensity at 570 nm (I0 − I) in the presence of different concentrations of L-tryptophan. The spectra show that I0 − I has a good linear relationship with the concentrations of L-tryptophan in the range from 0–5 μM. The fit line can be expressed as y = 99.95 + 4632.96x (where R2 = 0.991, y is I0 − I, x is the concentration of L-tryptophan), and the detection limit of L-tryptophan was calculated to be as low as 91 nM, which is comparable with those reported in the literature (Table S1†). | ||
| Fig. 3 (a) Fluorescence intensity response of the Ti3C2 solution with different concentrations of L-tryptophan from 0 to 500 nM at 850 nm excitation. (b) The relationship of the intensity of the initial fluorescence (I0) vs. that of the actual fluorescence (I) with the concentration of L-tryptophan. (c) The response histogram of the fluorescence intensity of Ti3C2 depending on various reagents at 3 μM. | ||
We also investigated the fluorescence performance of various small organic molecules at a concentration of 3 μM, including other amino acids mixed with Ti3C2 aqueous solution, as shown in Fig. 3c. At this concentration, the addition of L-tryptophan to the Ti3C2 aqueous solution significantly quenched the fluorescence. While it does not exhibit such properties for other types of organic molecules at the same concentration, their fluorescence emission intensity is basically the same as I0, which suggests that Ti3C2 aqueous solution has good specificity for L-tryptophan. In addition, to evaluate the applicability of L-tryptophan detection based on Ti3C2 nanosheets, the sensor was also applied in the detection of L-tryptophan in human serum samples. As displayed in Table 1, the results validated that the recoveries of the added L-tryptophan were maintained between 95.6% and 103%, demonstrating the potential application of Ti3C2 in real sample detection. These results suggest that these nanosheets are very suitable for use as fluorescent molecular probes for detecting L-tryptophan.
| L-Trp added (μM) | L-Trp found (μM) | Recovery (%) | RSD (%, n = 3) |
|---|---|---|---|
| 0.1 | 0.103 | 103 | 2.1 |
| 0.5 | 0.478 | 95.6 | 3.7 |
| 2.0 | 1.944 | 97.2 | 2.9 |
Conclusion
In conclusion, we have successfully synthesized Ti3C2 nanosheets with a few layers and confirmed their upconversion luminescence properties. The upconversion luminescence phenomenon of Ti3C2 nanosheets has wide spectral coverage, a narrow FWHM, and a long fluorescence lifetime. The self-quenching of upconversion fluorescence was found and reported. Based on the upconversion property, we have developed Ti3C2 nanosheets as fluorescent molecular probes for the detection of L-tryptophan. The detection limit of this fluorescent molecular probe was as low as 91 nM and of excellent selectivity. This report adds to the upconversion luminescent materials, and the advantages of upconversion of Ti3C2 nanosheets also provide MXenes with great potential for more biological applications.Author contributions
Feng Wang: investigation, methodology, conceptualization, writing-original draft, writing-review & editing; Hongye Wang: writing-review & editing, analysis, suggestion; Xiaoqiang Cui, Yang Liu: methodology, validation, resources, data curation, supervision, project administration, writing-review & editing, funding acquisition.Conflicts of interest
The authors declare no competing financial interest.Acknowledgements
This work was financially supported by the National Natural Science Foundation of China (No. 22174084, 21874080, 51872116).References
- S. K. Bhardwaj, H. Singh, M. Khatri, K. H. Kim and N. Bhardwaj, Biosens. Bioelectron., 2022, 202, 113995 CrossRef CAS PubMed
.
- Y. J. Wu, Y. J. Sun, J. F. Zheng, J. H. Rong, H. Y. Li and L. Niu, Chem. Eng. J., 2021, 404, 126565 CrossRef CAS
- D. P. Huang, H. H. Yu and H. J. Zhang, Gaodeng Xuexiao Huaxue Xuebao, 2021, 42, 397–411 Search PubMed
- M. M. Hu, H. Zhang, T. Hu, B. B. Fan, X. H. Wang and Z. J. Li, Chem. Soc. Rev., 2020, 49, 6666–6693 RSC
- B. Anasori, M. R. Lukatskaya and Y. Gogotsi, Nat. Rev. Mater., 2017, 2, 16098 CrossRef CAS
- Y. Xia, T. S. Mathis, M. Q. Zhao, B. B. Anasori, A. Dang, Z. H. Zhou, H. Cho, Y. Gogotsi and S. Yang, Nature, 2018, 557, 409 CrossRef CAS PubMed
- Z. H. Bao, C. G. Lu, X. Cao, P. G. Zhang, L. Yang, H. Zhang, D. W. Sha, W. He, W. Zhang, L. Pan and Z. G. Sun, Chin. Chem. Lett., 2021, 32, 2648–2658 CrossRef CAS
- F. W. Ming, H. F. Liang, G. Huang, Z. Bayhan and H. N. Alshareef, Adv. Mater., 2021, 33, 2004039 CrossRef CAS PubMed
- N. Kurra, B. Ahmed, Y. Gogotsi and H. N. Alshareef, Adv. Energy Mater., 2016, 6, 1601372 CrossRef
- S. K. Hwang, S. M. Kang, M. Rethinasabapathy, C. Roh and Y. S. Huh, Chem. Eng. J., 2020, 397, 1254 CrossRef
- Q. Xue, H. J. Zhang, M. S. Zhu, Z. X. Pei, H. F. Li, Z. F. Wang, Y. Huang, Y. Huang, Q. H. Deng, J. Zhou, S. Y. Du, Q. Huang and C. Y. Zhi, Adv. Mater., 2017, 29, 1604847 CrossRef PubMed
- X. Yan, J. F. Ma, K. X. Yu, J. P. Li, L. Yang, J. Q. Liu, J. C. Wang and L. L. Cai, Chin. Chem. Lett., 2020, 31, 3173–3177 CrossRef CAS
- D. H. Ho, Y. Y. Choi, S. B. Jo, J. M. Myoung and J. H. Cho, Adv. Mater., 2021, 33, 2005846 CrossRef CAS PubMed
- B. Wang, S. P. Zhong, P. Xu and H. Zhang, Chem. Eng. J., 2021, 403, 126336 CrossRef CAS
- S. Z. Li, J. F. Ma, X. L. Zhao, P. D. Zhu, Xu Meng, Y. C. Niu, D. X. Luo and Q. Xu, Chin. Chem. Lett., 2022, 33, 1850–1854 CrossRef CAS
- X. Chen, X. Sun, W. Xu, G. Pan, D. Zhou, J. Zhu, H. Wang, X. Bai, B. Dong and H. Song, Nanoscale, 2017, 10, 1111–1118 RSC
- M. Liu, Y. Bai, Y. He, J. Zhou, Y. Ge, J. Zhou and G. Song, Microchim. Acta, 2021, 188, 15 CrossRef CAS PubMed
- Q. Zhang, Y. Sun, M. Liu and Y. Liu, Nanoscale, 2020, 12, 1826–1832 RSC
- Z. P. Zeng, Y. B. Yan, J. Chen, P. Zan, Q. H. Tian and P. Chen, Adv. Funct. Mater., 2019, 29, 1806500 CrossRef
- Z. Jing, L. Qian, W. Feng, Y. Sun and F. Li, Chem. Rev., 2014, 115, 395–465 Search PubMed
- D. L. Liang, Q. H. Song, Y. T. Yao and B. Liu, Gaodeng Xuexiao Huaxue Xuebao, 2019, 40, 583–591 CAS
- J. W. Zhu, J. J. Shen, B. Hu, L. Yang and C. L. Jiang, Anal. Chem., 2022, 94, 1126–1134 CrossRef CAS PubMed
- J. W. Zhu, B. Hu, L. Yang and C. L. Jiang, Sens. Actuators, B, 2021, 345, 130378 CrossRef CAS
- D. D. Su, X. Zhao, X. Yan, X. S. Han, Z. F. Zhu, C. G. Wang, X. T. Jia, F. M. Liu, P. Sun, X. M. Liu and G. Y. Lu, Biosens. Bioelectron., 2021, 194, 113598 CrossRef CAS PubMed
- Q. Zhang, D. Jie, Y. Shen, D. Chen, Q. Zhou, Q. Chen, Z. He and J. Qiu, J. Alloys Compd., 2010, 508, 13–15 CrossRef
- L. Xiong, Z. Chen, Q. Tian, T. Cao, C. Xu and F. Li, Anal. Chem., 2009, 81, 8687–8694 CrossRef CAS PubMed
- X. W. Liu, M. Liu, J. J. Chen, Z. H. Li and Q. Yuan, Chin. Chem. Lett., 2018, 29, 1321–1332 CrossRef CAS
- B. Hu, J. W. Zhu, J. J. Shen, L. Yang and C. L. Jiang, Anal. Chem., 2022, 94, 7559–7566 CrossRef CAS PubMed
- S. Y. Choi, S. H. Baek, S. J. Chang, Y. Song, R. Rafique, K. T. Lee and T. J. Park, Biosens. Bioelectron., 2017, 93, 267–273 CrossRef CAS PubMed
- S. Li, L. G. Xu, W. Ma, X. L. Wu, M. Z. Sun, H. Kuang, L. B. Wang, N. A. Kotov and C. L. Xu, J. Am. Chem. Soc., 2016, 138, 306–312 CrossRef CAS PubMed
- C. Mainetti, M. Fathi and J. H. Saurat, Dermatology, 1991, 183, 62–65 CrossRef CAS
- D. M. Richard, M. A. Dawes, C. W. Mathias, A. Acheson, N. Hill-Kapturczak and D. M. Dougherty, Int. J. Tryptophan Res., 2009, 2, 45–60 CAS
- M. Alhabeb, K. Maleski, B. Anasori, P. Lelyukh, L. Clark, S. Sin and Y. Gogotsi, Chem. Mater., 2017, 29, 7633–7644 CrossRef CAS
- O. Mashtalir, M. Naguib, V. N. Mochalin, Y. Dall'Agnese, H. Min, M. W. Barsoum and Y. Gogotsi, Nat. Commun., 2013, 4, 1716 CrossRef PubMed
- H. Dong, S. Tang, Y. Hao, H. Yu, W. Dai, G. Zhao, Y. Cao, H. Lu, X. Zhang and H. Ju, ACS Appl. Mater. Interfaces, 2016, 8, 3107–3114 CrossRef CAS PubMed
- Q. Tang, Z. Zhen and P. Shen, J. Am. Chem. Soc., 2012, 134, 16909–16916 CrossRef CAS PubMed
- Y. L. Qin, Z. Q. Wang, N. Y. Liu, Y. Sun, D. X. Han, Y. Liu, L. Niu and Z. H. Kang, Nanoscale, 2018, 10, 14000–14004 RSC
- Q. Xu, L. Ding, Y. Y. Wen, W. J. Yang, H. J. Zhou, X. Z. Chen, J. Street, A. G. Zhou, W. J. Ong and N. Li, J. Mater. Chem. C, 2018, 6, 6360–6369 RSC
- J. K. Demellawi, S. Lopatin, J. Yin, O. F. Mohammed and H. N. Alshareef, ACS Nano, 2018, 12, 8485–8493 CrossRef PubMed
- Q. X. Zhang, F. Wang, H. X. Zhang, Y. Y. Zhang, M. L. Liu and Y. Liu, Anal. Chem., 2018, 90, 12737–12744 CrossRef CAS PubMed
- S. Zhuo, M. Shao and S. T. Lee, ACS Nano, 2012, 6, 1059–1064 CrossRef CAS PubMed
- Q. Hua, L. Gao, S. Q. Rao, Z. Q. Yang, T. Li and X. J. Gong, Food Chem., 2019, 280, 195–202 CrossRef PubMed
- R. Furue, K. Matsuo, Y. Ashikari and H. Ooka, Adv. Opt. Mater., 2018, 6, 1701147 CrossRef
- T. Guo, L. N. Wang, S. Sun, Y. Wang, X. L. Chen, K. N. Zhang, D. X. Zhang, Z. H. Xue and X. B. Zhou, Chin. Chem. Lett., 2019, 30, 1253–1260 CrossRef CAS
- X. Zhu, J. Xiang, J. Li, C. Feng, P. Liu and B. Xiang, J. Colloid Interface Sci., 2017, 511, 209–214 CrossRef PubMed
- S. Huang, J. D. Yao, G. Ning, Q. Xiao and Y. Liu, Gaodeng Xuexiao Huaxue Xuebao, 2021, 42, 2412–2421 Search PubMed
- F. Gao, F. Liu, X. Bai, X. Xu and M. Li, Carbon, 2018, 141, 331–338 CrossRef
- S. Liu, J. Z. Xu and W. G. Zhang, World J. Microbiol. Biotechnol., 2022, 38, 22 CrossRef CAS PubMed
- M. Y. Wu, P. Mukherjee, D. N. Lamont and D. H. Waldeck, J. Phys. Chem. C, 2010, 114, 5751–5759 CrossRef CAS
Footnote |
| † Electronic supplementary information (ESI) available. See DOI: https://doi.org/10.1039/d2sd00107a |
| This journal is © The Royal Society of Chemistry 2022 |