
 Open Access Article
 This Open Access Article is licensed under a Creative Commons Attribution-Non Commercial 3.0 Unported Licence
Sensor detection in gynaecological medicine
Michael
Thompson
 *a,
Soha
Ahmadi
a,
Katharina
Davoudian
a,
Brian
De La Franier
a,
Navina
Lotay
a and
Marcus Q.
Bernardini
b
*a,
Soha
Ahmadi
a,
Katharina
Davoudian
a,
Brian
De La Franier
a,
Navina
Lotay
a and
Marcus Q.
Bernardini
b
aDepartment of Chemistry, University of Toronto, 80 St. George St., Toronto, Ontario M5S 3H6, Canada. E-mail: m.thompson@utoronto.ca
bGynaecologic Oncology, Sinai Health System, 700 University Avenue, Toronto, Ontario M5G 2Z5, Canada
First published on 28th July 2022
Abstract
Gynecological medicine involves the diagnoses and treatment of illnesses and issues involving female reproductive organs. This review is focused on female cancers of their reproductive organs including ovarian cancer, cervical cancer, and uterine/endometrial cancer, as well as endometriosis, and infections within the reproductive tract. For each of the illnesses the current state of screening and diagnosis is investigated. These typically involve screening of symptoms for the illnesses, followed by imaging with ultrasound or MRI in the case of cancers and endometriosis, or swab cultures in the case of infection. These techniques are time consuming and require trained professionals to perform, and thus are expensive and difficult to apply to general population screening. Faster, lower cost, and simple screening methods need to be developed as screening is essential to catching these illnesses in an early stage, allowing their more effective treatment and improving outcomes for patients. The realm of sensors and biosensors offers a way to screen for blood, tissue, and urine based biomarkers for these illnesses. This review looks at a selection of biomarkers for each of the gynecological illnesses, and investigates some of the sensors that have been developed for them including various electrochemical, colorimetric, plasmon based sensors, and more. Future work in this field should not only focus on the accuracy of developed sensors for these illnesses, but also focus on their ease of use, ability to be mass produced, and keeping their cost low, all of which would allow the sensors to be used in general population screening.
A concise look at pertinent gynaecological conditions and diseases
Gynaecology is a branch of medicine that is concerned with the health of female reproductive organs.1 The discipline deals with abnormalities and diseases of the vulva, vagina, cervix, uterus, fallopian tubes, ovaries, and other organs in the pelvic area. Conditions include various forms of infection, endometriosis, cancers, presence of tumours and cysts, and menstrual disorders (infertility and childbearing issues are also considered to be a part of the field). Notably, the most deaths are caused by malignant tumours. Here we briefly review, for the most part, disorders that have been associated specifically with sensor technology. Other conditions outlined offer potential for sensor-based assays.Ovarian cancer and cysts
Ovarian cancer (OC) is a term used to describe any cancerous tumours that present in the ovaries or fallopian tubes of women.2 The disease displays the highest fatality-to-case ratio of all gynaecological cancers.3 Worldwide, nearly 300![[thin space (1/6-em)]](https://www.rsc.org/images/entities/char_2009.gif) 000 women are diagnosed with disease with recorded deaths being close to the 200000 number.4–6 Progression of the disease is characterized as occurring in four stages, with sub-stages also being involved. In stage I, where tumours are found on the ovaries (or fallopian tubes) only, the 5-year survival rate is over 90%, whereas in stage 4, where the disease has spread to other areas of the body, the rate can be as low as 20% depending on the specific nature of the disease. Ovarian cancer is considered to possess as many as 30 variations, where epithelial ovarian carcinomas are the most common type accounting for close to 90% of cases. Of these, serous, endometrioid, mucinous and clear cell carcinomas represent sub-groups. There are fewer common types such as germ and stromal cell carcinomas. A wide variety of factors are considered to be influential with regard to incidence of the disease. Among these are family history, age, demography, ethnicity, and reproductive/hormonal issues.6 The various types of ovarian cancer render their detection and characterization challenging given their variation in disease progression. High-grade serous cancers have a completely different disease distribution and genetic composition compared to endometrioid or clear cell subtypes.
000 women are diagnosed with disease with recorded deaths being close to the 200000 number.4–6 Progression of the disease is characterized as occurring in four stages, with sub-stages also being involved. In stage I, where tumours are found on the ovaries (or fallopian tubes) only, the 5-year survival rate is over 90%, whereas in stage 4, where the disease has spread to other areas of the body, the rate can be as low as 20% depending on the specific nature of the disease. Ovarian cancer is considered to possess as many as 30 variations, where epithelial ovarian carcinomas are the most common type accounting for close to 90% of cases. Of these, serous, endometrioid, mucinous and clear cell carcinomas represent sub-groups. There are fewer common types such as germ and stromal cell carcinomas. A wide variety of factors are considered to be influential with regard to incidence of the disease. Among these are family history, age, demography, ethnicity, and reproductive/hormonal issues.6 The various types of ovarian cancer render their detection and characterization challenging given their variation in disease progression. High-grade serous cancers have a completely different disease distribution and genetic composition compared to endometrioid or clear cell subtypes.
Turning to ovarian cysts, these are fluid-filled sacs which are present on the surface of the ovaries. These are normally benign and can be composed of various types such as functional, dermoid, and endometrioma cysts.7 Another condition where cysts are exhibited on the ovaries is polycystic ovary syndrome which is an endocrine disorder affecting women of reproductive age.8
Cervical cancer
This cancer involves tumours present in the cervix, which is the part of the female reproductive system that connects the uterus to the vagina. In 2020 it is estimated that, worldwide, over 600000 women were diagnosed with the disease resulting in over 340000 deaths.9 As for ovarian cancer, the 5-year survival rate very much depends on the stage at which the condition is detected. If found at an early stage the rate is over 90%, but when the disease has spread remotely in the body the rate is less than 20%. Approximately 75% of cervical cancer cells are of the squamous type with most of the others being adenocarcinomas.10 Notably, there is a significantly higher possibility for detection at an early stage than is the case for ovarian cancer (see later). In countries with a robust screening program, deaths related to cervical cancer have fallen out of the top five and, in some cases, ten causes of cancer death.
Uterine cancer
This form of disease is the most common cancer of the female reproductive system.11 Uterine cancers are generally divided into two categories: endometrial cancers and stromal cancers. Endometrial carcinoma represents the majority of uterine cancer with its origin being from the cells in the lining of the uterus (endometrium). Uterine sarcoma involves supporting tissues of the uterus (muscle). Germ cell tumours of the uterus are rare cancers associated with fertilization of eggs. Close to 67000 women in the USA will be diagnosed with the disease in the near future, and there will be nearly 13000 deaths.12 As for the two other cancers outlined above, the 5-year survival rate for cases where the cancer is restricted to the area of origin is quite high at 95%, compared to the poor rate for late-stage development (18%).
Endometriosis
Endometriosis is a condition whereby growth of ectopic endometrial cells occurs outside the womb.13 These cells often involve the ovaries and Fallopian tubes and cause significant pelvic and menstrual pain and infertility. It has been estimated that close to 11 million women worldwide are affected by endometriosis representing up to 10% of the general population.14Gynaecological infections
Infection and inflammation can occur in several areas of the female reproductive system including the vulva, vagina, cervix, uterus, and ovaries. These conditions can result from a wide variety of bacteria and microorganisms.15,16 Women suffering from such infections will often present with vaginal discharge, lower abdomen pain, nausea, and fever. Unsurprisingly, treatment usually involves antibiotics although there is evidence that anti-microbial resistance can occur.17A précis of imaging and current detection assays
Ovarian cancer
The mainstay of diagnostic strategies in ovarian cancer revolves around imaging and immune assays. Imaging techniques such as transvaginal ultrasonography (TVUS), computed tomography (CT), positron emission tomography (PET), and magnetic resonance imaging (MRI) are clinically used for the diagnosis of OC. These techniques are also important in OC research and clinical trials, but are not feasible for mass screening. Challenges with screening include different disease progression among various ovarian cancer types, the overall rarity of the disease, the common presentation of non-neoplastic etiology of ovaries, and the short time interval between anything detectable and advanced disease in the most common form of OC (high-grade serous ovarian cancer). A limited study in one institute showed that high-frequency imaging can detect recurrence in patients with stages III and IV OC. However, the benefit of frequent surveillance imaging needs further studies in a large population.18 Despite this comment, it is certainly the case that most centers these days do employ both the CA-125 assay and imaging.Detection of ovarian cancer with imaging techniques at the early stages is very difficult, but as the cancer progresses to the later stages, these techniques can determine the type and size of the mass in ovarian tissue. TVUS is a more cost-effective imaging modality to assess adnexa masses compared to CT, PET, and MRI, and by using a simple scoring system, it can be used for distinguishing between benign and malignant adnexal masses.19 A recent study in China showed that using a predictive model, developed by the International Ovarian Tumour Analysis (IOTA) group, the nonexpert ultrasonographers with limited experience can distinguish benign and malignant adnexal masses.20 This predictive multiclass model can effectively differentiate between benign tumours, borderline ovarian tumours, stage I, stage II–IV OC and secondary metastatic ovarian cancers.21,22 Combining the data obtained from TVUS with color flow doppler, pattern recognition, and clinical background improves the sensitivity and specificity of TVUS.23,24 In three large ovarian cancer screening trials, TVUS was used together with detecting the CA-125 biomarker.25–27
The most recent randomized controlled trial, the United Kingdom Collaborative Trial of Ovarian Cancer Screening (UKCTOCS), was performed by recruited postmenopausal women aged 50–74 years using a multimodal screening approach. In this approach, serum CA-125 was detected with the use of a risk of ovarian cancer algorithm and annual transvaginal ultrasound screening (USS) as a second-line test.27 This trial is one of the largest randomized trials that has screened OC in postmenopausal women from the general population with more than 202000 participants, more than 670000 annual screening episodes, and more than 2.19 million women of follow-up, which was managed through the UK National Health System (NHS) central management. The impact on the survival was not significant in the primary analysis, however, a significant enhancement in survival rate was observed with the multimodal screening model when prevalent cases were excluded. One hypothesis is that the screening identified “earlier advanced disease”. Given that the degree of ovarian cancer cytoreduction at primary surgery is associated with improvements in overall survival, it is possible that “less advanced disease” increased the likelihood of surgical removal of cancers with visible residual disease. Further follow-up is needed to confirm the efficacy and cost-effectiveness of this approach.27
CT and PET scans are recommended when OC is clinically detected; they are also used to detect metastatic cancer and for monitoring the treatment. They are commonly used in clinical trials for inclusion of the participants and response assessment. Using CT scans and CA-125 tests for surveillance of 1241 OC patients after completion of primary cytoreductive surgery and chemotherapy showed that this costly surveillance approach worsens the quality of life of the patients without improving the survival rates.28 However, the reality is that these days all centers monitor OC with CA-125 and imaging.
Cervical cancer
As early-stage cervical cancer is generally asymptomatic, regular screening is critical for early disease detection when treatment is most effective. Cervical cytology is a common screening technique, where cervical epithelial cells are collected for a Papanicolaou test (Pap test) to detect cell abnormality based on morphology.29–31 However, Pap tests are most effective in identifying squamous cell carcinoma rather than adenocarcinoma,32 the latter making up about 10–20% of cervical cancers.33In a conventional Pap test, cervical cells are directly examined under a microscope. Liquid-based cytology (LBC) is an alternative technique and requires sample processing before microscopic analysis. LBC is more common than conventional Pap tests due to improved reliability; sample processing in LBC isolates cells of interest from interfering materials (e.g., mucous and blood), improving sample visualization and analysis.31,34 As residual materials are available, LBC can also incorporate molecular tests such as the detection of the human papillomavirus (HPV).34,35
HPV testing is significant since infection with certain HPV strains are a cause29,36,37 of about 90% of cervical cancers.38 While a positive HPV result with a high-risk subtype is not a definitive diagnosis of cervical cancer, HPV-positive women can be further examined to determine HPV strain type, infection stage, and potential precancer/cancer presence.29,39 To predict prognosis, HPV genotyping identifies strain type, as high-risk HPV (hrHPV) are carcinogenic while low-risk HPV (lrHPV) cause genital warts and rarely cancer. Techniques for HPV typing can involve in situ hybridization, Southern blotting, and/or polymerase chain reaction.29,40 These methods are labour-intensive as they require highly trained technicians.29 To improve HPV detection, developing molecular HPV test kits is an ongoing area of research, where over 250 different kits are commercially available.41,42
Pap tests have poor sensitivity and reproducibility as they are qualitative and rely on a cytologist's expertise.29,31,39 To reduce bias, Kanavati et al. developed a deep learning model for aiding cytologists in assessing sample images.34 However, standalone HPV testing is recommended as the primary screening method for cervical cancer since HPV testing is objective, has greater sensitivity, with slightly lower specificity.31,39,43 The specificity of HPV testing increases with age as younger women are more likely to have transient HPV infections, causing guidelines to suggest starting HPV testing for women above 30 or 35 years old.44–46 Combining cytology and HPV testing (co-testing) slightly improves sensitivity but reduces specificity, making cytological analysis more useful and cost-effective as a triage test for HPV-positive patients.39,43
Positive screening results lead to triage tests such as colposcopy, biopsy, Pap tests,43 or in low-income countries visual inspection with acetic acid (VIA) and visual inspection with Lugol's iodine (VILI). In VIA, a 3–5% acetic acid solution is administered on cervical tissue to detect cell abnormality based on colour; precancer or cancer appear white in acidic conditions because of coagulation of excess proteins, while faint or no colour change is normal. In VILI, an iodine solution reacts with glycogen to produce a brown/black colour with healthy tissue.35,39,47 As precancer or cancer have limited or no glycogen, the tissue becomes yellow. VIA and VILI are simple, low-cost, and rapid tests that are effective if other screening methods are not accessible.48 Colposcopy remains the preferred assessment method for triaging abnormal screening which uses the same principles as VIA but with magnification. Like Pap tests, visual inspection techniques are qualitative, have poor reproducibility, and do not identify the HPV strain type.29,48,49 That said, current screening strategies are extremely effective in reducing mortality due to cervical cancer.
Imaging techniques for confirming and analyzing cervical cancer stage include magnetic resonance imaging (MRI), computed tomography scanning (CT scan), positron emission tomography and computed tomography (PET/CT).50–52 To overcome the limitations of these imaging techniques, such as high cost, compactness, and/or low accuracy, Basij et al. developed an ultrasound/photoacoustic imaging technique as a potential point-of-care tool for cervical tissue imaging.52
While cervical cancer mortality rates have decreased in developed countries because of screening and HPV vaccination, developing countries are experiencing an increase in cervical cancer as screening and vaccination are limited or lacking.40,41 For global cervical cancer disease prevention, a cost-effective and point-of-care biosensor can allow cervical cancer screening to become globally accessible.
Uterine cancer
For endometrial cancers, common symptoms include postmenopausal bleeding (PMB), excessive vaginal bleeding, irregular menstruation, vaginal discharge, hematuria, and abdominal pain.53 Additionally, uterine and endometrial cancers may present with unusual cytologies in cervical pap smear tests, but this is not a reliable screening method for these cancers.54,55 Given that the majority of women with endometrial cancer are post-menopausal, PMB remains the most common symptom associated with endometrial cancer.However, the presence of symptoms is insufficient to diagnose these conditions and further study is required. Transvaginal ultrasound (TVUS) is commonly used in the diagnosis of uterine and endometrial cancers, as the cancers typically cause the thickness of the endometrium to increase.56,57 The accuracy of TVUS can by improved using sonohysterograms, a method that involves filling the uterine cavity with saline solution to improve imaging.58 If the endometrium is found to be unusually thick, a tissue biopsy can be used to determine if cancer is present, though proper diagnosis is limited by the skill of the examiner and the ability to yield an adequate tissue sample.59,60 Additional methods of imaging including MRI and CT scans can also be used to diagnose uterine and endometrial cancers.61,62
Imaging studies and tissue biopsies require extensive training and skill to perform well, and are typically time consuming, uncomfortable for patients, and expensive. As such, development of a sensor for these conditions could free up medical resources and examiners' times, as well as reduce patient stress and discomfort. However, as of recently we were unable to find any commonly used sensors or biosensors for these conditions, with hospitals and clinics relying on traditional imaging methods and biopsies for screening and diagnosis.63
Endometriosis
For endometriosis, typical symptoms include inter-menstrual bleeding, painful periods, painful urination and defecation, and pelvic pain before menstruation.65 Diagnosis involves similar imaging studies after symptoms present themselves. TVUS is typically the first recommendation for endometriosis diagnosis, as it allows for the direct imaging of endometrial tissue and its location.64 Additionally, MRI can be used to image the endometrium towards diagnosing endometriosis.63 Complete diagnosis of endometriosis typically relies on laparoscopy and tissue biopsy for women suspected of the condition.65Gynaecological infections
There are a wide variety of infections in gynecological settings, from sexually transmitted infections (STIs) to bacterial and yeast infections. There are common techniques in their screening and diagnosis which are used in clinical settings. For STIs, the most highly recommended techniques to diagnose gynecological infections is nucleic acid amplification techniques (NAATs), such as polymerase chain reaction (PCR), of known genetic sequences to allow for accurate diagnoses of the infectious agent. This is recommended for chlamydia,66 gonorrhea,67 and HIV.68,69 This recommendation comes from the high accuracy of diagnoses for these illnesses compared to other techniques such as cell cultures or rapid screening tests.64,69 Additionally, antibody assays can be used in HIV screening.69,70When it comes to bacterial vaginosis (BV) and yeast infections, cell culturing and microscopy analysis are common in diagnosing these infections.67,71,72 Gram stain testing is also very commonly used in diagnosing these infections and is often considered a gold standard.73 These techniques are time consuming and require laboratory settings and trained physicians, thus making them costly and difficult to perform beyond a strict clinical setting. However, they remain our best methods for diagnosing gynecological infections. A simpler commonly used screening method for bacterial vaginosis is pH testing of vaginal fluid, as high pH can indicate the presence of a bacterial infection,67 though this is not sufficient for diagnosis.
Potential gynaecological biomarkers
Ovarian cancer
While imaging is a very useful tool for diagnosis, biomarkers can also give indications of disease presence and progression. They can also allude to possible drug targets for disease treatment. Biomarkers can be the presence, overexpression, or underexpression of molecules, proteins, or enzymes found in body fluids or tissue. There is a large body of work dedicated to the discovery and use of biomarkers for a variety of diseases including ovarian cancer (Table 1).| Biomarker | Cut-off | SE | SP | Ref. |
|---|---|---|---|---|
| a Indicates a very small sample size. | ||||
| CA-125 | >35 U mL−1 | 82.2% | 67.3% | 74 |
| Osteopontin | >260 ng mL−1 | 81% | 34% | 79, 85 |
| HSP-27 | >0.25 ng μg−1 cytosolic protein | NA | NA | 80, 85 |
| Mesothelin | >2 nM | 60% | 98% | 87 |
| EN-2 | 78% | 81% | 91 | |
| HSP-10 | >0 | 100%a | 100%a | 92 |
| LPA | 1.3 μM | 98% | 90% | 93, 94 |
| HE4 | >70 pM | 72.9% | 95% | 96 |
| CA-125, ApoA-I, transferrin, transthyretin | N/A | 89% | 97% | 101 |
| OVA-1 panel | N/A | 91% | 69% | 103 |
| CA-125, leptin, prolactin, osteopontin, insulin-like growth factor 2, macrophage inhibitory factor | N/A | 95% | 99% | 104 |
| CA-125, transthyretin, beta-hemoglobin, apolipoprotein AI, transferrin | N/A | 86% | 86% | 105 |
| miRNA | N/A | 92% | 91% | 107, 108 |
An ideal biomarker for ovarian cancer would be present from early stages of the disease, reflect the progression of the cancer, and be detected in an efficient and inexpensive manner. As mentioned previously, early detection is critical for the survival of patients with ovarian cancer, so there is great interest in biomarkers present in stage I and II of the disease. The National Institute of Health's National Cancer Institute Early Detection Research Network has a database of different cancer biomarkers. A quick search shows over 200 possible ovarian cancer biomarkers found in stage I and/or II, but many of them are still currently being investigated. This review will focus on biomarkers that have been studied in more detail.
The only biomarker that is currently used in clinical applications is the mucin protein cancer antigen 125 (CA-125), also referred to as mucin 16 (MUC16). It is present at elevated levels in 92% of late-stage patients but only half of early-stage patients, resulting in false negatives.74–76 Additionally, it can be elevated in benign conditions, resulting in false positives.74 CA-125 has also been shown to exist at elevated levels in other cancers such as endometrial, breast, lung, and gastrointestinal cancers.74 Thus, CA-125 is not sufficiently sensitive or specific enough to be used on its own for diagnosis and is recommended to be used instead in combination with imaging techniques such as transvaginal ultrasonography.74,77,78 It is also commonly used to monitor the tumor's treatment response, as serum levels tend to increase as the disease progresses.74,77,78 Despite its low sensitivity and specificity as a screening tool, studies analyzing a variety of biomarkers still found CA-125 to exhibit some of the highest reliability for diagnosis of ovarian cancer.77,78
Several potential biomarkers that have been studied include osteopontin, HSP-27, HSP-60, calreticulin, vimentin, and fibrinogen-γ, but unfortunately like CA-125, none of these are consistently overexpressed until late stages of the disease, and as such are not a focus of this review.79–86
There are several other potential biomarkers that are initially promising but need further validation to be of use in the early detection of ovarian cancer. Mesothelin is a popular one, going so far as to have been mentioned in the media. It is a cell-surface glycoprotein and tumor differentiation antigen that is elevated in three quarters of ovarian cancer patients; however, it is also elevated in a variety of other cancers and patients suffering from mesothelioma.87 Due to its low specificity for ovarian cancer, it is not very useful for diagnosis and is instead more helpful in monitoring disease response to treatment.87
Cyclooxygenase-1 is an enzyme that catalyzes the conversion of arachidonic acid to prostaglandins that has been found to be expressed at high levels in the early stages of human epithelial ovarian cancer.88–90 Studies have determined that COX-1 mRNA and protein are elevated in ovarian cancer samples when compared with levels in normal ovarian tissue. While the ability of COX-1 to be used in early diagnosis needs to be evaluated further, especially in human samples, current results in mouse models indicate that there is also a possibility of its inhibition to be used as a treatment to prevent further cancer growth.88
Engrailed-2 (EN2) is a homeobox protein that has been demonstrated to be overexpressed in breast and prostate cancer, while it is not expressed at all in normal breast or prostate tissue nor in benign disease.91 Based on this information, McGrath et al. studied EN2 mRNA and protein expression in eight ovarian cancer cell lines, 108 tumor samples and 5 normal tissue samples. It was found that mRNA expression was elevated in tumors compared to normal ovarian tissue, with higher presence in high-grade serous ovarian cancer and platinum-resistant tumors.91 The presence of EN2 protein was found in 78% of epithelial ovarian cancer samples via cytoplasmic staining, with no EN2 found in any normal ovarian tissue.91 Interestingly, EN2 levels were also correlated with worse overall survival of patients. While these results are promising and show that EN2 can be used to monitor the development and progression of ovarian cancer, it is unclear if it would be of value as an early diagnostic tool without further validation. Additionally, its association with other cancers in addition to ovarian cancer can possibly lead to reduced specificity in analysis.
Another biomarker that shows promising initial data is heat shock protein 10 (HSP-10), which was found to be present in all ovarian cancer patients studied and not in any of the healthy patient controls.92 However, this initial study was small, analyzing the sera of only ten patients with ovarian cancer and nine patients as controls.92 Additionally, all of the ovarian cancer patients were in stage III of the disease, and it is not yet known if it can be found in the sera of stage I or II patients.
Lysophosphatidic acid (LPA) is a cell signalling lipid that also was identified as a potential biomarker for ovarian cancer. One study showed it to be elevated in 90% of patients with stage I ovarian cancer, something that has not been shown in any of the other biomarkers discussed here.93 LPA is also elevated in benign tumors, but the difference between benign tumor concentration and ovarian cancer concentration was found to be statistically significant.93,94 These studies also found LPA concentrations to increase with disease progression, meaning it could be used to monitor the progression of ovarian cancer in addition to detecting its presence.93,94 Another study, however, found no significant elevation in plasma LPA between ovarian cancer patients and healthy patients.95 It is important to note that this study used a different methodology that may have contributed to the very different results. Overall, the data is very promising, but as with all the above biomarkers, further clinical study needs to be done to validate the use of LPA as a biomarker for ovarian cancer.
One biomarker that is being heavily researched is human epididymis protein 4 (HE4), which has been found to be overexpressed in patients with ovarian cancer. It exhibits high specificity and is elevated in approximately two thirds of early and late-stage ovarian cancer patients.96–99 HE4 exhibits a sensitivity in early diagnosis that is four times higher than CA-125 and is present in a third of non-CA-125 producing tumors.96,100 Many studies propose a combination assay for HE4 and CA-125 to diagnose ovarian cancer, but not enough reliable results have been shown so far for it to be used clinically.75
Overall, there has not yet been a single biomarker that has been reliably shown to be sufficiently specific and sensitive for ovarian cancer detection. As such, there have been many efforts to instead use a combination of biomarkers to form multiplexing assays or panels to increase specificity and sensitivity to appropriate levels. For example, one study used a multiple logistic regression model combining the biomarkers CA-125, ApoA-I, transferrin, and TTR to obtain a sensitivity of 89% and a specificity of 97% for the early detection of ovarian cancer.101 While the results are promising, the test combines multiple separate screening methods and as a result is quite expensive.101
Another example of this is the screening panel called OVA-1 which gained FDA approval for the triage of suspicious pelvic masses in 2016; however, it is only approved in combination with an ultrasound.102,103 The OVA-1 panel applies multivariate analysis using the biomarkers CA-125-II, HE4, apolipoprotein A-1, FSH, and transferrin and obtains a selectivity of 91%. The specificity, however, is similar to CA-125 alone at 69%, and therefore the assay has limited use for diagnosis.103
An immunoassay published by Visintin et al. in 2008 was shown to have both high sensitivity at 95% and high specificity at 99% and was able to identify 90% of stage I cancer patients, but unfortunately is not currently being used for screening.104 Similarly, a screening panel proposed in 2005 by Kozak et al. also produced high sensitivity and specificity of 86% but no screening platform has been developed from this work.105
Recently, there has been growing interest in the use of various miRNAs for early detection of ovarian cancer since the deregulation of miRNA expression has been shown to be associated with malignant development of OC.106 There is a growing body of work which demonstrates the usefulness of multiple miRNAs, but one study that stands out is from Yokoi et al. who were able to discriminate ovarian cancer patients from healthy controls using eight circulating serum miRNAs with a sensitivity of 92% and a specificity of 91%.107,108 They were also able to develop a second predictive algorithm based on seven miRNAs that was able to differentiate early-stage ovarian cancer from benign tumors. However, it had a lower sensitivity and specificity of 86.1% and 83.3%, respectively.107,108
Cervical cancer
New screening or triage methods can be developed to detect biomarkers of HPV infection and/or early-stage cervical cancer. As less than 8% of HPV infections lead to precancer, an ideal cervical cancer biomarker would indicate precancer progression before development into invasive carcinoma.29 Current biomarker detection involves HPV DNA testing to identify HPV infection and therefore the possible presence of precancer or cancer.29,36 This review presents select proteins, nucleic acids, and methylated DNA biomarkers related to cervical cancer and HPV infections (Table 2).| Biomarkers | Cut-off | SE | SP | Ref. |
|---|---|---|---|---|
| B7-H6 | — | — | — | 109 |
| Osteopontin | ∼500 ng mL−1 | 82% | 100% | 110 |
| p16 | — | 97% | 91% | 111 |
| TOP2A | — | 78% | 93% | 111 |
| HPV E6 oncoprotein | — | — | — | 29, 112 |
| HPV E7 oncoprotein | — | — | — | 29, 112 |
| p53 | — | — | — | 29, 112 |
| pRB | — | — | — | 29, 112 |
| SLeA and TAPs | 0.97 AUC | 91% | 97% | 113 |
| circRNA-000284 | — | — | — | 115 |
| miRNA-21-5p | — | — | — | 117, 119 |
| miRNA-34a | — | — | — | 117, 119 |
| miRNA-9 | — | — | — | 117 |
| miRNA-27b | — | — | — | 117 |
| miRNA-205 | 0.72 AUC | 77% | 73% | 120 |
| miRNA-29a, 25, 486-5p, squamous cell carcinoma antigen (SCC Ag) | >0.70 AUC | 89% | 93% | 32 |
| 80% | 97% | |||
| miRNA-7, 99, 378, 17-92 families | — | — | — | 123 |
| miRNA-21 | — | — | — | 124 |
| miRNA-146a | — | — | — | 124 |
| SOX14 hyper-methylation | 0.94 AUC | 94% | 87% | 125 |
| CA-125 | 0.67 AUC | 74% | 58% | 126 |
| hs-CRP | 0.66 AUC | 65% | 63% | 126 |
| SCC-Ag | 0.75 AUC | 74% | 65% | 126 |
HPV infection and/or cervical cancer can influence protein expression, producing viable protein-based biomarkers for early diagnosis.29 The recently studied B7 homolog 6 (B7-H6) protein is a tumour biomarker that is upregulated in cervical precancer and cancer, where the biomarker's expression correlates with disease progression. B7-H6's stage-dependent expression suggests its possible utility for predicting prognosis.109
Other protein biomarkers include osteopontin (OPN),110 protein cyclin-dependent kinase inhibitor (p16), and topoisomerase II-alpha (TOP2A).111 OPN was observed to be upregulated in cervical cancer,110 while p16 and TOP2A overexpression were related to precancer and cancer.111 However, OPN could only discriminate between healthy controls and advanced cervical cancer, suggesting OPN is effective as a late-stage biomarker for cervical cancer. Although TOP2A expression was upregulated, it was not stage-dependent; p16's stage-dependent expression suggests it could be used as a prognostic biomarker.111
While HPV testing has become a significant screening technique, it does not effectively predict prognosis since over 90% of HPV infections are cleared by the immune system.36 In this case, ideal biomarkers would predict the likelihood of an HPV infection to transform into invasive carcinoma.36 As an HPV infection involves viral DNA integration into the host genome, the production of HPV oncoproteins affects the expression of some host proteins.29,36 For example, the tumour suppressors p53 and pRB are targeted by HPV E6 and E7 oncoproteins, respectively, interfering with biological mechanisms and promoting carcinogenesis.29,112 In a study by Jin et al., the regulation pattern of tumour-associated proteins (TAPs) and HPV proteins could discriminate between cervical precancer/cancer and healthy controls; significantly, a 91.3% sensitivity and 96.7% specificity were achieved by detecting both Sialyl Lewis A (SLeA) and p53 TAPs. SLeA's decrease in expression correlated with disease stage, suggesting it could serve as a marker for predicting prognosis.113
RNAs, specifically circular RNAs (circRNA), long non-coding RNAs (lncRNAs), and microRNAs (miRNAs), are potential cervical cancer biomarkers as their dysregulated expression influences cervical cancer progression. Aberrant expression of circRNAs and lncRNAs can behave as miRNA sponges, where they selectively bind miRNAs and alter signaling pathways.29,114 For example, Ma et al. observed that over 500 circRNAs were expressed differently in cervical cancer cells, while circRNA-000284 was significantly upregulated, promoting proliferation and invasion of the disease.115
The relationship between miRNAs, HPV infection, and cervical cancer progression has been reported, making miRNAs potential suitable biomarkers for early diagnosis.116–118 Early-stage cervical cancer or HPV infection can influence miRNA expression,29 for example, miR-21-5p upregulation and miR-34a downregulation correlate with the progression of precancer to invasive carcinoma. The stage-dependent regulation of these biomarkers indicates possible utility for predicting prognosis.119 However, a study by Liu et al. showed the opposite regulation pattern for miR-34a, where miR-34a expression was upregulated in HPV-infected cervical cancer. The opposing results in these studies suggest that miRNAs have a complex relationship with cervical cancer development, requiring further research to determine potential biomarkers for early diagnosis.117
The same study by Liu et al. showed different expression levels of miRNA biomarkers depending on HPV strain type. For example, miRNA-34a upregulation was statistically significant in HPV16, while it was not significant in HPV52 and HPV58. For miR-21-5p, only HPV16 showed upregulation. Upregulation of miR-9 occurred in HPV16, while miR-9 was downregulated in HPV58. In HPV16 and HPV52, miR-27b was upregulated, which was opposite in HPV58.117 These differences in miRNA expression by subtype suggest that miRNA biomarkers for early-stage cervical precancer or cancer detection may be useful as a triage test combined with HPV genotyping. However, further research is needed to confirm the relationship between miRNA expression and strain type.
An interesting miRNA biomarker was reported by Ma et al., where upregulated miRNA-205 in serum correlated with cervical cancer progression. The upregulation was independent of HPV infection and could also distinguish patients with or without lymph-node metastasis.120 Zhang et al. reported miRNA-205's mechanism of action in cervical cancer cells and observed that miRNA-205 downregulation inhibited cervical cancer progression.121
A significant challenge with miRNA detection is poor reliability. As multiple biomarker analysis may improve sensitivity and specificity,29,32 Du et al. studied a biomarker panel for measuring serum proteins and miRNAs in early-stage cervical cancer screening. They analyzed serum samples for eight miRNAs (miRNA-20a, 205, 218, 21, 29a, 200a, 25, and 486-5p) and three proteins [squamous cell carcinoma antigen (SCC Ag), carbohydrate antigen 19-9 (CA19-9), and carcinoembryonic antigen (CEA)] from stage I and II cervical cancer patients. In their first study, the panel of miRNA-29a, miRNA-25, miRNA-486-5p, and SCC Ag achieved an 88.6% sensitivity and 92.9% specificity, while their second study showed an 80.0% sensitivity and 96.7% specificity. As the levels of CA19-9 and CEA in cervical cancer and healthy control samples were not significantly different, these two proteins cannot serve as early-stage cervical precancer or cancer biomarkers.32
Exosomes are potential sources of biomarkers as studies have reported that secreted exosomal contents can be linked with disease.122 For example, HPV infection can change the expression of several exosomal miRNAs (miRNA-7, 99, 378, and miRNA 17-92 families).123 Another study showed that HPV-positive and HPV-negative patients could be distinguished by different levels of miRNAs in exosomes, where miRNA-21 and miRNA-146a were upregulated in HPV-positive cases.124
As tumour development has been linked with abnormal DNA methylation, detecting methylated DNA might allow for early diagnosis.29,125 Recently, a study reported hypermethylation of SOX14, a gene that regulates cell cycle, differentiation, and development. SOX14 hypermethylation was significantly higher in cervical precancer and cancer samples compared to healthy controls, with a sensitivity and specificity of 94.12% and 86.46%, respectively.125
Biomarkers for determining the possibility of cervical cancer recurrence were reported by Guo et al., where carcinoembryonic antigen 125 (CA-125), C-reactive protein (hs-CRP), and SCC-Ag were upregulated in patients with recurrent cervical cancer. Detecting such biomarkers has the potential for monitoring disease post-treatment, providing an opportunity to detect early recurrence when survival rate is higher.126
Uterine cancer
In the case of uterine and endometrial cancers, there have been several biomarkers identified (Table 3). As with other gynecological cancers, CA-125 has been found to be elevated in uterine and endometrial cancers, though at a reasonable specificity of 90% while the sensitivity of this marker is only 30%.127 This same work also analyzed HE4 as a marker for these cancers and found that it had a slightly higher sensitivity of 48%. Earlier research into uterine cancer biomarkers identified interleukins IL-8 and IL-10, as well as angiogenic factors TNFα, TNFβ, TGFβ, and angiogenin as prospective biomarkers for these cancers.128 Sensitivities and specificities were not evaluated in this work, but these markers were found to be significantly elevated compared to the control population in all stages of endometrial cancer.| Biomarker | Cut-off | OR | SE | SP | Ref. |
|---|---|---|---|---|---|
| CA-125 | 30% | 90% | 127 | ||
| HE4 | 48% | 90% | 127 | ||
| Interleukin-8 | 80 pg mL−1 | 128 | |||
| Interleukin-10 | 20 pg mL−1 | 128 | |||
| TNFα | 15 pg mL−1 | 128 | |||
| TNFβ | 150 pg mL−1 | 128 | |||
| TGFβ | 80 pg mL−1 | 128 | |||
| Angiogenin | 170 pg mL−1 | 128 | |||
| Leptin | 35 ng mL−1 | 3.29 | 130 | ||
| 4.7 ng mL−1 | 131 | ||||
| SERPINE1 | 14.5 ng mL−1 | 2.43 | 132, 133 | ||
| VEGFA | 95 ng mL−1 | 2.56 | 132, 134 | ||
| VEGFB | 90 ng mL−1 | 134 | |||
| Insulin | 90 pmol | 135 | |||
| C-peptide | 0.8 nmol L−1 | 135 | |||
| Androstenedione | 70 ng dL−1 | 2.36 | 136, 137 |
Another promising biomarker for uterine and endometrial cancers is leptin, which is overexpressed in endometrial cancers and is related to disease progression and malignancy.129,130 This overexpression of leptin in relation to endometrial cancer holds true even after accounting for confounding factors.131 Another study identified the inflammatory marker SERPINE1 as being highly correlated with endometrial cancer.132,133 VEGFA was also identified as a potential biomarker for uterine cancer,132,134 along with VEGFB.134 Additionally, high fasting levels of insulin and C-peptide were found to be correlated to endometrial cancer.135 These studies and findings show that the risk of endometrial cancer was highly increased by obesity, and biomarkers related to obesity can be used to help screen for this illness.
Additionally, elevated levels of endogenous steroids including androstenedione is associated with a highly increased risk of endometrial cancer and provides a promising biomarker for the illness.136,137 As this steroid can be aromatized to estrogens, it is likely that it influences endometrial cancer through estrogen metabolism.
Endometriosis
For endometriosis, several efforts have been made to identify prospective biomarkers for the condition (Table 4). This includes one study evaluating nine different potential markers for endometriosis, with only the markers CA-125, STX-5, and LN-1 showing significant relation to the condition.138 Unfortunately, none of these biomarkers are able to accurately screen for the illness at all stages, with CA-125 limited to stages III and IV, STX-5 unable to detect stage III, and LN-1 limited to stages II and IV. Due to the low sensitivity and specificity of CA-125 for endometriosis, it is not recommended as a biomarker for the condition.64 CA19-9 has also been identified as a potential marker for endometriosis, but it was found to have even lower sensitivity compared to CA-125 which is already not recommended for endometriosis diagnosis.139,140| Biomarker | Cut-off | SE | SP | Ref. |
|---|---|---|---|---|
| CA-125 | 22.6 U mL−1 | 72% | 92% | 138 |
| STX-5 | 55 ng mL−1 | 78% | 70% | 138 |
| LN-1 | <1110 pg mL−1 | 72% | 78% | 138 |
| CA19-9 | 35 IU ml−1 | 48% | 92% | 139, 140 |
| MMIF | 1 μg L−1 | 141 | ||
| HIF-1α | 5 pg L−1 | 141 | ||
| VEGF | 8 pg L−1 | 141 | ||
| IL-6 | 41 ng mL−1 | 94% | 80% | 142 |
| Glycodelin A | 121 ng mL−1 | 90% | 90% | 142 |
| A1BG | 90% | 80% | 143 | |
| IGKC | 80% | 90% | 143 | |
| HP | 85% | 85% | 143 |
Another study looked at levels of MMIF, HIF-1α, and VEGF and their relation to endometriosis, and found that these markers were elevated in women with the condition.141 These markers were elevated across all stages of the condition and increased in concentration as the severity of the illness increased. Additional potential biomarkers for endometriosis include IL-6 and glycodelin A, which present with reasonably high sensitivity and specificity for the illness.142 Additionally, the markers A1BG, IGKC, and HP have been found to be elevated in later stages of endometriosis.143 These markers are somewhat limited but could prove useful in the diagnosis of endometriosis.
Efforts have been made to combine CA-125 with these and other biomarkers to improve sensitivity and specificity, including combination with IL-6 and IL-8,144 CCR1 mRNA and MCP1,145 and annexin V, VEGF, glycodelin, and sICAM-1.146 These studies show limited improvements in sensitivity and specificity over CA-125 screening, but show that multi-panel assays of potential biomarkers have the ability to improve our screening of endometriosis.
Another potential method for screening endometriosis is by use of microRNA (miRNA). A recent study has found that the miRNAs miR-125b, miR-150-5p, miR-342-3p, and miR-451a are elevated in women with endometriosis, while miR-3613-5p and let-7b are depressed.147 This panel of six miRNAs could be used in the screening and diagnosis of endometriosis.
Gynaecological infections
As infections may be caused by a variety of microorganisms, finding biomarkers for infection greatly depends on which organism is causing the condition. For serious bacterial infections, sepsis may result, which can be screened for with the biomarker procalcitonin.148,149 As this marker is only present after patients present with sepsis, it is only useful in diagnosing severe infection. An earlier series of potential markers for bacterial vaginosis are biogenic amines.150 These compounds are released during bacterial infections of the vagina and are responsible for the malodour that can occur. They can screen for bacterial vaginosis with 83% sensitivity and 92% specificity, making them a potentially useful early marker for these infections.Another potential biomarker for STIs as well as bacterial vaginosis is interleukin-1β (Il-1β).151,152 This marker was found to provide 77% sensitivity and 72% specificity for gynecological infections versus healthy controls. Though somewhat low in these regards, this marker could potentially be useful in screening for infections.
Although not specifically a biomarker found in serum and blood, the bacterial species Methanobrevibacter smithii is found exclusively in patients with bacterial vaginosis and could be used as a biomarker for the condition.153 Using antibody capture or culture analysis for this bacterium could improve screening and detection for patients with bacterial vaginosis.
For chlamydia, a potential microRNA marker has been identified, which is miR-193b-5p.154 This microRNA was found to be upregulated in the sera exclusively in C. trachomatis infected patients compared to healthy controls, making it a potential serum-based biomarker for this infection.
An interesting marker for syphilis infection could be the analysis of platelets.155 Patients suffering from syphilis were found to have significantly decreased mean platelet volumes, and platelet distribution widths. Platelet analysis for these two variables could allow for relatively simple screening for syphilis in patients. Additionally, for sera-based markers, miR-223-3 has been identified for syphilis.156 This microRNA was found to be significantly upregulated in all syphilis patients compared to healthy controls regardless of disease stage, with a 91% sensitivity and 83% specificity.
Looking at candida-based yeast infections, a handful of biomarkers have been identified including Candida albicans germ tube antibody (CAGTA), Platelia Candida mannan antigens (MN), antimannan antibodies (AMN), and (1→3)-β-D-glucan (BDG).157 Although these markers individually have low sensitivities and specificities for yeast infections, they can be paired together to increase both. The pairing of CAGTA and BDG had a sensitivity of 97% and specificity of 84%, while the pairing of CAGTA and MN had a sensitivity of 94% and specificity of 86%. Detection of these markers together could prove useful in screening for these yeast infections.
Sensors
Ovarian cancer
Given the poor prognosis with advanced disease, the high 5-year survival at stage 1, and the issues associated with the CA-125 assay evaluated above, it is unsurprising that possible early-stage detection by sensor has attracted considerable attention. This is further complicated by the fact that the most common type of ovarian cancer (high-grade serous) is seldom identifiable as an early stage at all. Its origin in the fallopian tube with microscopic spread into the peritoneal means that prevention will continue to play a critical role in ensuring that women do not present with advanced disease. Assays of OC biomarkers, reviewed above, involve the direct conversion of the presence (and concentration) of a marker into a device-generated electrical signal. Given the variety of biomarkers, it is necessary to use selective probes for these that can be attached to the surface of a chosen device. Obviously, such a device will need to display a high level of sensitivity since the concentration of a specific marker in biological fluid is expected to be very low. Additionally, it will clearly be necessary to operate the sensor in, at least, serum, if not whole blood. The following details these efforts in an approximate chronological order, rather than by device type or nature of biomarker employed (Table 5).| Biomarker | Sensor type | LOD | DR | Ref. |
|---|---|---|---|---|
| HE4 | SPR | 4 pM | 10–10000 pM |
158 |
| HE4 + CA125 | EIS | 159 | ||
| Antiapoptotic B-cell | MEMS | 0.5–12 ng mL−1 | 160 | |
| HE4 | FET | 162 | ||
| HSP10 | EMPAS | 163 | ||
| CA-125 | Electro-chemiluminescence | 0.4 mU mL−1 | 0.001–5 U mL−1 | 165 |
| CA-125 | SPR | 166 | ||
| CA-125 | Immunochemical sandwich assay | 30 U mL−1 | 167 | |
| CA-125 | EIS | 0.9 pg μL−1 | 0.9 pg μL−1–15.2 ng μL−1 | 168 |
| CA-125 | Fluorescence | 10 pg mL−1 | 169 | |
| CA-125 | Capacitance | 170 | ||
| CA-125 | DPV | 0.001 U mL−1 | 0.001–400 U mL−1 | 171 |
| CA-125 | Electrochemical | 6 μU mL−1 | 0.0005–75 U mL−1 | 172 |
| CA-125 | SPRI | 173 | ||
| CA-125 | SPR | 174 | ||
| HE4 | Photoluminescence | 175 | ||
| LPA | Fluorescence | 5 μM | 176 |
The biomarker HE4 figured prominently among the earlier sensors for OC detection. For example, Yuan et al.158 employed a silver-nanoparticle based chip for assay by localized surface plasmon resonance (LSPR). Device surface attached antibody for HE4 was incubated with different concentrations of the marker in buffer solution (Fig. 1).
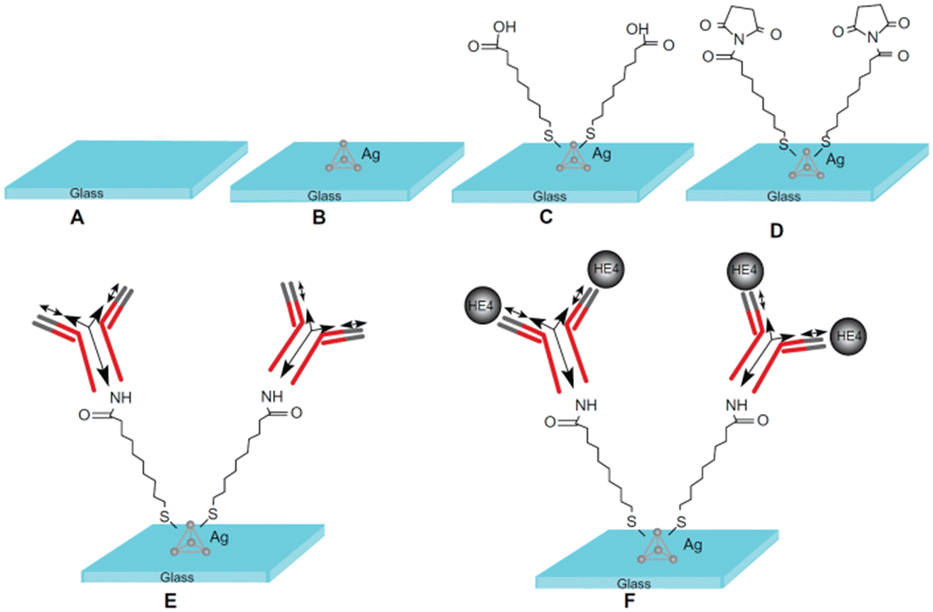 | ||
| Fig. 1 Design of the localized surface plasmon resonance biosensor for HE4 detection using a direct assay format. (A) Glass substrate, (B) silver nanoparticles synthesized through NSL technology, (C) a self-assembled monolayer layer formed by incubation in 1 mM 11-mercaptoundecanoic acid, (D) incubation in 75 mM 1-ethyl-3-(3-dimethylaminopropyl)carbodiimide hydrochloride/15 mM N-hydroxysuccinimide, (E) anti-HE4 antibody (10 μg mL−1) covalently attached to the nanoparticles, and (F) different concentrations of the HE4 both in buffer and serum samples reacted with the anti-HE4 (reproduced from ref. 158 ‘International Journal of Nanomedicine’ 2014, 9, 1097–1104. Originally published by and used with permission from Dove Medical Press Ltd.). | ||
The peak wavelength of the LSPR extinction spectrum was measured and recorded for each experiment using a spectroscope with a charge-coupled device detector. Following incubation in 500 pM HE4, the LSPR wavelength shifted to +14.48 nm. The limit of detection (LOD) for the method was assessed to 4 pM HE4. The negative spectre of non-specific adsorption, a ubiquitous issue with biosensor technology, was evident for experiments conducted in serum.
HE4 (and CA-125) was also the subject of a study of detection by electrochemical impedance spectroscopy (EIS).159 In this case, a device with micron-scale interdigitate electrodes (IDEs) in an SD card format was used with the probe for HE4 being a protein–enzyme conjugated label. Again, detection in serum was not evident. Another example of the use of a microelectronic device is the work on an ultrasonic MEMS-based biosensor of the detection of urinary antiapoptotic protein B-cell (Be3l-2).160 In this study, use was made of a horizontal (SH) surface acoustic wave device with the ST cut-quartz surface being modified with antibodies for the marker (such devices have been employed widely in biosensor applications161). Notably, it was claimed that the sensor's surface chemistry was capable of avoiding fouling by the components of urine. A further example of detection by microelectronic structure was the work of Sajjad et al.,162 who described an FET device for detection of HE4, although curiously, there was no mention of a probe for the marker or, indeed, assay in serum.
The first biosensor study of the marker HSP10 was conducted using the electromagnetic piezoelectric acoustic wave (EMPAS) device.163 This sensor involves the instigation of acoustic waves in a quartz substrate via the secondary electric field developed by a radio frequency-excited flat spiral coil.164 The main focus of this investigation was to examine the interactive chemistry for the hexa-histidine-tagged protein attached to the device (quartz) via NTA – chemistry with a selective aptamer produced by conventional SELEX protocols, 5′-AACTGGTGCGGGGTGGTGGGGGATGGATGTTGCTTG AGGGGTC-3′. Experiments conducted at 940 MHz frequency did reveal a response for protein–nucleic acid binding, which was attributed to a rigidification of the complex on the quartz surface. There was no attempt to perform the reverse experiment, i.e., aptamer on the device surface, or research responses in biological fluid.
Given the ubiquitous use of clinical assay for OC involving CA-125, it is not surprising that a major effort has been directed towards detection of the antigen by biosensor over a number of years. This is despite the disadvantages evident with this biomarker for OC as discussed above. Selected examples follow, where electrochemical techniques appear to dominate the field. An electrochemiluminescence sensor was developed for CA-125 by Wu et al.165 based on antibody acting as a probe on functionalized graphitic carbon nitride (g-C3N4). The nitride was combined with amino-modified Fe3O4 nanoparticles imposed on a screen-printed carbon electrode (Fig. 2).
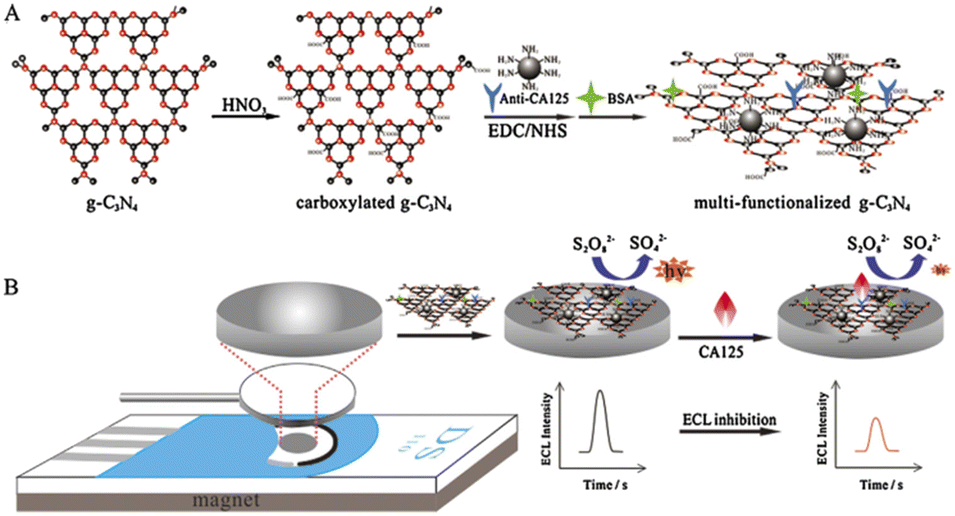 | ||
| Fig. 2 Schematic diagram of (A) preparation procedure of multi-functionalized g-C3N4, and (B) the fabrication of proposed immunosensor using multi-functionalized g-C3N4 (reproduced from ref. 165 with permission of Elsevier, Amsterdam, The Netherlands, copyright 2016). | ||
The system is disposable and was said to exhibit a wide dynamic linear detection range for the antigen (0.001–5 U mL−1), with a lower detection limit of 0.4 mU mL−1, thus providing high sensitivity. As is often the case with the development of devices for CA-125, and indeed as for other markers, there was no attempt to produce assays in clinical samples. As distinct from antibodies as a probe for the antigen, Lamberti et al.166 were able to generate RNA aptamers for this purpose. To achieve high affinity aptamers for the antigen, the authors used a human CA-125 recombinant protein as a target, with a C-terminal His tag in a SELEX-based protocol. Binding characterization with regard to CA-125 was achieved using both real-time-qPCR and surface plasmon resonance biosensor. The latter involved an NTA-based “biochip” whereby this moiety on the device surface is modified by Ni2+ which then functions as a capturing agent for His tag flowed by CA-125 at 80 nM concentration. The capability for the sensor surface configuration to bind the RNA aptamer was then assessed including an investigation of the kinetics of the process. As for the HSP10 study outlined above, this work represented more of an examination of potential probes than development of a practical system. Interestingly, the comment was made that future use of the chemistry in a clinical setting would need to have the interference issue posed by biological fluid to be solved. The authors are correct in this view.
Assay of CA-125 culminating with the generation of a final signal on a so-called “smart-phone” employed a conventional immunochemical sandwich protocol.167 Antibody for the antigen was place on a nitrocellulose membrane, followed by incubation with various concentrations of CA-125 solution, and then finally a secondary antibody labelled with Au nanoparticles. In addition, an Ag enhance was used to produce combined metal nanoparticles yielding grey colour spots. The pixel intensity of the captured device was determined by image acquisition and data processing. The limit of detection was found to be 30 U mL−1 and measurements could be made in serum spiked with the antigen. In this study, aside from the remark that the system could be easy to use in certain cases, it was not entirely clear why a phone would be used and why it is “smart”.
Electrochemical impedance spectroscopy (EIS) with a graphene-based sensor has been employed in order to detect the antigen.168 In this case, the focus was towards early-stage assay, despite the reality that there may be doubts concerning the efficacy of CA-125 as a marker at this point in disease development (see above). The device was fabricated by first electropolymerizing a polyaniline layer on a graphene screen printed electrode. Antibody to the antigen was then attached to the sensor surface via cross-linking, with each stage of the surface modification process being confirmed by Raman spectroscopy. The limit of detection was 0.923 pg μL−1 with a dynamic range of 0.92 pg μL−1–15.21 ng μL−1, resulting in the claim that the work represented the most sensitive detection of the antigen at that time.
A fluorescence-based assay of the antigen has been developed where a combined aptamer/CA-125 antibody configuration was the probe on a 3-dimensional network of carbon nanotubes.169 The ssDNA aptamer employed in the work was produced by the conventional SELEX protocol. The limit of detection was in the region of 10 pg mL−1 and it was pointed out the technology represents a significant enhancement over existing ELISA methods for CA-125 assay. However, although it was recognized that the technique could provide detection in the clinical setting, no such assay was described.
Detection of the antigen has also been demonstrated on gold nanoparticles imposed an interdigitated electrodes, which was incorporated into a microfluidic set up.170 The surface chemistry to attach antibodies to CA-125 on the gold electrode involved a standard self-assembled monolayer of thiourea followed by antibody-functionalized nanoparticles (Fig. 3). The measured signal was capacitance-based in the frequency range 10–100 kHz with 10 kHz steps.
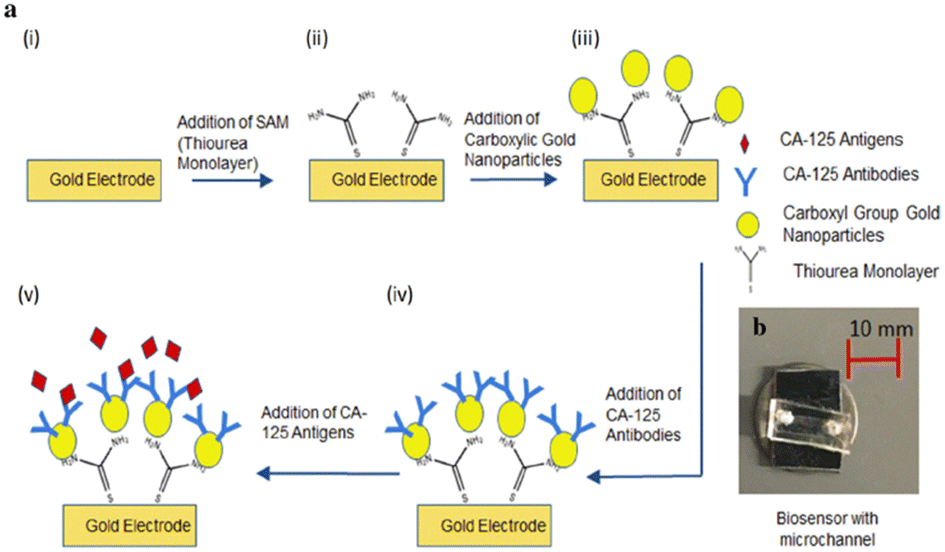 | ||
| Fig. 3 a: Schematic representation at various stages of biosensor fabrication: (i) bare electrodes, (ii) SAM layer on the bare electrodes, (iii) immobilized gold nanoparticles on the SAM layer, (iv) antibody immobilization on the electrodes, and (v) antigen–antibody conjugation on the electrodes. b: Real image of the biosensor with microchannel (reproduced from ref. 170 with permission from Springer, NY, USA, copyright 2019). | ||
This measurement was conducted at each step of the aforementioned surface procedures and studies were performed under static and microfluidic flow conditions. Under the former condition, the capacitive signal was increased from 260.8 to 736.3 pF (at 20 kHz) with nanoparticles in place. The increase was less for microfluidic experiments which was attributed to shear effects. Curiously, in this study, there was no apparent attempt to determine the LOD for CA-125, although it was mentioned in passing that the system could be used to assay biomarkers in plasma.
Microfluidic technology has also been used in conjunction with a paper substrate in a so-called nano-ink configuration.171 In this case, antibody was immobilized on the surface of the matrix containing Ag–DPA–GQD (silver nanoparticles deposited on the D-penicillamine-functionalized graphene quantum dots) conductive nano-ink modified CysA–gold nanoparticles, differential pulse voltammetry (DPV) technique. Under optimal conditions, the linear range of 0.001–400 U mL−1 and lower limit of quantification (LLOQ) 0.001 U mL−1 were obtained for assays conducted in human plasma.
Another electrochemical study involving nanoparticles to detect CA-125 was conducted with graphene oxide–multiwall carbon nanotubes imposed on a glassy carbon electrode.172 Polyamidoamine/gold nanoparticles were used to increase the conductivity and enhance the number of antibodies immobilized on the electrode surface. Additionally, antibody and toluidine blue attached to O-succinyl-chitosan-magnetic nanoparticles were employed as a tracer. The device exhibited a wide linear range (0.0005–75 U mL−1) and an excellent limit of detection around 6 μU mL−1. It was unclear in this work if the immunosensor was tested against clinical samples, although the authors claim excellent stability, high selectivity and sensitivity, and good reproducibility.
Optical methods have also been employed to assay the antigen; a couple of more recent examples follow. Surface plasmon resonance imaging (SPRI) has been used to determine circulating CA-125/MU16 (MU = mucin).173 In this investigation, anti-MU16 antibody was attached to the usual SPR gold chip via self-assembled monolayer of cysteamine followed by standard EDS/NHS surface chemistry. An effort was made to assess the selectivity provided by the system by exposing the chip surface to albumin, leptin, interleukin 6, and metalloproteinace-2. None of these species yielded a signal thus confirming the selective properties of the device to the antigen. Unlike many biosensor developments for the antigen, the authors commendably examined response of the device to serum samples of patients suffering from both ovarian cancer and endometrial cysts (it was not clear at which stage of the disease the samples were collected). The concentrations determined by the sensor generally compared favourably with those obtained from conventional chemiluminescence immuno-assay. The argument was made that the overall configuration is much simpler in operation than other methods for assay of the antigen.
A significantly more complex method has been developed involving a sensor fabricated from gold nanoparticles and Schiff base entity doped into a sol/gel matrix.174 This device yields a fluorescence emission at 423 nm when excited by a source of 340 nm. The prepared Schiff base was 2,2′-((1E,1′E)-(1,2-phenylenebisazanylydene)bis(ethane-1-yl-ylidene)-diphenol). The signalling mechanism was based on the quenching of the fluorescence emission of the Au particle/Schiff base arrangement by the antigen. The analytical properties exhibited by the system were thoroughly characterized by electron microscopy, determination of absorption and emission spectra and dynamic linear range and concentration calibration. Although it was unclear in this work how the sensor was capable of selective interaction of the antigen with the sol/gel-based arrangement, it was tested on samples from healthy patients and those suffering from the disease. Again, no indication of the particular stage of the disease for the patients was indicated. Finally, an interesting and useful feature of this article is a compendium of assays for CA-125, which concentrates on the use of nanoparticles.
We now turn to a couple of examples of studies of biosensor detection of other biomarkers, which are far less in number than is the case for CA-125. An optical nano-sensor based on single-walled carbon nanotubes has been developed with is capable of optical measurements, and interestingly, implantable in tissue.175 Such carbon nanotubes yield near infrared (NIR) bandgap photoluminescence between 800 and 16000 nm. For measurements of the marker HE4, an antibody for the marker was attached to a nano-tip by subsequent steps involving ssDNA and conventional EDC/NHS surface chemistry that is used by many. Following an academic characterization of device, it was implanted successfully in animals for photoluminescent assay of HE4.
Finally, in our own research we have examined the potential of the detection of lysophosphatidic acid (LPA).176 It has been shown by standard analytical techniques that this marker is present at all stages of the progression of OC. LPA is quite promising as a screening tool since it is present in the early stages of the disease and it appears to increase incrementally as progression occurs to stage IV. The probe employed for the marker was the protein gelsolin, the interaction displaying a Kd value of 6 nM. To develop a signal, actin labelled with fluorescent dye is bound to the protein which is attached to silica nanoparticles. LPA is then capable of replacing the actin moiety resulting in a fluorescent signal. In these experiments, the surface chemistry involved a deliberate attempt to mitigate fouling by components of biological fluid by specialized silane chemistry. Preliminary results suggest that a limit of detection of 5 μM LPA in serum could be achieved. Such a value approaches that required for early-stage detection of OC.
Additional efforts to improve ovarian cancer screening involve applying artificial intelligence (AI) to evaluate image data for diagnosis and prognosis has increased in recent years.177 Several studies showed that using machine and deep learning models can improve the evaluation of the medical images in OC diagnosis and prognosis.178–181 Shinagare et al.178 used a machine learning algorithm to develop a predictive model for surveillance of high-grade serous ovarian cancer and the abdominal recurrence. They examined the impact of age, size of the primary tumor, clinical stage (stage III or IV), degree of cytoreduction, and CA-125 level with univariate and multivariate analysis on the presence or absence of recurrent disease on CT. Their model showed that the rate of change of CA-125 is more predictive of abdominal recurrence than the actual CA-125 value, and the rate of increase of CA-125 may help to select the OC patients who are most likely to benefit from surveillance CT scans.178 Although studies showed the efficiency of AI models to use the imaging data as an effective predictor for OC diagnosis and prognosis, still this approach is at research level. Future work should focus on clinical trials with larger data to improve the accuracy of the models.
AI modeling has also been used to create various machine and deep learning algorithms to predict the type and different stages of OC using available clinical data such as blood tests, imaging data, patients' family history, and background.182,183 Such AI modeling can provide a logical decision-making framework by identifying variables that predict the OC stage to choose an effective personalized treatment strategy. Kawakami et al.184 showed the capability of machine learning models as a prediction system for epithelial ovarian cancer (EOC) diagnostic and prognostic by using seven different supervised machine learning classifiers to drive diagnostic and prognostic information from 32 parameters of available clinical data including blood tests of patients. Their model showed high accuracy of 94% to distinguish EOC from the benign ovarian tumor. They also found that albumin, lactate dehydrogenase (LDH), lymphocyte, sodium, and fasting blood glucose test (FBG) can be potential biomarkers for EOC.
Omics strategies such as genomics,185,186 proteomics,187,188 metabolomics,189,190 and glycomics191,192 are promising methods to identify novel cancer biomarkers. They can be performed on various biospecimens including cell lines, tissue biopsies, blood, urine, saliva, and cerebrospinal fluid.193,194 The omics strategies can also be used as diagnosis and prognosis methods, but their application is limited to clinical research as they require state-of-the-art instruments, such as mass spectrometry (MS) and nuclear magnetic resonance (NMR), which are expensive, low throughput, and require highly trained technicians. In addition to these challenges, there is still a lack of standard experimental protocols for OC omics methods. These protocols also need inter-laboratory validation and verification to be approved for clinical use.
MS-based proteomics is a powerful technique capable of peptide/protein identification and quantification. The first report on using MS-based proteomics in OC research in 2002 showed the capability of this method to detect OC using serum samples.195 This study analyzed the blood sample of 50 OC patients and 50 healthy women using surface-enhanced laser desorption and ionization time-of-flight (SELDI-TOF) mass spectrometer to generate preliminary “training” data. This data and an iterative searching algorithm were used to find a proteomics pattern distinguishing between OC and non-cancer samples. Then the discovered pattern was used to identify OC in an independent set of serum samples (50 OC and 66 non-cancer). The proteomics pattern successfully identified the 50 OC samples including 18 stage I, and 63 out of 66 non-cancer samples, which indicates a sensitivity of 100%, specificity of 95%, and positive predictive value of 94%.194 Although the positive predictive value of 94% is adequate for high-risk population screening, it is not adequate for the general population as the incidence of OC is low. Since this report, many studies were performed to provide more accurate predictions from the proteomics profile of the MS spectrum. Various algorithms and methods were proposed to overcome challenges in data processing of MS-based proteomics. A hybrid algorithm based on maximum-discrimination and minimum-correlation (MDMC) was proposed to determine relevant features in two SELDI-TOF data sets.196 The authors recognized 14 and 6 MS signals in the two data sets that could be potential OC biomarkers with discrimination accuracy of 99.5%, sensitivity of 99%, and specificity of 100%; and 100% accuracy, 100% sensitivity, and specificity of 100%; respectively.196 However, the corresponding proteins were not identified.
MS-based proteomics has also been applied to study tumor tissues. Gant et al.197 investigated the changes in collagen fiber of high-grade serous ovarian cancer (HGSOC) tissue using the combination of MS proteomics and Second Harmonic Generation (SHG) Microscopy. They identified a total of 233 proteins including those that are only present in HGSOC tissue or healthy tissue, and by applying a linear discriminant (LD) model, they differentiated between HGSOC tissue and healthy tissue.197 Although this study was performed on a limited number of samples, it showed the ability of this approach as a diagnosis and prognosis method.
Compared to proteomics, a few studies used metabolomics for OC diagnosis. The metabolite profile could provide more comprehensive information about the sample compared to the protein profile. However, identifying the metabolites that could be used as biomarkers is more challenging. A comprehensive review by Saorin et al.198 discussed the metabolomics research in OC diagnosis and the challenges that limit the clinical application of metabolomics. Raman199,200 and IR201 spectroscopy could also be applied to identify OC samples. Although these techniques are cost-effective and easy to operate, they are not as sensitive as mass spectrometry. Laser-induced breakdown spectroscopy (LIBS) is a multi-elemental detection technique that can provide an elemental fingerprint of biological samples. Yue et al.202 applied LIBS and machine learning models to identify OC in blood samples. Although they achieved sensitivity and specificity of 71.4% and 86.5%, respectively, their finding demonstrates the ability of LIBS to investigate the elemental homeostasis in health and disease.
Finally, immunoassays are widely used for biomarker detection as diagnosis and prognosis tools. These techniques, which are based on antigen–antibody reactions, are usually simple, fast, and cost-effective, high-throughput with high selectivity and specificity. Developing the multiplex immunoassays makes these techniques ideal tools for diagnosis and prognosis. However, they usually need labeling and provide a limited amount of information. The most common immunoassay is the enzyme-linked immunosorbent assay (ELISA), which is a solid-phase assay that detects the analyte by producing an enzyme-triggered color change that can be measured by a plate reader. Commercial kits apply different strategies to improve the performance of the ELISA such as cost, measurement time, simplicity, sensitivity, and specificity. Using fluorescence or chemiluminescence dyes may enhance the sensitivity and specificity of the immunoassays. Yao et al.203 reported on a dual-signal fluorescence system using quantum dot nanospheres and fluorescent nanoparticles to simultaneously detect human epididymis protein 4 (HE4) and CA-125 in human serum samples (Fig. 4). They achieved a limit of detection of 0.16 ng mL−1 and 9.4 U mL−1 for HE4 and CA-125 respectively. Although the authors assessed the performance of their method by measuring HE4 and CA-125 in the presence of several kinds of biomarkers and proteins, a recent study showed that chemiluminescent immunoassay (CLEIA) may not be suitable for detecting HE4 in serum as it significantly overestimated HE4 values compared to the ELISA.204
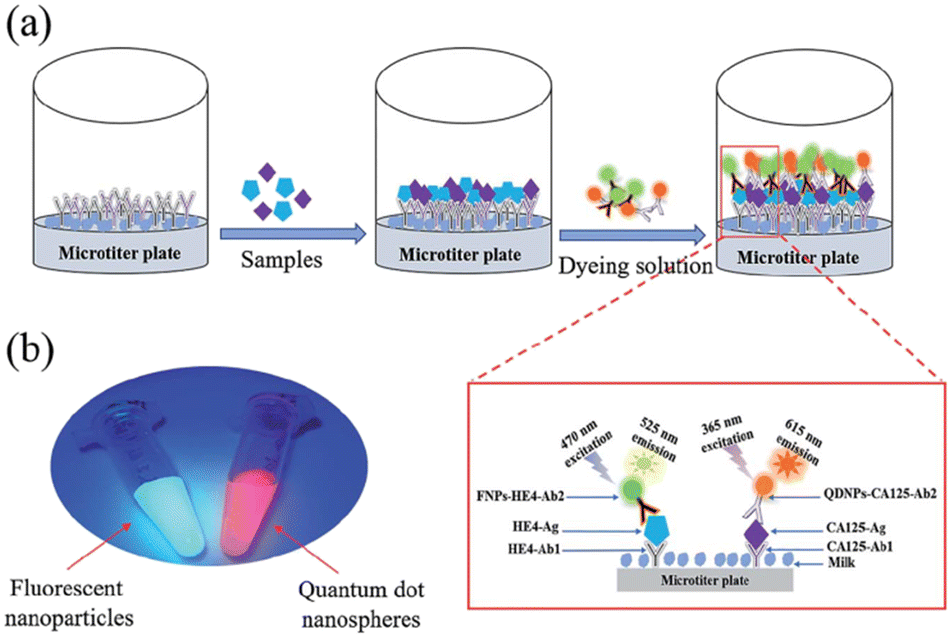 | ||
| Fig. 4 Schematic illustration of the dual-signal system-based immunoassay for HE4 and CA-125 detection. (a) Procedures of the dual-signal system-based immunoassay. (b) Image of the fluorescent nanoparticles and quantum dot nanospheres under excitation of ultraviolet (reprinted from ref. 203 with permission from the Chinese Chemical Society (CCS)), Institute of Chemistry of the Chinese Academy of Sciences ((IC) and the Royal Society of Chemistry, copyright 2019). | ||
A comprehensive study compared the CA-125 and HE4 serum levels of malignant, non-malignant, and healthy samples obtained from CLEIA. The significance of this study is that they collected and compared the data from six highly qualified laboratories that use four different CLEIA devices. They first assessed and corrected the analytical bias in different devices and then interpreted the results collected from 1509 patients. They concluded that at pre-menopausal status, CA-125 and HE4 levels are not accurate for differential diagnosis. In the post-menopausal status, HE4 showed significantly better accuracy than CA-125 for women regardless of their age.205 Electrochemiluminescence immunoassay (ECLIA), which is a clinically approved method for CA-125 detection, has advantages over CLIA as the time of the light-emitting reaction can be controlled to be adjusted with the time of antibody–antigen reactions. The wavelength of the light emission can also be adjusted to improve the selectivity and the sensitivity by increasing the signal-to-noise ratio, measuring multiple reactions either in sequence or simultaneously. Furthermore, sensitivity can be enhanced using various redox cycling amplification strategies.
Multiplex immunoassays that can simultaneously detect and quantify several protein molecules have been used in many OC clinical trials.206 Commercial Luminex multiplex assays, which follow the principle of ELISA, use dye with a precise ratio of red and infrared fluorophores embedded in beads, which produce 100 unique fluorescence spectral signatures. Coupling different beads with highly specific antibodies and pairing them with a biotin-labeled high-affinity secondary antibody enhance the selectivity and specify of the simultaneous measurements of more than 100 proteins.
Cervical cancer
The previously discussed HPV infection and early-stage cervical cancer biomarkers show the significant potential of establishing novel and objective screening, triage, and monitoring methods. Biosensors can provide an ideal diagnostic strategy that conforms to the World Health Organization's ASSURED guidelines for a point-of-care system: affordable, sensitive, specific, user-friendly, rapid, equipment-free, and deliverable.177 Access to an ASSURED system is especially critical in developing countries, where over 62% of cervical cancer deaths occur due to limited or no screening.36 Developing a simple diagnostic device can also provide an option for self-testing29 (Table 6).| Biomarkers | Sensor type | LOD | DR | Ref. |
|---|---|---|---|---|
| VCP | Colorimetric | 25 fg mL−1 | 25–200 fg mL−1 | 209 |
| HPV18 DNA | Electrochemical | 0.405 fM | 0.1 fM–100 pM | 211 |
| HPV16 E7 DNA region | Electrochemical | 10−18 M | 10−18 M to 10−12 M | 212 |
| SCC-Ag | Electrochemical | 10 pM | 1–10 pM | 213 |
| FRα | Electrochemical | 19 U mL−1 CV4 U mL−1 EIS | 102–105 U mL−1 CV50–106 U mL−1 EIS | 214 |
| HPV-E7 protein | SERS | 0.76 pg mL−1 | 1 pg mL−1–1 μg mL−1 | 215 |
| OPN | SERS | 0.62 pg mL−1 | 1 pg mL−1–1 μg mL−1 | 215 |
| B7-H6 | SERS | 10.8 fg mL−1 | 10−10 M to 10−14 M | 207 |
| p16INK4a | QCM | 10 ng mL−1 | 50–1200 ng mL−1 | 216 |
A variety of sensors have been developed to detect and measure HPV DNA, including electrochemical, fluorescent, and colorimetric biosensors. While the majority provide low LOD, electrochemical and colorimetric biosensors are more promising for simple and rapid detection; most fluorescent biosensors require time and technical expertise to prepare the sample's low analyte concentration for analysis.29 Other biosensors for early diagnosis include temperature-based, vibrational spectroscopy-based, field effect transistor (FET) based, mechanical, polymerase chain reaction (PCR), magnetic, aptameric, and piezoelectric systems.29,208
A magnetic focus lateral flow biosensor has been studied to detect valosin-containing proteins (VCP). Magnetic gold nanoparticles (AuNPs) were functionalized with antibodies that bind VCP. To concentrate the nanoparticles and improve the colorimetric signal upon biomarker binding, a magnet is placed below the lateral flow system. The biosensor achieved an LOD of 25 fg mL−1 and allowed for quantifying in the range of 25–200 fg mL−1.209
HPV16 and HPV18 cause about 70% of cervical precancer and cancer, particularly invasive carcinoma.208,210 Pareek et al. developed an electrochemical genosensor using an oligonucleotide as the probe for detecting HPV18 DNA. The genosensor showed an excellent LOD of 0.405 fM and a broad linear range of 0.1 fM to 100 pM. However, the samples were not tested in a liquid biopsy but involved extraction of HPV DNA from endocervical samples, which is a more invasive approach compared to collecting blood samples.211
Other genosensors for detecting HPV DNA have been extensively studied, with the majority having low LODs.208 Significantly, an electrochemical biosensor for detecting the HPV16 E7 region achieved an ultrasensitive LOD of 1 attomole L−1, with a linear range of 10−18–10−12 M. The sensor involved single-wall carbon nanotube (SWCNT) arrays that were coated by gold nanoparticles to produce SWCNTs/Au electrodes, where ssDNA HPV probes were functionalized on the electrode's surface.212
Wang et al.213 demonstrated a strontium oxide-modified interdigitated electrode surface sensor that was modified with an antibody probe to detect SCC-Ag. The sensor achieved an LOD of 10 pM and a sensitivity range of 1–10 pM. However, this system has yet to be tested in blood or serum.
An electrochemical biosensor was reported by Correia et al.214 for discriminating between cervical cancer and healthy cells. Indium tin oxide electrodes were modified by polyallylamine hydrochloride and folic acid layers to detect folate receptors alpha (FRα) that are more expressed in tumour cells. Cyclic voltammetry and electrochemical impedance spectroscopy achieved respective LODs of 19 cells mL−1 and 4 cells mL−1 for cancerous cells, while no signal was detected for healthy controls.
Recently, a surface-enhanced Raman spectroscopy (SERS) sensor was reported by Lu et al. as an assay for HPV-E7 and OPN215 (Fig. 5). The sensor provided an ultralow LOD of 0.76 pg mL−1 and 0.62 pg mL−1 for HPV-E7 protein and OPN, respectively, and a wide linear range of 1 pg mL−1 to 1 μg mL−1 in serum. In a cohort study of healthy controls (n = 30) and cervical cancer samples (n = 30), the SERS sensor could distinguish cervical cancer from healthy samples.
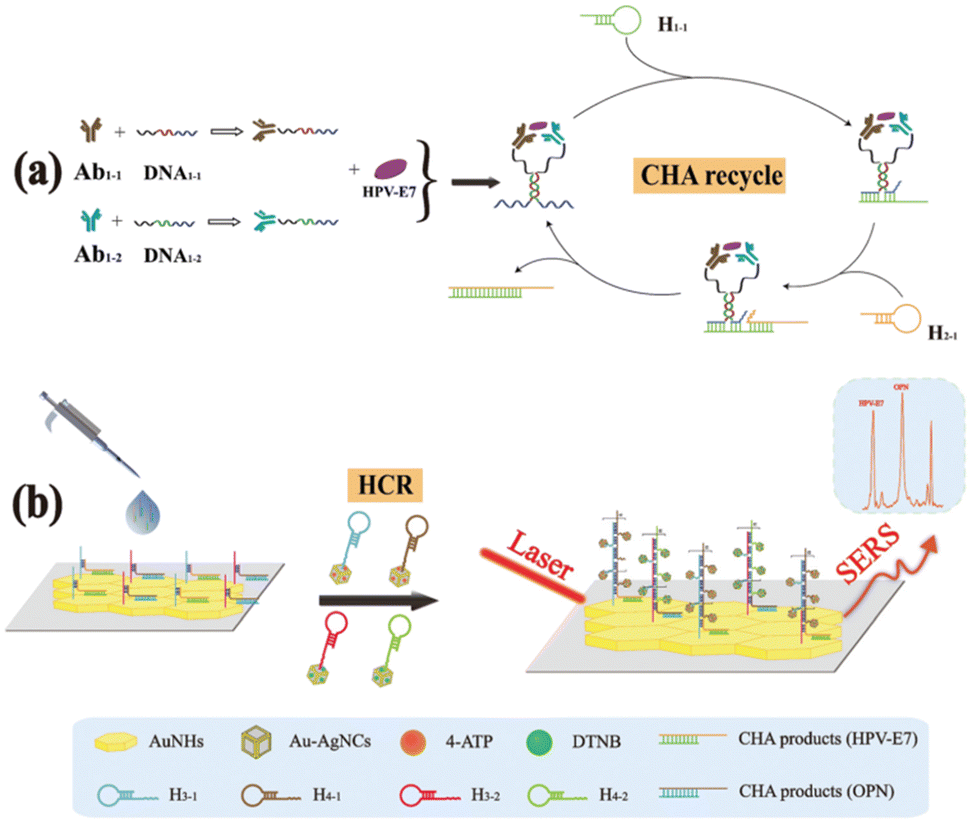 | ||
| Fig. 5 Schematic illustration of the SERS assay of HPV-E7 and OPN via CHA-HCR (reprinted from ref. 215 with permission from the Chinese Chemical Society (CCS)), Institute of Chemistry of the Chinese Academy of Sciences ((IC) and the Royal Society of Chemistry, copyright 2022). | ||
Panikar et al.207 developed a SERS immunosensor for detecting the B7-H6 tumour biomarker with NKp30 receptor protein as the probe on AuNPs. The sensor involved a zwitterionic L-cysteine self-assembled monolayer for antifouling, which likely facilitated the excellent LOD of 10.8 fg mL−1 and sensitivity range of 10−10 M to 10−14 M in undiluted serum. Compared to the commercially available enzyme-linked immunosorbent assay (ELISA) for detecting B7-H6, the SERS biosensor's LOD was 100-fold lower. The sensor was relatively resistant to variations in pH from 5 to 9 due to ATP functionalization on the AuNPs, ensuring sensor stability in complex samples.
To detect cyclin-dependent kinase inhibitor protein p16INK4a in LBC samples, Yang et al.216 used a quartz crystal microbalance (QCM) immunosensor. The piezoelectric crystal was functionalized with mouse polyclonal antibody as a probe to specifically target p16INK4a. The antigen–antibody binding caused a frequency shift by altering the crystal's mass, while frequency changes linearly correlated with the concentration of p16 INK4a. The sensor achieved an LOD of 10 ng mL−1 and a linear range of 50–1200 ng mL−1. Notably, p16 INK4a was stage-dependent since its expression increased during cervical precancer to cancer progression. The authors claim their QCM immunosensor is sensitive, specific, and is reproducible as it can be reused up to six times.
Uterine cancer
Some sensors have been developed for biomarkers related to uterine and endometrial cancer. In previous sections, sensors for CA-125 have been discussed in depth, so will not be discussed here. This section will focus on sensors that were evaluated in either real or simulated biological samples, and leaves out any sensors that were only evaluated in buffered samples (Table 7).| Biomarker | Sensor type | LOD | DR | Ref. |
|---|---|---|---|---|
| IL-8 | Electrochemical impedance | 90 fg mL−1 | 900 fg mL−1–900 ng mL−1 | 217 |
| IL-10 | SPR | 1 pg mL−1 | 1 pg mL−1–1 μg mL−1 | 218 |
| TNFα | SPR | 54.4 pg mL−1 | 219 | |
| VEGF | Chemiluminescence | 1 nM | 221 | |
| Fluorescence | 1 pM | 222 | ||
| Angiogenin | Square wave voltammetry | 1 pM | 0.01–30 nM | 223 |
| Leptin | Electrochemical | 0.008 pg mL−1 | 0.2–20 pg mL−1 | 225 |
| Electrochemical | 0.03 ng mL−1 | 0.1–20 ng mL−1 | 226 |
An electrochemical impedance sensor has been developed for IL-8, which used a synthetic probe on a cystatin scaffold for detection.217 This sensor was assessed in serum samples and measured IL-8 with a 90 fg mL−1 limit of detection and 900 fg mL−1–900 ng mL−1 dynamic range. Given that biologically relevant concentrations of IL-8 in patients falls within this dynamic range, this sensor is highly promising in screening and diagnosis of uterine and endometrial cancers.
For the marker IL-10, an SPR sensor has been developed.218 This sensor used a silver nanostructure to which was anchored IL-10 antibodies. This method was able to detect low levels of IL-10 in human serum and differentiate uterine cancer patients from those with benign gynecological disorders. It also provided a limit of detection approaching 1 pg mL−1, and a wide dynamic range of 1 pg mL−1–1 μg mL−1, with results comparable to ELISA kits.
Another SPR assay has been developed for TNFα, which uses a sandwich immunoassay coupled with gold nanoparticles to increase sensitivity and was verified in human serum.219 This sensor was able to achieve a limit of detection of 11.6 pg mL−1 in buffered samples, but this limit of detection unfortunately climbed to 54.4 pg mL−1 in dilute serum samples due to non-specific adsorption. This increased LOD in serum reduces the sensor's ability to accurately detect biologically relevant concentrations of TNFα, so efforts would need to be made to bring down the limit to allow this sensor to be used in screening and diagnostics.
For the biomarker VEGF, a wide array of sensors has been developed.220 These include luminescence, colorimetric, fluorescence, and SPR sensors that rely on a developed aptamer for VEGF. Many of these sensors provide low LODs, though typically also present with narrow dynamic ranges, with only a few verified to work in non-buffer samples. One interesting sensor involves an aptamer-based sandwich assay for chemiluminescence detection in cell media.221 This sensor provided a low limit of detection of 1 nM, while providing very similar results to ELISA assays for cell media measurements.
Another interesting sensor for VEGF was developed using fluorescently labeled split molecular aptamers.222 The aptamers were exposed to VEGF followed by treatment with nicking enzymes to cleave off the fluorescent section of any analyte-bound aptamer and use grapheme oxide nanosheets as a quenching agent (Fig. 6). This allowed for signal detection only in the presence of analyte with low background noise. A limit of detection of 1 pM, with a wide dynamic range was achieved. The assay was also tested with ATP, and its corresponding aptamers, and was successfully used in rat liver samples. The ability of this assay to work in real tissue samples bodes well for its use as an assay in human serum or blood samples.
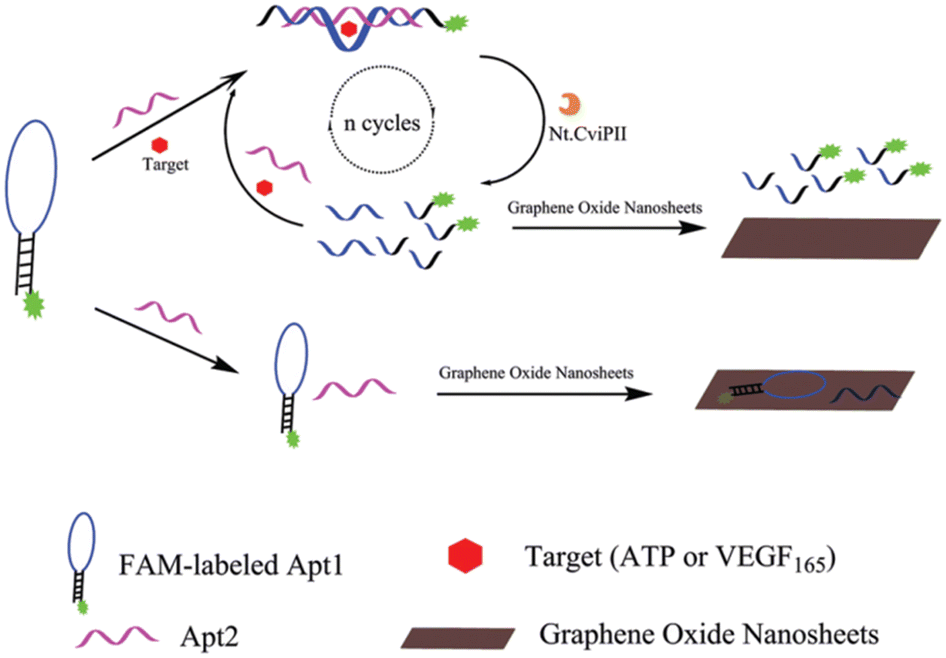 | ||
| Fig. 6 Schematic illustration of the assay for the detection of biomolecules (reprinted from ref. 222 with permission from the Chinese Chemical Society (CCS)), Institute of Chemistry of the Chinese Academy of Sciences ((IC) and the Royal Society of Chemistry, copyright 2015). | ||
For angiogenin, an electrochemical sensor based on square wave voltammetry has been developed.223 The sensor involved using anti-angiogenin bound to a gold electrode surface for measurements and was evaluated in human serum samples where it compared favorably to a standard ELISA assay. With a 1 pM LOD and a dynamic range of 0.01–30 nM, this sensor shows promise for the quantification of angiogenin in real clinical samples.
Leptin, another biomarker, has also had a variety of sensors developed for it, though typically these sensors are initially for diagnosing obesity risk, they none-the-less could be applied to uterine cancer diagnosis. These sensors include electrochemical sensors,224–228 chemiluminescence,229,230 and SPR.231 This wide variety of sensors and methods may allow us to bring leptin quantification into diagnosis of uterine cancers.
The electrochemical sensor developed by Özcan and Sezgintürk based on graphite paper was particularly interesting.225 This sensor used anti-leptin as the capture probe and electrochemical impedance spectroscopy to quantify leptin in diluted serum samples. This was due to the limit of detection (0.008 pg mL−1) and linear range (0.2–20 pg mL−1) being well below the typical concentration of leptin found in human serum. Though this sensor was used to study leptin in relation to childhood obesity, such a sensor could be applied to women to assist in screening for uterine cancer.
Another effort to use electrochemistry to measure leptin concentration in real samples utilized a sandwich ELISA-based assay with cyclic voltammetry (CV) and square-wave voltammetry (SWV) with screen printed gold electrodes.226 This method was able to quantify leptin in a range of 0.1–20 ng mL−1, with a limit of detection of 0.03 ng mL−1. Additionally, this method was applied to mouse blood and could successfully quantify leptin in this real biological solution, making it promising for use in clinical diagnostics. Although a promising sensor for leptin, it provided similar results to the commercial ELISA assays, with little discussion of its advantages over the commercial solution.
Endometriosis
For endometriosis, there has also been some effort to develop sensors for the condition (Table 8). One such system is an electrochemical sensor for CA19-9, though this biomarker is not recommended on its own for screening or diagnosing endometriosis.232 The developed sensor used carbon nanotube and magnetite nanoparticles with anti-CA19-9 and square wave voltammetry to quantify CA19-9. This sensor displayed a low LOD of 0.2 pg mL−1 and a dynamic range of 1 pg mL−1–100 ng mL−1 in buffered solution, and was able to quantify CA19-9 in real serum samples comparably to ELISA tests. Though insufficient as a solo biomarker, this sensor could provide a more cost-effective way to quantify CA19-9 in real samples.Another electrochemical sensor for glycodelin has also been developed by the same group.233 This sensor was based on a gold disc electrode, and used anti-glycodelin as the capture agent, and similarly used square wave voltammetry for measurements. As with the CA-19-9 electrochemical sensor, this sensor displayed a low LOD of 0.5 ng mL−1, a wide dynamic range of 1–1000 ng mL−1, and quantified glycodelin comparably to ELISA tests when using human serum. As glycodelin has been found to have reasonably high sensitivity and specificity towards endometriosis, this sensor is a promising step towards sensor-based screening.
An impedimetric immunosensor has been developed for A1BG in relation to endometriosis, which could be useful for screening later stage patients.234 This sensor used anti-A1BG bound to screen printed electrodes and electrochemical impedance spectroscopy for its measurements. This sensor provided a low limit of detection of 1 ng mL−1 for the biomarker and used machine learning to improve the sensitivity and specificity of the device. It required only 50 μL of sample for measurement, and although it was not verified in real serum samples, the researchers tested it in simulated serum with promising results.
Although not a direct sensor, another study showed that using principal component analysis of Raman spectroscopy scans could detect endometriosis with a sensitivity of 80.5% and specificity of 89.7%.235 Instead of trying to quantify a single prospective biomarker, this study looked at the subtle differences present in Raman spectra of serum from healthy women versus those with endometriosis. Due to the relative ease of use of Raman spectroscopy and the lack of any specialized devices or chemicals, this technique could prove very useful in non-invasive screening for this condition.
Gynaecological infections
One way to improve proper diagnoses of infections and ensure rapid and correct treatment would be to use sensors that can accurately detect infections from patient samples. There have been some commercial efforts to produce point-of-care and at-home tests for gynecological infections. One such development is the Seegene Allplex™ Vaginitis test, which is a real-time PCR test for a variety of vaginal infectious agents including bacterial vaginosis, Candida, and Trichomonas vaginalis.236 This test performed quite well with sensitivities and specificities for bacterial vaginosis (BV) at 91.7% and 86.6%; any Candida spp. 91.1% and 95.6%; Candida albicans 88.1% and 98.2%; non-albicans Candida 100% and 97.5%; and T. vaginalis 94.4 and 99.9%. Such a test is rapid and could provide very good point-of-care diagnostics for different vaginal infections.Another commercial test is the SavvyCheck™ Vaginal Yeast Test, which is a colour change test similar to a pregnancy test, which uses a swab sample from the vagina to diagnose the presence of Candida.237 This test showed a sensitivity of 94.1%, specificity of 98.9% compared to gram staining, which has very high accuracy. Being simple to use, and with easy-to-interpret results, this test is a very good sensor for yeast infections and will allow women to rapidly seek the correct treatment.
Another sensor for general BV screening is the VGTest™ ion mobility spectrometer, which has been tested in point-of-care settings.150 This test measures the levels of triethylamine, putrescine, and cadaverine in vaginal fluid samples. In patients with BV, these levels are all elevated, with triethylamine being significantly higher than healthy controls. The test was found to have an 83% sensitivity and 92% specificity in a point-of-care setting and could be highly useful for rapidly screening BV in populations outside of a major clinical setting.
When it comes to serious infection and sepsis, sensors for the biomarker procalcitonin could prove very useful. One such sensor is an electrochemical immunosensor, which uses a graphene oxide gold nano-composite film, with carbon nanohorn labeled antibodies for the rapid detection of procalcitonin.238 This sensor provided a low LOD of 0.43 pg mL−1, with a dynamic range of 1 pg mL−1–20 ng mL−1, while being able to accurately quantify procalcitonin in serum samples.
Another sensor for procalcitonin is a simple electrolyte-gated organic field-effect transistor (EGOFET), which uses an anti-procalcitonin probe as the capture agent and works in a label free manner.239 This sensor provided a limit of detection of 2.2 pM, while being simple to use. It was verified to work in milk powder samples as a complex biological matrix, but was not verified in serum or other human samples, so its clinical use requires more verification.
Plasmonic imaging has been used to detect procalcitonin in serum samples.240 This test used a sandwich assay, with gold nanoparticle labeled antibodies for signal generation. A limit of detection of 2.8 pg mL−1 was achieved, with a wide dynamic range of 4.2–12500 pg mL−1. This assay provided better results and a lower limit of detection than the commercially available ELISA test in serum samples.
Another plasmonic sensor, this time for simultaneous detection of the specific bacterial infections Chlamydia trachomatis and Neisseria gonorrhoeae, has also been developed.241 This plasmonic sensor used antibodies for these specific bacteria and uses microscopy for visualization and image analysis. The sensor was verified in urine samples and provided a limit of detection of 1000 CFU mL−1. This test is potentially useful for early and accurate diagnosis of these STIs.
Another sensor for Chlamydia has been developed, which is an electrochemical sensor that looks for specific 16s RNA markers specific to Chlamydia.242 This sensor was based on duplex-specific nuclease (DSN)-assisted target-responsive DNA hydrogels and used bovine serum albumin (BSA) as the carrier. It was able to produce a dynamic range of 10 fM–25 pM with a detection limit of 5.8 fM, with very high reproducibility.
Looking at Il-1β, which can help screen for a variety of infections, there have been several efforts to develop sensors. One such effort is a fiber optic plasmon resonance sensor, which uses anti-Il-1β as the sensor probe.243 This sensor was tested in synovial fluid and produced a limit of detection of 21 pg mL−1, with a dynamic range of 0.05–10 ng mL−1. Although tested in a differing biological fluid, this test could potentially be used in vaginal fluid for screening of gynecological infections.
Another effort is an impedimetric sensor based on an electrochemical molecularly imprinted polymer for Il-1β.244 This sensor used commercial screen-printed carbon electrodes and provided a limit of detection of 1.5 pM, with a dynamic range of 60 pM–600 nM. This sensor was verified to work in artificial serum with little interference, making it potentially useful in clinical diagnostics for infections.
For Il-1β, an electrochemical immunosensor has been developed.245 This sensor is based on a polythiophene polymer with reactive carboxyl groups to which anti-Il-1β was bound. The sensor was found to have an incredibly low LOD of 0.3 fg mL−1, with a dynamic range of 0.01–3 pg mL−1, making it highly sensitive. This sensor was verified to work in both human serum as well as saliva, making it widely applicable in diagnostics.
Challenges and future perspectives
In this Review, we have looked at the current state of screening and diagnosis for gynaecological illnesses, which typically involve screening for symptoms followed by imaging studies or overnight culture methodology. This method of screening and diagnosis is time consuming, expensive, and requires trained personnel, making it less than ideal for large scale use. To remedy this, many researchers have been developing sensors for biomarkers of these illnesses that can be applied to patient serum or urine samples.Biomarker identification is typically very difficult, as many biomarkers may appear in patient samples for a variety of illnesses. In addition, the identification of such biomarkers often involves comparing samples from those suffering from the specified illness versus healthy control samples, but this does not determine if the biomarker is unique to the specified illness. Throughout this review we have described a large number of potential biomarkers in gynaecological medicine, but further research needs to be done to determine the uniqueness of those markers for a disease of interest, or to identify a series of biomarkers that are relevant to an illness of interest, even if no such marker exists at the current time.
Herein, we have also taken the restricted view that sensor detection in gynaecological medicine involves, for the most part, assay of the concentration of particular biomarkers for specific diseases in biological fluids. It should be emphasized, however, that not all the works outlined conduct such measurements in tissue, blood, serum, or urine. This type of research, often performed in aqueous solution, is presented in terms of a “possible” approach for the future. These sensors need to be thoroughly verified in the desired patient sample before they can be considered for use in clinical care.
In general, the potential use of sensors in clinical biochemistry can take two distinct forms, that of assay in the central hospital and/or private facilities, or employment as point-of-care (POC) devices. The latter approach is generally intended for application at the hospital bedside, or facility of a general practitioner. Use in the home could be contemplated, but for the gynaecology area this application is currently limited to vaginal swabs and urine, and the biomarkers present in such samples. Biomarkers present in serum or tissue samples are typically limited to clinical laboratories due to the processing requirements of such samples before measurements can be made. Most of the biomarkers discussed in this review have come from such samples, limiting their use in POC devices.
Currently, the central clinical laboratory is the most cost-effective approach for the large-scale screening of patient biological fluid samples for the presence of biomarkers for disease. These facilities often use automated robotic systems to process and test samples, and as such a sensor developed for any gynaecological illness needs to be incorporated into such systems. This incorporation, which usually involves serum samples, appears to offer an attractive alternative to standard ELISA-based assays, which are time consuming and typically expensive as far as assays go. However, to be competitive with such measurements, the device would need to be operable in a highly stable and reversible mode or involve low-cost replaceable tests. The sensor would also need to be capable of avoiding interference from components of biological fluid, or “fouling” as it is often termed. These aspects appear to constitute intractable problems currently, as no biomarker sensor has been incorporated into the clinical laboratory at the present time that we are aware of.
A further attractive possibility for the application of sensor technology in gynaecological medicine, indeed in any area of oncology, is the potential for multi-biomarker detection in association with a particular condition. As discussed above, such detection would be especially important with regard to assays where different sub-types of disease, possibly generating different markers, are evident, as well as avoiding complications for markers that are present for multiple diseases. Microelectronic devices with intrinsic capability for multi-analyte detection have been under development of recent years which address this area. These are often fabricated with sample handling capability by microfluidic arrangements. However, such structures are subject to the fouling issue alluded to above both in terms of detection and channel structures etc. in the device. To be utilized in the central clinical laboratory, these devices will need to avoid the fouling problem, possibly through use of surface coatings, as well as be reusable or low cost enough to allow their single use and disposal.
These difficulties need to be considered by those working on developing sensors for any illnesses: the prevention of fouling and signal interference, incorporation into automated systems, reusability or low cost, and biomarker specificity. Despite these issues, solutions can be achieved through careful research, and many of the sensors discussed in this review are already making strides towards solving these problems. It is our hope that sensor technology will find a place in the clinical laboratory, allowing for better screening and diagnosis of gynaecological and other illnesses in the general population.
Conflicts of interest
There are no conflicts to declare.Acknowledgements
The authors are very grateful for support of their own research on the detection of ovarian cancer provided by the Canadian Institutes of Health Research (CIHR), Natural Sciences and Engineering Research Council of Canada (NSERC) and MITACS, Vancouver, British Columbia.References
- B. Hoffman, J. O. Schorge, L. M. Halvorson, C. A. Hamid, M. M. Corton and J. I. Schaffer, Williams Gynecology, McGraw Hill, New York, 4th edn, 2020 Search PubMed.
- S. Vaughan, et al. , Nat. Rev. Cancer, 2011, 11(10), 719 CrossRef CAS PubMed.
- A. Jemal, F. Bray, M. M. Center, J. Ferlay, E. Ward and D. Forman, Ca-Cancer J. Clin., 2011, 61(2), 69 CrossRef PubMed.
- F. Reid, World Ovarian Cancer Coalition Atlas, 2020, https://worldovariancancercoalition.org/ Search PubMed.
- Z. Momenimovahed, A. Tiznobaik, S. Taheri and H. Salehiniya, Int. J. Women's Health, 2019, 11, 287 CrossRef PubMed.
- Ovarian Cancers: Evolving Paradigms in Research and Care, National Academies of Sciences Committee on the State of the Science in Ovarian Cancer Research and Board on Health Care Services, Institute of Medicine, 2016 Search PubMed.
- M. Rana and P. Rasa, Int. J. Pharm. Sci. Res., 2022, 13(3), 5434 Search PubMed.
- F. Jannathul and S. Vinoth Kumar, Int. J. Trend Innov. Res., 2020, 5(1), 2456 Search PubMed.
- Cervical Cancer: Statistics, Cancer.Net, https://www.cancer.net/cancer-types/cervical-cancer/statistics.
- F. Martinez-Rodriguez, et al. , Cell, 2021, 10(8), 1854 CrossRef CAS PubMed.
- K. H. Lu and R. R. Broaduss, N. Engl. J. Med., 2020, 383, 2053 CrossRef CAS PubMed.
- Uterine Cancer: Statistics, Cancer.Net, https://www.cancer.net/cancer-types/uterine-cancer/statistics.
- Y. Alimi, J. Iwanaga, M. Loukas and R. S. Tubbs, Cureus, 2018, 10(9), e3361 Search PubMed.
- T. Vos, et al. , Lancet, 2016, 388(10053), 1545 CrossRef.
- W. S. Biggs and R. M. Williams, Prim. Care, 2009, 36(1), 33 CrossRef PubMed.
- C. O. Adiri, U. I. Nwagha, T. C. Okeke and E. O. Izuka, Int. J. Reprod. Contracept. Obstet. Gynecol., 2019, 8(10), 4114 CrossRef.
- A. Sanwar, M. A. Butt, S. Hafeez and M. Z. Danish, J. Infect. Public Health, 2020, 13(12), 1972 CrossRef PubMed.
- A. K. Green, D. Korenstein, C. Aghajanian, B. Barrow, M. Curry and R. E. O. Cearbhaill, J. Natl. Compr. Cancer Network, 2020, 18, 414 Search PubMed.
- D. Timmerman, A. C. Testa, T. Bourne, L. Ameye, D. Jurkovic, C. Van Holsbeke, D. Paladini, B. Van Calster, I. Vergote, S. Van Huffel and L. Valentin, Ultrasound Obstet. Gynecol., 2008, 31, 681 CrossRef CAS PubMed.
- P. He, J. Wang, W. Duan, C. Song, Y. Yang and Q. Wu, J. Ovarian Res., 2021, 14, 169 CrossRef CAS PubMed.
- S. J. Lee, H. R. Oh, S. Na, H. S. Hwang and S. M. Lee, Obstet. Gynecol. Sci., 2022, 65, 1 CrossRef PubMed.
- B. Van Calster, K. Van Hoorde, L. Valentin, A. C. Testa, D. Fischerova, C. Van Holsbeke, L. Savelli, D. Franchi, E. Epstein, J. Kaijser, V. Van Belle, A. Czekierdowski, S. Guerriero, R. Frunscio, C. Lanzani, F. Scala, T. Bourne and I. Timmerman Drik International Ovarian Tumour Analysis Group, BMJ, 2014, 349, 5920 CrossRef PubMed.
- P. Koirala, A. S. Moon and L. Chuang, Diagnostics, 2020, 10, 568 CrossRef CAS PubMed.
- J. T. Hoff, Int. J. Women's Health, 2014, 6, 25 Search PubMed.
- H. Kobayashi, Y. Yamada, T. Sado, M. Sakata, S. Yoshida, R. Kawaguchi, S. Kanayama, H. Shigetomi, S. Haruta, Y. Tsuji, S. Ueda and T. Kitanaka, Int. J. Gynecol. Cancer, 2008, 18, 414 CrossRef CAS PubMed.
- S. S. Buys, E. Partridge, A. Black, C. C. Johnson, L. Lamerato, C. Isaacs, D. Reding, R. Greenlee, L. Yokochi, B. Kessel, E. Crawford, T. Church, G. Andriole, J. Weissfeld, M. Fouad, D. Chia, B. O'Brien, L. Ragard, J. Clapp, J. Rathmell, T. Riley, P. Hartge, P. Pinsky, C. Zhu, G. Izmirlian, B. Kramer, A. Miller, J. Xu, P. Prorok, J. Gohagan, C. Berg and T. PLCO Project, JAMA, 2011, 305, 2295 CrossRef CAS PubMed.
- I. J. Jacobs, U. Menon, A. Ryan, A. Gentry-Maharaj, M. Burnell, J. K. Kalsi, N. N. Amso, S. Apostolidou, E. Benjamin, D. Cruickshank, D. N. Crump, S. K. Davies, A. Dawnay, S. Dobbs, G. Fletcher, J. Ford, K. Godfrey, R. Gunu, M. Habib, R. Hallett, J. Herod, H. Jenkins, C. Karpinskyj, S. Leeson, S. J. Lewis, W. R. Liston, A. Lopes, T. Mould, J. Murdoch, D. Oram, D. J. Rabideau, K. Reynolds, I. Scott, M. W. Seif, A. Sharma, N. Singh, J. Taylor, F. Warburton, M. Widschwendter, K. Williamson, R. Woolas, L. Fallowfield, A. J. McGuire, S. Campbell, M. Parmar and S. J. Skates, Lancet, 2016, 387, 945 CrossRef.
- K. M. Esselen, A. M. Cronin, K. Bixel, A. Michael, R. A. Burger, D. E. Cohn, M. Cristea, J. Griggs, C. F. Levenback, G. Mantia-smaldone, A. Larissa, U. A. Matulonis, J. C. Niland, C. Sun, D. M. O. Malley and A. A. Wright, JAMA Oncol., 2016, 2, 1427 CrossRef PubMed.
- Biomarkers and Biosensors for Cervical Cancer Diagnosis, ed. J. B. B. Rayappan and J. H. Lee, Springer, Singapore, 2021 Search PubMed.
- A. A. Hashmi, S. Naz, O. Ahmed, S. R. Yaqeen, M. Irfan, M. G. Asif, A. Kamal and N. Faridi, Cureus, 2020, 12, 12 Search PubMed.
- A. C. Chrysostomou and L. G. Kostrikis, Life, 2020, 10(11), 290 CrossRef CAS PubMed.
- S. Du, Y. Zhao, C. Lv, M. Wei, Z. Gao and X. Meng, Sci. Rep., 2020, 10, 9033 CrossRef CAS PubMed.
- J. van der Horst, A. G. Siebers, J. Bulten, L. F. Massuger and I. M. C. M. de Kok, Cancer Med., 2017, 6(2), 416 CrossRef PubMed.
- F. Kanavati, N. Hirose, T. Ishii, A. Fukuda, S. Ichihara and M. Tsuneki, Cancers, 2022, 14(5), 1159 CrossRef PubMed.
- P. F. Escobar, A. Chiesa-Vottero and C. M. Michener, in General Gynecology, ed. A. I. Sokol and E. R. Sokol, Mosby, Philadelphia, 2007, ch. 18, pp. 429–457 Search PubMed.
- M. A. Molina, L. C. Diatricch, M. C. Quintana, W. J. G. Melchers and K. M. Andralojc, Expert Rev. Mol. Diagn., 2020, 20(11), 1099 CrossRef CAS PubMed.
- M. E. Bagwell-Gray and M. Ramaswamy, Health Soc. Work, 2022, 47(2), 102 CrossRef PubMed.
- B. Xing, J. Guo, Y. Sheng, G. Wu and Y. Zhao, Front. Oncol., 2020, 10, 606335 CrossRef PubMed.
- N. Bhatla and S. Singhal, Best Pract. Res. Clin. Obstet. Gynaecol., 2020, 65, 98 CrossRef PubMed.
- M. Zare-Bidaki, M. Zardast, A. Nadjafi-Semnani, M. Nadjafi-Semnani, D. Javanmard, S. Ghafari and N. Ghanbarzadeh, BMC Infect. Dis., 2022, 22, 278 CrossRef CAS PubMed.
- Y. L. Woo, P. Gravitt, S. K. Khor, C. W. Ng and M. Saville, Prev. Med., 2021, 144, 106294 CrossRef PubMed.
- M. Poljak, A. O. Valenčak, G. G. Domjanič, L. Xu and M. Arbyn, Clin. Microbiol. Infect., 2020, 26, 1144 CrossRef CAS PubMed.
- New Approaches in the Evaluation for High-Risk Human Papillomavirus Nucleic Acid Detection Devices, FDA Executive Summary, 2019.
- WHO guideline for screening and treatment of cervical pre-cancer lesions for cervical cancer prevention, World Health Organization, 2nd edn, 2021 Search PubMed.
- L. von Karsa, M. Arbyn, H. De Vuyst, J. Dillner, L. Dillner, S. Franceschi, J. Patnick, G. Ronco, N. Segnan, E. Suonio, S. Törnberg and A. Anttiila, Papillomavirus Res., 2015, 1, 22 CrossRef.
- M. J. Thrall, D. K. Russell, M. S. Facik, J. L. Yao, J. N. Warner, T. A. Bonfiglio and E. J. Giampoli, Am. J. Clin. Pathol., 2010, 133(6), 894 CrossRef PubMed.
- J. Cuzick, C. Clavel, K.-U. Petry, C. J. L. M. Meijer, H. Hoyer, S. Ratnam, A. Szarewski, P. Birembaut, S. Kulasingam, P. Sasieni and T. Iftner, Int. J. Cancer, 2006, 119, 1095 CrossRef CAS PubMed.
- J. Egede, L. Ajah, P. Ibekwe, U. Agwu, E. Nwizu and F. Iyare, J. Glob. Oncol., 2018, 4, 1 Search PubMed.
- Y. Xie, X. Tan, H. Shao, Q. Liu, J. Tou, Y. Zhang, Q. Luo and Q. Xiang, BMC Public Health, 2017, 17, 118 CrossRef PubMed.
- U. R. Poli, P. D. Bidinger and S. Gowrishankar, Indian J. Community Med., 2015, 40(3), 203 CrossRef PubMed.
- C. Bourgioti, K. Chatoupis and L. A. Moulopoulos, World J. Radiol., 2016, 8(4), 342 CrossRef PubMed.
- M. Basij, A. Karpiouk, I. Winer, S. Emelianov and M. Mehrmohammadi, IEEE Photonics J., 2021, 13(1), 1–10 Search PubMed.
- S. Walker, C. Hyde and W. Hamilton, Br. J. Gen. Pract., 2013, 63(614), e643 CrossRef PubMed.
- C. Kingnate, S. Tangjitgamol, J. Khunnarong and S. Manusirivithaya, Indian J. Cancer, 2016, 53(1), 67 CrossRef CAS PubMed.
- K. Serdy, I. Yildiz-Aktas, Z. Li and C. Zhao, Am. J. Clin. Pathol., 2016, 145(3), 350 CrossRef CAS PubMed.
- M. A. Bredella, V. A. Feldstein, R. A. Filly, R. B. Goldstein, P. W. Callen and H. K. Genant, Radiology, 2000, 217(2), 516 CrossRef CAS PubMed.
- M. J. Kim, J. J. Kim and S. M. Kim, Obstet. Gynecol. Sci., 2016, 59(3), 192 CrossRef PubMed.
- I. Chawla, S. Tripathi, P. Vohra and P. Singh, J. Obstet. Gynecol. India, 2014, 64(3), 197 CrossRef CAS PubMed.
- T. J. Clark, C. H. Mann, N. Shah, K. S. Khan, F. Song and J. K. Gupta, BJOG, 2002, 109(3), 313 CrossRef PubMed.
- K. Gungorduk, O. Asicioglu, I. E. Ertas, I. A. Ozdemir, M. M. Ulker, G. Yildirim, G. Ataser and M. Sanci, Eur. J. Gynaecol. Oncol., 2014, 392, 2936 Search PubMed.
- J. Arnaiz, A. B. Munoz, V. Verna, I. Gonzalez-Rodilla and J. Schneider, Anticancer Res., 2016, 36(4), 1891 Search PubMed.
- M. Signorelli, C. Crivellaro, A. Buda, L. Guerra, R. Fruscio, F. Elisei, C. Dolci, M. Cuzzocrea, R. Milani and C. Messa, Clin. Nucl. Med., 2015, 40(10), 780 CrossRef PubMed.
- C. Chapron, L. Marcellin, B. Borghese and P. Santulli, Nat. Rev. Endocrinol., 2019, 15(11), 666 CrossRef PubMed.
- N. Leyland, R. Casper, P. Laberge, S. S. Singh, L. Allen, K. Arendas, N. Leyland, C. Allaire, A. Awadalla, C. Best and E. Contestabile, J. Endometr., 2010, 2(3), 107 CrossRef.
- P. Parasar, P. Ozcan and K. L. Terry, Curr. Obstet. Gynecol. Rep., 2017, 6(1), 34 CrossRef PubMed.
- M. J. Currie and F. J. Bowden, Aust. N. Z. J. Obstet. Gynaecol., 2007, 47(1), 2 CrossRef PubMed.
- M. Allen, JAAPA, 2018, 31(2), 50 CrossRef PubMed.
- S. S. Richter, J. Otiso, O. J. Goje, S. Vogel, J. Aebly, G. Keller, H. Van Heule, D. Wehn, A. L. Stephens, S. Zanotti and T. Johnson, J. Clin. Microbiol., 2019, 58(1), e01264-19 CrossRef PubMed.
- P. Patel, B. Bennett, T. Sullivan, M. M. Parker, J. D. Heffelfinger, P. S. Sullivan and CDC AHI Study Group, J. Clin. Virol., 2012, 54(1), 42 CrossRef PubMed.
- C. Delaugerre, G. Antoni, N. Mahjoub, G. Pialoux, E. Cua, A. Pasquet, N. Hall, C. Tremblay, L. Cotte, C. Capitant and M. L. Chaix, J. Infect. Dis., 2017, 216(3), 382 CAS.
- M. J. Redelinghuys, J. Geldenhuys, H. Jung and M. M. Kock, Front. Cell. Infect. Microbiol., 2020, 10, 354 CrossRef PubMed.
- P. Barnes, R. Vieira, J. Harwood and M. Chauhan, Br. J. Gen. Pract., 2017, 67(665), e824 CrossRef PubMed.
- E. Vardar, I. Maral, M. Inal, Ö. Özgüder, F. Tasli and H. Postaci, Infect. Dis. Obstet. Gynecol., 2002, 10(4), 203 CrossRef PubMed.
- E. Kobayashi, Y. Ueda, S. Matsuzaki, T. Yokoyama, T. Kimura, K. Yoshino, M. Fujita, T. Kimura and T. Enomoto, Cancer Epidemiol., Biomarkers Prev., 2012, 21, 1902 CrossRef CAS PubMed.
- G. Ruggeri, E. Bandiera, L. Zanotti, S. Belloli, A. Ravaggi, C. Romani, E. Bignotti, R. A. Tassi, G. Tognon, C. Galli, L. Caimi and S. Pecorelli, Clin. Chim. Acta, 2011, 412, 1447 CrossRef CAS PubMed.
- S. Aebi and M. Castiglione, Ann. Oncol., 2008, 19, ii14 CrossRef PubMed.
- G. Sölétormos, M. J. Duffy, S. Othman Abu, R. H. M. Verheijen, B. Tholander, R. C. Bast, K. N. Gaarenstroom, C. M. Sturgeon, J. M. Bonfrer, P. H. Petersen, H. Troonen, G. CarloTorre, J. Kanty, M. K. Tuxen and R. Molina, Int. J. Gynecol. Cancer, 2016, 26, 43 CrossRef PubMed.
- D. W. Cramer, R. C. Bast, C. D. Berg, E. P. Diamandis, A. K. Godwin, P. Hartge, A. E. Lokshin, K. H. Lu, M. W. McIntosh, G. Mor, C. Patriotis, P. F. Pinsky, M. D. Thornquist, N. Scholler, S. J. Skates, P. M. Sluss, S. Srivastava, D. C. Ward, Z. Zhang, C. S. Zhu and N. Urban, Cancer Prev. Res., 2011, 4, 365 CrossRef PubMed.
- Y. Zhang, B. Guo and R. Bi, Appl. Biochem. Biotechnol., 2012, 168, 910 CrossRef CAS PubMed.
- S. P. Langdon, G. J. Rabiasz, G. L. Hirst, R. J. B. King, R. A. Hawkins, J. F. Smyth and W. R. Miller, Clin. Cancer Res., 1996, 1, 1603 Search PubMed.
- X.-Q. Li, S.-L. Zhang, Z. Cai, Y. Zhou, T.-M. Ye and J.-F. Chiu, Cancer Lett., 2009, 275, 109 CrossRef CAS PubMed.
- S. Bengtsson, M. Krogh, C. A.-K. Szigyarto, M. Uhlen, K. Schedvins, C. Silfverswärd, S. Linder, G. Auer, A. Alaiya and P. James, J. Proteome Res., 2007, 6, 1440 CrossRef CAS PubMed.
- R. Lim, M. Lappas, N. Ahmed, M. Permezel, M. A. Quinn and G. E. Rice, Biochem. Biophys. Res. Commun., 2011, 406, 408 CrossRef CAS PubMed.
- S. Polterauer, C. Grimm, V. Seebacher, N. Concin, C. Marth, C. Tomovski, H. Husslein, H. Leipold, K. Hefler-Frischmuth, C. Tempfer, A. Reinthaller and L. Hefler, Oncologist, 2009, 14, 979 CrossRef PubMed.
- J. H. Kim, S. J. Skates, T. Uede, K. K. Wong, J. O. Schorge, C. M. Feltmate, R. S. Berkowitz, D. W. Cramer and S. C. Mok, JAMA, 2002, 287(13), 1671–1679 CrossRef CAS PubMed.
- K. L. Abbott, J. M. Lim, L. Wells, B. B. Benigno, J. F. McDonald and M. Pierce, Proteomics, 2010, 10(3), 470–481 CrossRef CAS PubMed.
- B. Aktas, S. Kasimir-Bauer, P. Wimberger, R. Kimmig and M. Heubner, Anticancer Res., 2013, 33, 329 CAS.
- T. Daikoku, S. Tranguch, I. N. Trofimova, D. M. Dinulescu, T. Jacks, A. Y. Nikitin, D. C. Connolly and S. K. Dey, Cancer Res., 2006, 66, 2527 CrossRef CAS PubMed.
- T. Daikoku, D. Wang, S. Tranguch, J. D. Morrow, S. Orsulic, R. N. DuBois and S. K. Dey, Cancer Res., 2005, 65, 3735–3744 CrossRef CAS PubMed.
- R. A. Gupta, L. V. Tejada, B. J. Tong, S. K. Das, J. D. Morrow, S. K. Dey and R. N. DuBois, Cancer Res., 2003, 63, 906 CAS.
- S. E. McGrath, N. Annels, T. K. Madhuri, A. Tailor, S. A. Butler-Manuel, R. Morgan, H. Pandha and A. Michael, BMC Cancer, 2018, 18, 943 CrossRef CAS PubMed.
- S. Akyol, C. Gercel-Taylor, L. C. Reynolds and D. D. Taylor, Gynecol. Oncol., 2006, 101, 481 CrossRef CAS PubMed.
- Y. Xu, Z. Shen, D. W. Wiper, R. E. Morton, P. Elson, A. W. Kennedy, J. Belinson, M. Markman and G. Casey, JAMA, 1998, 280, 719 CrossRef CAS PubMed.
- I. Sedláková, J. Vávrová, J. Tošner and L. Hanousek, Tumor Biol., 2011, 32, 311 CrossRef PubMed.
- D. L. Baker, P. Morrison, B. Miller, C. A. Riely, B. Tolley, A. M. Westermann, J. M. G. Bonfrer, E. Bais, W. H. Moolenaar and G. Tigyi, JAMA, 2002, 287, 3081 CrossRef PubMed.
- D. G. Peters, Cancer Epidemiol., Biomarkers Prev., 2005, 14, 1717 CrossRef CAS PubMed.
- I. Hellstrom, P. J. Heagerty, E. M. Swisher, P. Liu, J. Jaffar, K. Agnew and K. E. Hellstrom, Cancer Lett., 2010, 296, 43 CrossRef CAS PubMed.
- A. Fritz-Rdzanek, W. Grzybowski, J. Beta, A. Durczyński and A. Jakimiuk, Oncol. Lett., 2012, 4, 385 CrossRef CAS PubMed.
- K. Huhtinen, P. Suvitie, J. Hiissa, J. Junnila, J. Huvila, H. Kujari, M. Setälä, P. Härkki, J. Jalkanen, J. Fraser, J. Mäkinen, A. Auranen, M. Poutanen and A. Perheentupa, Br. J. Cancer, 2009, 100, 1315 CrossRef CAS PubMed.
- R. G. Moore, A. K. Brown, M. C. Miller, S. Skates, W. J. Allard, T. Verch, M. Steinhoff, G. Messerlian, P. DiSilvestro, C. O. Granai and R. C. Bast, Gynecol. Oncol., 2008, 108, 402 CrossRef CAS PubMed.
- F. Su, J. Lang, A. Kumar, C. Ng, B. Hsieh, M. A. Suchard, S. T. Reddy and R. Farias-Eisner, Biomarker Insights, 2007, 2, 369 CrossRef PubMed.
- F. R. Ueland, C. P. Desimone, L. G. Seamon, R. A. Miller, S. Goodrich, I. Podzielinski, L. Sokoll, A. Smith, J. R. van Nagell and Z. Zhang, Obstet. Gynecol., 2011, 117, 1289 CrossRef PubMed.
- S. Kumari, Indian J. Clin. Biochem., 2018, 33, 382 CrossRef CAS PubMed.
- I. Visintin, Z. Feng, G. Longton, D. C. Ward, A. B. Alvero, Y. Lai, J. Tenthorey, A. Leiser, R. Flores-Saaib, H. Yu, M. Azori, T. Rutherford, P. E. Schwartz and G. Mor, Clin. Cancer Res., 2008, 14, 1065 CrossRef CAS PubMed.
- K. R. Kozak, F. Su, J. P. Whitelegge, K. Faull, S. Reddy and R. Farias-Eisner, Proteomics, 2005, 5, 4589 CrossRef CAS PubMed.
- M. Petrillo, C. Ronsini, D. Calandra, M. Dessole and S. Dessole, in Ovarian Cancer Biomarkers, ed. K. El Bairi, Springer Singapore, Singapore, 2021, p. 187 Search PubMed.
- A. Yokoi, Y. Yoshioka, A. Hirakawa, Y. Yamamoto, M. Ishikawa, S. Ikeda, T. Kato, K. Niimi, H. Kajiyama, F. Kikkawa and T. Ochiya, Oncotarget, 2017, 8, 89811 CrossRef PubMed.
- A. Yokoi, Y. Yoshioka, Y. Yamamoto, M. Ishikawa, S. Ikeda, T. Kato, T. Kiyono, F. Takeshita, H. Kajiyama, F. Kikkawa and T. Ochiya, Nat. Commun., 2017, 8, 14470 CrossRef PubMed.
- R. Guo, G. Liu, C. Li, X. Liu, Y. Xu, W. Yang and F. Wang, Exp. Ther. Med., 2021, 22(1), 774 CrossRef CAS PubMed.
- D. T. M. Leung, P.-L. Lim, T.-H. Cheung, R. R. Y. Wong, S.-F. Yim, M. H. L. Ng, F. C. H. Tam, T. K. H. Chung and Y.-F. Wong, PLoS One, 2016, 11(8), e0160412 CrossRef PubMed.
- Z. Zuberi, A. Mremi, J. O. Chilongola, G. Semango and E. Sauli, PLoS One, 2021, 16(10), e0259096 CrossRef CAS PubMed.
- E.-K. Yim and J.-S. Park, Cancer Res. Treat., 2005, 37(6), 319 CrossRef PubMed.
- Y. Jin, S. C. Kim, H. J. Kim, W. Ju, Y. H. Kim and H.-J. Kim, Arch. Pharmacal Res., 2018, 41, 438 CrossRef CAS PubMed.
- M. L. Tornesello, R. Faraonio, L. Buonaguro, C. Annunziata, N. Starita, A. Cerasuolo, F. Pezzuto, A. L. Tornesello and F. M. Buonaguro, Front. Oncol., 2020, 10, 150 CrossRef PubMed.
- H.-B. Ma, Y.-N. Yao, J.-J. Yu, X.-X. Chen and H.-F. Li, Am. J. Transl. Res., 2018, 10(2), 592 CAS.
- X. Liu, Biomed. Pharmacother., 2018, 102, 996 CrossRef CAS PubMed.
- M. Liu, W. Wang, H. Chen, Y. Lu, D. Yuan, Y. Deng and D. Ran, BioMed Res. Int., 2020, 2020, 2474235 Search PubMed.
- B. Pardini, D. De Maria, A. Francavilla, C. Di Gaetano, G. Ronco and A. Naccarati, BMC Cancer, 2018, 18, 696 CrossRef PubMed.
- Y. Zhu, Y. Han, T. Tian, P. Su, G. Jin, J. Chen and Y. Cao, Pathol., Res. Pract., 2018, 214(3), 374 CrossRef CAS PubMed.
- Q. Ma, G. Wan, S. Wang, W. Yang, J. Zhang and X. Yao, Cancer Cell Int., 2014, 14, 81 CrossRef PubMed.
- F. Zhang, J. Liu and B.-B. Xie, J. Cell. Physiol., 2019, 234, 18626 CrossRef CAS PubMed.
- M. Hasanzadeh, M. Movahedi, M. Rejali, F. Maleki, M. Moetamani-Ahmadi, S. Seifi, Z. Hosseini, M. Khazaei, F. Amerizadeh, G. A. Ferns, M. Rezayi and A. Avan, J. Cell. Physiol., 2018, 234(2), 1289 CrossRef PubMed.
- S. Satapathy, J. Batra, V. Jeet, E. W. Thompson and C. Punyadeera, Expert Rev. Mol. Diagn., 2017, 17(7), 711 CrossRef CAS PubMed.
- J. Liu, H. Sun, X. Wang, Q. Yu, S. Li, X. Yu and W. Gong, Int. J. Mol. Sci., 2014, 15(1), 758 CrossRef PubMed.
- J. Zhao, H. Cao, W. Zhang, Y. Fan, S. Shi and R. Wang, BMC Cancer, 2021, 21, 675 CrossRef CAS PubMed.
- S. Guo, B. Yang, H. Liu, Y. Li, S. Li, L. Ma, J. Liu and W. Guo, J. Cancer Res. Ther., 2017, 13(4), 689 CrossRef CAS PubMed.
- R. G. Moore, A. K. Brown, M. C. Miller, D. Badgwell, Z. Lu, W. J. Allard, C. O. Granai, R. C. Bast Jr. and K. Lu, Gynecol. Oncol., 2008, 110(2), 196 CrossRef CAS PubMed.
- V. Chopra, T. V. Ding and E. V. Hanningan, J. Cancer Res. Clin. Oncol., 1997, 123(3), 167 CAS.
- C. M. Dallal, L. A. Brinton, D. C. Bauer, D. S. Buist, J. A. Cauley, T. F. Hue, A. Lacroix, J. A. Tice, V. M. Chia, R. Falk, R. Pfeiffer, M. Pollak, T. D. Veenstra, X. Xu, J. V. Lacey Jr. and B∼FIT Research Group, Endocr.-Relat. Cancer, 2013, 20(1), 151 CAS.
- N. Ashizawa, T. Yahata, J. Quan, A. Adachi, K. Yoshihara and K. Tanaka, Gynecol. Oncol., 2010, 119(1), 65 CrossRef CAS PubMed.
- P. P. Wang, X. Y. He, R. Wang, Z. Wang and Y. G. Wang, Cell. Physiol. Biochem., 2014, 34(5), 1477 CrossRef CAS PubMed.
- B. Trabert, R. C. Eldridge, R. M. Pfeiffer, M. S. Shiels, T. J. Kemp, C. Guillemette, P. Hartge, M. E. Sherman, L. A. Brinton, A. Black and A. K. Chaturvedi, Int. J. Cancer, 2017, 140(3), 600 CrossRef CAS PubMed.
- M. E. Yıldırım, S. Karakuş, H. K. Kurtulgan, H. Kılıçgün, S. Erşan and S. Bakır, Biochem. Genet., 2017, 55(4), 314 CrossRef PubMed.
- K. Dziobek, M. Oplawski, B. O. Grabarek, N. Zmarzły, B. Tomala, T. Halski, E. Leśniak, K. Januszyk, R. Brus, R. Kiełbasiński and D. Boroń, Curr. Pharm. Biotechnol., 2019, 20(11), 955 CAS.
- A. V. Hernandez, V. Pasupuleti, V. A. Benites-Zapata, P. Thota, A. Deshpande and F. R. Perez-Lopez, Eur. J. Cancer, 2015, 51(18), 2747 CrossRef CAS PubMed.
- N. Potischman, R. N. Hoover, L. A. Brinton, P. Siiteri, J. F. Dorgan, C. A. Swanson, M. L. Berman, R. Mortel, L. B. Twiggs, R. J. Barrett and G. D. Wilbanks, J. Natl. Cancer Inst., 1996, 88(16), 1127 CrossRef CAS PubMed.
- K. A. Michels, L. A. Brinton, N. Wentzensen, K. Pan, C. Chen, G. L. Anderson, R. M. Pfeiffer, X. Xu, T. E. Rohan and B. Trabert, JNCI Cancer Spectr., 2019, 3(3), pkz029 CrossRef PubMed.
- E. Ozhan, A. Kokcu, K. Yanik and M. Gunaydin, Eur. J. Obstet. Gynecol. Reprod. Biol., 2014, 178, 128 CrossRef PubMed.
- K. E. May, S. A. Conduit-Hulbert, J. Villar, S. Kirtley, S. H. Kennedy and C. M. Becker, Hum. Reprod. Update, 2010, 16, 651 CrossRef CAS PubMed.
- P. Xavier, J. Beires, L. Belo, I. Rebelo, J. Martinez-de-Oliveira, N. Lunet and H. Barros, Eur. J. Obstet. Gynecol. Reprod. Biol., 2005, 123(2), 254 CrossRef PubMed.
- F. Zhang, X. L. Liu, W. Wang, H. L. Dong, Y. F. Xia, L. P. Ruan and L. P. Liu, Curr. Med. Sci., 2018, 38(3), 499 CrossRef CAS PubMed.
- A. Mosbah, Y. Nabiel and E. Khashaba, Obstet. Gynecol., 2016, 134, 247 CAS.
- M. Dutta, E. Subramani, K. Taunk, A. Gajbhiye, S. Seal, N. Pendharkar, S. Dhali, C. D. Ray, I. Lodh, B. Chakravarty and S. Dasgupta, J. Proteomics, 2015, 114, 182 CrossRef CAS PubMed.
- A. Mihalyi, O. Gevaert, C. M. Kyama, P. Simsa, N. Pochet, F. De Smet, B. De Moor, C. Meuleman, J. Billen, N. Blanckaert and A. Vodolazkaia, Hum. Reprod., 2010, 25(3), 654 CrossRef CAS PubMed.
- A. Agic, S. Djalali, M. M. Wolfler, G. Halis, K. Diedrich and D. Hornung, Reprod. Sci., 2008, 15, 906 CrossRef PubMed.
- A. Vodolazkaia, Y. El-Aalamat and D. Popovic, Hum. Reprod., 2012, 27, 2698 CrossRef CAS PubMed.
- S. Moustafa, M. Burn, R. Mamillapalli, S. Nematian, V. Flores and H. S. Taylor, Am. J. Obstet. Gynecol., 2020, 223(4), 557 CrossRef CAS PubMed.
- M. Meisner, Ann. Lab. Med., 2014, 34(4), 263 CrossRef CAS PubMed.
- B. Tujula, H. Kokki, J. Räsänen and M. Kokki, Acta Obstet. Gynecol. Scand., 2018, 97, 505 CrossRef PubMed.
- T. Blankenstein, S. D. Lytton, B. Leidl, E. Atweh, K. Friese and I. Mylonas, Arch. Gynecol. Obstet., 2015, 292(2), 355 CrossRef CAS PubMed.
- L. Masson, K. B. Arnold, F. Little, K. Mlisana, D. A. Lewis, N. Mkhize, H. Gamieldien, S. Ngcapu, L. Johnson, D. A. Lauffenburger and Q. A. Karim, Sex. Transm. Infect., 2016, 92(3), 186 CrossRef PubMed.
- L. Masson, S. Barnabas, J. Deese, K. Lennard, S. Dabee, H. Gamieldien, S. Z. Jaumdally, A. L. Williamson, F. Little, L. Van Damme and K. Ahmed, Sex. Transm. Infect., 2019, 95(1), 5 CrossRef PubMed.
- G. Grine, H. Drouet, F. Fenollar, F. Bretelle, D. Raoult and M. Drancourt, Eur. J. Clin. Microbiol. Infect. Dis., 2019, 38(9), 1643 CrossRef CAS PubMed.
- E. E. Dzakah, L. Huang, Y. Xue, S. Wei, X. Wang, H. Chen, J. Shui, F. Kyei, F. Rashid, H. Zheng and B. Yang, BMC Microbiol., 2021, 21(1), 1 CrossRef PubMed.
- N. Jiang, M. Ye, J. Yan, C. Liao, M. Shang, G. Wang, R. Peng, J. Wu, T. Qi, L. Ni and Z. Guan, Int. J. Infect. Dis., 2022, 118, 230 CrossRef CAS PubMed.
- J. Yang, T. Huang, P. Zhao, C. Lin, Z. Feng, Y. Xue, W. Chen, Y. Zhao, B. Yang and H. Zheng, Microb. Pathog., 2021, 152, 104769 CrossRef CAS PubMed.
- M. C. Martínez-Jiménez, P. Munoz, M. Valerio, R. Alonso, C. Martos, J. Guinea and E. Bouza, J. Antimicrob. Chemother., 2015, 70(8), 2354 CrossRef PubMed.
- J. Yuan, R. Duan, H. Yang, X. Luo and M. Xi, Int. J. Nanomed., 2012, 7, 2921 CrossRef CAS PubMed.
- A. M. White, PhD Dissertation, Investigation of Impedance Spectroscopy for Detection of Ovarian Cancer, Portland State University, Portland, Oregon, 2012 Search PubMed.
- O. Onen, A. Sisman, N. D. Gallant, P. Kruk and R. Guldiken, Sensors, 2012, 12, 7432 Search PubMed.
- K. A. Lange, B. E. Rapp and M. Rapp, Anal. Bioanal. Chem., 2008, 391(5), 1509 CrossRef PubMed.
- M. Sajjad, N. B. Shaheed and S. Bappi, Proceedings of 2015 IEEE International WIE Conference on Electrical and Computer Engineering (WIECON ECE), IEEE, Piscataway, NJ, 2015, p. 358 Search PubMed.
- J. B. Chen, M. A. D. Neves and M. Thompson, Sens. Bio-Sens. Res., 2016, 11, 107 CrossRef.
- G. Mészáros, S. Akbarzadeh, B. De La Franier, Z. Keresztes and M. Thompson, Chemosensors, 2021, 9, 58 CrossRef.
- L. Wu, Y. Sha, W. Li, S. Wang, Z. Guo, J. Zhu, X. Su and X. Jiang, Sens. Actuators, B, 2016, 226, 62 CrossRef CAS.
- I. Lamberti, S. Scarano, C. L. Esposito, A. Antocca, G. Antonini, C. Tanzarell, V. De Francisis and M. Minunni, Methods, 2016, 97, 58 CrossRef CAS PubMed.
- O. Hosu, A. Ravalli, G. M. Lo Piccolo, C. Cristea, R. Sandulescu and G. Marrazza, Talanta, 2017, 166, 234 CrossRef CAS PubMed.
- A. Gazze, R. Ademefun, R. S. Conlan and S. R. Teixeira, J. Interdiscip. Nanomed., 2018, 3, 82 CrossRef CAS.
- V. Gedi, C. K. Song, G. B. Kim, J. O. Lee, E. Oh, B. S. Shin, M. Jung, J. Shim, H. Lee and Y. P. Kim, Sens. Actuators, B, 2018, 256, 89 CrossRef CAS.
- B. B. Nunna, D. Mandal, J. U. Lee, H. Singh, S. Zhuang, D. Misra, M. N. U. Bhuyian and E. S. Lee, Nano Convergence, 2019, 6, 3 CrossRef PubMed.
- A. Saadati, S. Hassanpour, F. Bahavarnia and M. Hasanzadeh, Anal. Methods, 2020, 12, 1639 RSC.
- P. S. Pakchin, M. Fathi, H. Ghanbari, R. Saber and Y. Omidi, Biosens. Bioelectron., 2020, 153, 112029 CrossRef PubMed.
- B. Szymańska, Z. Lukaszewski, K. Hermanowicz-Szamatowicz and E. Gorodkiewicz, Talanta, 2019, 206(1), 120187 Search PubMed.
- M. N. Abou-Omar, et al. , ACS Omega, 2021, 6, 20812 CrossRef CAS PubMed.
- R. M. Williams, et al. , Sci. Adv., 2018, 4(4), 19 Search PubMed.
- B. De La Franier and M. Thompson, Biosensors, 2020, 10, 13 CrossRef CAS PubMed.
- M. Akazawa and K. Hashimoto, Artif. Intell. Med., 2021, 120, 102164 CrossRef PubMed.
- A. B. Shinagare, P. Balthazar, I. K. Ip, R. Lacson, J. Liu, N. Ramaiya and R. Khorasani, J. Am. Coll. Radiol., 2018, 15, 1133 CrossRef PubMed.
- L. Zhang, J. Huang and L. Liu, J. Med. Syst., 2019, 43, 251 CrossRef PubMed.
- M. Wu, C. Yan, H. Liu and Q. Liu, Biosci. Rep., 2018, 38(3), BSR20180289 CrossRef CAS PubMed.
- J. Martínez-Más, A. Bueno-Crespo, S. Khazendar, M. Remezal-Solano, J.-P. Martínez-Cendán, S. Jassim, H. Du, H. Al Assam, T. Bourne and D. Timmerman, PLoS One, 2019, 14, e0219388 CrossRef PubMed.
- M. Aditya, I. Amrita, A. Kodipalli and R. J. Martis, 2021 5th Int. Conf. Electr. Electron. Commun. Comput. Technol. Optim. Tech., 2021, 279 Search PubMed.
- L. Akter and N. Akhter, Proceedings of the International Conference on Big Data, IoT, and Machine Learning, 2022, pp. 51–61 Search PubMed.
- E. Kawakami, J. Tabata, N. Yanaihara, T. Ishikawa, K. Koseki, Y. Iida, M. Saito, H. Komazaki, J. S. Shapiro, C. Goto, Y. Akiyama, R. Saito, M. Saito, H. Takano and K. Yamada, Clin. Cancer Res., 2019, 25, 3006 CrossRef CAS PubMed.
- B. Nguyen, C. Fong, A. Luthra, S. A. Smith, R. G. DiNatale, S. Nandakumar, H. Walch, W. K. Chatila, R. Madupuri, R. Kundra, C. M. Bielski, B. Mastrogiacomo, M. T. A. Donoghue, A. Boire, S. Chandarlapaty, K. Ganesh, J. J. Harding, C. A. Iacobuzio-Donahue, P. Razavi, E. Reznik, C. M. Rudin, D. Zamarin, W. Abida, G. K. Abou-Alfa, C. Aghajanian, A. Cercek, P. Chi, D. Feldman, A. L. Ho, G. Iyer, Y. Y. Janjigian, M. Morris, R. J. Motzer, E. M. O'Reilly, M. A. Postow, N. P. Raj, G. J. Riely, M. E. Robson, J. E. Rosenberg, A. Safonov, A. N. Shoushtari, W. Tap, M. Y. Teo, A. M. Varghese, M. Voss, R. Yaeger, M. G. Zauderer, N. Abu-Rustum, J. Garcia-Aguilar, B. Bochner, A. Hakimi, W. R. Jarnagin, D. R. Jones, D. Molena, L. Morris, E. Rios-Doria, P. Russo, S. Singer, V. E. Strong, D. Chakravarty, L. H. Ellenson, A. Gopalan, J. S. Reis-Filho, B. Weigelt, M. Ladanyi, M. Gonen, S. P. Shah, J. Massague, J. Gao, A. Zehir, M. F. Berger, D. B. Solit, S. F. Bakhoum, F. Sanchez-Vega and N. Schultz, Cell, 2022, 185, 563 CrossRef CAS PubMed , e11.
- Y. Zhang, S. Qazi and K. Raza, Saudi J. Biol. Sci., 2021, 28, 4069 CrossRef CAS PubMed.
- S. Pirhadi, K. Maghooli, N. Moteghaed, M. Garshasbi and S. Mousavirad, J. Med. Signals Sens., 2021, 11, 108 Search PubMed.
- A. Swiatly, S. Plewa, J. Matysiak and Z. J. Kokot, J. Ovarian Res., 2018, 11, 88 CrossRef CAS PubMed.
- W. Guan, M. Zhou, C. Y. Hampton, B. B. Benigno, L. D. E. Walker, A. Gray, J. F. McDonald and F. M. Fernández, BMC Bioinf., 2009, 10, 259 CrossRef PubMed.
- E. Garcia, C. Andrews, J. Hua, H. L. Kim, D. K. Sukumaran, T. Szyperski and K. Odunsi, J. Proteome Res., 2011, 10, 1765 CrossRef CAS PubMed.
- M. Grzeski, E. T. Taube, E. I. Braicu, J. Sehouli, V. Blanchard and O. Klein, Cancers, 2022, 14, 1021 CrossRef CAS PubMed.
- K. Kim, L. R. Ruhaak, U. T. Nguyen, S. L. Taylor, L. Dimapasoc, C. Williams, C. Stroble, S. Ozcan, S. Miyamoto, C. B. Lebrilla and G. S. Leiserowitz, Cancer Epidemiol., Biomarkers Prev., 2014, 23, 611 CrossRef CAS PubMed.
- A. Tiss, A. Hasan, A. Khadir, M. Dehbi and S. Dermime, Cancer Biomarkers: Minimal and Noninvasive Early Diagnosis and Prognosis, 2014, pp. 47–84 Search PubMed.
- I. Cadron, T. Van Gorp, D. Timmerman, F. Amant, E. Waelkens and I. Vergote, Gynecol. Oncol., 2009, 115, 497 CrossRef CAS PubMed.
- E. F. Petricoin, A. M. Ardekani, B. A. Hitt, P. J. Levine, V. A. Fusaro, S. M. Steinberg, G. B. Mills, C. Simone, D. A. Fishman, E. C. Kohn and L. A. Liotta, Lancet, 2002, 359(9306), 572–577 CrossRef CAS.
- H. M. Kordy, M. Hossein, M. Baygi and M. H. Moradi, J. Med. Signals Sens., 2012, 2, 161 CrossRef PubMed.
- K. L. Gant, A. N. Jambor, Z. Li, E. C. Rentchler, P. Weisman, L. Li, M. S. Patankar and P. J. Campagnola, Cancers, 2021, 13(11), 2794 CrossRef CAS PubMed.
- A. Saorin, E. Di Gregorio, G. Miolo, A. Steffan and G. Corona, Metabolites, 2020, 10, 419 CrossRef CAS PubMed.
- C. L. M. Morais, P. L. Martin-Hirsch and F. L. Martin, Analyst, 2019, 144, 2312 RSC.
- L. Fan, H. Wang, X. Wu, S. Wang, Y. Han and J. Wang, Laser Phys., 2022, 32, 035601 CrossRef.
- P. Giamougiannis, C. L. M. Morais, B. Rodriguez, N. J. Wood, P. L. Martin-Hirsch and F. L. Martin, Anal. Bioanal. Chem., 2021, 413, 5095 CrossRef CAS PubMed.
- Z. Yue, C. Sun, F. Chen, Y. Zhang, W. Xu, S. Shabbir, L. Zou, W. Lu, W. Wang, Z. Xie, L. Zhou, Y. Lu and J. Yu, Biomed. Opt. Express, 2021, 12, 2559 CrossRef CAS PubMed.
- S. Yao, W. Xiao, H. Chen, Y. Tang, Q. Song, Q. Zheng and N. Deng, Anal. Methods, 2019, 11, 4814 RSC.
- C. E. Barr, G. Funston, L. T. A. Mounce, P. W. Pemberton, J. D. Howe and E. J. Crosbie, Pract. Lab. Med., 2021, 26, e00235 CrossRef CAS PubMed.
- A. Angeloni, C. De Vito, A. Farina, D. Terracciano, M. Cennamo, R. Passerini, F. Bottari, A. Schirinzi, R. Vettori, A. Steffan, V. Mais, F. Coghe, L. Della Corte, G. Bifulco, V. Baccolini, E. Berardelli, G. Migliara and E. Anastasi, J. Clin. Med., 2022, 11, 1994 CrossRef CAS PubMed.
- B. M. Nolen and A. E. Lokshin, Mol. Diagn. Ther., 2013, 17(3), 139 CrossRef CAS PubMed.
- S. Panikar, N. Banu, J. Haramati, G. Y. Gutierrez-Silerio, B. E. Bastidas-Ramirez, M. C. Tellez-Bañuelos, T. A. Camacho-Villegas, S. del Toro-Arreola and E. De la Rosa, Anal. Chim. Acta, 2020, 1138, 110–122 CrossRef CAS PubMed.
- P. Mahmoodi, M. Fani, M. Rezayi, A. Avan, Z. Pasdar, E. Karimi, I. S. Amiri and M. Ghayour-Mobarhan, BioFactors, 2018, 45(2), 101–117 CrossRef PubMed.
- W. Ren, S. I. Mohammed, S. Wereley and J. Irudayaraj, Anal. Chem., 2019, 91(4), 2876–2884 CrossRef CAS PubMed.
- H. G. Ahmed, S. H. Bensumaidea, F. D. Alshammari, F. S. H. Alenazi, B. A. Almutlaq, M. Z. Alturkstani and I. A. Aladani, Asian Pac. J. Cancer Prev., 2017, 18(6), 1543–1548 Search PubMed.
- S. Pareek, V. Rout, U. Jain, M. Bharadwaj and N. Chauhan, ACS Omega, 2021, 6(46), 31037–31045 CrossRef CAS PubMed.
- S. Wang, L. Li, H. Jin, T. Yang, W. Bao, S. Huang and J. Wang, Biosens. Bioelectron., 2013, 41, 205–210 CrossRef CAS PubMed.
- H. Wang, T. Lakshmipriya, Y. Chen and S. C. B. Gopinath, BioMed Res. Int., 2019, 2019, 2807123 Search PubMed.
- A. R. Correia, I. Sampaio, E. J. Comparetti, N. C. S. Vieira and V. Zucolotto, Talanta, 2021, 233, 122506 CrossRef CAS PubMed.
- D. Lu, Z. Li, Y. Gu, S. Ge, Y. Mao, Y. Gu and X. Cao, Mater. Chem. Front., 2022, 6, 1331–1343 RSC.
- L. Yang, X. Huang, L. Sun and L. Xu, Sens. Actuators, B, 2016, 224, 863 CrossRef CAS.
- R. Sharma, S. E. Deacon, D. Nowak, S. E. George, M. P. Szymonik, A. A. S. Tang, D. C. Tomlinson, A. G. Davies, M. J. McPherson and C. Wälti, Biosens. Bioelectron., 2016, 80, 607 CrossRef CAS PubMed.
- L. Li, C. Cheng, H. Yang, H. Ye, X. Luo and M. Xi, Acta Phys. Pol., A, 2020, 138(3), 338–344 CrossRef CAS.
- J. Martinez-Perdiguero, A. Retolaza, L. Bujanda and S. Merino, Talanta, 2014, 119, 492 CrossRef CAS PubMed.
- S. Dehghani, R. Nosrati, M. Yousefi, A. Nezami, F. Soltani, S. M. Taghdisi, K. Abnous, M. Alibolandi and M. Ramezani, Biosens. Bioelectron., 2018, 110, 23 CrossRef CAS PubMed.
- S. Shan, Z. He, S. Mao, M. Jie, L. Yi and J. Lin, Talanta, 2017, 171, 197 CrossRef CAS PubMed.
- X. Li, X. Ding and J. Fan, Analyst, 2015, 140(23), 7918 RSC.
- Z. Chen, C. Zhang, X. Li, H. Ma, C. Wan, K. Li and Y. Lin, Biosens. Bioelectron., 2015, 65, 232 CrossRef CAS PubMed.
- Q. Zhang, Y. Qing, X. Huang, C. Li and J. Xue, Mater. Lett., 2018, 211, 348 CrossRef CAS.
- B. Özcan and M. K. Sezgintürk, Talanta, 2021, 225, 121985 CrossRef PubMed.
- R. Sung and Y. S. Heo, Biosensors, 2020, 11(1), 7 CrossRef PubMed.
- C. Zhang, L. Liu, H. Li, J. Hu, J. Zhang, H. Zhou, Z. Zhang and X. Du, Sens. Actuators, B, 2022, 353, 131074 CrossRef CAS.
- J. Cai, X. Gou, B. Sun, W. Li, D. Li, J. Liu, F. Hu and Y. Li, Biosens. Bioelectron., 2019, 137, 88 CrossRef CAS PubMed.
- Y. He, J. Sun, X. Wang and L. Wang, Sens. Actuators, B, 2015, 221, 792 CrossRef CAS.
- Y. He, X. Wang, Y. Zhang, F. Gao, Y. Li, H. Chen and L. Wang, Talanta, 2013, 116, 816 CrossRef CAS PubMed.
- A. Sankiewicz, A. Hermanowicz, A. Grycz, Z. Łukaszewski and E. Gorodkiewicz, Anal. Methods, 2021, 13(5), 642 RSC.
- T. Kalyani, A. Sangili, A. Nanda, S. Prakash, A. Kaushik and S. K. Jana, Bioelectrochemistry, 2021, 139, 107740 CrossRef CAS PubMed.
- T. Kalyani, A. Nanda and S. K. Jana, Anal. Chim. Acta, 2021, 1146, 146 CrossRef CAS PubMed.
- A. Pal, S. Biswas, S. P. O. Kare, P. Biswas, S. K. Jana, S. Das and K. Chaudhury, Sens. Actuators, B, 2021, 346, 130460 CrossRef CAS.
- U. Parlatan, M. T. Inanc, B. Y. Ozgor, E. Oral, E. Bastu, M. B. Unlu and G. Basar, Sci. Rep., 2019, 9(1), 1 CrossRef PubMed.
- P. Vieira-Baptista, A. R. Silva, M. Costa, T. Aguiar, C. Saldanha and C. Sousa, BJOG, 2021, 128(8), 1344 CrossRef CAS PubMed.
- P. Foessleitner, H. Kiss, J. Deinsberger, J. Ott, L. Zierhut and A. Farr, J. Fungi, 2021, 7(3), 233 CrossRef CAS PubMed.
- F. Liu, G. Xiang, R. Yuan, X. Chen, F. Luo, D. Jiang, S. Huang, Y. Li and X. Pu, Biosens. Bioelectron., 2014, 60, 210 CrossRef CAS PubMed.
- P. Seshadri, K. Manoli, N. Schneiderhan-Marra, U. Anthes, P. Wierzchowiec, K. Bonrad, C. Di Franco and L. Torsi, Biosens. Bioelectron., 2018, 104, 113 CrossRef CAS PubMed.
- W. Jing, Y. Wang, Y. Yang, Y. Wang, G. Ma, S. Wang and N. Tao, ACS Nano, 2019, 13(8), 8609 CrossRef CAS PubMed.
- M. Soler, A. Belushkin, A. Cavallini, C. Kebbi-Beghdadi, G. Greub and H. Altug, Biosens. Bioelectron., 2017, 94, 560 CrossRef CAS PubMed.
- L. Cheng, Y. He, Y. Yang, J. Chen, H. He, Y. Liu, Z. Lin and G. Hong, Anal. Chim. Acta, 2022, 1197, 339496 CrossRef CAS PubMed.
- C. Y. Chiang, M. L. Hsieh, K. W. Huang, L. K. Chau, C. M. Chang and S. R. Lyu, Biosens. Bioelectron., 2010, 26(3), 1036 CrossRef CAS PubMed.
- A. R. Cardoso, M. H. de Sá and M. G. F. Sales, Bioelectrochemistry, 2019, 130, 107287 CrossRef CAS PubMed.
- E. B. Aydın, M. Aydın and M. K. Sezgintürk, Sens. Actuators, B, 2018, 270, 18 CrossRef.
| This journal is © The Royal Society of Chemistry 2022 |