
 Open Access Article
 This Open Access Article is licensed under a Creative Commons Attribution-Non Commercial 3.0 Unported Licence
Rapid quantification of ethanol content in aqueous solutions using a ratiometric fluorescent sensor†
Tianruo
Shen
 ,
Davin
Tan
,
Meyammai
Shanmugham
and
Xiaogang
Liu
*
,
Davin
Tan
,
Meyammai
Shanmugham
and
Xiaogang
Liu
*
Fluorescence Research Group, Singapore University of Technology and Design (SUTD), 8 Somapah Road, Singapore 487372, Singapore. E-mail: xiaogang_liu@sutd.edu.sg
First published on 24th May 2022
Abstract
In this work, we developed a simple method using a low-cost and commercially available organic dye – acridine – for the ratiometric determination of ethanol concentrations. This method enabled improved measurements with enhanced stability, high accuracy, a large testing range (0–100% v/v), and fast processing by taking static images via a smartphone.
Ethanol (EtOH) is one of the most important raw materials for industrial production and has been extensively used in many fields, such as medicine, beverages, and fuel additives.1–3 In many applications, we need to monitor the EtOH content quickly and accurately.4,5 Hence, the development of novel techniques, which are inexpensive and provide high accuracy and fast response for quantitatively sensing EtOH concentrations, is urgently required.6,7 Yet, designing eco-friendly EtOH sensors with high-performance readability, excellent reliability, and immediate availability remains a huge challenge.
Currently, various well-equipped techniques, such as titration,8,9 densitometry,10 spectrophotometry,11 gas chromatography (GC),12 high-performance liquid chromatography (HPLC),13 and electrochemical methods,14,15 have been utilized for the measurement of EtOH concentrations (Table S1†). The alcoholmeter, based on densitometry, is a common industrial device for the rapid detection of EtOH concentration.16 However, such measurements usually require expensive instruments. One of the most generalizable chemical methods was proposed by Fischer,8 which has been extensively used as a standard to detect EtOH content in liquid samples.9 However, this method requires several toxic reagents, complicated operation procedures, and noticeable reagent consumption. The implementation and disadvantages of this method have been widely discussed in previous reports.17,18 To reduce reagent waste and lower the use of toxic materials, Shahvar and co-workers introduced a portable smartphone-based sensor for detecting water content in ethanolic solutions.18 This sensor relied on the discoloration of cobalt(II) chloride due to water, and it can be monitored using a smartphone camera. This simple method demonstrated good performance for determining water content (from 0.05 to 2.00% v/v) in several commercial ethanolic products. Nevertheless, the narrow detection range and the use of environmentally toxic cobalt salts greatly limit the applicability of this method (i.e., quantifying 75% v/v medical EtOH).
In comparison, fluorescent sensors, with the advantages of high spatial and temporal resolution, possess desirable traits such as high sensitivity and rapid response and have been attracting increasing research interest.19–21 For instance, Hu and co-workers designed a ratiometric fluorescent sensor to monitor the EtOH concentration in water based on polyvinylpyrrolidone copper nanoclusters (PVP-Cu NCs).19 The PVP-Cu NCs exhibited green fluorescence (∼520 nm) in water and blue fluorescence (∼450 nm) in EtOH, and ratiometric detection from 0 to 100% v/v with a 0.1% v/v sensitivity could be achieved. The observed spectral shift was attributed to the changes in the hydration shell in different water–EtOH mixtures. However, the PVP-Cu NCs and other Cu NC-based probes typically require complex synthesis and are often environmentally unfriendly, resulting in their limited commercial availability. In contrast, some readily and commercially available organic fluorophores, which exhibit solvent-dependent spectral properties, might be a better alternative. To this end, Rohatgi-Mukherjee and Lopez-Arbeloa previously demonstrated the potential of rhodamine B (RhB) as a solvent-sensitive probe by systematically investigating its spectral properties in different water–EtOH mixtures.22 Passos and co-workers further developed an optical probe for detecting water content in bioethanol using RhB as a fluorophore. Their study shows that ultraviolet-visible (UV-vis) absorbance, fluorescence emission intensity, and fluorescence lifetime values exhibited excellent linear correlations with water content from 0 to 10% w/w.23 However, the concentration of RhB must be strictly fixed during measurement to minimize aggregation effects,24 which limits the detection range, reliability, and generalization of this method.
Herein, we successfully developed a simple method to construct a single-fluorophore ratiometric sensor for quantifying the EtOH content in an aqueous solution using acridine. Acridine is commercialized, low cost, and displays solvent-dependent spectral properties in both peak emission wavelength (λem) and fluorescence intensity (F.I.) from EtOH to water, making it possible to ratiometrically determine EtOH content with excellent stability and reliability. This method can be easily implemented by simply capturing and analyzing static images obtained using a smartphone camera. The working mechanism was further buttressed by quantum chemical calculations.
The emission properties of acridine in water (i.e., the shape of fluorescence emission spectra and the quantum yield) were significantly distinct from those in other solvents.25 Inspired by these unique fluorescence properties, we purchased acridine to evaluate its optical properties and potential applications. First, the emission spectrum of acridine in water (dielectric constant ε = 78.3553) was compared with those in five aprotic solvents and three alcoholic solvents, with varying polarities (Fig. 1a and Tables S2 and S3†). These solvents include 1,4-dioxane (Diox, ε = 2.2099), ethyl acetate (EAC, ε = 5.9876), acetonitrile (ACN, ε = 35.688), dimethylformamide (DMF, ε = 37.219), dimethyl sulfoxide (DMSO, ε = 46.826), EtOH (ε = 24.582), MeOH (ε = 32.613), and ethylene glycol (EG, ε = 40.245). In good agreement with previous observations,25 acridine exhibited a hypsochromic shift of ∼13 nm in λem from water to all tested alcohols, accompanied by an appreciable decline in F.I. (Fig. 1a and S1†). We also conducted a detailed investigation of the fluorescence properties of acridine in various EtOH–water mixtures at 25 °C (Fig. 1b). As expected, the λem peak of acridine was blue-shifted from 429 nm at 0 EtOH content (pure water) to 415 nm at 100% v/v EtOH content (pure EtOH), accompanied by a continuous decrease in the peak F.I. value. Similar trends were observed when measurements were taken at 15 °C and 35 °C (Fig. S2a and b†).
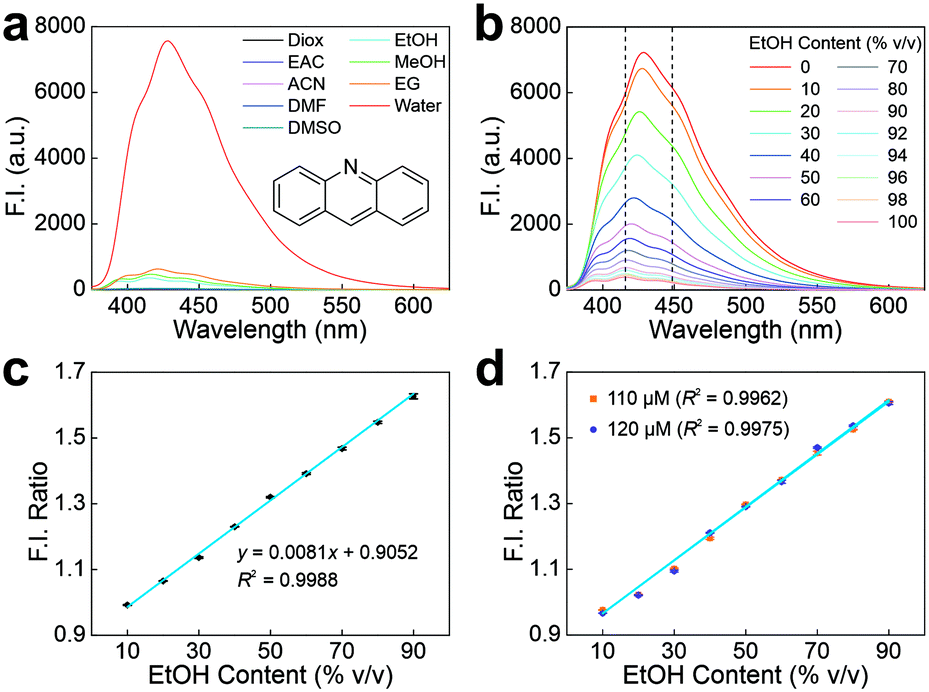 | ||
| Fig. 1 (a) The emission spectra of acridine in different solvents at room temperature; the inset shows the molecular structure of acridine. (b) The emission spectra of acridine in various EtOH–water mixtures at 25 °C; the two dashed lines highlight the F.I. at 415 nm and 448 nm, respectively. The EtOH content-dependence of F.I. ratios (the ratio of F.I. values at 415 nm and 448 nm) with the corresponding linear fitting curves for (c) 100 μM acridine and (d) acridine of other concentrations; the inset shows the best linear fitting equations. | ||
The gradual spectral shifts and significant intensity variations in various EtOH–water mixtures allow the establishment of a ratiometric EtOH sensor using only acridine (concentration = 100 μM). Two emission wavelengths of 415 nm and 448 nm were selected to construct F.I. ratios as a function of the EtOH content (Fig. 1b and c and S2c and d†). Analysis of the measurements revealed that the regression curves of the F.I. ratios exhibited an excellent linear relationship with the volume fraction of EtOH in the range of 10 to 90% v/v (R2 > 0.99). In addition, another linear relationship between these two factors can be established from 90 to 100% v/v (Fig. S2e†). Our analysis also shows a linear fitting equation that slightly changes as the temperature increases (Fig. S2f†). Such variations mean that the temperature should be strictly controlled to improve the measurement accuracy.
To demonstrate the stability and accuracy of this single-acridine ratiometric sensor, acridine solutions at two other concentrations (110 μM and 120 μM) in various EtOH–water mixtures (from 10 to 90% v/v) were prepared. These concentration variations aimed to simulate two possible error sources during experiments: (1) the errors in weighing and volume measurements while preparing the stock solution; and (2) the photobleaching of acridine during measurements, which can reduce the dye concentration upon prolonged illumination exposure. Subsequently, linear calibration curves for these varied concentrations (Fig. S3† and 1d) were constructed. The results showed that the linear regression curve remained almost unchanged with excellent R2 values, indicating that ratiometric measurements effectively eliminated errors related to the dye concentration variations (Fig. 1c and d). We also showed that this ratiometric measurement remains stable, even in the presence of impurities (i.e., MeOH, EG, and glycerol; Fig. S4–S6 and Table S4†). This enhanced stability is highly favored in practical applications.
It is worth noting that the acridine solution should not be too diluted due to the potential protonation effect as the pH of water may differ from batch to batch.26,27 To this end, the UV-vis absorption and emission spectra of acridine in three pH buffer solutions were investigated (Fig. S7a and b†). From pH = 7.00 to pH = 4.00, a new absorption band was found between 370 nm and 450 nm, with a 52 nm bathochromic shift in λem and a two-fold reduction in F.I. This observation was consistent with previous reports,26 and can be explained by the protonation of acridine molecules, which possess a pKa value of ∼5.6.28 As the pH of tap water could vary from 6.5 to 8.5,29 weakly acidic aqueous solutions may affect the fluorescence of acridine and thus compromise the accuracy of EtOH quantification.
The pH-induced measurement errors could be minimized by increasing the concentration of acridine, i.e., to ∼100 μM. To this end, we compared the spectral properties of acridine solutions with various concentrations in weakly acidic water (pH ≈ 6.5; Fig. S7c and d†). The spectra revealed that the λem of low concentration solutions (1 μM and 10 μM) experienced a distinct redshift (due to partial protonation). However, the spectra of the high concentration sample (100 μM) remain unchanged in comparison to that in neutral water, as signals from neutral acridine are dominating. The recommended high concentration of acridine is also beneficial in suppressing potential noise emissions from impurities in industrial-grade solvents, ensuring a high signal-to-noise ratio during the measurement.
Subsequently, the accuracy of this method is evaluated against commercially available ethanolic solutions, calibrated at 90% v/v EtOH solution (Fig. S8†). Measurements revealed that the average values (89.02% v/v and 90.04% v/v, based on two linear calibration curves for 10–90% v/v and 90–100% v/v, respectively) are close to the calibrated value, which further denotes the reliability of this method (Table S5†). It is worth mentioning that we are using a linear calibration curve to quantify the EtOH content for simplicity. Further improvements in the detection accuracy can be easily obtained via nonlinear fittings.
To further improve the operability and practicability of this method, a simple smartphone-based sensing procedure was developed (Fig. 2a). A reference (prepared in water) and another acridine sample were placed in a camera obscura. This obscura was installed with a UV light source (excitation wavelength, λex = 365 nm) as well as a UV filter to prevent the leakage of UV excitation light into the camera. A static image of the two samples was captured under UV illumination. Various samples of known EtOH concentrations from 0–100% v/v were prepared and photographed, along with the reference (Fig. S9†). Subsequently, the pixel intensity values from the two samples were extracted to establish the ratios in both blue and green channels (Tables S6–S9†). Notably, the ratio of the blue channel exhibited a gradual decline with increasing EtOH content (Fig. 2b). In particular, there is an excellent linear relationship between the ratio and EtOH content from 20 to 100% v/v (R2 = 0.9920). From 0 to 20% v/v EtOH content, the ratio in the blue channel did not show a downward trend due to overexposure to the smartphone. However, we discovered that the intensity ratio of the green channel yielded an excellent linear relationship (R2 = 0.9918) within this range. Hence, the problem caused by overexposure can be effectively circumvented by establishing an EtOH-dependent relationship in the green channel. Similarly, this analysis revealed that the green channel also exhibited good performance (detected as 89.08% v/v) with a 1.02% relative error during the measurement of commercialized EtOH content (90% v/v, Fig. S10 and Table S10†).
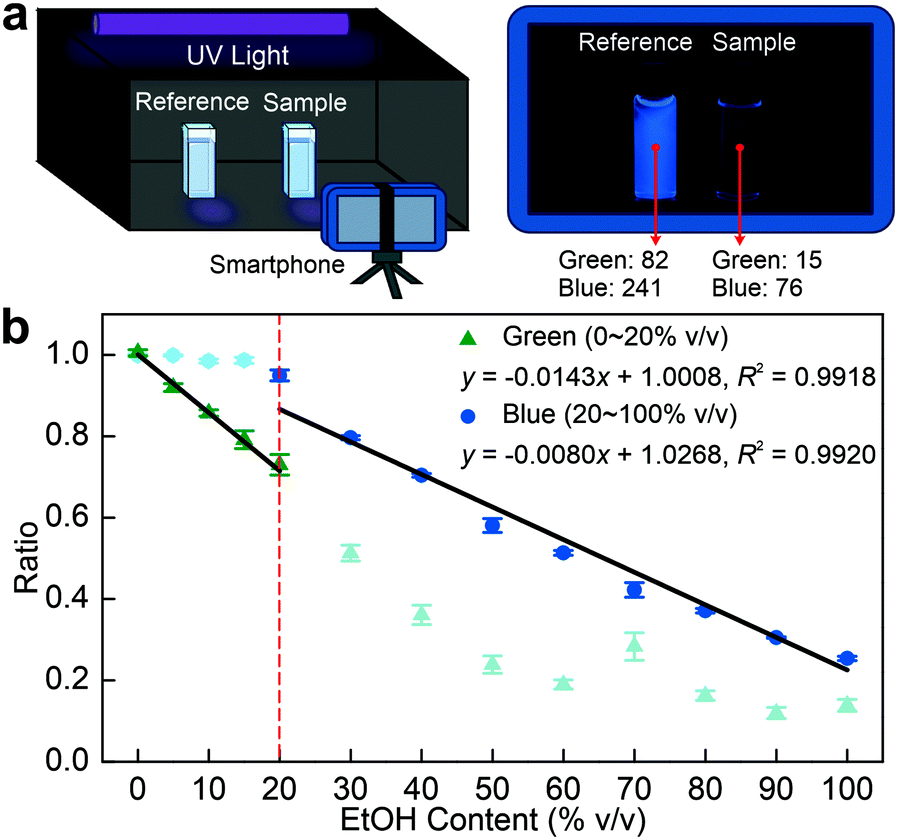 | ||
| Fig. 2 (a) Schematic illustration of the smartphone-based ratiometric sensor; (b) the EtOH content-dependence of intensity ratios from green and blue channels (with the corresponding linear fitting curves). The insets demonstrate the best linear fitting equations; the dots with light colors were not used to construct the linear fitting curves. | ||
Subsequently, to rationalize the working mechanism of this fluorescent sensor, computational calculations were performed to investigate the impacts of solvent polarity and hydrogen bonding effects on the optical properties of acridine using the ωB97XD functional.30 Our computational results revealed that the bright π–π* state (a locally-excited state) is the lowest state during vertical excitation in both a vacuum and water (Fig. 3). However, the dark n–π* state (a charge-transfer state) with a low oscillator strength (f = 0.0004) becomes lower than the bright π–π* state during the emission (due to state-crossing upon photoexcitation) in a vacuum, which corresponds to fluorescence quenching in non-polar systems. When the system was modelled using the SMD solvent model in water,31 the vertical excitation energy of the dark n–π* state increased by 0.179 eV and that of the bright π–π* state decreased by 0.062 eV in the Franck Condon state, resulting in a higher stabilization of the π–π* state [Δ(LE − CT) = −0.494 eV] than that in a vacuum [Δ(LE − CT) = −0.253 eV]. As a result, the π–π* state remains the most stable during emission, resulting in the enhancement of its fluorescence in water. These computational results are consistent with our experimental observations. Furthermore, the hydrogen bonding effect was simulated by attaching a water molecule to the nitrogen atom in acridine. Our results showed that the introduction of the hydrogen bond can further enhance the energy gap [Δ(LE − CT) = −0.741 eV] between the two excited states, suggesting the stabilization of the bright π–π* state (Fig. S11†). In addition, the π–π* state is further lowered by 0.020 eV during emission. It is worth noting that the reduced de-excitation energy from a vacuum to water is consistent with the positive solvatochromism of acridine. Calculations via other functionals yielded similar trends (Fig. S12–S16†). These results strongly suggest that the significant enhancement of fluorescence and the redshift of acridine in water are affected by both solvent polarity and hydrogen bonding effects.
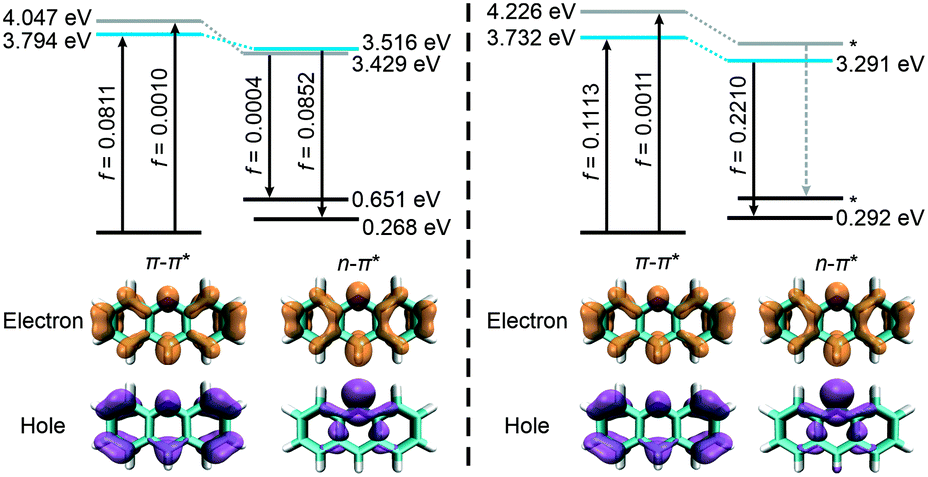 | ||
| Fig. 3 Energy levels of the dark n–π* and bright π–π* states of acridine during the vertical excitation and emission procedures in a vacuum (left) and water (right). The bottom row illustrates the hole–electron distributions in excitation (* means the state was not optimized). | ||
To qualitatively evaluate the importance of solvent polarity and hydrogen bond strength to fluorescence enhancement, reported quantum yields of acridine in different solvents were fitted to three solvatochromic parameters as previously established by Kamlet et al.,32 including the solvent dipolarity/polarizability index (π*), solvent hydrogen-bond acceptor (HBA) basicity (β), and solvent hydrogen-bond donor (HBD) acidity (α) with the multiple linear regression method (Tables S11 and S12†). The fitting results showed that the absolute coefficient value of α (11.908) is ∼8.7 times larger than that of π* (1.376), indicating that the solvent hydrogen-donating strength plays a more important role in enhancing the F.I. than solvent polarity.
Conclusions
In conclusion, a simple method to construct a ratiometric EtOH content sensor based on acridine was demonstrated. The synergistic effect of solvent polarity and hydrogen bond strength enabled distinct optical properties from EtOH to water, which involves a ∼15 nm bathochromic shift in the λem and a significant enhancement in the F.I. This sensor displayed a good performance in quantifying the EtOH content from 10 to 100% v/v in EtOH–water binary mixtures. Additionally, the ease of implementation of this method was demonstrated by simply taking static images using a smartphone and analyzing intensities from the green and blue channels to determine the EtOH content, within a wide range of 0–100% v/v. The ratiometric sensor based on acridine circumvents the need for toxic solvents, excess reagents, and complex synthesis of custom fluorophores. Besides, it also provides better stability, reliability, and accuracy by mitigating the dye concentration inconsistencies stemming from sample preparation and photobleaching. We hope that this work can inspire researchers to explore other commercially available dyes from the current chemical database for the further development of functional fluorescent probes that are readily available.Author contributions
T. S.: conceptualization, methodology, investigation, formal analysis, visualization, writing – original draft, and writing – review & editing; D. T.: methodology, validation, and writing – review & editing; M. S.: investigation and writing – review & editing; X. L.: project administration, data curation, validation, supervision, funding acquisition, and writing – review & editing.Conflicts of interest
There are no conflicts to declare.Acknowledgements
This work is supported by the Ministry of Education, Singapore (No. MOE-MOET2EP10120-0007) and the Agency for Science, Technology and Research (A*STAR, Singapore) under its Advanced Manufacturing and Engineering Program (No. A2083c0051). The authors are grateful for the super-computing resources from the National Supercomputing Centre Singapore and SUTD. T. S. acknowledges the scholarship support from the Doctor of Philosophy Program at SUTD.Notes and references
- J. Sun and Y. Wang, ACS Catal., 2014, 4, 1078–1090 CrossRef CAS.
- Y. Sun and J. Cheng, Bioresour. Technol., 2002, 83, 1–11 CrossRef CAS PubMed.
- L. V. Mattos, G. Jacobs, B. H. Davis and F. B. Noronha, Chem. Rev., 2012, 112, 4094–4123 CrossRef CAS PubMed.
- J. Abel and S. Virtanen, Corros. Sci., 2015, 98, 318–326 CrossRef CAS.
- Y.-U. Jung, M. G. Choi, S. H. Lee and S.-K. Chang, Sens. Actuators, B, 2017, 241, 342–348 CrossRef CAS.
- G. M. Wen, S. M. Shuang, C. Dong and M. M. F. Choi, Chin. Chem. Lett., 2012, 23, 481–483 CrossRef CAS.
- C. Sun, S. Rajasekhara, Y. Chen and J. B. Goodenough, Chem. Commun., 2011, 47, 12852–12854 RSC.
- K. Fischer, Angew. Chem., 1935, 48, 394–396 CrossRef CAS.
- W. Seaman, W. McComas Jr and G. Allen, Anal. Chem., 1949, 21, 510–512 CrossRef CAS.
- X. Li, J. Zhang, Y. Xue and L. Qiu, Measurement, 2022, 194, 110955 CrossRef.
- S. Kumoi, K. Oyama, T. Yano, H. Kobayashi and K. Ueno, Talanta, 1970, 17, 319–327 CrossRef CAS PubMed.
- O. Bennett, Anal. Chem., 1964, 36, 684–684 CrossRef CAS.
- F. Tagliaro, R. Dorizzi, S. Ghielmi and M. Marigo, J. Chromatogr. B: Biomed. Sci. Appl., 1991, 566, 333–339 CrossRef CAS.
- C. Shan, H. Yang, D. Han, Q. Zhang, A. Ivaska and L. Niu, Biosens. Bioelectron., 2010, 25, 1504–1508 CrossRef CAS PubMed.
- S. Cinti, M. Basso, D. Moscone and F. Arduini, Anal. Chim. Acta, 2017, 960, 123–130 CrossRef CAS PubMed.
- P. D. Thungon, A. Kakoti, L. Ngashangva and P. Goswami, Biosens. Bioelectron., 2017, 97, 83–99 CrossRef CAS PubMed.
- L. Zhou, X. H. Liu, H. X. Bai and H. J. Wang, Chin. Chem. Lett., 2011, 22, 189–192 CrossRef CAS.
- A. Shahvar, D. Shamsaei and M. Saraji, Measurement, 2020, 150, 107068 CrossRef.
- X. Hu, H. Cao, W. Dong and J. Tang, Talanta, 2021, 233, 122480 CrossRef CAS PubMed.
- R. Huang, K. Liu, H. Liu, G. Wang, T. Liu, R. Miao, H. Peng and Y. Fang, Anal. Chem., 2018, 90, 14088–14093 CrossRef CAS PubMed.
- S. S. Bozkurt, E. Merdivan and Y. Benibol, Microchim. Acta, 2010, 168, 141–145 CrossRef CAS.
- K. Rohatgi-Mukherjee and I. Lopez-Arbeloa, J. Photochem. Photobiol., A, 1991, 58, 277–288 CrossRef CAS.
- W. E. Passos, I. P. Oliveira, F. S. Michels, M. A. G. Trindade, E. A. Falcão, B. S. Marangoni, S. L. Oliveira and A. R. L. Caires, Renewable Energy, 2021, 165, 42–51 CrossRef CAS.
- F. L. Arbeloa, P. R. Ojeda and I. L. Arbeloa, Chem. Phys. Lett., 1988, 148, 253–258 CrossRef.
- L. A. Diverdi and M. R. Topp, J. Phys. Chem., 1984, 88, 3447–3451 CrossRef CAS.
- O. Ito, E. Ito, Y. Yoshikawa, A. Watanabe and H. Kokubun, J. Cleaner Prod., 1996, 92, 227–230 CAS.
- E. T. Ryan, T. Xiang, K. P. Johnston and M. A. Fox, J. Phys. Chem. A, 1997, 101, 1827–1835 CrossRef CAS.
- G. Jackson and G. Porter, Proc. R. Soc. London, Ser. A, 1961, 260, 13–30 CAS.
- S. Khalid, B. Murtaza, I. Shaheen, I. Ahmad, M. I. Ullah, T. Abbas, F. Rehman, M. R. Ashraf, S. Khalid, S. Abbas and M. Imran, J. Cleaner Prod., 2018, 181, 224–234 CrossRef CAS.
- J. D. Chai and M. Head-Gordon, Phys. Chem. Chem. Phys., 2008, 10, 6615–6620 RSC.
- A. V. Marenich, C. J. Cramer and D. G. Truhlar, J. Phys. Chem. B, 2009, 113, 6378–6396 CrossRef CAS PubMed.
- M. J. Kamlet, J. L. M. Abboud, M. H. Abraham and R. Taft, J. Org. Chem., 1983, 48, 2877–2887 CrossRef CAS.
Footnote |
| † Electronic supplementary information (ESI) available: Computational and experimental details and results. See DOI: https://doi.org/10.1039/d2sd00063f |
| This journal is © The Royal Society of Chemistry 2022 |