
 Open Access Article
 This Open Access Article is licensed under a
 Creative Commons Attribution 3.0 Unported Licence
Comparing two cortisol aptamers for label-free fluorescent and colorimetric biosensors†
Chenqi
Niu
ab,
Yuzhe
Ding
b,
Chong
Zhang
*a and
Juewen
Liu
 *b
*b
aMOE Key Laboratory for Industrial Biocatalysis, Institute of Biochemical Engineering, Department of Chemical Engineering, Tsinghua University, Beijing, 100084, China. E-mail: chongzhang@mail.tsinghua.edu.cn
bDepartment of Chemistry, Waterloo Institute for Nanotechnology, University of Waterloo, 200 University Avenue West, Waterloo, Ontario N2L 3G1, Canada. E-mail: liujw@uwaterloo.ca
First published on 5th April 2022
Abstract
Cortisol is a stress hormone and abnormal secretion of cortisol is related to many chronical diseases and neurological disorders. To detect cortisol, two DNA aptamers have been reported so far: 15-1 and CSS.1. In this work, two truncated aptamers were compared: 40-mer 15-1a and 42-mer CSS.1 using isothermal titration calorimetry, where only CSS.1 showed binding with a Kd of 245 nM. We then explored the label-free fluorescence and colorimetric detection methods of cortisol. Using SYBR Green I to stain the aptamers, CSS.1 showed 53% saturated fluorescence enhancement, and this assay allowed us to conclude that its binding was independent of Na+ and only weakly dependent on Mg2+. Moreover, two mutants and three truncated aptamers of CSS.1 were evaluated. In addition, cortisol had no effect on the colloidal stability of gold nanoparticles (AuNPs) and did not affect DNA adsorption by AuNPs, allowing a colorimetric assay of cortisol binding. While a cortisol-dependent color change was observed, this assay was interfered by other molecules that can cause aggregation of AuNPs such as dopamine. Since none of these assays showed cortisol binding with the truncated 15-1a aptamer, we concluded that 15-1a cannot bind to cortisol, and a more careful truncation study on the original aptamer is needed.
Introduction
Cortisol is a stress hormone secreted by the adrenal gland during psychological or physical stresses.1 Cortisol is the end-product of the hypothalamic–pituitary–adrenal (HPA) axis.2 The accumulation of cortisol increases the concentrations of fat and amino acids, which can lead to many diseases (e.g., Cushing's disease, autoimmune disease, cardiovascular complications, and type 2 diabetes) and neurological disorders (depression and anxiety disorders).3,4 In contrast, abnormally low cortisol levels can lead to Addison's disease, which results in hypercholesterolemia, weight loss, and chronic fatigue.4 The serum total cortisol concentrations in COVID-19 patients were higher than those in patients without the infection.5 Therefore, methods for measuring cortisol levels have been extensively developed over the past decade to quantitatively analyze stress levels.While immunoassays have been used for the detection of cortisol in serum,6–8 these assays are in a competitive format and thus are signal-off sensors. In this regard, aptamer-based biosensors have the advantage of producing signal-on sensors.9,10 In addition, DNA aptamers are more stable, more cost-effective, and more consistent than antibodies.11–13 So far, two DNA aptamers for cortisol have been reported. In 2014, Martin et al. reported a full-length 85-nucleotide (nt) aptamer, and the random region contained 40-nt.14 Using microscale thermophoresis, its Kd was determined to be 16.1 μM, which was comparable with the 6.9 μM Kd obtained from equilibrium dialysis. Many subsequent biosensor studies used the full-length aptamer,15–19 while some also used only the 40-nt random region, although rigorous binding assays to confirm binding of the truncated aptamer have yet to be performed.20–23
In 2017, the Stojanovic group selected a few high-affinity aptamers for steroids, including cortisol and they bind with Kd's ranging from 30 nM to 140 nM.24 These aptamers were much less used for biosensors probably because they were reported later.25 We noticed that both aptamer selection experiments were performed by the immobilization of the DNA libraries,9,26–30 although the library design was different.
Label-free aptamer biosensors are attractive since they are cost-effective.31–34 At the same time, they can also offer fundamental insights into aptamer binding reactions. Two types of label-free biosensors are very common. One type uses DNA staining dyes such as SYBR Green I (SGI) and thioflavin T, resulting in a fluorescence intensity change upon target binding.34,35 The other type uses gold nanoparticles (AuNPs).36 For this method to work, it is important to study the interaction between AuNPs and cortisol. If they interact strongly, AuNP-related biosensors (e.g. surface plasmon resonance, surface-enhanced Raman scattering, and even electrochemistry with gold electrodes) need to consider such interactions.31 While AuNP-based detection has also been used for the cortisol aptamers,15,20 little was known regarding the interaction between cortisol and AuNPs.
In this work, we aimed to achieve three related goals. First, we compared these two aptamers side-by-side using a range of binding assays. Second, we studied the interaction between cortisol and AuNPs and tested whether the AuNP-based label-free colorimetric assay can be applied for the detection of cortisol or not. Finally, we also studied a fluorescent label-free biosensor and used it to understand the binding properties of the aptamers.
Materials and methods
Chemicals
All of the DNA samples were purchased from Integrated DNA Technologies (IDT, Coralville, IA). The sequences and modifications of the DNAs are listed in Table S1.† Cortisol, deoxycholic acid, 17β-estradiol, thymidine and dopamine were purchased from Sigma-Aldrich. Citrate-capped AuNPs (13 nm) were prepared based on the literature method, and the as-prepared AuNPs were ∼10 nM.37 Milli-Q water was used for preparing buffers and solutions.Buffers
To study aptamer binding under different conditions, a number of buffers were prepared. Buffer 1 (the buffer used for selecting the CSS.1 aptamer): 20 mM HEPES (pH 7.5), 5 mM KCl, 1 M NaCl and 10 mM MgCl2. Buffer 1-1: 20 mM HEPES (pH 7.5), 5 mM KCl, 100 mM NaCl and 10 mM MgCl2. Buffer 1-2: 20 mM HEPES (pH 7.5), 5 mM KCl, 100 mM NaCl and 2 mM MgCl2. Buffer 1-3: 20 mM HEPES (pH 7.5), 5 mM KCl and 100 mM NaCl. Buffer 2 (the buffer used for selecting the 15-1 aptamer): 50 mM HEPES (pH 7.5), 137 mM NaCl and 5 mM MgCl2. Buffer 3 (the buffer used for avoiding the adsorption of HEPES on AuNPs): 10 mM phosphate (pH 7.5) and 1 mM MgCl2. Artificial interstitial fluids (ISF): 2.5 mM CaCl2, 10 mM HEPES, 3.5 mM KCl, 0.7 mM MgSO4, 123 mM NaCl, 1.5 mM NaH2PO4, 7.4 mM sucrose, pH 7.5.38Isothermal titration calorimetry (ITC) assays
ITC was performed using a VP-ITC microcalorimeter instrument (MicroCal) following previously reported procedures.30 Prior to each measurement, all of the solutions were degassed for 5 min to remove air bubbles. DNA aptamer (5 μM) in buffer was loaded in the ITC cell (1.45 mL) at 25 °C. Cortisol (100 μM) in the same buffer was titrated (20 μL each time) into the cell through a syringe, except for the first injection (2 μL). The enthalpy (ΔH) and association constant Ka were obtained by fitting the titration curves to a one-site binding model using the Origin software. Buffer 1, 1-1, 1-2, and 1-3 were used for CSS.1-related aptamers. Buffer 2 was used for 15-1-related aptamers.Label-free fluorescence binding assays
The 500 μL reaction containing 1× buffer, 5 μM aptamer, 0.5× SGI dye and various concentrations of cortisol. Fluorescence spectra with 522 nm excitation were measured using a Varian Eclipse fluorimeter. Buffer 1-1, 1-2, 1-3, and 3 and ISF were used for CSS.1-related aptamers. Buffer 2 was used for 15-1-related aptamers. The Kd values were obtained by fitting the curve using the equation F = FmaxX/(Kd + X) + F0, where F is the measured fluorescence intensity, Fmax is the maximum fluorescence intensity, X is the cortisol concentration, and F0 is the measured background fluorescence without cortisol.Cortisol adsorption by AuNPs
To evaluate the effect of cortisol on the colloidal stability of AuNPs, 35 μL AuNPs (13 nm, 10 nM) were mixed with 5 μL various concentrations of cortisol, 50 μL 2× buffer 3 (20 mM phosphate, 2 mM MgCl2, pH 7.5) and 10 μL Milli-Q water. After incubation for 5 min, the UV-vis spectra and photographs were taken. To evaluate the adsorption of cortisol by AuNPs, 35 μL AuNPs were first mixed with 5 μL cortisol of different concentrations in 50 μL 2× buffer 3. After incubation for 5 min, 5 μL FAM-DNA (4 μM) was introduced. After 5 min incubation, 5 μL NaCl (1.3 M) was added followed by 5 min incubation. The resulting mixture was then centrifuged and washed three times to remove the free DNA, and the supernatant was collected and diluted 20 times with buffer 3. The fluorescence intensity with 522 nm excitation was measured (F1). The precipitation was resuspended with buffer 3 to 99 μL. After being treated with 1 μL KCN (final 1 mM), the solution was diluted 20 times with buffer 3 and its fluorescence intensity was recorded as F2. The fraction of DNA adsorption by AuNPs was calculated to be F2/(F1 + F2).AuNP-based label-free colorimetric assays
To evaluate the performance of aptamers with the typical aptamer-based colorimetric detection method, 5 μL aptamer (4 μM) was first mixed with 5 μL cortisol of different concentrations in 50 μL 2× buffer 3. After incubation for 5 min, 35 μL AuNPs were introduced. After incubation for 5 min, 5 μL NaCl (1.3 M) was added. After incubation for 5 min, the UV-vis spectra were acquired and photographs were taken.Results and discussion
The two cortisol aptamers
Both of the previously reported cortisol aptamers were isolated using the library-immobilization selection method,14,24 with the random regions containing 40- or 30-nt. A careful comparison of the secondary structures of the libraries revealed a major difference in the library design in the fixed primer binding regions (PBRs). The library used by Martin et al. had an intra-PBR hairpin (Fig. 1A, the hairpin on the 5′ side of the top panel), while Stojanovic's library had an inter-PBR hairpin (Fig. 1B). During aptamer selection, such hairpins were intended to facilitate cortisol binding sequences to dissociate from the immobilization columns upon target binding. Such a difference was also reflected in the predicted secondary structure of the aptamers. The full-length 15-1 aptamer reported by Martin et al. retained the hairpin in its predicted secondary structure, and the central random region seems to form its own structure. So far, truncation to 15-1 was made by simply removing the two PBRs.14,20 After truncation, the 40-mer sequence (named 15-1a) still has overhangs outside the hairpin. Thus, we also further truncated it to obtain a 25-mer sequence named 15-1b (Fig. 1C). In this work, we only tested the truncated sequences, since it's difficult to use the full-length 85-mer for rational biosensor design.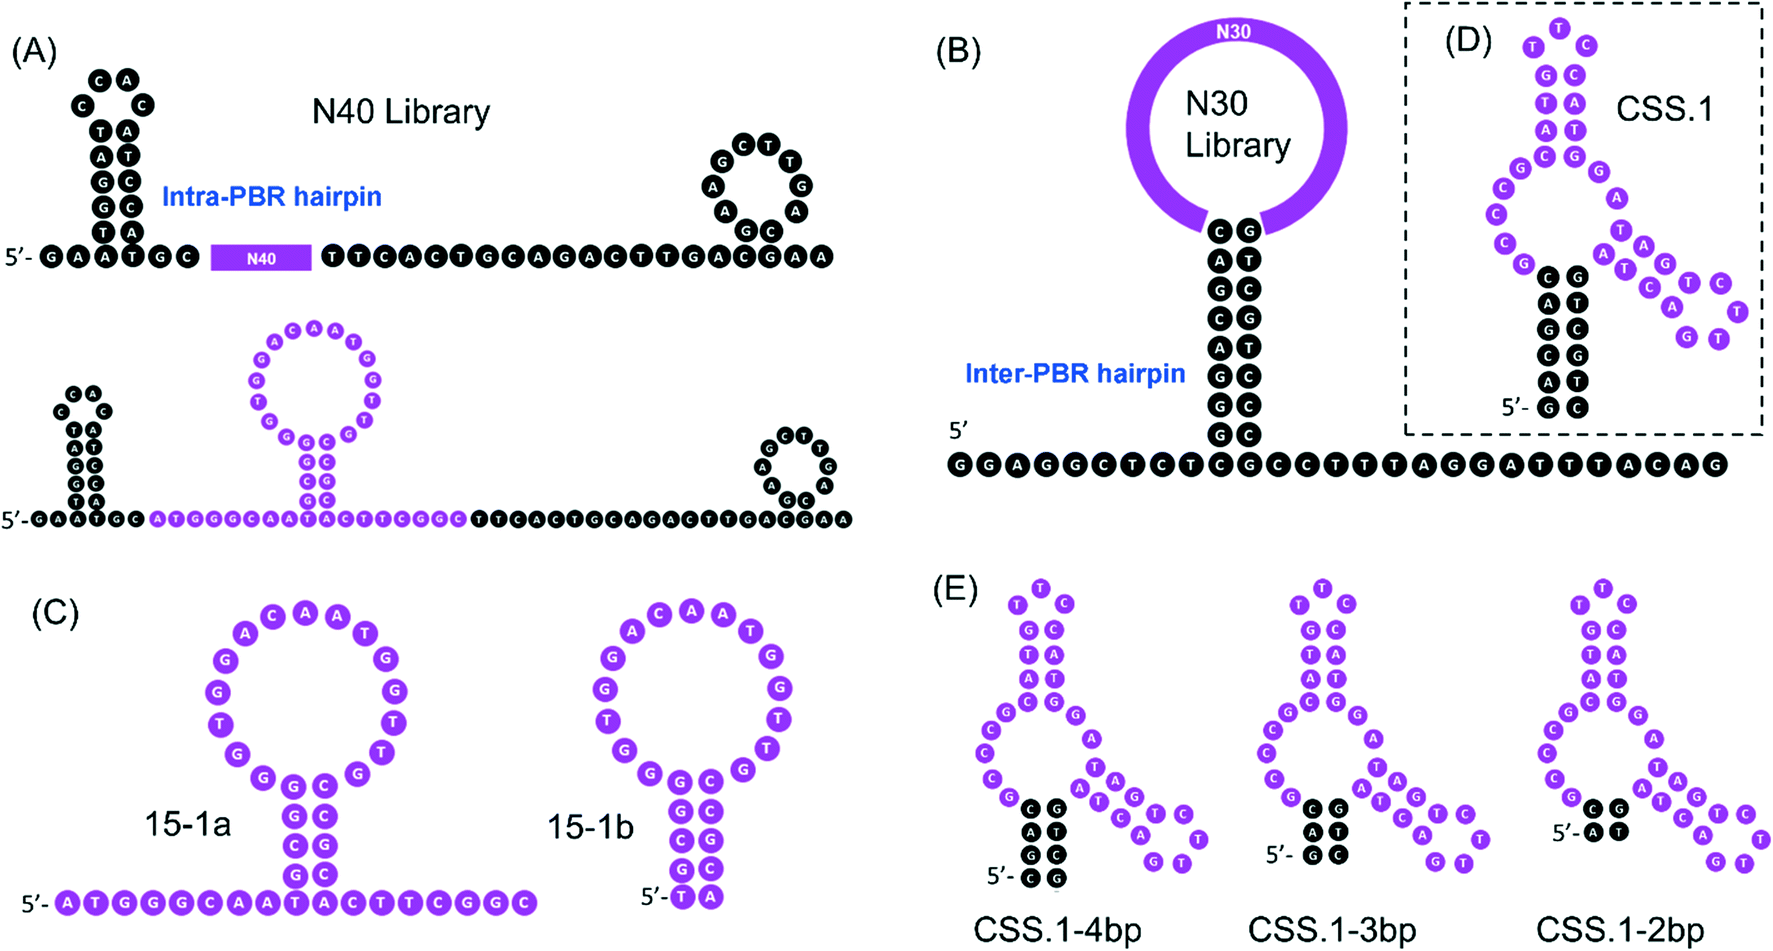 | ||
| Fig. 1 The library design for the previous aptamer selection experiments with (A) intra- and (B) inter-PBR hairpins. (C) The truncated 40-mer sequence 15-1a and the further truncated 25-mer sequence 15-1b. The secondary structures of (D) CSS.1, and its truncated (E) CSS.1-4bp, CSS.1-3bp and CSS.1-2bp. | ||
Based on the secondary structure of the CSS.1 aptamer, the truncation is quite straightforward. If eight base pairs are retained in the aptamer, the length is 46-mer. In this study, we keep six base pairs and the aptamer is 42-mer (Fig. 1D). In addition, three further truncated CSS.1 aptamers were tested, where the stem was shortened from 6 to 4, 3 and 2 base pairs (Fig. 1E). To ensure specificity of binding, we also included two mutants for this study by changing a few nucleotides in the random region of CSS.1 (Fig. S1†).
ITC binding assays
Our first goal was to compare these two aptamers for cortisol binding. To directly study the binding reactions, we performed ITC by titrating cortisol into different aptamers,39 and the rate of heat release was recorded. For CSS.1, the reaction was exothermic as indicated by the downward spikes of the thermograms in Fig. 2A. After subtracting the background heat, the net heat was integrated and fitted to a one-site binding model (Fig. 2A, the lower panel), from which the dissociation constant (Kd) was calculated to be 245 ± 39 nM, indicating the binding of cortisol with CSS.1. This value was comparable with the 100 nM Kd from the fluorescence-based DNA strand displacement assay reported previously.24 To further confirm the binding, two mutants of CSS.1 were designed (CSS.1-mt1: G7A and A24G double mutant and CSS.1-mt2: G7T, see Fig. S1†), which showed no binding (Fig. 2B and C). Thus, the G7 base in CSS.1 was critical for the binding. We then titrated cortisol into the 15-1a aptamer, but no binding was observed (Fig. 2D). In order for the binding to take effect, we doubled the concentration of the aptamer to 10 μM (Fig. S2†), but still no heat change was observed, indicating no binding between cortisol and 15-1a.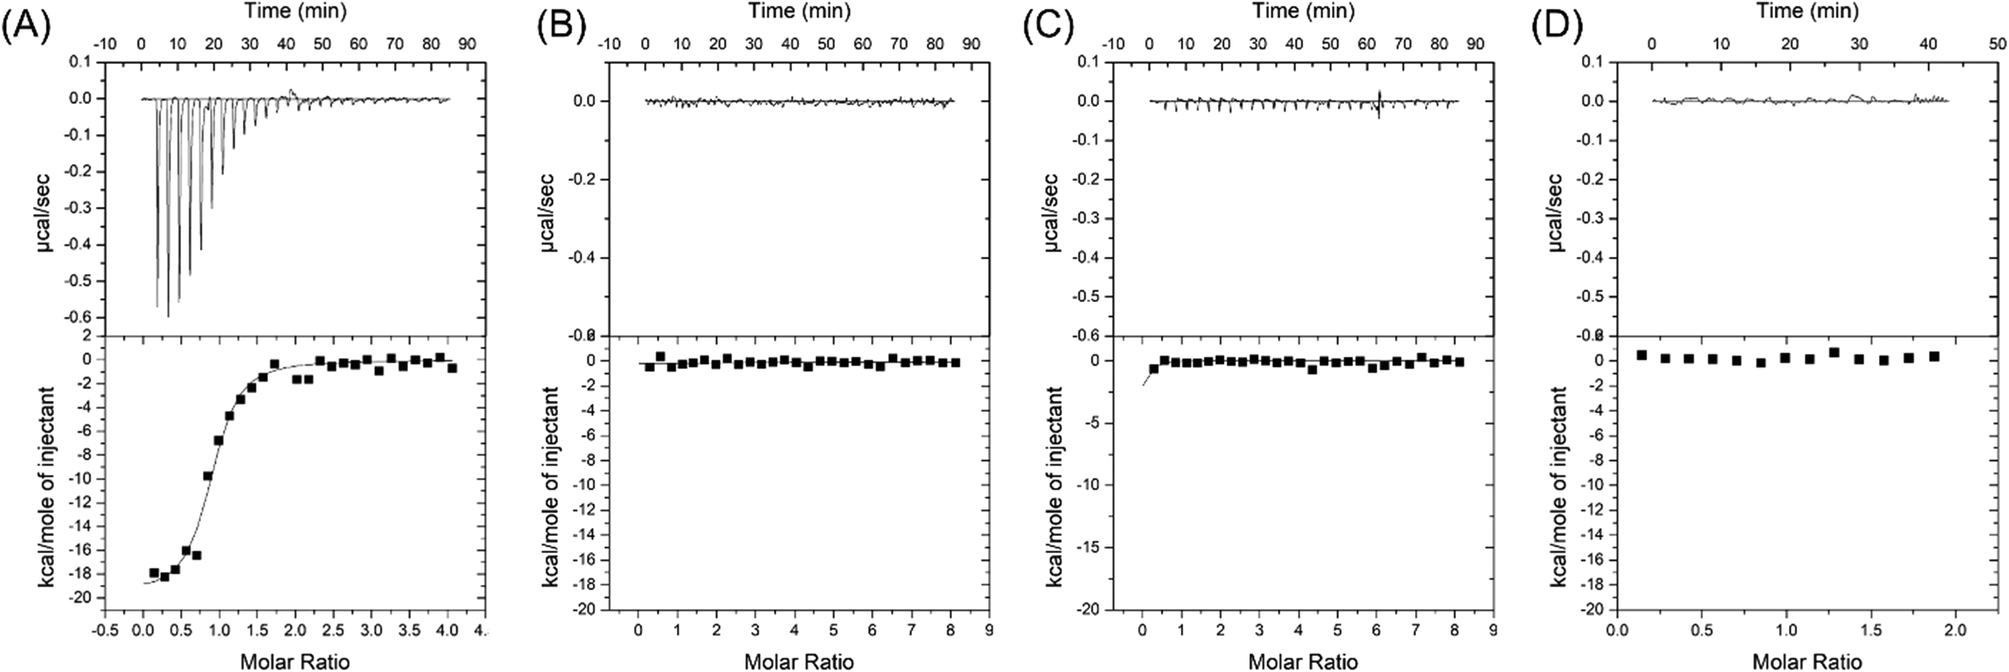 | ||
| Fig. 2 Comparison of the two aptamers and their mutants using ITC: (A) CSS.1; (B) CSS.1-mt1; (C) CSS.1-mt2; (D) 15-1a. Buffer 1 was used in (A)–(C) and buffer 2 was used in (D). These buffers were used for the selection of these aptamers. | ||
Salt-dependent binding
Salt concentration is essential to the interaction between aptamers and targets, and it is also critical for biosensors. For example, the binding of SGI and DNA is strongly affected by salt,40 and the colloidal stability of AuNPs is also determined by salt.41 1 M NaCl was used in the selection of the CSS.1 aptamer. To test for physiologically relevant conditions, 100 mM NaCl solutions with different concentrations of Mg2+ were investigated (Fig. 3). Compared with 1 M NaCl in Fig. 2A, 100 mM NaCl resulted in a slightly higher Kd of 656 ± 19 nM, which indicated that lowering the concentration of Na+ did not have a strong effect on the affinity between the aptamer and cortisol (Fig. 3A). By fixing the NaCl concentration at 100 mM, we further dropped the Mg2+ concentration. The Kd was 1.9 ± 0.9 μM and 4.9 ± 0.7 μM in the buffer with 2 mM Mg2+ and no Mg2+, respectively (Fig. 3B and C). A Kd of 4.9 μM is still quite good for a small molecule. For example, the classic adenosine aptamer has a Kd of around 6 μM in a buffer containing Mg2+.42 Therefore, Mg2+ was not required for the binding, but it was helpful to achieve a higher binding affinity.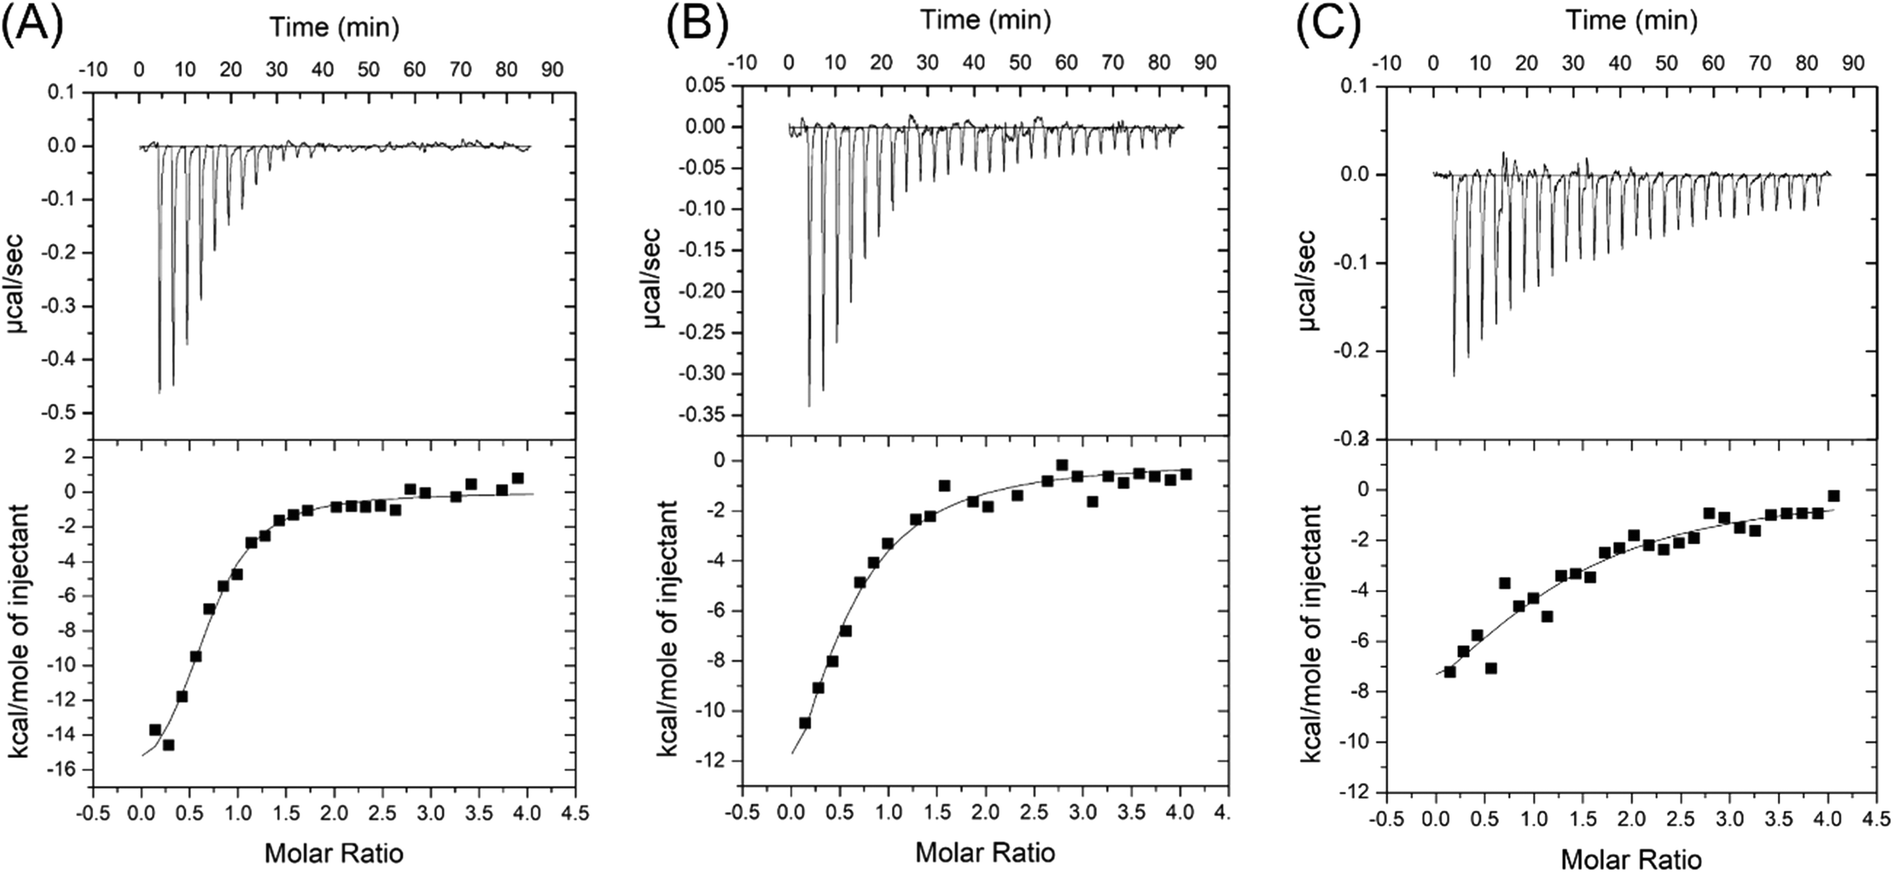 | ||
| Fig. 3 Effect of the salt concentration on the CSS.1 aptamer. (A) 100 mM NaCl and 10 mM MgCl2. Kd = 656 ± 19 nM. (B) 100 mM NaCl and 2 mM MgCl2. Kd = 1.9 ± 0.9 μM. (C) 100 mM NaCl. Kd = 4.9 ± 0.7 μM. Buffer 1-1, buffer 1-2 and buffer 1-3 were used in (A)–(C), respectively. | ||
Fluorescence label-free detection of cortisol
After confirming the binding of the CSS.1 aptamer, we then used a DNA staining dye to develop a label-free sensor, which allowed us to further evaluate the binding of the aptamers. As shown in Fig. 4A, aptamer binding to cortisol may promote the formation of the hairpin structure, leading to enhanced SGI fluorescence. In buffer 1-1 containing 100 mM Na+ and 10 mM Mg2+, the fluorescence intensity indeed increased with the increase of cortisol concentration (Fig. 4B). The same phenomenon was observed in other buffers (Fig. 4C). The Kd increased from 4.7 μM to 15.4 μM with the concentration of Mg2+ decreasing from 10 mM to 0. This trend was consistent with that in the ITC assay. However, the Kd values in the SGI assay were higher (by 1.8 to 7.2 times) than those in ITC, which could be due to SGI acting as a competitor for aptamer binding.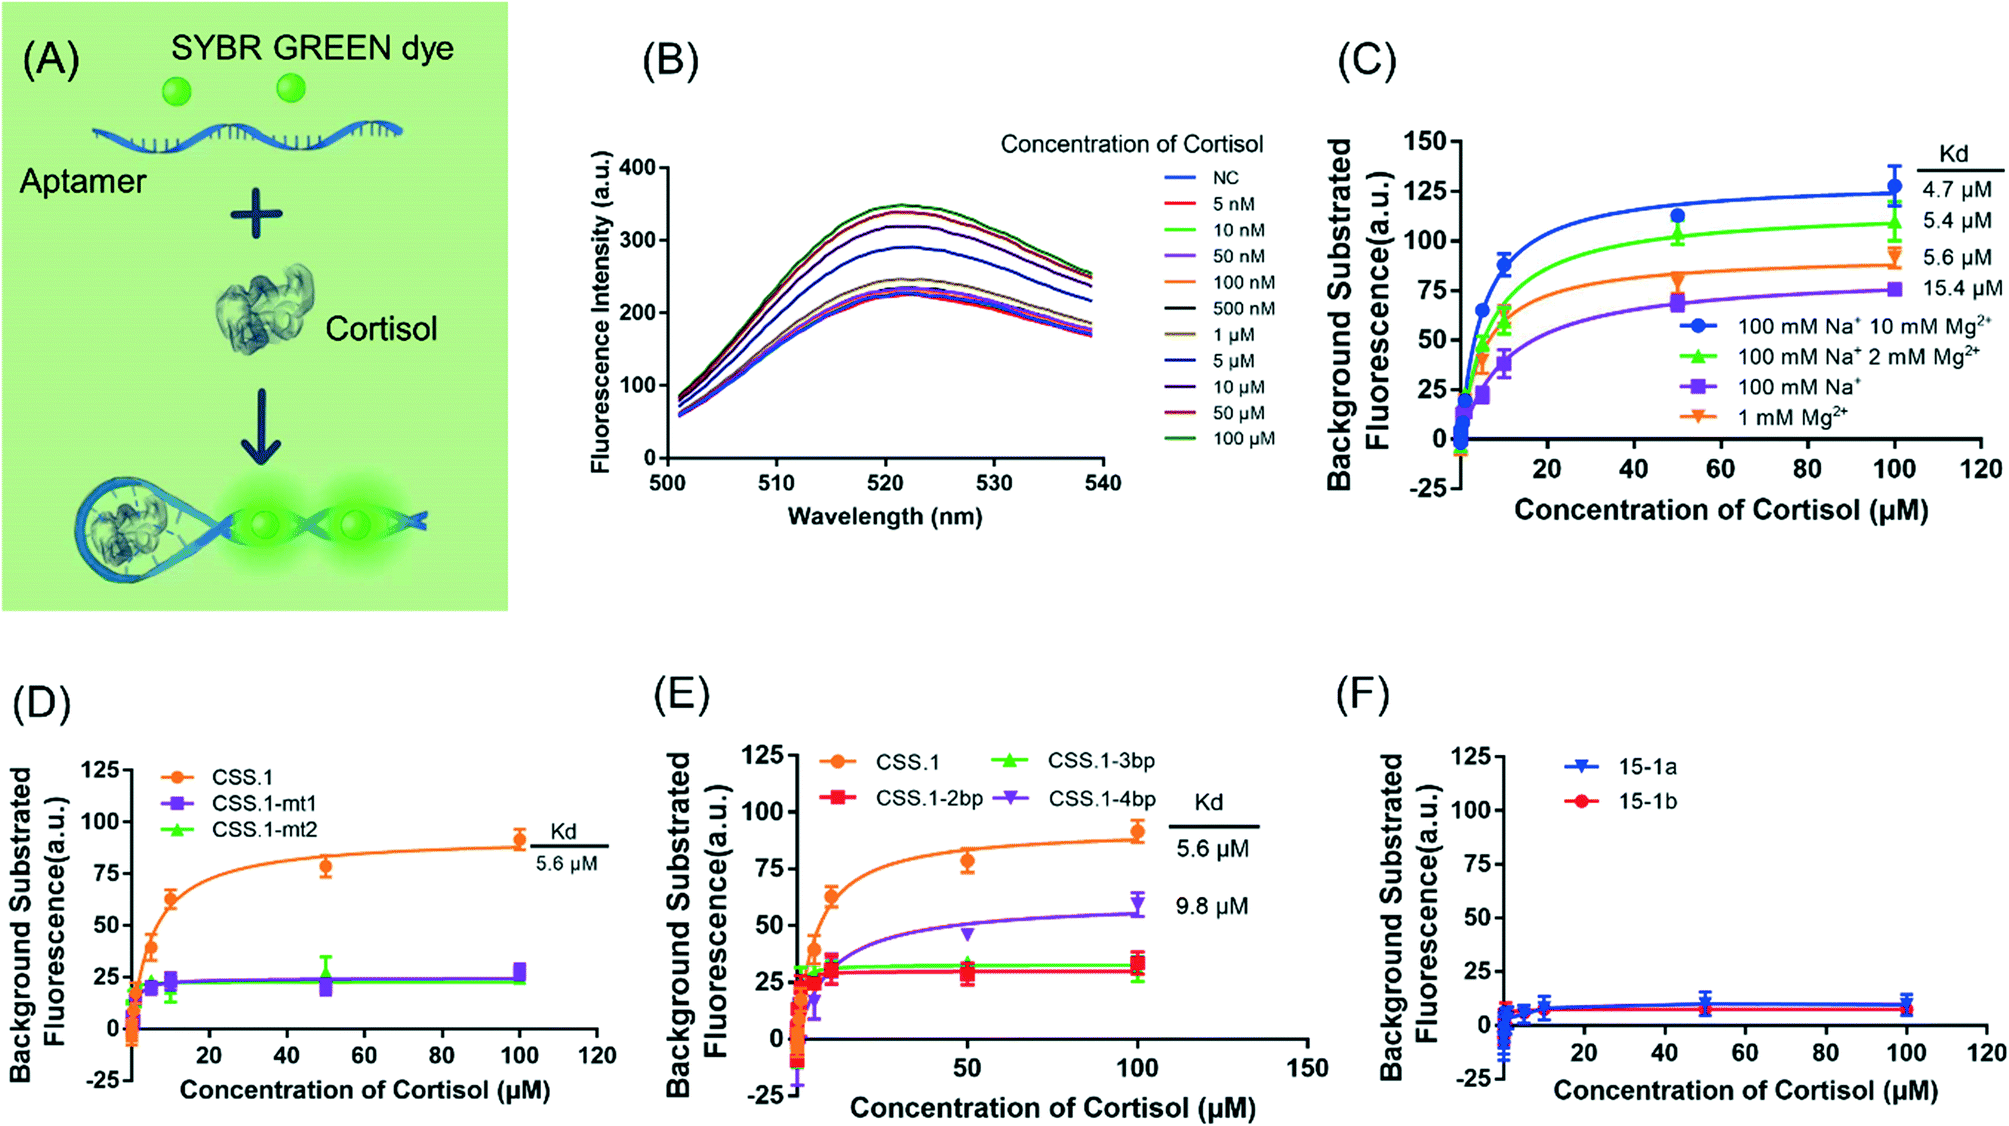 | ||
| Fig. 4 (A) Schematic of the SGI-based label-free fluorescent assay. (B) Fluorescence spectra of 5 μM CSS.1 mixed with 0.5× SGI in the presence of different concentrations of cortisol. (C) Effect of the salt concentration on the CSS.1 aptamer. (D) Performance of the CSS.1 mutants. (E) Performance of the truncated CSS.1 aptamers. (F) Performance of the 15-1a and 15-1b aptamers. The error bars indicate the standard deviation. | ||
Moreover, the two mutated aptamers, CSS.1-mt1 and CSS.1-mt2, were investigated (Fig. 4D). As expected, these mutants did not lead to a fluorescence intensity increase consistent with the ITC results. We further truncated the three truncated CSS.1 aptamers (Fig. 1E), and the aptamers with a shorter stem length had a lower affinity for cortisol (Fig. 4E). The Kd of CSS.1-4bp was 9.8 μM, 1.75-times that of CSS.1, whereas CSS.1-3bp and CSS.1-2bp showed a negligible fluorescence change. Therefore, a minimum of 4bp was required for this label-free sensing method. While 3bp might also bind, such binding could not be probed using SGI. The aptamer binding requires closing of the hairpin and thus if the stem region is too short, the correct binding structure cannot form. Our current CSS.1 aptamer has a 6bp stem, which is sufficiently stable under physiological conditions (e.g. 100 mM Na+; 1 mM Mg2+) with an Mfold predicted melting temperature of 59.4 °C. Finally, we tested the 15-1a and 15-b aptamers using the SGI assay (Fig. 4F), but no cortisol-dependent fluorescence change was observed, indicating a lack of binding with up to 100 μM cortisol.
Detection of cortisol in artificial interstitial fluids
Since the label-free fluorescence method showed a cortisol-dependent signal change, we then evaluated its performance in artificial interstitial fluids (ISF).38 Quantitative analysis was performed by monitoring the fluorescence intensity after the addition of various concentrations of cortisol. The resulting plot of fluorescence intensity versus cortisol concentrations was linear over the range of 1 μM to 10 μM (Fig. 5A), and the detection limit was determined to be 742 nM. Moreover, deoxycholic acid, 17β-estradiol, thymidine and dopamine were used to evaluate the specificity of the detection method, and none of them showed significant fluorescence signal changes (Fig. 5B and C), indicating that the fluorescence change was due to specific cortisol binding.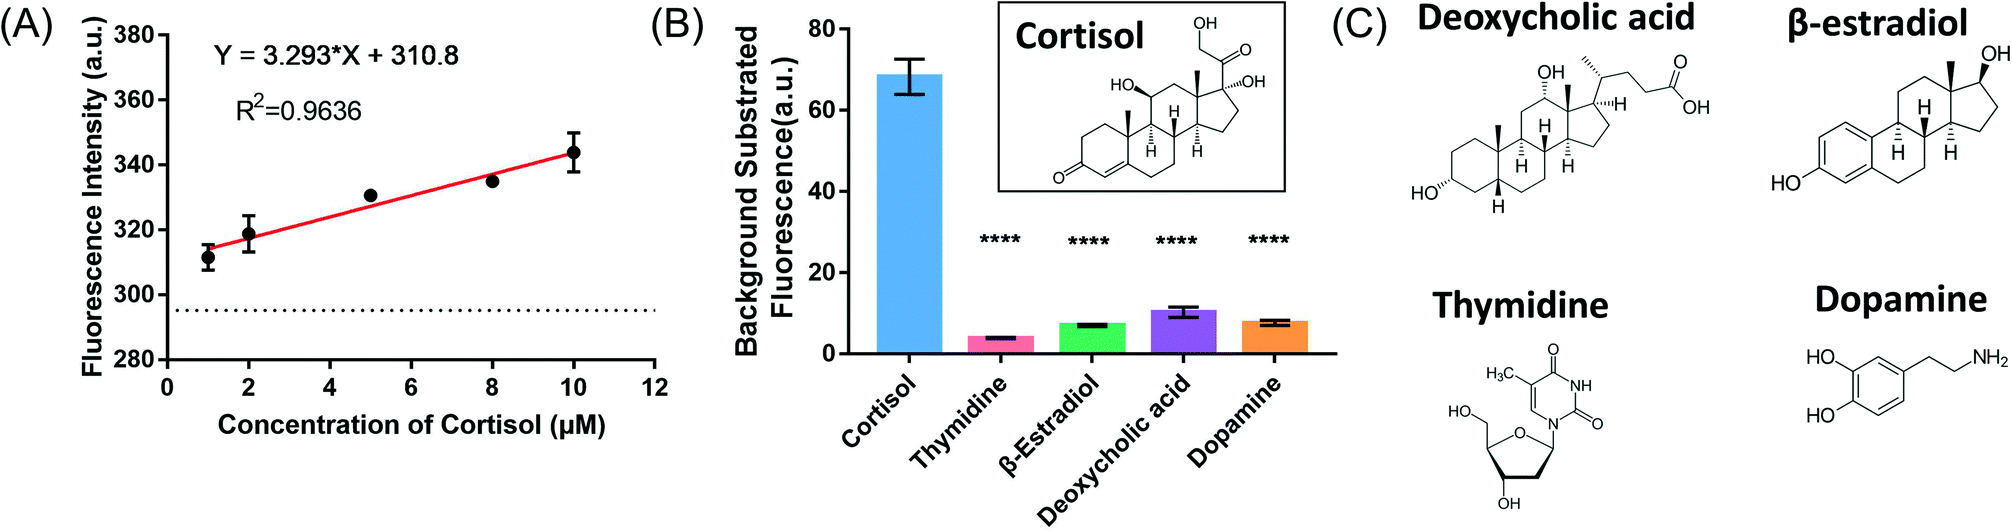 | ||
| Fig. 5 Detection of cortisol in artificial ISF. (A) The linear range and the regression line. The dashed line indicates the background fluorescence intensity without cortisol. (B) Specificity test with 20 μM cortisol or competing molecules. Inset: The structure of cortisol. The error bars indicate the standard deviation. ****: P < 0.0001. (C) The structures of the tested competing molecules. | ||
Adsorption of cortisol onto AuNPs
Finally, we explored the possibility of label-free colorimetric detection using citrate-capped AuNPs.37,43 With salt addition, AuNPs would aggregate and turn from red to blue color.43 Upon adsorption of DNA oligonucleotides, the colloidal stability of AuNPs increases making them more resistant to the salt.36 Most previous work on aptamer-based colorimetric detection assumed a reaction scheme shown in Fig. 6A, where the target molecule induced the folding of the aptamer into a rigid structure and inhibited the adsorption of the aptamer by AuNPs. After adding the salt, the sample turned blue.31,44,45 In this mechanism, the interaction between the target molecule and AuNPs was not considered. However, as demonstrated for many target analytes, such as adenosine/ATP,46 dopamine/melamine,47 quinine,48 kanamycin,49 and Hg2+,50 their adsorption to AuNPs was critical and cannot be ignored.31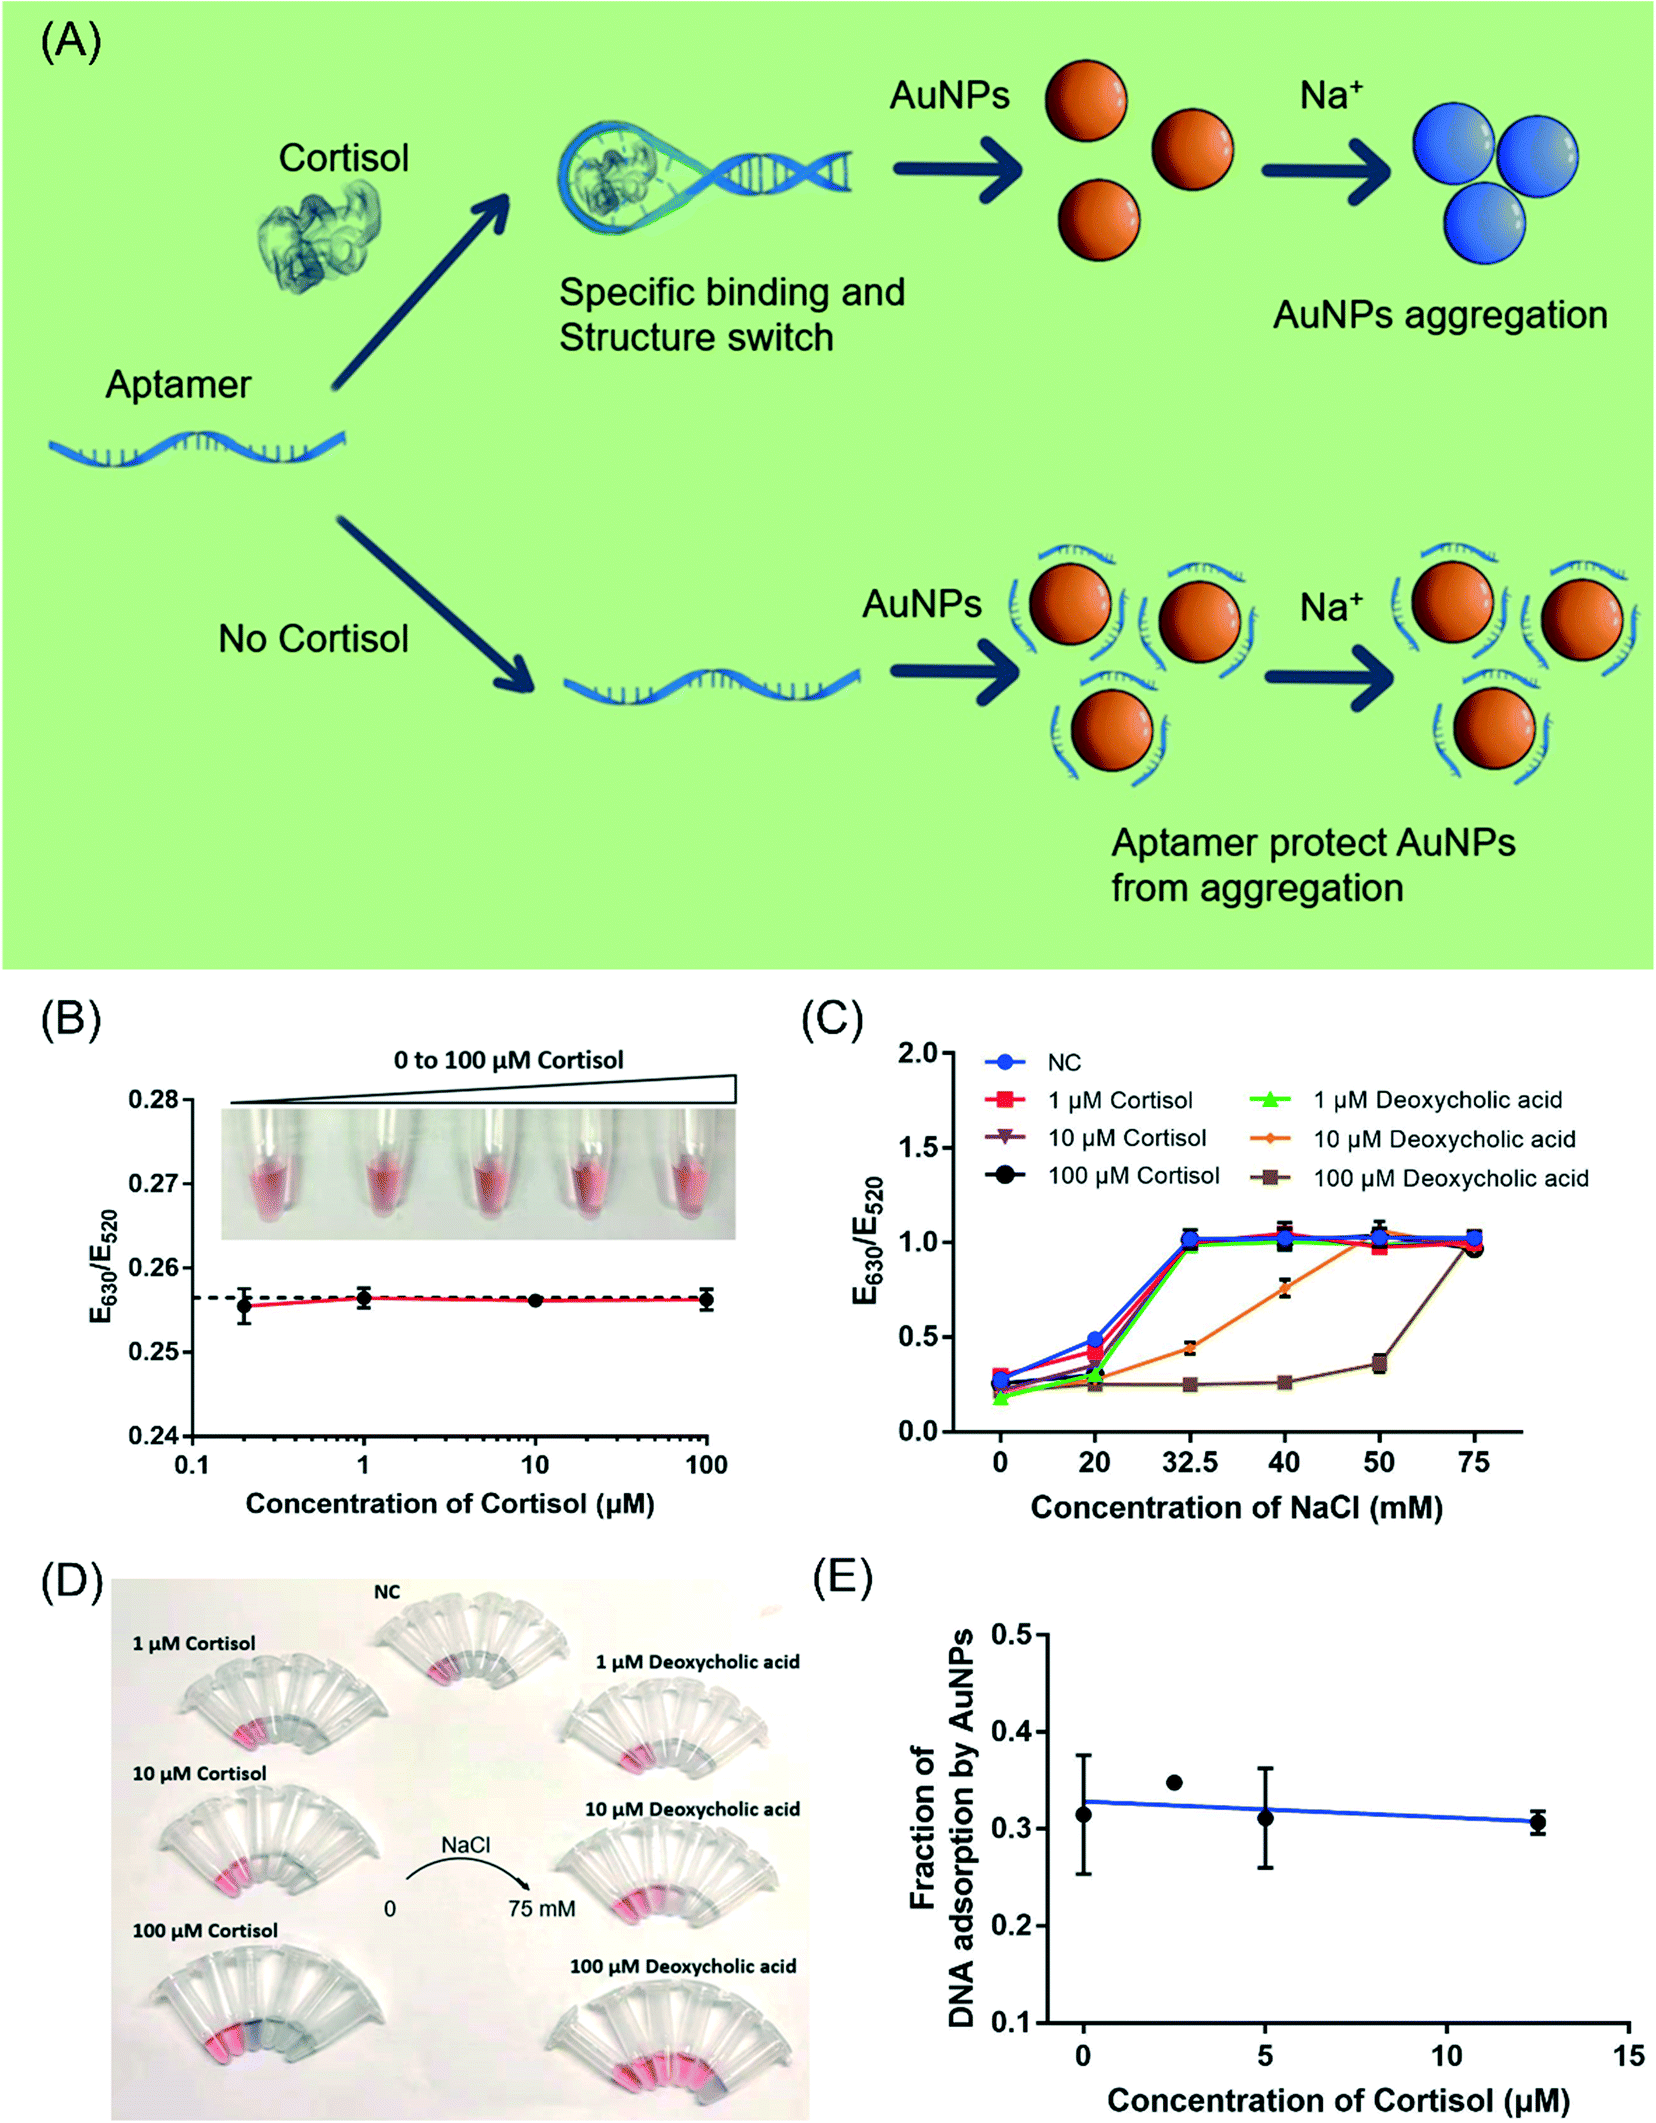 | ||
| Fig. 6 (A) A scheme showing the aptamer-based colorimetric detection method. (B) Effect of cortisol on the colloidal stability of the AuNPs. The dashed line indicates the E630/E520 value without cortisol. Inset: A photograph of the AuNP samples. (C) Effect of cortisol and deoxycholic acid on the salt-resistance of the AuNPs. NC means negative control, where no cortisol or deoxycholic acid was added. (D) Photograph of the data in (C). (E) Effect of cortisol on the adsorption of FAM-labeled DNA. The error bars indicate the standard deviation. | ||
Therefore, we investigated the interaction between cortisol and the AuNPs. Firstly, the effect of cortisol on the colloidal stability of the AuNPs was studied (Fig. 6B). The 13 nm citrate-capped AuNPs had a strong surface plasmon peak at 520 nm. With the increasing NaCl concentration, the as-prepared citrate-capped AuNPs gradually aggregated and the color turned blue. The onset of the color change was around 32.5 mM NaCl by visual inspection, which was also confirmed by UV-vis measurements (Fig. S3†). With the addition of up to 100 μM cortisol to the AuNPs, the AuNPs remained red, and the E630/E520 value indicative of the color of the AuNPs remained constant with cortisol concentrations ranging from 200 nM to 100 μM (Fig. 6B). Thus, either cortisol did not adsorb onto the AuNPs, or the adsorption did not decrease its colloidal stability.
We then investigated the effect of cortisol on the salt-stability of the AuNPs (Fig. 6C and D). The AuNPs aggregated and the color changed to blue by adding 32.5 mM NaCl in the presence of 1 μM, 10 μM and 100 μM cortisol, indicating that the colloidal stability of the AuNPs did not improve. As a control, the effect of deoxycholic acid (a similar structure to cortisol) was also investigated, where the stability of the AuNPs significantly improved. The AuNPs remained red with 32.5 mM NaCl with the protection of 10 μM deoxycholic acid (Fig. 6C, orange trace, orange trace), and they could resist 50 mM NaCl in the presence of 100 μM deoxycholic acid (Fig. 6C, brown trace). Compared to cortisol, deoxycholic acid has a carboxylic acid group, which could be the reason for its adsorption and the stabilization of the AuNPs (a negative charge). Therefore, deoxycholic acid can improve the stability of the AuNPs by adsorbing on the gold surface, whereas cortisol does not appear to strongly interact with the AuNPs.
Finally, we investigated whether cortisol can affect the adsorption of DNA by AuNPs. Since AuNPs are strong fluorescence quenchers, we used a FAM-labeled DNA (called FAM-DNA) to follow DNA adsorption.51 Cortisol was first mixed with the AuNPs before adding FAM-DNA. After centrifugation, the adsorbed DNAs were precipitated together with the AuNPs. The fluorescence intensity of the supernatant was compared with the fluorescence intensity from the dissolved pellets (using KCN) to calculate the fraction of DNA adsorption (Fig. 6E). The fraction of the adsorbed DNA did not change with up to 12.5 μM cortisol, indicating that cortisol did not inhibit DNA adsorption by AuNPs. With these experiments, we reason that it might be possible to explore the typical aptamer-based colorimetric detection method presented in Fig. 6A.
Label-free colorimetric detection of cortisol
To test for the label-free colorimetric detection, the NaCl concentration was first optimized to achieve the most sensitive DNA protection (Fig. S4†). Under the optimized conditions, when using the CSS.1 aptamer, the E630/E520 value increased modestly with the increasing cortisol concentration from 125 nM to 12.5 μM and the linear range was from 1 μM to 12.5 μM (R2 = 0.95). However, when the nonbinding mutants CSS.1-mt1 and CSS.1-mt2 were used, a E630/E520 change was also observed, especially when the cortisol concentration was below 2.5 μM (Fig. 7A). The red-to-blue color change of the two mutant aptamers was also observed (Fig. 7B). Since the color change was quite modest even under the optimized conditions, it was difficult to distinguish specific and nonspecific interactions. Therefore, we cannot conclude that this colorimetric assay can be used for the confirmation of aptamer binding.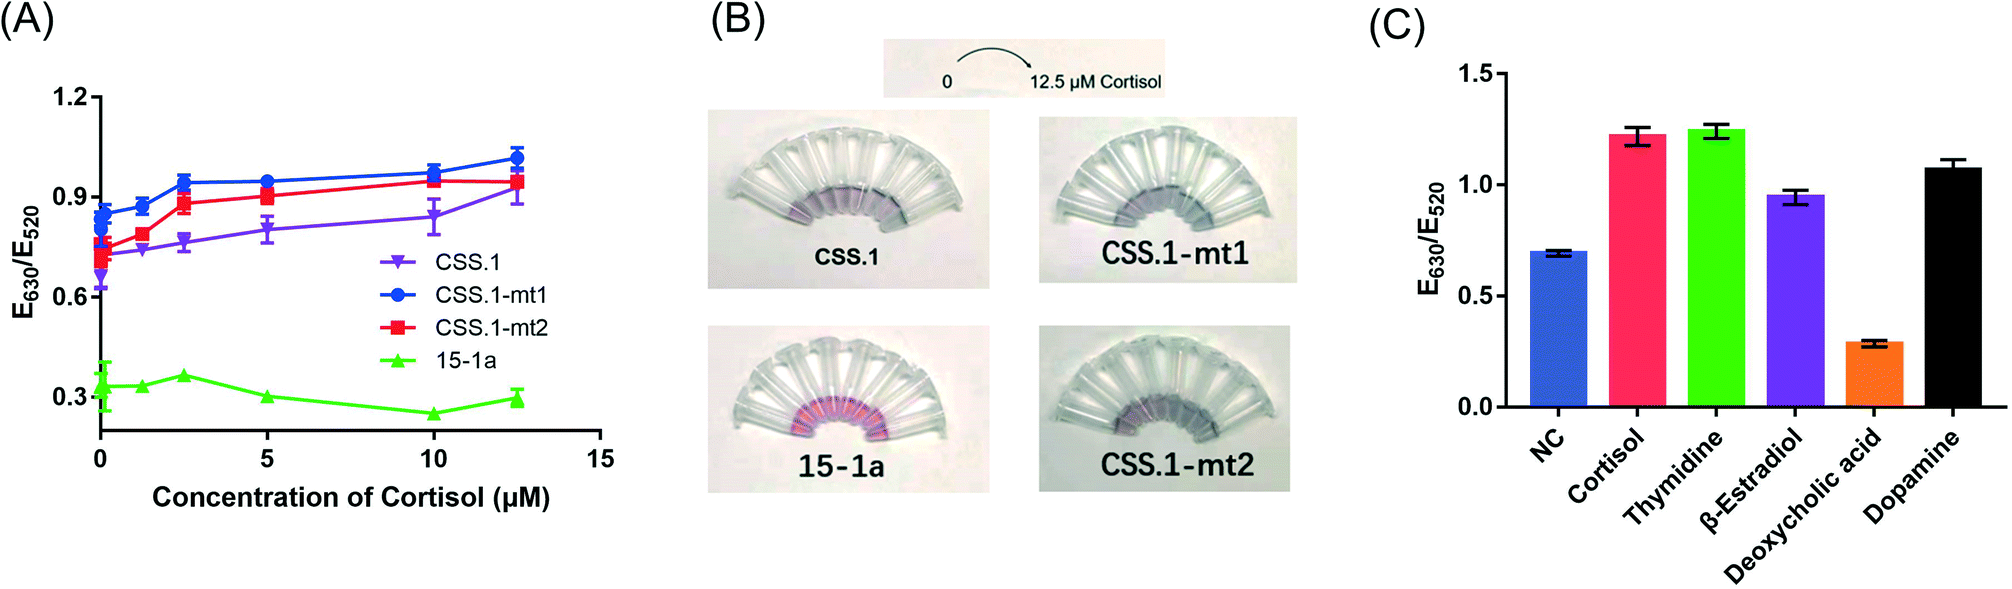 | ||
| Fig. 7 Evaluation of the AuNP-based label-free biosensor for cortisol. (A) Performance of the different aptamers. (B) Photograph of the data in (A). (C) Specificity test with 100 μM of each molecule. The error bars indicate the standard deviation of the measurements. | ||
Moreover, deoxycholic acid, 17β-estradiol, thymidine and dopamine were used to evaluate the specificity of the AuNP-based assay (Fig. 7C). In the presence of a 100 μM target molecule, 17β-estradiol, thymidine and dopamine changed the color of the AuNPs from red to blue similar to that with cortisol, while deoxycholic acid retained the red color. These molecules have different interactions with the AuNPs, which in turn affected the colorimetric assay leading to poor specificity. Although a color change was observed with various concentrations of cortisol, we would not call it a sensor for cortisol due to the lack of specificity. Note that the lack of specificity was not due to the aptamer, but due to the interaction between these competing molecules and the AuNPs. This problem might be solved by using organic dyes to produce a color change.32
In the presence of various concentrations of cortisol, aptamer 15-1a did not lead to much change in the E630/E520 value or AuNP color (Fig. 7A, green trace). So far, we did not find evidence to support the binding of the truncated 40-mer 15-1a aptamer. Thus, the 85-mer full-length aptamer was required for binding (binding was previously confirmed using the microscale thermophoresis (MST),14 equilibrium dialysis14 and electrochemical15 assays). The intra-PBR hairpin in the library also suggested that the PBRs may not be fully removed. Nevertheless, without appropriate truncation and understanding of its minimal secondary structure, it is difficult to use this full-length sequence for rational biosensor design. Given that the CSS.1 aptamer had a much higher affinity than the 15-1 aptamer, researchers are likely to shift their focus on CSS.1 in future research.
Recently, a number of papers have been published to scrutinize the binding of some commonly used aptamers52 for important analytes such as arsenic,53 ethanolamine,54 ampicillin,55 and some pesticides.56 None of them showed binding. In this work, another example was discovered. Truncation of aptamers would require a careful test of binding and such binding assays cannot be skipped.
Conclusions
The DNA aptamers for cortisol, 15-1a (a truncated form of 15-1) and CSS.1, were compared side-by-side using ITC, SGI fluorescence spectroscopy and AuNP-based assays. Aptamer 15-1a did not bind to cortisol in any of these assays. Aptamer CSS.1 showed a high binding affinity with a Kd of 245 nM cortisol in its selection buffer. Na+ and Mg2+ were not required for CSS.1, but Mg2+ was helpful to ensure a high binding affinity. Moreover, two mutant aptamers of CSS.1 were evaluated and the G7 base was essential to ensure aptamer binding. Three truncated aptamers of CSS.1 were also evaluated and the binding affinity decreased with the decreasing stem length of the aptamer. In addition, cortisol had no effect on the colloidal stability of citrate-capped AuNPs and did not affect DNA adsorption. Out of the two label-free assays, the SGI fluorescence assay allowed cortisol detection with a detection limit of 742 nM and showed excellent specificity. However, the AuNP-based colorimetric detection method failed to show a specific color change. Finally, we concluded that the truncated 15-1a aptamer cannot bind with cortisol, and more systematic and careful truncation work on the original aptamer is needed. Aptamer CSS.1 is an efficient aptamer for cortisol with high tolerance to salt concentration, and it is recommended for future biosensor work.Conflicts of interest
There are no conflicts to declare.Acknowledgements
Funding for this work was from the Natural Sciences and Engineering Research Council of Canada (NSERC). C. Niu was supported by a China Scholarship Council (CSC) scholarship to visit the University of Waterloo.References
- F. Holsboer and M. Ising, Annu. Rev. Psychol., 2009, 61, 81–109 CrossRef.
- A. Levine, O. Zagoory-Sharon, R. Feldman, J. G. Lewis and A. Weller, Physiol. Behav., 2007, 90, 43–53 CrossRef CAS PubMed.
- D. H. Hellhammer, S. Wüst and B. M. Kudielka, Psychoneuroendocrinology, 2009, 34, 163–171 CrossRef CAS PubMed.
- M. Ku, J. Kim, J.-E. Won, W. Kang, Y.-G. Park, J. Park, J.-H. Lee, J. Cheon, H. Lee Hyun and J.-U. Park, Sci. Adv., 2020, 6, eabb2891 CrossRef CAS PubMed.
- T. Tan, B. Khoo, E. G. Mills, M. Phylactou, B. Patel, P. C. Eng, L. Thurston, B. Muzi, K. Meeran and A. T. Prevost, Endocrinology, 2020, 8, 659–660 CAS.
- R. Miller, F. Plessow, M. Rauh, M. Gröschl and C. Kirschbaum, Psychoneuroendocrinology, 2013, 38, 50–57 CrossRef CAS PubMed.
- A. Apilux, S. Rengpipat, W. Suwanjang and O. Chailapakul, J. Pharm. Biomed. Anal., 2020, 178, 112925 CrossRef CAS PubMed.
- J. E. L. Villa, I. Garcia, D. Jimenez de Aberasturi, V. Pavlov, M. D. P. T. Sotomayor and L. M. Liz-Marzán, Biosens. Bioelectron., 2020, 165, 112418 CrossRef CAS.
- H. Yu, O. Alkhamis, J. Canoura, Y. Liu and Y. Xiao, Angew. Chem., Int. Ed., 2021, 60, 16800–16823 CrossRef CAS PubMed.
- A. Ruscito and M. C. DeRosa, Front. Chem., 2016, 4, 14 Search PubMed.
- L. Wu, Y. Wang, X. Xu, Y. Liu, B. Lin, M. Zhang, J. Zhang, S. Wan, C. Yang and W. Tan, Chem. Rev., 2021, 121, 12035–12105 CrossRef CAS PubMed.
- Y. Wu, I. Belmonte, K. S. Sykes, Y. Xiao and R. J. White, Anal. Chem., 2019, 91, 15335–15344 CrossRef CAS PubMed.
- L. He, R. Huang, P. Xiao, Y. Liu, L. Jin, H. Liu, S. Li, Y. Deng, Z. Chen, Z. Li and N. He, Chin. Chem. Lett., 2021, 32, 1593–1602 CrossRef CAS.
- J. A. Martin, J. L. Chávez, Y. Chushak, R. R. Chapleau, J. Hagen and N. Kelley-Loughnane, Anal. Bioanal. Chem., 2014, 406, 4637–4647 CrossRef CAS PubMed.
- B. J. Sanghavi, J. A. Moore, J. L. Chávez, J. A. Hagen, N. Kelley-Loughnane, C.-F. Chou and N. S. Swami, Biosens. Bioelectron., 2016, 78, 244–252 CrossRef CAS PubMed.
- J. Zhang and S. C. B. Gopinath, 3 Biotech, 2020, 10, 35 CrossRef PubMed.
- A. Ganguly, K. C. Lin, S. Muthukumar and S. Prasad, ACS Sens., 2021, 6, 63–72 CrossRef CAS PubMed.
- R. Zhang and Y. Jia, ACS Sens., 2021, 6, 3024–3031 CrossRef CAS PubMed.
- M. Pali, B. Jagannath, K.-C. Lin, S. Upasham, D. Sankhalab, S. Upashama, S. Muthukumar and S. Prasad, Electrochim. Acta, 2021, 390, 138834 CrossRef CAS.
- S. Dalirirad and A. J. Steckl, Sens. Actuators, B, 2019, 283, 79–86 CrossRef CAS.
- Y. Kim, J. Yang, H. Hur, S. Oh and H. H. Lee, Biosensors, 2021, 11, 163 CrossRef CAS PubMed.
- F. Mortazavi Moghadam, M. Bigdeli, A. Tamayol and S. R. Shin, Sens. Actuators, B, 2021, 344, 130160 CrossRef CAS.
- Z. Huang, H. Chen, H. Ye, Z. Chen, N. Jaffrezic-Renault and Z. Guo, Biosens. Bioelectron., 2021, 190, 113451 CrossRef CAS PubMed.
- K.-A. Yang, H. Chun, Y. Zhang, S. Pecic, N. Nakatsuka, A. M. Andrews, T. S. Worgall and M. N. Stojanovic, ACS Chem. Biol., 2017, 12, 3103–3112 CrossRef CAS PubMed.
- S. Dalirirad, D. Han and A. J. Steckl, ACS Omega, 2020, 5, 32890–32898 CrossRef CAS PubMed.
- R. Nutiu and Y. Li, Angew. Chem., Int. Ed., 2005, 44, 1061–1065 CrossRef CAS PubMed.
- C. Lyu, I. M. Khan and Z. Wang, Talanta, 2021, 229, 122274 CrossRef CAS PubMed.
- H. Yu, Y. Luo, O. Alkhamis, J. Canoura, B. Yu and Y. Xiao, Anal. Chem., 2021, 93, 3172–3180 CrossRef CAS PubMed.
- N. Nakatsuka, K.-A. Yang, J. M. Abendroth, K. M. Cheung, X. Xu, H. Yang, C. Zhao, B. Zhu, Y. S. Rim, Y. Yang, P. S. Weiss, M. N. Stojanović and A. M. Andrews, Science, 2018, 362, 319–324 CrossRef CAS PubMed.
- P.-J. J. Huang and J. Liu, Anal. Chem., 2022, 3142–3149 CrossRef CAS PubMed , in press.
- F. Zhang and J. Liu, Analysis & Sensing, 2021, 1, 30–43 Search PubMed.
- O. Alkhamis, J. Canoura, K. V. Bukhryakov, A. Tarifa, A. P. DeCaprio and Y. Xiao, Angew. Chem., 2022, 61, e202112305 CAS.
- J. Zhang, L.-L. Wang, M.-F. Hou, L.-P. Luo, Y.-J. Liao, Y.-K. Xia, A. Yan, Y.-P. Weng, L.-P. Zeng and J.-H. Chen, Biosens. Bioelectron., 2018, 118, 1–8 CrossRef CAS PubMed.
- F. Yeasmin Khusbu, X. Zhou, H. Chen, C. Ma and K. Wang, TrAC, Trends Anal. Chem., 2018, 109, 1–18 CrossRef CAS.
- L. Kong, J. Xu, Y. Xu, Y. Xiang, R. Yuan and Y. Chai, Biosens. Bioelectron., 2013, 42, 193–197 CrossRef CAS PubMed.
- H. Li and L. J. Rothberg, J. Am. Chem. Soc., 2004, 126, 10958–10961 CrossRef CAS PubMed.
- J. Liu and Y. Lu, Nat. Protoc., 2006, 1, 246–252 CrossRef CAS PubMed.
- P. Bollella, S. Sharma, A. E. G. Cass, F. Tasca and R. Antiochia, Catalysts, 2019, 9 Search PubMed.
- S. Slavkovic and P. E. Johnson, Aptamers, 2018, 2, 45–51 Search PubMed.
- H. Zipper, H. Brunner, J. Bernhagen and F. Vitzthum, Nucleic Acids Res., 2004, 32, e103 CrossRef PubMed.
- B. Liu and J. Liu, Matter, 2019, 1, 825–847 CrossRef.
- D. E. Huizenga and J. W. Szostak, Biochemistry, 1995, 34, 656–665 CrossRef CAS PubMed.
- J.-W. Park and J. S. Shumaker-Parry, J. Am. Chem. Soc., 2014, 136, 1907–1921 CrossRef CAS PubMed.
- J. Zhou, Y. Li, W. Wang, Z. Lu, H. Han and J. Liu, Langmuir, 2020, 36, 11490–11498 CrossRef CAS PubMed.
- C. Zong, Z. Zhang, B. Liu and J. Liu, Langmuir, 2019, 35, 7304–7311 CrossRef CAS PubMed.
- F. Zhang, P.-J. J. Huang and J. Liu, ACS Sens., 2020, 5, 2885–2893 CrossRef CAS PubMed.
- X. Liu, F. He, F. Zhang, Z. Zhang, Z. Huang and J. Liu, Anal. Chem., 2020, 92, 9370–9378 CrossRef CAS PubMed.
- F. Zhang and J. Liu, Langmuir, 2021, 37, 11939–11947 CrossRef CAS PubMed.
- J. Zhou, Y. Li, W. Wang, Z. Lu, H. Han and J. Liu, Langmuir, 2020, 36, 11490–11498 CrossRef CAS PubMed.
- Y. Hu, Z. Huang, B. Liu and J. Liu, ACS Appl. Nano Mater., 2021, 4, 1377–1384 CrossRef CAS.
- X. Zhang, M. R. Servos and J. Liu, Langmuir, 2012, 28, 3896–3902 CrossRef CAS PubMed.
- Y. Zhao, K. Yavari and J. Liu, TrAC, Trends Anal. Chem., 2022, 146, 116480 CrossRef CAS.
- C. Zong and J. Liu, Anal. Chem., 2019, 91, 10887–10893 CrossRef CAS PubMed.
- Y. Ding, X. Liu, P.-J. J. Huang and J. Liu, Analyst, 2022, 147, 1348–1356 RSC.
- F. Bottari, E. Daems, A.-M. de Vries, P. Van Wielendaele, S. Trashin, R. Blust, F. Sobott, A. Madder, J. C. Martins and K. De Wael, J. Am. Chem. Soc., 2020, 142, 19622–19630 CrossRef CAS PubMed.
- L. Zara, S. Achilli, B. Chovelon, E. Fiore, J.-J. Toulmé, E. Peyrin and C. Ravelet, Anal. Chim. Acta, 2021, 1159, 338382 CrossRef CAS PubMed.
Footnote |
| † Electronic supplementary information (ESI) available: The two tested mutated aptamers CSS.1-mt1 and CSS.1-mt2; the ITC results of titrating 200 μM cortisol into 10 μM 15-1a aptamer; the colloidal stability of AuNPs with different concentrations of NaCl; optimization of the NaCl concentration for the colorimetric assay. See DOI: https://doi.org/10.1039/d2sd00042c |
| This journal is © The Royal Society of Chemistry 2022 |