
 Open Access Article
 This Open Access Article is licensed under a Creative Commons Attribution-Non Commercial 3.0 Unported Licence
Rapid, amplification-free and high-throughput SARS-CoV-2 RNA detection via a reduced-graphene-oxide based fluorescence assay†
Min
Wang
 ,
Yujin
Chu
,
Le
Qiang
,
Yingkuan
Han
,
Yu
Zhang
* and
Lin
Han
*
,
Yujin
Chu
,
Le
Qiang
,
Yingkuan
Han
,
Yu
Zhang
* and
Lin
Han
*
Institute of Marine Science and Technology, Shandong University, Qingdao 266237, China. E-mail: yuzhang@sdu.edu.cn; hanlin@sdu.edu.cn
First published on 12th January 2022
Abstract
The infectious diseases caused by the SARS-CoV-2 virus have been global public health threats and caught worldwide concern. Until now, rapid, low-cost and high-throughput detection of the COVID-19 virus is still a great challenge, especially for undeveloped areas. Here, we report the development of a rapid (<35 minutes), amplification-free, and high throughput fluorescence assay based on reduced graphene oxide nanosheets (rGO) for SARS-CoV-2 RNA detection. The good single and double-strand recognition capability of rGO allows the fluorescence assay to test RNA fragments at the femtomolar level without any RNA amplification process. COVID-19-pseudovirus tests simulated the actual virus detection process and demonstrated the ability to perform rapid detection of SARS-CoV-2 RNA.
Introduction
According to the coronavirus disease (COVID-19) weekly epidemiological update published on 23 November 2021 by WHO, the number of cases reported globally now exceeds 256 million.1 Almost 5.1 million confirmed deaths have been caused by the severe acute respiratory syndrome coronavirus 2 (SARS-CoV-2) virus. In fact, infectious diseases have brought many disasters to human society, such as SARS, Zika, and Ebola.2 Efficient and quick detection is significant to control the epidemic. At present, (Ravi, 2020 #348) nucleic acid and antibodies are the two main detection objectives.3–5 For detection of antibodies, enzyme-linked immunosorbent assay (ELISA), chemiluminescence enzyme immunoassay (CLIA) and lateral flow immunochromatographic assay (LFIA) are efficient but not suitable in early diagnosis.4 Nucleic acid testing is more widely used in infectious disease screening. For detection of nucleic acid, reverse transcription polymerase chain reaction (RT-PCR) and loop-mediated isothermal amplification (LAMP) are the gold standard. Clustered regularly interspaced short palindromic repeat (CRISPR) technology has been also developed for SARS CoV-2 detection showing high sensitivity and specificity. It can be performed in 1 h and can be coupled with lateral flow assays. There is no need for an expensive thermocycler for LAMP and CRISPR.6 Both RT-PCR and LAMP have good sensitivity, and LAMP can realize detection in 30 minutes.7 However, the reaction of amplification or CRISPR is based on enzymes, and the production of enzymes is challenging, which demands a professional and matured production platform. The above mentioned testing methods are relatively complex and expensive. In all, the demand for rapid, high-throughput and inexpensive testing is not yet satisfied.Biosensors might be an alternative to achieve rapid and accurate detection of pathogenic virus. Compared with conventional detection methods, biosensors can provide short response times and ultra-low limits of detection. Biosensors also have the potential to be further miniaturized for point-of-care (POC) devices.8 In fact, biosensors have contributed to disease diagnosis in the last few pandemics that have ravaged the world. A reusable surface plasmon resonance biosensor chip was used for detection of the H1N1 influenza virus.9 A novel electrochemical DNA biosensor was constructed for Ebola virus detection.10 Recently, the development of biosensors for SARS-CoV-2 detection has gained enormous attention.11,12
Nanoscale materials have unique properties that make them especially useful to build biosensors for biomedical diagnostic applications. Various types of 0D, 1D, 2D, and 3D nanostructures have been used to improve biosensor sensitivity, selectivity, limit of detection, and time to results, among other metrics.13 As 2D carbon nanomaterials, graphene and its derivatives have been widely used to detect human viruses, such as Ebola, HCV, H5N1 and Zika.2,9,14–17 Graphene oxide (GO) are typical monolayer graphene derivatives containing oxygenated groups like carbonyl, carboxyl, hydroxyl, and epoxy groups attached to the edges and basal plane. GO has remarkable electronic and physicochemical properties.18–20 The reduced form of GO (rGO) with a high C/O ratio bound more strongly to single strand DNA (ssDNA) and then quenched the fluorescence more effectively than that with a low C/O ratio.21 The reason for the enhanced DNA adsorption by rGO is attributable to the more carbon-rich surface, allowing better π–π stacking with the DNA bases.22,23 Varying the C/O ratio of the GO sheet and controlling the contained functional groups allow GO to be a flexible sensing platform for various biological molecules.24 Taking these advantages, enormous attraction to developing rGO nanomaterial based biosensors has been reported.25 Therefore, the application of rGO-based biosensors in epidemic virus detection is still greatly promising. However, there is still a lack of reports on the use of rGO-based biosensors for the detection of SARS-CoV-2 RNA.
Here, we developed an rGO-based fluorescence assay for rapid, amplification-free and high-throughput detection of SARS-CoV-2 RNA. The rGO nanomaterials were modified in a green method with alkaline and hydrothermal reduction. By optimizing the reaction process between nucleic acids and rGO, the cross-reactivity of hybridization was simplified and the detection time was reduced to less than 15 minutes. The total time for detection with a 96-well plate, including RNA extraction and detection, was approximately 35 minutes. The detection limits for short fragments in buffer and swab solution without any RNA amplification process were 0.684 pM and 1.09 pM, respectively. Finally, 0.15 ng μL−1 (687 copies per nL) COVID-19-pseudovirus RNA was tested to validate the rapid and low-cost performance of the rGO-based fluorescence assay.
Experimental
Materials
Among the SARS-CoV-2-related genomes, three regions were discovered to have conserved sequences: (1) the RdRP gene (RNA-dependent RNA polymerase gene) in the open reading frame ORF1ab region, (2) the E gene (envelope protein gene), and (3) the N gene (nucleocapsid protein gene). Both the RdRP and E genes had high analytical sensitivity for detection.26 Therefore, Cy3-labeled specific DNA probes were designed corresponding to the RdRp (15431–15479) and E gene regions (26269–26324, 26325–26380). In order to verify the detection selectivity of the designed probes, one or two-base mismatch and completely non-complementary RNAs to the RdRp probe were designed. Both DNA probes, target RNAs and non-target RNAs were synthesized by Sangon Biotech Company, Ltd. (Shanghai, China). Their sequences are listed in Table S1.† COVID-19-pseudovirus was bought from Yeasen Biotech Co., Ltd. (Shanghai, China), which contains the ORF1ab sequence, N gene and E gene. Its sequences are also listed in the ESI.† An RNeasy mini kit used to purify RNA was purchased from QIAGEN Co, Ltd. (Shanghai, China). A Qubit 3.0 fluorometer used to quantify extracted dsDNA, oligos and RNA was from Thermo Fisher Scientific Inc. (MA, USA). Tris-EDTA buffer (10 mM Tris, 1 mM EDTA, pH 8.0) purchased from Biosharp was used for dilution of the DNA and RNA solutions. Other solutions were prepared with Milli-Q ultrapure water from a Millipore Milli-Q system.Preparation and characterization of rGO
GO (0.5 mg mL−1, 50–200 nm) was purchased from XF NANO (Nanjing, China). rGO nanosheets were synthesized through reduction of GO. To prepare rGO suspensions, NaOH was added into 10 mL GO (0.5 mg mL−1) to change the pH from approximately 4 to 10. After incubation in a reactor at 100 °C for 6 hours, the mixture was centrifuged (10![[thin space (1/6-em)]](https://www.rsc.org/images/entities/char_2009.gif) 000 rpm, 10 min) and washed with clean water.27 The prepared rGO nanosheets were dispersed in water followed by sonication.
000 rpm, 10 min) and washed with clean water.27 The prepared rGO nanosheets were dispersed in water followed by sonication.
The rGO nanomaterials were characterized by transmission electron microscopy (TEM), ultraviolet-visible (UV-vis) absorbance and Raman spectroscopy. TEM images were obtained using an ultra-high resolution scanning electron microscope HITACHI S-5500 in transmission mode. Raman spectra were obtained using a Renishaw inVia Raman system (Renishaw, UK). UV-vis absorbance and fluorescence measurements were performed on a Spark microplate reader (TECAN, Switzerland). The fluorescence spectra of the samples were measured using a microplate reader. The excitation wavelength was set at 490 nm. The emission wavelength was collected from 530 to 700 nm. All the measurements were taken under the same conditions.
The RNA detection process of the rGO-based fluorescence assays
10 μL target and non-target RNAs at different concentrations (100 fM, 1 pM, 10 pM, 100 pM, 1 nM, 10 nM and 25 nM) were first incubated with 10 μL 30 nM Cy3-labeled probe DNA for 10 minutes at room temperature. Then, 20 μL DNA–RNA duplex was transferred to 76 μL of the aforementioned buffer in a 96-well plate. Finally, 4 μg mL−1 rGO was added into the duplex solution. The fluorescence intensity from the assay was recorded using a microplate reader. In addition, the stability of the assay was assessed by recording the fluorescence variation for 7 days after adding rGO.Simulation of multiple and actual sample testing
To simulate the scenario of simultaneous testing of multiple samples, 48 target RNAs with 4 levels of concentration (0, 1 pM, 100 pM and 10 nM) were tested in throat swab solution. To simulate the actual testing of pharyngeal swab samples with SARS-CoV-2 RNA, COVID-19-pseudovirus was used as an actual virus. Pseudoviruses are recommended as a positive quality control for virus nucleic acid test kits. RNA was extracted from COVID-19-pseudovirus according to the handbook of the RNeasy mini kit. Briefly, a 100 μL pseudovirus sample and 600 μL lysis buffer were mixed and left to stand for 3 minutes. Next, the mixture was washed with 700 μL 70% ethanol. A 700 μL sample was placed into a tube and centrifuged (10000 rpm, 15 seconds). Then, 700 μL buffer RW1 was added to the tube and centrifuged for 15 seconds. After that, 2 cycles of addition of 500 μL buffer RPE solution (100 μL buffer RPE diluted with 400 μL ethanol) and centrifugation were performed (15 seconds and 2 minutes). Finally, the extracted RNA was dissolved in ribonuclease-free (RNase-free) water and quantified using a Qubit 3.0 fluorometer. The integrity of the RNA was examined using 1% formaldehyde denaturing gel electrophoresis. Then, 10 μL extracted RNA was ultrasonicated using a Scientz-IID Ultrasonic homogenizer for use. Pharyngeal swabs from a healthy person and non-complementary RNA were used as the control group to validate the assay.
Results and discussion
SARS-CoV-2 virus RNA detection principle
The detection schematic of the rGO-based fluorescence assay is illustrated in Scheme 1. This reaction system consists of rGO, SARS-CoV-2 RNA fragments and Cy3-labeled probe DNA. Firstly, when the target RNA is loaded into the probe DNA solution, they are easily paired into a DNA–RNA duplex in about 10 minutes. If what loaded is not target RNA, the non-target RNA would not hybridize with DNA probes and a DNA–RNA duplex would not exist. The proposed detection assay utilizes the property of rGO to absorb single strand DNA (ssDNA) and quench the decorated fluorophore fluorescence signals through Förster resonance energy transfer (FRET),28 while desorbing DNA–RNA duplexes and maintaining the fluorescence intensity.21 Then, the appropriate rGO solution of 4 μg mL−1 was added into the detection solution, and the fluorescence of fluorophores labelled on the ssDNA probe is quenched, which results in rapid quenching of fluorophores within about 1 minute. The fluorescence intensity of the RNA–DNA duplex in the presence of rGO correlates with the concentration of target RNA. A higher concentration of RNA contributes to more RNA–DNA duplexes and achieves a stronger fluorescence signal. Therefore, the target RNA concentration-dependent fluorescence signal can be used to build an RNA fluorescence assay for rapid SARS-CoV-2 RNA detection.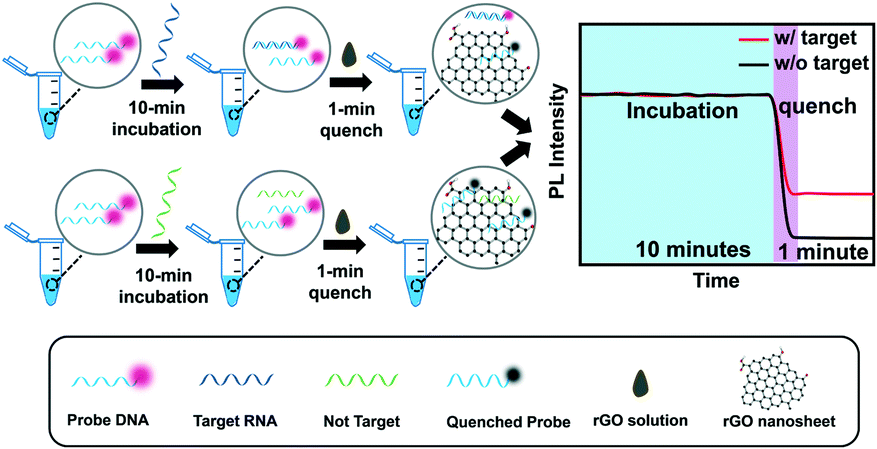 | ||
| Scheme 1 Illustration of the proposed rGO-based fluorescence assay for rapid detection of SARS-CoV-2 RNA. Two steps to detect target RNA: the first step is a 10 minute incubation of probe DNA and target RNA to form a DNA–RNA duplex. The second step is addition of rGO to absorb and quench single strand DNA while preserving DNA–RNA duplexes in about 1 minute. | ||
Characterization of the rGO nanomaterial
The method for modifying rGO was optimized as shown in Fig. 1A. As reported previously, rGO was reduced by a hydrothermal method or reducing agents, such as hydrazine hydrate and NaBH4.29 We used NaOH as a green reagent to reduce GO and form rGO. The content of oxygen-containing functional groups (epoxy, hydroxyl and carboxyl) of rGO was decreased, which has a higher C/O ratio than GO. Its colour also changed from yellowish brown to deep black (Fig. 1B). Therefore, ssDNA segments could be stably adsorbed on the rGO surface through hydrogen bonding and π–π stacking interactions.30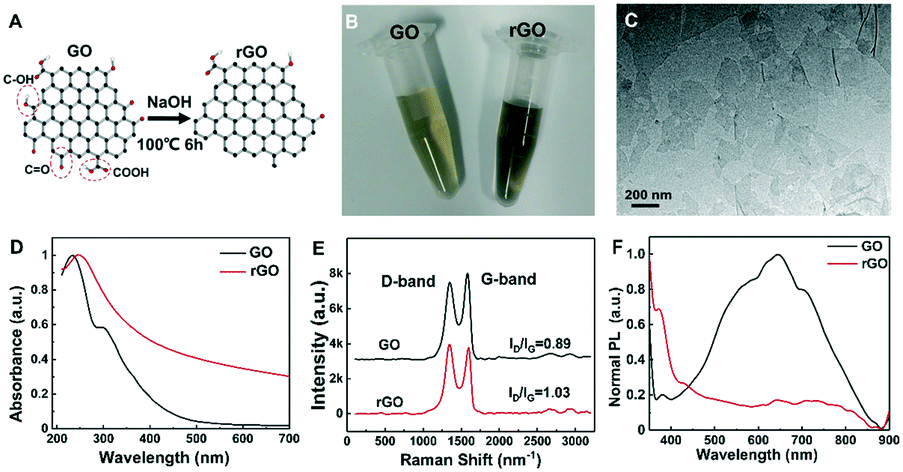 | ||
| Fig. 1 Characterization of rGO and GO. (A) Illustration for the deoxygenation of GO under alkaline and hydrothermal conditions (NaOH, 100 °C, 6 hours). (B) Photo of rGO and GO solutions; (C) TEM image of rGO; (D) UV-vis spectra and (E) Raman spectra of rGO and GO nanosheets; (F) PL spectra of GO and rGO at 310 nm excitation wavelength. | ||
The morphology of rGO nanosheets was investigated by TEM (Fig. 1C), which indicates their size of around 150–200 nm. As the UV-vis absorption spectra showed in Fig. 1D, GO has a peak at ∼230 nm related to π–π* transition of the aromatic C–C bonds and a shoulder at ∼300 nm corresponding to n–π* transition of the C![[double bond, length as m-dash]](https://www.rsc.org/images/entities/char_e001.gif) O bonds, while the shoulder of rGO almost disappeared, indicating the reduction of oxygen content. Meanwhile, reduction treatment of GO resulted in a shift of absorption peak from 234 nm to 245 nm, which is consistent with a reported study for rGO with less functional groups (epoxy, hydroxyl and carboxyl).31 The Raman spectra in Fig. 1E confirm the lower content of oxygen-containing groups in rGO than in GO. The intensity ratio of the D-band to G-band (ID/IG) reflects the rise of the C/O ratio, indicating the successful synthesis of rGO. In Fig. 1F, the results showed that the photoluminescence spectrum of GO exhibits a peak emission maximum at around 600 nm, while that of rGO is found to be strongly blue-shifted. The fluorescence of rGO in buffer was also weaker than that of GO. The evidence suggested that the modified rGO was more suitable to construct a fluorescence assay for nucleic acid detection.
O bonds, while the shoulder of rGO almost disappeared, indicating the reduction of oxygen content. Meanwhile, reduction treatment of GO resulted in a shift of absorption peak from 234 nm to 245 nm, which is consistent with a reported study for rGO with less functional groups (epoxy, hydroxyl and carboxyl).31 The Raman spectra in Fig. 1E confirm the lower content of oxygen-containing groups in rGO than in GO. The intensity ratio of the D-band to G-band (ID/IG) reflects the rise of the C/O ratio, indicating the successful synthesis of rGO. In Fig. 1F, the results showed that the photoluminescence spectrum of GO exhibits a peak emission maximum at around 600 nm, while that of rGO is found to be strongly blue-shifted. The fluorescence of rGO in buffer was also weaker than that of GO. The evidence suggested that the modified rGO was more suitable to construct a fluorescence assay for nucleic acid detection.
Verification of the detection mechanism
To achieve the best detection performance of the rGO-based fluorescence assay, two kinetic studies were carried out (Fig. 2A), respectively. Strategy 1 started with the addition of rGO to quench the Cy3-labeled ssDNA probe and then followed by the addition of the target to form a DNA–RNA duplex. Strategy 2 started with the addition of target RNA to form a DNA–RNA duplex first, followed by the addition of rGO to quench ssDNA and preserve the fluorescence of the DNA–RNA duplex. The rGO concentration used in the two strategies was 10 μg mL−1. The DNA and RNA concentrations were all 50 nM. With strategy 1, after adding rGO into the DNA solution, the fluorescence was quenched in 1 minute. Then, the fluorescence signal increased slowly after the loading of target RNA into the solution. The time for recovery was about 20 minutes (Fig. 2B). This may be related to the strong single chain nucleic acid adsorption ability of rGO, which prevents the formation of double chains, resulting in a slow target RNA–DNA complex formation and detachment process from the rGO surface. Meanwhile, with strategy 2, the hybridization time for the target RNA and probe DNA to form an RNA–DNA complex is 10 minutes. Once the rGO solution was added, the fluorescence intensity rapidly decreased and reached equilibrium in 1 minute thanks to the strong adsorption of rGO for single chains and the weak adsorption for double chains. The total detection process only took ∼11 minutes (Fig. 2B).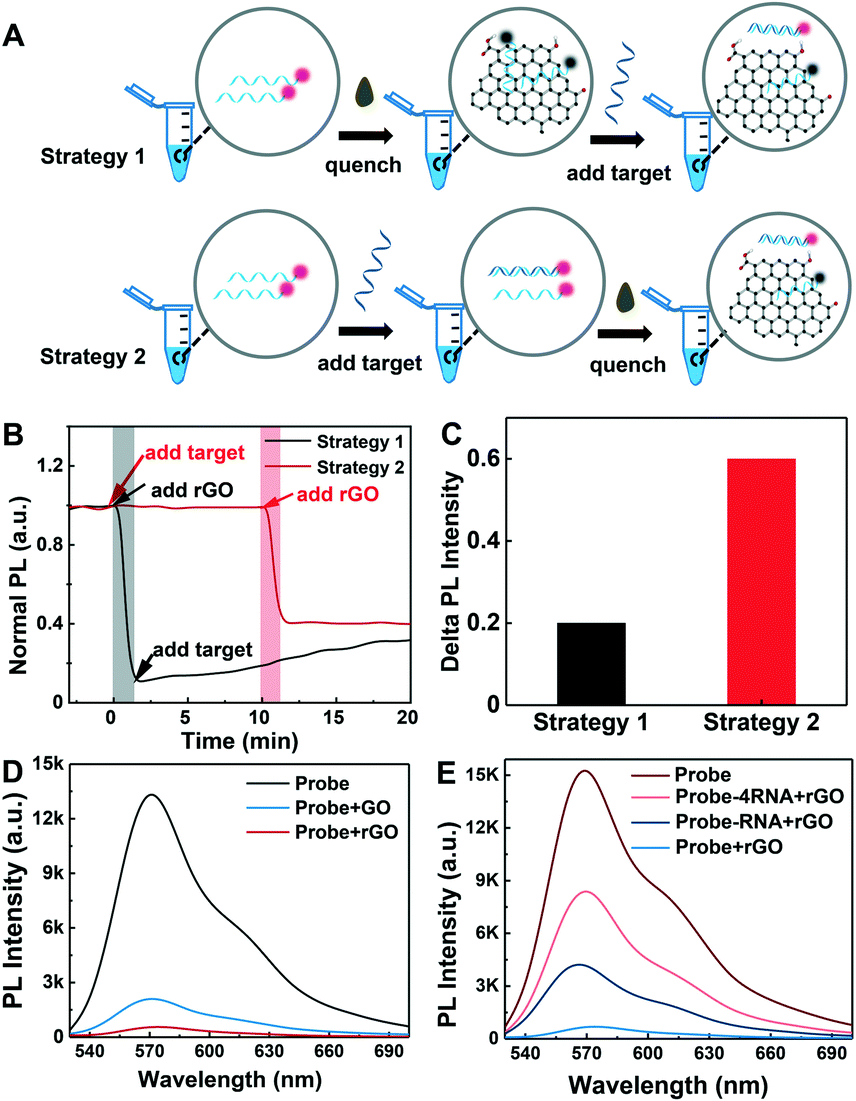 | ||
| Fig. 2 Concept proof of the rGO-based fluorescence assay. (A) Illustration of the two RNA detection strategies; (B) the detection results of the two detection strategies; (C) the normalized fluorescence intensity for the two detection strategies; (D) fluorescence emission spectra of 50 nM DNA probe in buffer, 10 μg mL−1 GO and 10 μg mL−1 rGO. (E) Fluorescence emission spectra of 50 nM DNA probe in buffer with 50 nM DNA and 200 nM RNA, in 10 μg mL−1 rGO with 50 nM DNA and 50 nM RNA, in 10 μg mL−1 rGO with 50 nM DNA, and in 10 μg mL−1 GO. | ||
More importantly, strategy 2 is not only faster than strategy 1 for obtaining a stable signal, but also has a larger signal difference. The normalized fluorescence signal intensity of strategy 2 is almost 3 times that of strategy 1 (Fig. 2C). Therefore, the optimized detection approach (strategy 2) not only simplifies the detection process with one-step absorption of extra DNA probe, but also improves the detection performance of the assay (Table S2†). To compare the ability of GO and rGO to reduce background, the fluorescence of the probe DNA in the presence of GO and rGO was measured. 10 μg mL−1 GO and rGO was added into 50 nM probe DNA, respectively. Then, the fluorescence intensity of the samples was detected immediately. Fig. 2D shows that rGO displays a more effective fluorescence quenching ability than GO because rGO can adsorb DNA more tightly than GO since it possesses a lower surface negative charge and more aromatic regions for π–π stacking with DNA bases.32
To preliminarily validate the qualitative and quantitative testing ability of the fluorescence assay, the fluorescence of DNA probes in the absence and presence of an equal amount of target and excess target was tested. 50 nM probe DNA was incubated with target RNA of 50 nM and 200 nM for 10 minutes at room temperature. Then, the fluorescence intensity of the samples was recorded after an rGO solution of 10 μg mL−1 was added. Fig. 2E shows that all RNA & DNA hybridization products in the rGO solution present a higher fluorescence intensity than DNA in rGO. But only some of the DNA–RNA duplexes contribute to signal generation. When 4 times the target RNA was mixed with the probe DNA, the signal is lower than that of the original solution without rGO. As is well known, the reactions between nucleic acid chains and rGO are complicated, which include hybridization, displacement, adsorption and desorption.33,34 The total efficiency is low, and only ∼15% of the DNA–RNA duplexes contribute to signal generation.35 The possible reasons include incomplete hybridization of RNA–DNA and possible absorption of target RNA and DNA–RNA duplexes on rGO, which may be improved through rGO surface blocking.36
Detection parameter optimization of the rGO-based fluorescence assay
To obtain high detection performance of the rGO-based fluorescence assay for SARS-CoV-2 RNA, several parameters were optimized, including the probe DNA concentration, rGO concentration and incubation time. The concentrations of the probe and rGO determine the target detection range and detection limit of the rGO-based fluorescence assay, respectively. When rGO was added to 50 nM Cy3-labeled ssDNA, the fluorescence decreased with the increment of rGO concentration and achieved its minimum value when rGO was about 10 μg mL−1. Quenching efficiency is defined as (FLprobe − FLp-rGO)/FLprobe,37 where FLprobe is the fluorescence intensity of 50 nM probe DNA in buffer, while FLp-rGO is the fluorescence intensity of 50 nM probe DNA in rGO. Actually, (FLprobe − FLp-rGO) is the quenched fluorescence intensity by rGO. As shown in Fig. 3A, the quenching efficiency of rGO reached the maximum when rGO was about 10 μg mL−1. rGO presented a higher quenching efficiency and lower background than GO.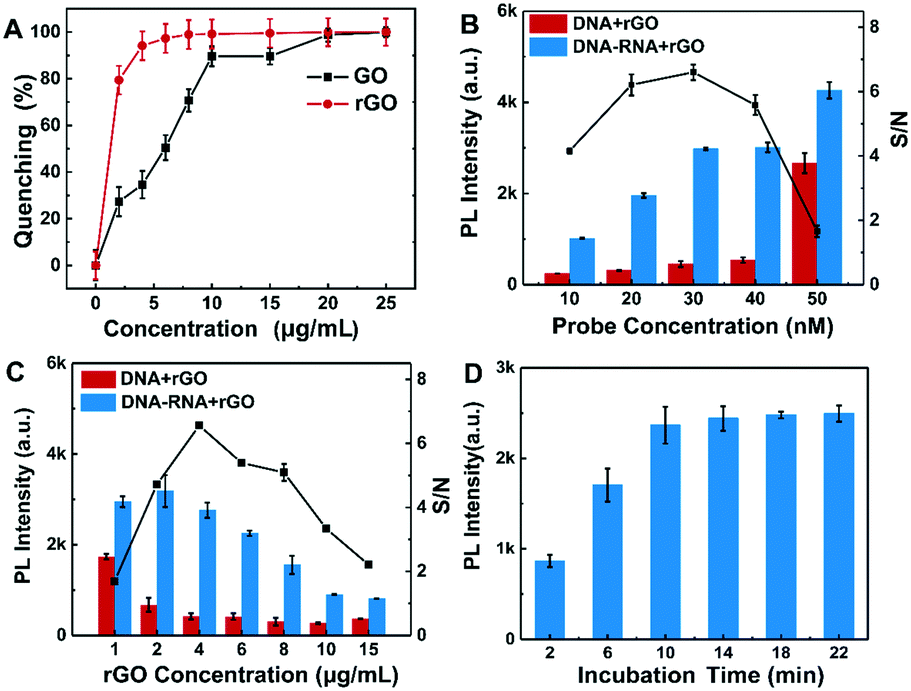 | ||
| Fig. 3 Detection parameter optimization of the rGO-based fluorescence assay. (A) Quenching efficiency of GO and rGO with different concentrations toward 50 nM fluorophore-labeled DNA; (B) fluorescence intensity and S/N of 10 to 50 nM DNA with 30 nM target RNA in the presence of 10 μg mL−1 rGO. (C) Fluorescence intensity and S/N of 30 nM DNA in the presence of rGO with different concentrations. (D) Fluorescence signal of 30 nM DNA probe and 30 nM target RNA mixture with different incubation times with added 4 μg mL−1 rGO. | ||
It is also indicated that rGO was more efficient and faster to quench the fluorophore than the equivalent GO, which was consistent with a previous report.22 Then, 10 μg mL−1 of rGO was chosen to determine the probe DNA concentration. The concentration of probe DNA was varied from 10 nM to 50 nM with a target RNA concentration of 30 nM. Their fluorescence intensity and signal-to-noise ratio (S/N) are described in Fig. 3B. A concentration of 30 nM DNA presented the maximum S/N ratio. As a result, 30 nM DNA was chosen to determine the best concentrations of rGO for the rGO-based fluorescence assay. As shown in Fig. 3C, it is shown that higher rGO concentration was beneficial to improving the S/N ratio in the range of 1 to 4 μg mL−1. When excess rGO was added, it possibly partially blocked the fluorescence signal collected by the detection equipment. On the other hand, dense rGO may bind some of the target RNA preventing the reaction between probe DNA and target RNA and a small amount of duplex, reducing the fluorescence intensity. Therefore, the optimal concentration of rGO was 4 μg mL−1 to conduct the following detection. Different incubation times in the range from 2 to 22 minutes were applied to investigate the DNA–RNA duplex reaction efficiency. The results in Fig. 3D indicated that the fluorescence signal of DNA–RNA duplex was not saturated within 10 minutes but 10 minutes was sufficient for DNA–RNA binding at room temperature. Therefore, 10 minutes is selected as the incubation time for the SARS-CoV-2 RNA detection.
Sensitivity and specificity of the rGO-based fluorescence assay for SARS-CoV-2 RNA detection
The sensitivity and specificity of the rGO-based fluorescence assay were examined as shown in Fig. 4. The fluorescence spectra in the presence of different concentrations of target RNA show that the fluorescence signal increased as the SARS-CoV-2 RNA concentrations increased from 1 pM to 25 nM (Fig. 4A). Moreover, the concentration of SARS-CoV-2 RNA and the corresponding fluorescence intensity presented a linear relationship in the range of 1 pM and 25 nM, as presented in Fig. 4B. Based on the detected data, the regression equation Y = 357 × lgc + 5093 (R2 = 0.995) was obtained, where Y represents the fluorescence intensity at 570 nm and lgc represents the logarithm of the target concentration. The limit of detection (LOD) can be defined as LOD = 3Sa/b, where Sa is the standard deviation of the response and b is the slope of the calibration curve.38 On the basis of a 3-fold signal to noise ratio, the LOD was calculated to be 0.684 pM.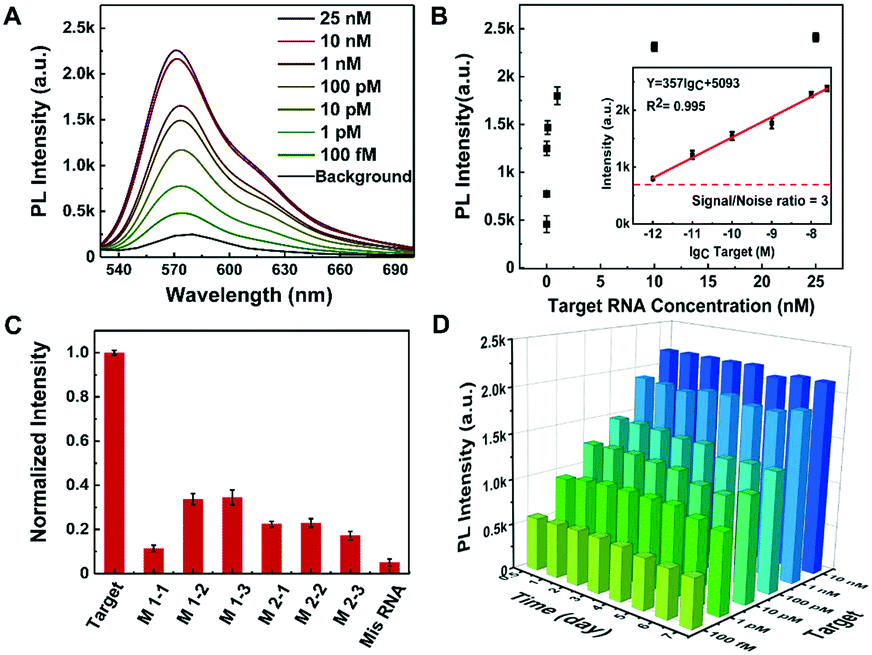 | ||
| Fig. 4 Sensitivity and specificity of the rGO-based fluorescence assay. (A) Fluorescence emission spectra of SARS-CoV-2 RNA with different concentrations in DNA (30 nM) and rGO (4 μg mL−1) solution; the data shown in the figures represent the average of three independent experiments (n = 3). (B) The relationship between the SARS-CoV-2 RNA concentration and detected fluorescence intensity in the rGO-based fluorescence assay. (C) The detection selectivity of the rGO-based fluorescence assay by comparison with 100 pM complementary RNA, single-base mismatched RNA (M1-1, M1-2, M1-3) and double-base mismatched RNA (M2-1, M2-2, M2-3) detection. (D) The detection stability of the rGO-based fluorescence assay; histogram of the change of fluorescence intensities of the different concentration SARS-CoV-2 RNA detection for 7 days. | ||
For the selectivity of the rGO-based fluorescence assay as shown in Fig. 4C, the fluorescence signal of the SARS-CoV-2 RNA was much higher than those of single-base mismatched, two-base mismatched, and totally mismatched RNA (at the same concentration of 100 pM). The low signal of ‘M1-1’ may be associated with the location of the mismatched base. The results indicated that the rGO-based fluorescence assay has the ability to distinguish complementary sequences from the mismatched ones, which offered the opportunity to analyse SARS-CoV-2 RNA in complex fluids. In addition, the stability of the rGO-based fluorescence assay was examined for 7 days. As shown in Fig. 4D, samples in a 96-well microplate were preserved at 4 °C and continually tested. The fluorescence intensity was maintained at a similar level for 7 days with a relative standard deviation (RSD) of 5.6%, which is calculated through the equation: 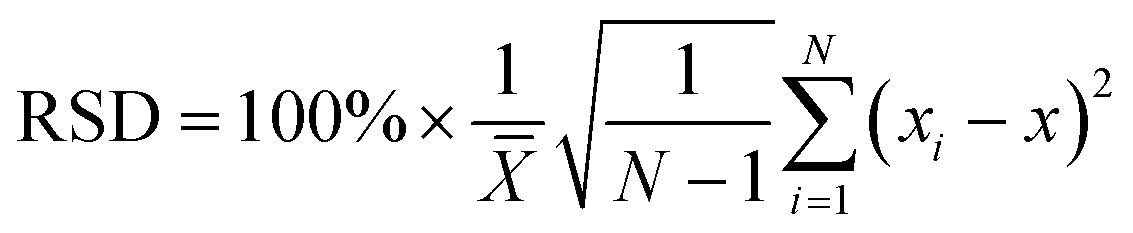 .39,40 The results indicated the stable binding between DNA and rGO, and the possible function of rGO to protect dsDNA from enzymatic digestion.41 In all, the rGO-based fluorescence assay has an equivalent or better performance in epidemic SARS-CoV-2 RNA detection, taking into account time, cost, detection sensitivity and stability.2,10,37,42
In addition, we summarized and compared some important detection methods and performances for SARS-CoV-2 RNA (Tables S3 and S4†). The developed rGO-based fluorescence assay exhibits a rapid detection time (<15 minutes) with a comparable detection limit (0.684 pM), which could be helpful in current COVID-19 pandemic diagnosis.
Simultaneous tests of multiple samples
To verify the accuracy of simultaneous tests toward multiple samples in statistics, the designed short SARS-CoV-2 RNA was suspended in healthy throat swab solution and made into 48 samples with 3 levels of concentrations. They were tested to simulate the practical scenarios of application. The symbols ‘control’, ‘min’, ‘mid’ and ‘max’ were used to represent the SARS-CoV-2 RNA concentrations of 0, 1 pM, 100 pM and 10 nM respectively. The detected results were recorded and analyzed as shown in Fig. 5A. The samples with the same concentration have similar fluorescence signal intensity with a RSD of less than 6.1%. Different concentrations present distinguishable signal intensities from each other and the control samples. Fig. 5A indicates the consistency and selectivity of the rGO-based fluorescence assay for SARS-CoV-2 RNA detection. As shown in the boxplot with scatter in Fig. 5B, the signal intensities of the control and test groups were at distinctly different levels. Based on one-way analysis of variance (ANOVA), it was confirmed that the difference of the control group and test group was statistically significant, with a p-value lower than 0.0001. The linear relationship of the 3 levels of concentrations is shown in Fig. 5C. The regression equation Y = 351 × lgC + 5014 (R2 = 0.993) was obtained and the LOD was calculated to be 1.09 pM. Differences from previous results may be due to the different ion concentrations between PBS and throat swab solutions. These statistical results indicated that the developed rGO-based fluorescence assay is promising to detect a large number of samples simultaneously and reliably.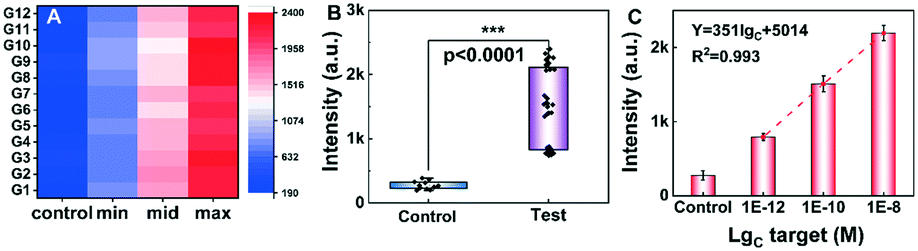 | ||
| Fig. 5 Results of multiple sample test with a 96-well plate. (A) Heat map of test results. The control group represented the RNA mismatched with probe DNA. The test group contained 3 concentration levels of target RNA: ‘min’, ‘mid’ and ‘max’. (B) Comparison of detected signals of the control and test groups. Note: *** indicates “significant” (p < 0.0001). (C) Linear relationship between the fluorescence intensity and the 3 levels of concentrations. | ||
Analysis of RNA extracted from COVID-19-pseudovirus
To evaluate the practical detection performance of the rGO-based fluorescence assay, the long RNA extracted from COVID-19-pseudovirus was analyzed in throat swab solution. The COVID-19-pseudovirus is a recombinant pseudotyped lentiviral particle containing spike proteins and genes but without infectivity, and is used for RNA extraction and virus detection quality control. Probe E1 and probe E2 designed according to a specific fragment of the E gene were used as detection probes. The detection parameters were as previously stated: 30 nM probe, 4 μg mL−1 rGO and 10 μL target in 100 μL buffer. The COVID-19-pseudovirus RNA is extracted and detected as presented in Fig. 6A. The RNA concentration extracted from the COVID-19-pseudovirus control materials is ∼5.7 ng μL−1, which is measured using a Qubit 3.0 Fluorometer. Then, it was diluted to 0.15 ng μL−1 as target RNA. Mis-RNA was tested as a comparison control. The corresponding copy number concentration of the RdRp fragment was 687 copies per nL, which was calculated according to the following formula: copies per μL = 6.02 × 10²³ × concentration (g μL−1)/(fragment length × 340).38 The detection time of COVID-19-pseudovirus RNA samples is about 35 minutes including the RNA extraction time of 25 minutes. Among these, 5 minutes is used for virus lysis, 15 minutes is for RNA purification and another 15 minutes is for SARS-CoV-2 RNA detection. As shown in Fig. 6B, the fluorescence intensity of COVID-19-pseudovirus RNA was 2-fold higher than that of the mismatched RNA sample, and was 3-fold higher than that of the background (DNA without RNA sample in rGO solution). The stability was also investigated for 7 days as shown in Fig. 6C. The samples were tested once a day. The S/N derived from the detected fluorescence intensity also presents negligible variation for 7 days with a RSD of 3.8%, which is consistent with the aforementioned results in short RNA solution. The COVID-19-pseudovirus long RNA detection proved the capability for practical SARS-CoV-2 RNA detection of the rGO-based fluorescence assay.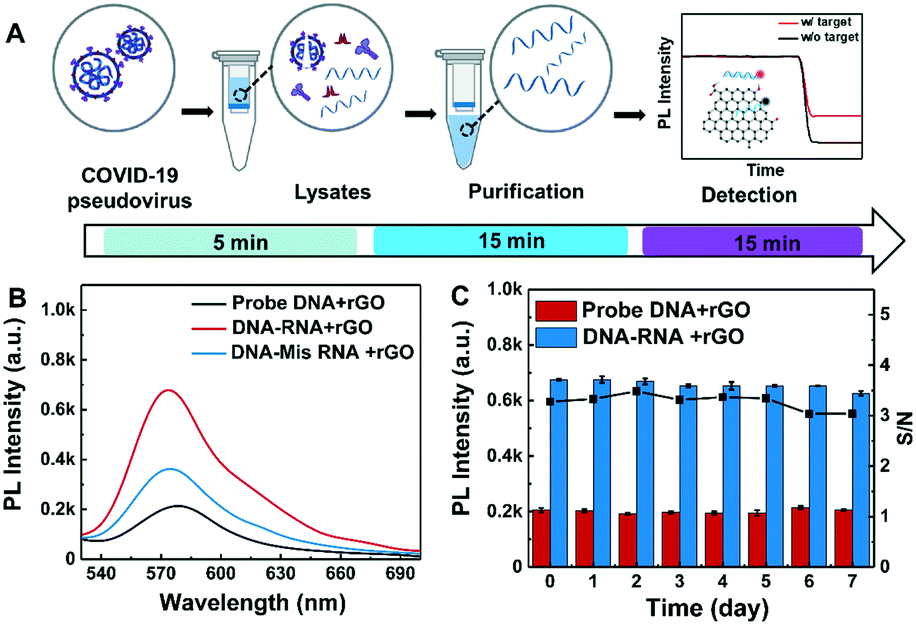 | ||
| Fig. 6 The detection process and results of the COVID-19-pseudovirus RNA by the rGO-based fluorescence assay. (A) The schematic diagram of the extraction and detection processes of COVID-19-pseudovirus RNA. (B) Detected fluorescence spectra of COVID-19-pseudovirus RNA, Mis-RNA and probe without RNA. (C) Stability for 7 days for the test and control groups. The RSD of S/N was 3.8%. Note: the error bars are from three individual repeated tests. | ||
Advantages and limitations of the rGO-based fluorescence assay for SARS-CoV-2 RNA detection
In the past two years, researchers have developed numerous biosensors for the analysis and detection of the current still spreading SARS-CoV-2 virus pandemic.43,44 The main concern is improving selectivity, sensitivity, speed, and throughput and enabling in situ detection.45 In this work, we developed a rGO-based fluorescence assay for rapid, amplification-free and high-throughput SARS-CoV-2 RNA detection. The major advantages of our work include: (1) retrofitting of biocompatible GO materials with mass production,46 which results in a high signal-to-noise ratio but low detection cost. (2) Rapid SARS-CoV-2 RNA detection within 35 minutes by taking advantage of the strong and quick interaction between nucleic acids and rGO nanosheets. (3) Simple but high-throughput detection of long SARS-CoV-2 RNA using a 96-well plate and microplate reader. In the future, the development of portable devices integrated with microfluidic chips will enable rapid testing, such as rapid point-of-care testing in railway stations, airports and remote areas.Though there are observed advantages as described above for the developed rGO-based fluorescence assay, some performances of the biosensor still need to be improved and estimated in the future. First, the sensitivity of the rGO-based fluorescence assay needs to be improved. Currently, the LOD of the rGO-based fluorescence assay is only 0.684 pM in the best case scenario. The rGO-based fluorescence test may lead to false negatives considering patients with early and mild infection. We believe that the sensitivity of the developed rGO-based fluorescence assay could be improved through isothermal nucleic acid amplification47 or multiple DNA probes.48 Secondly, we used COVID-19-pseudovirus as positive control for RNA extraction and virus detection. Real SARS-CoV-2 RNA detection hasn't been processed by the rGO-based fluorescence assay. Currently, it is not qualified to test real SARS-CoV-2 samples in our lab. This may be done through collaboration with a qualified lab or hospital. Thirdly, the time for rGO and DNA–RNA duplex interaction was decreased to about 1 minute by improving the strategy, but 10 minutes were needed for DNA and RNA binding, and 20 minutes were needed for RNA extraction. There are still many steps to save time in the total process. Perhaps this can be achieved by simplified extraction, faster incubation and quicker reads.
Conclusions
An rGO-based fluorescence assay for rapid, amplification-free and high-throughput detection of SARS-CoV-2 RNA was developed. The assay can be easily constructed based on modified rGO and optimized detection parameters. rGO with selective adsorption capacity toward ssDNA and RNA–DNA duplexes helped reduce background. The total detection process takes less than 35 minutes, including RNA extraction and rapid detection. The LOD of short RNA fragments in buffer and in swab solution was 0.684 pM and 1.09 pM respectively. The SARS-CoV-2 RNA detection availability was validated by detecting 687 copies per nL COVID-19-pseudovirus RNA. The proposed method presents the advantages of rapid response, simple procedure and low-cost reagents. It is promising in rapid diagnosis of SARS-CoV-2 and other infectious diseases.Author contributions
Min Wang: investigation, characterization, and writing – original draft preparation. Yingkuan Han: characterization. Yujin Chu: investigation. Le Qiang: investigation. Yu Zhang: methodology, conceptualization, review & editing, and supervision. Lin Han: project administration and writing – review & editing.Conflicts of interest
There are no conflicts to declare.Acknowledgements
This work was supported by the National Key R&D Plan of China (Grant No. 2017YFB0405400), the Fundamental Research Funds of Shandong University (2020QNQT001), the Natural Science Foundation for Distinguished Young Scientist of Shandong Province (Grant No. JQ201814), and the Collaborative Innovation Center of Technology and Equipment for Biological Diagnosis and Therapy in Universities of Shandong. We would like to thank Xiaoju Li from the State Key Laboratory of Microbial Technology, Shandong University for the assistance in TEM.Notes and references
- Coronavirus disease (covid-19) weekly epidemiological update, https://www.who.int/emergencies/diseases/novel-coronavirus-2019/situation-reports, 2021.
- E. Vermisoglou, D. Panáček, K. Jayaramulu, M. Pykal, I. Frébort, M. Kolář, M. Hajdúch, R. Zbořil and M. Otyepka, Biosens. Bioelectron., 2020, 166, 112436 CrossRef CAS PubMed.
- M. Xu, D. Wang, H. Wang, X. Zhang, T. Liang, J. Dai, M. Li, J. Zhang, K. Zhang, D. Xu and X. Yu, Clin. Transl. Med., 2020, 10, e158 CAS.
- P. Pokhrel, C. Hu and H. Mao, ACS Sens., 2020, 5, 2283–2296 CrossRef CAS PubMed.
- T. Ji, Z. Liu, G. Wang, X. Guo, S. Akbar Khan, C. Lai, H. Chen, S. Huang, S. Xia, B. Chen, H. Jia, Y. Chen and Q. Zhou, Biosens. Bioelectron., 2020, 166, 112455 CrossRef CAS PubMed.
- J. P. Broughton, X. Deng, G. Yu, C. L. Fasching, V. Servellita, J. Singh, X. Miao, J. A. Streithorst, A. Granados, A. Sotomayor-Gonzalez, K. Zorn, A. Gopez, E. Hsu, W. Gu, S. Miller, C.-Y. Pan, H. Guevara, D. A. Wadford, J. S. Chen and C. Y. Chiu, Nat. Biotechnol., 2020, 38, 870–874 CrossRef CAS PubMed.
- W. Yang, X. Dang, Q. Wang, M. Xu, Q. Zhao, Y. Zhou, H. Zhao, L. Wang, Y. Xu, J. Wang, S. Han, M. Wang, F. Pei and Y. Wan, medRxiv, 2020, DOI:10.1101/2020.03.02.20030130.
- Z. Hao, Y. Pan, W. Shao, Q. Lin and X. Zhao, Biosens. Bioelectron., 2019, 134, 16–23 CrossRef CAS PubMed.
- H. Yoo, J. Shin, J. Sim, H. Cho and S. Hong, Biosens. Bioelectron., 2020, 168, 112561 CrossRef CAS PubMed.
- H. Ilkhani and S. Farhad, Anal. Biochem., 2018, 557, 151–155 CrossRef CAS PubMed.
- E. Morales-Narvaez and C. Dincer, Biosens. Bioelectron., 2020, 163, 112274 CrossRef CAS PubMed.
- V. V. Tran, N. H. T. Tran, H. S. Hwang and M. Chang, Biosens. Bioelectron., 2021, 182, 113192 CrossRef CAS PubMed.
- E. C. Welch, J. M. Powell, T. B. Clevinger, A. E. Fairman and A. Shukla, Adv. Funct. Mater., 2021, 31, 2104126 CrossRef CAS.
- C. Chan, J. Shi, Y. Fan and M. Yang, Sens. Actuators, B, 2017, 251, 927–933 CrossRef CAS.
- J. Wen, W. Li, J. Li, B. Tao, Y. Xu, H. Li, A. Lu and S. Sun, Sens. Actuators, B, 2016, 227, 655–659 CrossRef CAS.
- W. Zhang, S. Li, X. Li, M. Liu, T. Cui, H. Fu, M. Yang, W. Zhong, B. Xu and W. Yue, Microchim. Acta, 2020, 187, 408 CrossRef CAS PubMed.
- J. Fan, L. Yuan, Q. Liu, C. Tong, W. Wang, F. Xiao, B. Liu and X. Liu, Analyst, 2019, 144, 3972–3979 RSC.
- H. Huang, H. Shi, P. Das, J. Qin, Y. Li, X. Wang, F. Su, P. Wen, S. Li, P. Lu, F. Liu, Y. Li, Y. Zhang, Y. Wang, Z.-S. Wu and H.-M. Cheng, Adv. Funct. Mater., 2020, 30, 1909035 CrossRef CAS.
- S. Song, J. Wu, Y. Cheng, L. Ma, T. Liu, J. Liu, J. Liu, J. Sotor and P. Luan, Appl. Mater. Today, 2021, 23, 101028 CrossRef.
- P. P. Brisebois and M. Siaj, J. Mater. Chem. C, 2020, 8, 1517–1547 RSC.
- S. S. Sekhon, P. Kaur, Y.-H. Kim and S. S. Sekhon, npj 2D Mater. Appl., 2021, 5, 21 CrossRef CAS.
- Y. H. Wang, H. H. Deng, Y. H. Liu, X. Q. Shi, A. L. Liu, H. P. Peng, G. L. Hong and W. Chen, Biosens. Bioelectron., 2016, 80, 140–145 CrossRef CAS PubMed.
- C. Lu, P.-J. J. Huang, B. Liu, Y. Ying and J. Liu, Langmuir, 2016, 32, 10776–10783 CrossRef CAS PubMed.
- Z. Zhao, H. Yang, W. Zhao, S. Deng, K. Zhang, R. Deng, Q. He, H. Gao and J. Li, J. Mater. Chem. B, 2020, 8, 3623–3630 RSC.
- T. Seifi and A. Reza Kamali, Med. Drug Discovery, 2021, 11, 100099 CrossRef CAS PubMed.
- B. Udugama, P. Kadhiresan, H. N. Kozlowski, A. Malekjahani, M. Osborne, V. Y. C. Li, H. Chen, S. Mubareka, J. B. Gubbay and W. C. W. Chan, ACS Nano, 2020, 14, 3822–3835 CrossRef CAS PubMed.
- M. Ahmadi and F. Ahour, Anal. Methods, 2020, 12, 4541–4550 RSC.
- H. Chang, L. Tang, Y. Wang, J. Jiang and J. Li, Anal. Chem., 2010, 82, 2341–2346 CrossRef CAS PubMed.
- L. G. Guex, B. Sacchi, K. F. Peuvot, R. L. Andersson, A. M. Pourrahimi, V. Strom, S. Farris and R. T. Olsson, Nanoscale, 2017, 9, 9562–9571 RSC.
- B. Liu, Y. Zhao, Y. Jia and J. Liu, J. Am. Chem. Soc., 2020, 142, 14702–14709 CrossRef CAS PubMed.
- B. Lesiak, G. Trykowski, J. Tóth, S. Biniak, L. Kövér, N. Rangam, L. Stobinski and A. Malolepszy, J. Mater. Sci., 2021, 56, 3738–3754 CrossRef CAS.
- J. Xiao, Z. Liu, C. Li, J. Wang, H. Huang, Q. Yi, K. Deng and X. Li, Anal. Bioanal. Chem., 2021, 413, 3847–3859 CrossRef CAS PubMed.
- A. Lopez and J. Liu, Advanced Intelligent Systems, 2020, 2, 2000123 CrossRef.
- P. M. Neema, A. M. Tomy and J. Cyriac, TrAC, Trends Anal. Chem., 2020, 124, 115797 CrossRef CAS.
- B. Liu, Z. Sun, X. Zhang and J. Liu, Anal. Chem., 2013, 85, 7987–7993 CrossRef CAS PubMed.
- B. Liu, P.-J. J. Huang, E. Y. Kelly and J. Liu, Biotechnol. J., 2016, 11, 780–787 CrossRef CAS PubMed.
- L. Qiang, Y. Zhang, C. Wu, Y. Han, S. Wang, Y. Wang, C. Zhang, G. Liu, Q. Wu, H. Liu, I. R. Jenkinson, J. Sun and L. Han, Mar. Biotechnol., 2020, 22, 498–510 CrossRef CAS PubMed.
- J. Li, D. Wu, Y. Yu, T. Li, K. Li, M.-M. Xiao, Y. Li, Z.-Y. Zhang and G.-J. Zhang, Biosens. Bioelectron., 2021, 183, 113206 CrossRef CAS PubMed.
- Y. Chu, Y. Gao, W. Tang, L. Qiang, Y. Han, J. Gao, Y. Zhang, H. Liu and L. Han, Anal. Chem., 2021, 93, 5129–5136 CrossRef CAS PubMed.
- C. Wang, C. Wang, J. Qiu, J. Gao, H. Liu, Y. Zhang and L. Han, Microchim. Acta, 2021, 188, 262 CrossRef CAS PubMed.
- H. Lei, L. Mi, X. Zhou, J. Chen, J. Hu, S. Guo and Y. Zhang, Nanoscale, 2011, 3, 3888–3892 RSC.
- S. Zhang, K. Wang, K. B. Li, W. Shi, W. P. Jia, X. Chen, T. Sun and D. M. Han, Biosens. Bioelectron., 2017, 91, 374–379 CrossRef CAS PubMed.
- M. L. Everitt, A. Tillery, M. G. David, N. Singh, A. Borison and I. M. White, Anal. Chim. Acta, 2021, 1146, 184–199 CrossRef CAS PubMed.
- L. C. Brazaca, P. L. dos Santos, P. R. de Oliveira, D. P. Rocha, J. S. Stefano, C. Kalinke, R. A. Abarza Muñoz, J. A. Bonacin, B. C. Janegitz and E. Carrilho, Anal. Chim. Acta, 2021, 1159, 338384 CrossRef CAS PubMed.
- C. H. Woo, S. Jang, G. Shin, G. Y. Jung and J. W. Lee, Nat. Biomed. Eng., 2020, 4, 1168–1179 CrossRef CAS PubMed.
- G. Reina, D. Iglesias, P. Samorì and A. Bianco, Adv. Mater., 2021, 33, 2007847 CrossRef CAS PubMed.
- Y. Zhao, F. Chen, Q. Li, L. Wang and C. Fan, Chem. Rev., 2015, 115, 12491–12545 CrossRef CAS PubMed.
- Y. Gao, Y. Han, C. Wang, L. Qiang, J. Gao, Y. Wang, H. Liu, L. Han and Y. Zhang, Anal. Chim. Acta, 2021, 1154, 338330 CrossRef CAS PubMed.
Footnote |
| † Electronic supplementary information (ESI) available. See DOI: 10.1039/d1sd00064k |
| This journal is © The Royal Society of Chemistry 2022 |